on board refreshment trends - irrci · the impact of shareholder activism on board refreshment...
TRANSCRIPT

The Impact of
Shareholder Activism on Board Refreshment Trends
at S&P 1500 Firms
--- Andrew Borek
Zachary Friesner Patrick McGurn
August 2017

The Impact of Shareholder Activism on Board Refreshment Trends at S&P 1500 Firms
July 2017 | Page 2 of 50
The analysis, opinions and perspectives herein are the sole responsibility of the authors. The copyright for this report is held by the IRRC Institute. The material in this report may be reproduced and distributed without advanced permission, but only if attributed. If reproduced substantially or entirely, it should include all copyright and trademark notices. © Copyright 2017, Investor Responsibility Research Center Institute (IRRCi) For more information, please contact: Jon Lukomnik, Executive Director Investor Responsibility Research Center Institute (IRRCi) T: (+1) 646-‐512-‐5807 [email protected] www.irrcinstitute.org About IRRCi The Investor Responsibility Research Center Institute is a not-‐for-‐profit organization headquartered in New York, NY, that provides thought leadership at the intersection of corporate responsibility and the informational needs of investors. More information is available at www.irrcinstitute.org About ISS Founded in 1985 as Institutional Shareholder Services Inc., ISS is the world’s leading provider of corporate governance and responsible investment solutions for asset owners, asset managers, hedge funds, and asset service providers. ISS’ solutions include: objective governance research and recommendations; SRI data, analytics, and research; end-‐to-‐end proxy voting and distribution solutions; turnkey securities class-‐action claims management (provided by Securities Class Action Services, LLC); and reliable global governance data and modeling tools. Clients rely on ISS' expertise to help them make informed corporate governance decisions. For more information, please visit www.issgovernance.com Andrew Borek Senior Associate, M&A and Contested Elections Zachary Friesner Associate, U.S. Research – Financial Services Sector Patrick McGurn Special Counsel and Head of Strategic Research ISS would like to thank the following individuals for their support and contributions: Cristiano Guerra, Mohamed Abdi and Kiko Sanchez.

The Impact of Shareholder Activism on Board Refreshment Trends at S&P 1500 Firms
July 2017 | Page 3 of 50

The Impact of Shareholder Activism on Board Refreshment Trends at S&P 1500 Firms
July 2017 | Page 4 of 50
Contents
INTRODUCTION .............................................................................................................................. 5
METHODOLOGY ............................................................................................................................. 6
KEY FINDINGS ................................................................................................................................. 8
Part I: Individual Director Demographics ......................................................................................... 8
Part II: Board Profile10 .................................................................................................................. 10
PART I: INDIVIDUAL DIRECTOR DEMOGRAPHICS ........................................................................... 13
Nominator ...................................................................................................................................... 13
Market Cap Index ........................................................................................................................... 13
Average Age ................................................................................................................................... 14
Gender ........................................................................................................................................... 17
Race/Ethnicity ................................................................................................................................ 20
Independence ................................................................................................................................ 22
Outside Board Experience ............................................................................................................. 26
Occupations ................................................................................................................................... 28
PART II: BOARD PROFILE TRENDS ................................................................................................. 33
Director Age ................................................................................................................................... 33
Board Tenure ................................................................................................................................. 35
Board Size ...................................................................................................................................... 36
Independence ................................................................................................................................ 39
Female Directors ............................................................................................................................ 41
Minority Directors .......................................................................................................................... 43
Outside Boards .............................................................................................................................. 45
Financial Expert Representation .................................................................................................... 47
The Impact of Shareholder Activism on Board Refreshment Trends at S&P 1500 Firms
July 2017 | Page 5 of 50
Introduction
Few business-‐related topics provoke more passionate discussions than shareholder activism at specific companies. Supporters view activists as agents of change who push complacent corporate directors and entrenched managers to unlock stranded shareholder value. Detractors charge that these aggressive investors force their way into boardrooms, bully incumbent directors into adopting short-‐term strategies at the expense of long-‐term shareholders, and then exit with big profits in hand.
Lost in this heated long-‐ versus short-‐term debate is the significant, real-‐time impact that such activism has on corporate board membership and demographics. ISS identified a recent surge in its evaluation of refreshment trends at S&P 1500 firms between 2008 and 2016 (see Board Refreshment Trends at S&P 1500 Firms, published by IRRCi in January 2017). This accelerated boardroom turnover coincided with an increase in activists’ success in securing board representation, particularly via negotiated settlements. A recent study of shareholder activism by Activist Insights pegged activists’ annual U.S. boardroom gains at more than 200 seats in 2015 and 2016. While a significant portion of this activism was aimed at micro-‐cap firms, threats of fights have become commonplace even at S&P 500 companies in recent years.
Despite activists’ recent boardroom gains, little attention has been paid to the influence of activism on broader board refreshment trends. Anecdotal media coverage, often fanned by anti-‐activist communications strategies, still tends to myopically focus on two long-‐standing dissident nominee stereotypes: the still-‐wet-‐behind-‐the-‐ears, 20-‐ or 30-‐something-‐year-‐old hedge fund analyst, and the older, male, over-‐boarded crony of the fund manager.
These long-‐standing stereotypes appear to be outdated as activism has entered an era in which most dissident nominees have attenuated ties to their hedge fund patrons. The experience, qualifications, attributes, and skills of dissident nominees can appear indistinguishable from those of the incumbent directors whom they seek to supplant. Nominees' backgrounds and experiences can become even more interchangeable with those of incumbent directors when the latter transfuse their own ranks with new blood during, or in anticipation of, an activist campaign. This heightened competition can leave shareholders with a bounty of fresh-‐faced, highly-‐qualified, independent candidates on both nominee slates. Highlighting this narrowing divide, dissidents' "hand-‐picked" nominees have been known to reject their sponsors’ wishes and strategic plans (witness Elliott Management's first tranche of candidates at Arconic, who were seated via a settlement, opposing the hedge fund's second attempt to gain board seats). Similarly, nominees selected by incumbent directors to face off against dissident candidates sometimes end up endorsing the very shifts in strategic direction that they were recruited to fend off (witness the DuPont board’s “victory” over Nelson Peltz’s Trian Partners, followed by board-‐recruited director-‐turned CEO Ed Breen's advocacy of a Peltzian-‐style breakup of the company).

The Impact of Shareholder Activism on Board Refreshment Trends at S&P 1500 Firms
July 2017 | Page 6 of 50
To close this board refreshment information gap, IRRCi asked ISS to explore the broader impact of activism by focusing on nominees—regardless of the entity that backed them—and the impact of dissident campaigns on boards.
Methodology
This study examines the impact of public shareholder activism on board refreshment at S&P 1500 companies targeted by activists from 2011 to 2015. Public shareholder activism refers to any shareholder activism that (1) occurred between Jan. 1, 2011 and Dec. 31, 2015, and (2) was publicly disclosed. The study period concludes in 2015 so that data for a full calendar year following activist campaigns could be analyzed. Data was captured as of the shareholder meeting dates.
› Part I examines individual dissident nominees on ballots (whether they ultimately joined the board or not) in proxy contests, directors appointed via settlements with activist shareholders, and directors appointed unilaterally by boards in connection with shareholder activism.
› Part II examines changes to board profiles made in connection with public shareholder activism.
Data was captured for all S&P 1500 directors with less than one year of tenure at meetings scheduled to be held between Jan. 1, 2011 and Dec. 31, 2015. The directors were then assigned to one of four classifications:
1. All dissident nominees on ballots in proxy contests; 2. Directors appointed or nominated by incumbent boards through publicly-‐disclosed
settlements with activist shareholders; 3. Directors appointed or nominated unilaterally by incumbent boards in connection with
public shareholder activism; and 4. Directors appointed or nominated prior to and not in connection with public shareholder
activism.
If a definitive proxy contest was settled, directors added to the board as a result of the settlement were assigned to classification two.
Data for directors assigned to classification four was excluded, as it did not relate to the impact of public shareholder activism on board refreshment during the study period.
In Part II, board profile changes were assessed through a comparison of target boards in the year prior to shareholder activism and target boards in the year following shareholder activism. For example, there was shareholder activism at J. C. Penney in connection with the company's 2011 annual

The Impact of Shareholder Activism on Board Refreshment Trends at S&P 1500 Firms
July 2017 | Page 7 of 50
meeting. The measure of change was therefore based on a comparison of the board profiles at the company's 2010 and 2012 annual meetings. In cases where there were two or more consecutive years of shareholder activism, board profile changes were assessed through a comparison of target boards in the year prior to the first year of shareholder activism and target boards in the year following the final consecutive year of shareholder activism. For example, there was shareholder activism at Juniper Networks in both 2014 and 2015. The measure of change was therefore based on a comparison of the board profiles at the company's 2013 and 2016 annual meetings.
Part II examines year-‐over-‐year trends. In these cases, study companies with two or more consecutive years of shareholder activism were excluded. Study companies were grouped by market-‐cap segments, i.e. S&P 500 (large-‐cap), S&P 400 (mid-‐cap), and S&P 600 (small-‐cap). Study companies that changed indexes over the course of the study were excluded from segment-‐level comparisons.
In Part II, references to changes in average director age and average director tenure at study companies (excluding those discussed in isolation) refer to averages of average company-‐level data. Company-‐level data provided average age and tenure for each specific company. For references to average age and tenure at study companies, these data points were calculated by averaging the company-‐level (rather than director-‐level) data points.

The Impact of Shareholder Activism on Board Refreshment Trends at S&P 1500 Firms
July 2017 | Page 8 of 50
Key Findings
Part I: Individual Director Demographics
Snapshot: Public shareholder activism generally leads to younger, more independent, but less diverse, board candidates who had previous boardroom experience and relevant professional pedigrees. Typically activists favor nominees with financial experience and incumbent boards favor nominees with executive experience.

The Impact of Shareholder Activism on Board Refreshment Trends at S&P 1500 Firms
July 2017 | Page 9 of 50
› Activism drives down director ages. Dissident nominees and directors appointed via settlements (hereinafter Dissident Directors) were younger, on average, than directors appointed unilaterally by boards (hereinafter Board Appointees) in connection with shareholder activism. Study Directors (the combination of Dissident Directors and Board Appointees), regardless of who recruited them, were generally younger than their counterparts across the broader S&P 1500 index. While Dissident Directors generally reflected a wider range of ages, insurgent investors and incumbent boards both favored individuals in their fifties when picking candidates. This preference for nominees in their fifties aligns with practices in the broader S&P 1500 index over the same period.
› Activism does not promote gender diversity. Less than ten percent of Study Directors were women. While the rate at which females were selected as dissident nominees or Board Appointees in contested situations increased over the course of the study, it trailed the rising tide of female board representation in the broader S&P 1500 universe. There were zero female Dissident Directors in 2011, two in 2012, and three in 2013. Similarly, there were two female Board Appointees in 2011, but zero in both 2012 and 2013.
› Activism does not promote racial/ethnic diversity. Less than five percent of Study Directors were ethnically or racially diverse. While minority representation across the entire S&P 1500 board universe slowly increased over the course of the study, from 9.3 percent in 2011 to 10.1 percent in 2015, the rate at which individuals with diverse ethnic and racial backgrounds were selected as Dissident Directors and Board Appointees was relatively uniform and trailed that of the broader index by more than five percentage points.
› Activism boosts boardroom independence. Study Directors were generally more independent than their counterparts across the broader S&P 1500. Not surprisingly, dissident nominees and directors appointed to boards via settlements were more likely to be “independent” than directors appointed unilaterally by boards in connection with shareholder activism. It is worth pointing out that the measure of "independence" focused on a nominee's degree of separation from management rather than from the dissident. Indeed, as the examination of prior boardroom experience suggests, there may be questions of independence from activist sponsors for a subset of Study Directors.
› Prior boardroom experience is not required. Boardroom experience does not appear to be a prerequisite for contest candidates. More than half of Study Directors held outside board seats. While most of these directors sat on either one or two outside boards, a sizable minority pushed the over-‐boarded envelope. Six Study Directors served on four outside boards, four on five outside boards, and one on six outside boards. Many of these "busy" directors appear to be "go-‐to" nominees for individual activists. The serial nomination of favorite candidates raises questions about the "independence" of these individuals from their activist sponsors.

The Impact of Shareholder Activism on Board Refreshment Trends at S&P 1500 Firms
July 2017 | Page 10 of 50
› Investment professionals and sitting executives dominate the candidate pool for contested elections. Occupational data for the Study Directors demonstrates experience, qualifications, attributes, and skills (EQAS) preferences for nominees in contested situations. “Corporate executives” and “financial services professionals” were in a dead heat at the front of the pack. These favored occupations were not evenly distributed, as activists tended to select investors and incumbents tended to select executives. In fact, Dissident Directors were nearly three times more likely to be “financial services professionals” than Board Appointees, while Board Appointees were nearly twice as likely to be “executives” than Dissident Directors.
Part II: Board Profile
Snapshot: Public shareholder activism generally resulted in boards that are younger, shorter-‐tenured, slightly-‐larger, more independent, and more financially literate, but less diverse, than their pre-‐activism versions.
The Impact of Shareholder Activism on Board Refreshment Trends at S&P 1500 Firms
July 2017 | Page 11 of 50
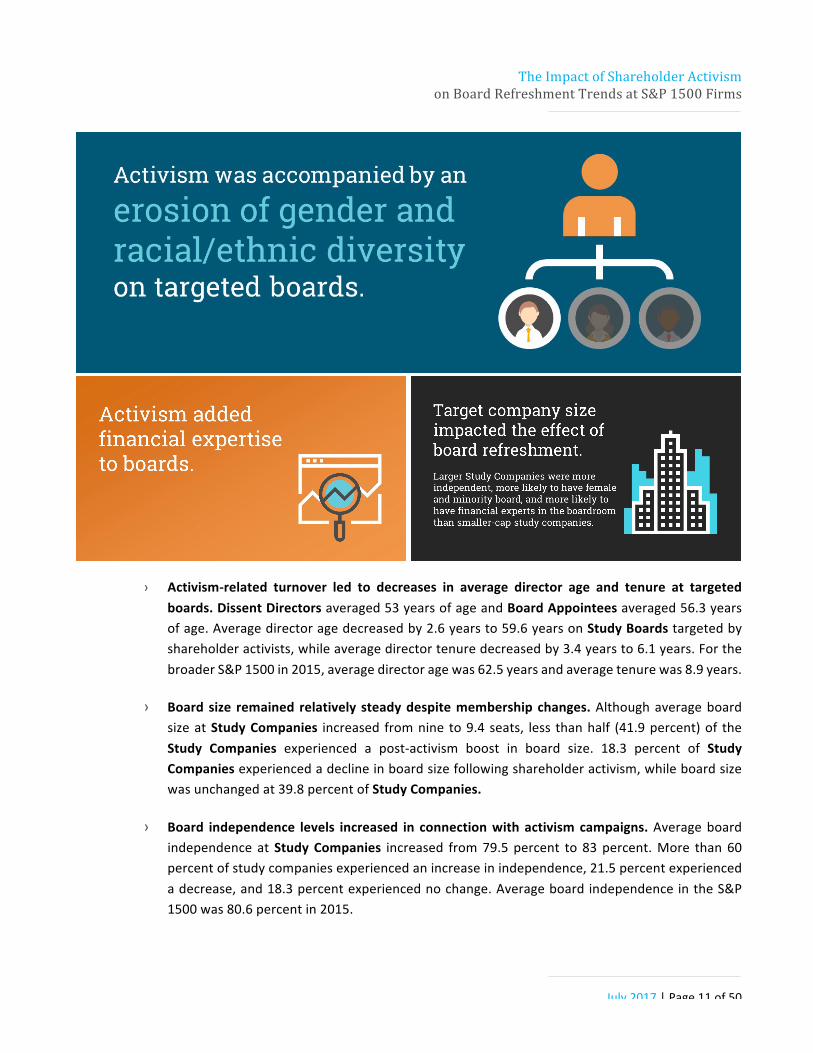
› Activism-‐related turnover led to decreases in average director age and tenure at targeted boards. Dissent Directors averaged 53 years of age and Board Appointees averaged 56.3 years of age. Average director age decreased by 2.6 years to 59.6 years on Study Boards targeted by shareholder activists, while average director tenure decreased by 3.4 years to 6.1 years. For the broader S&P 1500 in 2015, average director age was 62.5 years and average tenure was 8.9 years.
› Board size remained relatively steady despite membership changes. Although average board size at Study Companies increased from nine to 9.4 seats, less than half (41.9 percent) of the Study Companies experienced a post-‐activism boost in board size. 18.3 percent of Study Companies experienced a decline in board size following shareholder activism, while board size was unchanged at 39.8 percent of Study Companies.
› Board independence levels increased in connection with activism campaigns. Average board independence at Study Companies increased from 79.5 percent to 83 percent. More than 60 percent of study companies experienced an increase in independence, 21.5 percent experienced a decrease, and 18.3 percent experienced no change. Average board independence in the S&P 1500 was 80.6 percent in 2015.

The Impact of Shareholder Activism on Board Refreshment Trends at S&P 1500 Firms
July 2017 | Page 12 of 50
› Other boardroom service was generally unchanged by activism-‐fueled refreshment. The average number of outside boards on which Study Company directors served remained virtually flat, increasing from 0.8 to 0.9. Of the 89 Study Companies, the number without a director who sat on more than one outside board decreased from four to two. There was a correlation between company size and outside board service, as directors at S&P 500 and S&P 400 study companies sat on a higher average number of outside boards than their counterparts at S&P 600 study companies.
› Activism was accompanied by an erosion of gender and racial/ethnic diversity on targeted boards. Study Company boards were less likely to have at least one female director following an activism campaign than they were preceding one, decreasing from 87.1 percent to 82.8 percent. Similarly, Study Company boards were less likely to have at least one minority director following an activism campaign than they were preceding one, decreasing from 55.9 percent to 51.6 percent. According to Board Refreshment Trends at S&P 1500 Firms, the proportion of S&P 1500 companies with at least one female director increased from 72 percent in 2011 to 82.7 percent in 2015 and the portion of S&P 1500 companies with at least one minority board member increased through the course of the study period to 56.8 percent.
› Activism added financial expertise to boards. The proportion of board seats at Study Companies occupied by "financial experts" increased from 22.6 percent (189 of 835) to 24.5 percent (214 of 874). The number of Study Companies with at least one, two, or three "financial experts" also increased. (At U.S. companies, ISS considers a director to be a "financial expert" if the board discloses that the individual qualifies as an "Audit Committee Financial Expert" as defined by the Securities and Exchange Commission under Items 401(h)(2) and 401(h)(3) of Regulation S-‐K. Under the SEC's rules, a person must have acquired their financial expertise through (1) education and experience as a principal financial officer (PFO), principal accounting officer (PAO), controller, public accountant or auditor or experience in one or more positions that involve the performance of similar functions, (2) experience actively supervising a PFO, a PAO, controller, public accountant, auditor or person performing similar functions; (3) experience overseeing or assessing the performance of companies or public accountants with respect to the preparation, auditing or evaluation of financial statements or (4) other relevant experience.)
› Target company size impacted the effect of board refreshment. Larger Study Companies were more independent, more likely to have female and minority board members (both pre-‐ and post-‐activism), and more likely to have financial experts in the boardroom than smaller-‐cap study companies. Relative to their larger peers, smaller Study Companies generally experienced more pronounced declines in average director age and tenure, but experienced more significant increases in average board size.

The Impact of Shareholder Activism on Board Refreshment Trends at S&P 1500 Firms
July 2017 | Page 13 of 50
Part I: Individual Director Demographics
Nominator
The lion’s shares (70 percent) of the 380 Study Directors were placed on ballots by dissident investors or appointed to boards by dissidents via settlements (hereinafter "Dissident Directors"). In contrast, directors added to boards by the incumbent directors at activist-‐targeted boards (hereinafter "Board Appointees") account for 30 percent of the Study Directors.
Figure 1: Breakdown of All Study Directors (380)
Market Cap Index
Study Directors are distributed fairly evenly across the S&P 1500. Perhaps reflecting the downstream focus of activism, small-‐cap S&P 600 firms account for a larger slice (47 percent) of the activism-‐related directorship pie relative to their 40 percent share of the entire S&P 1500 firm universe.
Dissident Directors70%
Board Appointees30%

The Impact of Shareholder Activism on Board Refreshment Trends at S&P 1500 Firms
July 2017 | Page 14 of 50
Figure 2: Study Directors by Market Cap Index
Average Age
The average age of all Study Directors was 54.1 years, below the average age (62.5 years) for all S&P 1500 directors in 2015, according to Board Refreshment Trends at S&P 1500 Firms.
The typical Dissident Director was younger than the typical Study Director. The average age of the dissident directors in the S&P 1500 over the study period was 53 years. Individuals added to boards in response to activist threats were three years older, on average, than the insurgents’ nominees. The average age of the Board Appointees, who were appointed unilaterally by incumbent directors in connection with shareholder activism, was 56.6 years.
With a few notable exceptions, Study Directors ranged in age from 30 years old to 77 years old.
› The youngest Study Director was Ryan J. Morris, founder of Meson Capital Partners. Morris was 28 years old when nominated by dissident Mario Gabelli’s GAMCO at the 2013 Telephone and Data Systems annual meeting and 29 years old when nominated by GAMCO at the 2014 Superior Industries, Inc. annual meeting. Morris was not elected to the boards at either meeting.
S&P 50028%
S&P 40025%
S&P 60047%
Dissident Directors53 years
Board Appointees56.6 years
All Study Directors 54.1
years

The Impact of Shareholder Activism on Board Refreshment Trends at S&P 1500 Firms
July 2017 | Page 15 of 50
› The oldest study director was Charles N. Mathewson, who was 84 when nominated by Ader Investment Management at the 2013 International Game Technology annual meeting. Mathewson was not elected at the meeting.
The Morris and Mathewson nominations reflect a general willingness on the part of activists to select director nominees from a broader age range compared to candidates tapped by boards in response to threats. Notably, large blocks of Dissident Directors were clustered at the boundaries of the age range: 37 were in their thirties when nominated and 11 in their seventies. By contrast, only one Board Appointee was in his thirties when added to the board; just three were in their seventies.
Notwithstanding these outliers, both activists and incumbent boards were most likely to select directors in their fifties, followed by directors in their sixties and forties.
› Activists selected nominees in their fifties in 32.7 percent of cases, in their sixties in 27.1 percent of cases, and in their forties in 21.1 percent of cases.
› Incumbent boards picked directors in their fifties in 44.7 percent of cases, in their sixties in 34.2 percent of cases, and in their forties in 17.5 percent of cases.
Exhibit 1: Percentage of Directors by Age Bracket
Although average director age was lower when activist shareholders contributed to the nominees’ selection, there was also a correlation with company size. Study Directors at larger-‐cap companies tended to be older than their counterparts at smaller-‐cap companies.
0.75%
13.91%
21.05%
32.71%
27.07%
4.14%0.38%
0.00% 0.88%
17.54%
44.74%
34.21%
2.63%0.00%
0.53%
10.00%
20.00%
36.32%
29.21%
3.68%0.26%
0.00%
10.00%
20.00%
30.00%
40.00%
50.00%
20s 30s 40s 50s 60s 70s 80s
Age
Dissident Directors Board Appointees All

The Impact of Shareholder Activism on Board Refreshment Trends at S&P 1500 Firms
July 2017 | Page 16 of 50
› The average age of Study Directors was 55.7 years at large-‐cap S&P 500 firms, 54.4 years at middle market S&P 400 companies, and 53 years at small-‐cap S&P 600 entities.
› The average age of Dissident Directors was 54.9 years for the S&P 500, 53.2 years for the S&P 400, and 52.2 years for S&P 600.
› The average age of Board Appointees was 56.7 years for the S&P 500, 57.3 years for the S&P 400, and 55.9 years for the S&P 600.
Exhibit 2: Average Director Age by Sub-‐Index
As discussed in Board Refreshment Trends at S&P 1500 Firms, the average age of all S&P 1500 directors increased by one year from 61.5 years in 2011 to 62.5 years in 2015. Interestingly, average director ages for Study Directors, Dissident Directors, and Board Appointees followed a similar trajectory over the same 2011-‐to-‐2015 timeframe, albeit at a slightly lower altitude. Although the average age of Study Directors increased at a faster rate than that of the S&P 1500, it remained significantly below that of the index average.
› The average age of Dissident Directors increased 8.1 percent from 49.6 years in 2011 to 53.6 years in 2015.
› The average age of Board Appointees increased 5.5 percent from 55 years in 2011 to 58 years in 2015.
› The average age of all Study Directors increased 5.4 percent from 51.9 years in 2011 to 54.7 years in 2015.
53.2
57.3
54.4
54.9
56.7
55.7
52.2
55.9
53
49 50 51 52 53 54 55 56 57 58
Dissident Directors
Board Appointees
All
Age (Years)
S&P 600 S&P 500 S&P 400

The Impact of Shareholder Activism on Board Refreshment Trends at S&P 1500 Firms
July 2017 | Page 17 of 50
Exhibit 3: Average Director Age by Year
Gender
Women accounted for just 32 of the 380 Study Directors (8.4 percent), the majority of whom were selected at towards the more recent end of the study period.
There were zero female Dissident Directors in 2011, two in 2012, and three in 2013. Similarly, there were two female Board Appointees in 2011, but zero in both 2012 and 2013.
Nominee demographics shifted in 2014 and 2015.
› There were nine female Dissident Directors and four female Board Appointees in 2014, representing 14.3 percent of 2014 Study Directors.
› There were seven female Dissident Directors and five female Board Appointees in 2015, representing 13 percent of 2015 Study Directors.
Although female participation in activist situations increased in the latter two years of the study period, it still lagged the broader S&P 1500, which experienced a slow but steady increase in the proportion of directorships held by women over the same period. According to Board Refreshment Trends at S&P 1500 Firms, the proportion of S&P 1500 board seats held by women increased from 12.9 percent in 2011 to 16.5 percent in 2015. Moreover, women held 24.5 percent of new S&P 1500 directorships in 2015, an increase from 17.1 percent of new directorships in 2011.
49.6
53.3 53.6 53.6 53.6
5557
56.2 56.858
51.9
54.5 54.4 54.4 54.7
61.5 61.8 62.1 62.3 62.5
4547495153555759616365
2011 2012 2013 2014 2015
Age (Years)
Dissident Directors Board Appointees All Study Directors S&P 1500

The Impact of Shareholder Activism on Board Refreshment Trends at S&P 1500 Firms
July 2017 | Page 18 of 50
Exhibit 4: Number of Female Directors by Year
Exhibit 5: Percentage of Directors Who Were Female
There were 21 female Dissident Directors selected over the course of the study, but they were not evenly distributed among the dissident groups. Three shareholders—Starboard Value LP, Engaged Capital, and the Clinton Group—were the only activist funds to select female nominees in more than one contested situation. In total, these three firms selected 16 of the 21 (76.2 percent) female dissident directors. Cynthia T. Jamison, who was a Starboard nominees at Darden and the Starboard settlement director at Office Depot, was the only female study director selected more than once.
2 3
97
2
4
5
0
2
4
6
8
10
12
14
2011 2012 2013 2014 2015
Numbe
r of Fem
ale Directors
Dissident Directors Board Appointees
0.0%
4.2%6.5%
13.2%
10.0%8.0%
0.0% 0.0%
17.4%
22.7%
3.4% 2.8%4.5%
14.3%13.0%
0.00%
5.00%
10.00%
15.00%
20.00%
25.00%
2011 2012 2013 2014 2015
Dissident Directors Board Appointees All

The Impact of Shareholder Activism on Board Refreshment Trends at S&P 1500 Firms
July 2017 | Page 19 of 50
› Starboard nominated four females to the Darden Restaurants board in 2014, all of whom were elected to the board, and secured board seats through settlements for one female at Office Depot in 2013, one female at Insperity in 2015, and one female at LSB Industries in 2015.
› The Clinton Group successfully nominated one female to the Stillwater Mining board in 2013 and secured board seats through settlements for one female at JAKKS Pacific in 2012 and one female at Digital Generation in 2013.
› Engaged secured board seats through settlements for four females at Abercrombie & Fitch in 2014 and for two females at Medifast in 2015.
Race/ethnicity information was available for 30 of the 32 female Study Directors, 29 of whom were Caucasian and one of whom was African American. Linda R. Gooden, the lone female minority Study Director, was appointed unilaterally by the General Motors board in connection with shareholder activism in 2015.
The average age of female Study Directors was 55.7 years, slightly above the average for all Study Directors of 54.1 years. Average female director age was lower when activist shareholders contributed to their selection. The average age of female Dissident Directors was 55 years, while the average age of female Board Appointees was 57.1 years.
Exhibit 6: Average Age of Female Directors by Category
54.1
55.7
57.1
55
52 53 54 55 56 57 58
All Study Directors
All Female Study Directors
Female Board Appointees
Female Dissident Directors
Age (Years)

The Impact of Shareholder Activism on Board Refreshment Trends at S&P 1500 Firms
July 2017 | Page 20 of 50
Race/Ethnicity
Race/ethnicity information was available for 351 of the 380 Study Directors, 335 of whom were Caucasian (95.4 percent) and 16 of whom (4.6 percent) were classified as ethnic or racial minority group members. Five of the minority Study Directors were African American, two were Asian, three were Hispanic/Latin American, two were Indian, and four were Middle Eastern. Study Directors selected by both activist shareholders and boards acting unilaterally were also present in all five study years.
Ten of the minority Study Directors were Dissident Directors and six were Board Appointees.
The distribution of minority Study Directors across the study period and across the S&P 1500 sub-‐indexes was relatively uniform. There were four minority directors in 2011, three in 2012, two in 2013, three in 2014, and four in 2015. There were five minority Study Directors at S&P 500 firms, five at S&P 400 companies, and six at S&P 600 companies.
Six activist shareholders selected all ten minority dissident directors. Two activist shareholders, Starboard Value and Icahn Group, were the only to select minorities in more than one contested situation.
› Starboard successfully nominated one African American nominee to the Darden Restaurants board in 2014 and secured a board seat through a settlement for one Indian at Staples in 2015.
› Icahn Group nominated Jose Maria Alapont, a Hispanic/Latin American, to the Mentor Graphics board in 2011 and to the OshKosh board in 2012. Alapont was elected at Mentor Graphics but not at OshKosh.
Sardar Biglari was an unsuccessful dissident nominee at Cracker Barrel Old Country Store in 2011, 2012, and 2013. Alapont and Biglari were the only minority study directors to be selected more than once. As such, there were seven unique minority dissident directors.

The Impact of Shareholder Activism on Board Refreshment Trends at S&P 1500 Firms
July 2017 | Page 21 of 50
Exhibit 7: Race/Ethnicity Distribution of Directors
Minority participation in activist situations trailed the broader S&P 1500, which experienced a slow but steady increase in the proportion of directorships held by minorities over the study period. According to Board Refreshment Trends at S&P 1500 Firms, the proportion of S&P 1500 board seats held by minorities increased from 9.3 percent in 2011 to 10.1 percent in 2015. Moreover, minorities held 12.6 percent of new S&P 1500 directorships in 2015.
The average age of minority directors was 53.1 years, slightly below the average for all Study Directors of 54.1 years. Although the average age of minority study directors was below that of Study Directors in general, minority directors also were most likely to be in their sixties, while Study Directors in general were most likely to be in their fifties.
Three minority directors were in their thirties, three were in their forties, three were in their fifties, and seven were in their sixties. Average minority director age was lower when activist shareholders contributed to their selection. The average age of minority Dissident Directors was 51.5 years, while the average age of minority Board Appointees was 55.8 years. As discussed in the Gender section, above, Linda R. Gooden was the sole female minority study director. Gooden, an African American, was appointed unilaterally by the General Motors board in connection with shareholder activism in 2015.
335, 88%
2, 0%
5, 1% 3, 1%2, 1% 4, 1% 29, 8%
Caucasian (88.2%)Asian (0.5%)Black/African American (1.3%)Hispanic/Latin American (0.8%)Indian (0.5%)Middle-‐Eastern (1.1%)Unavailable (7.6%)

The Impact of Shareholder Activism on Board Refreshment Trends at S&P 1500 Firms
July 2017 | Page 22 of 50
Exhibit 8: Distribution of Minority Directors by Age
Exhibit 9: Average Age of Minority Directors by Category
Independence
Not surprisingly, independence from the target company was a common attribute for the Study Directors. Independence trends among Study Directors outpaced the broader S&P 1500 universe. ISS classified 352 (92.6 percent) of the Study Directors as independent outsiders, of which 253 were
0.0%
18.8% 18.8% 18.8%
43.8%
0.0% 0.0%0.5%
10.0%
20.0%
36.3%
29.2%
3.7% 0.3%
0.00%5.00%10.00%15.00%20.00%25.00%30.00%35.00%40.00%45.00%50.00%
20s 30s 40s 50s 60s 70s 80s
AgeMinority Study Directors All Study Directors
54.1
53.1
55.8
51.5
48 50 52 54 56 58
All Study Directors
All Minority Study Directors
Minority Board Appointees
Minority Dissident Directors
Age (Years)

The Impact of Shareholder Activism on Board Refreshment Trends at S&P 1500 Firms
July 2017 | Page 23 of 50
Dissident Directors and 99 were Board Appointees. Ten were classified as affiliated outsiders (2.6 percent), of which nine were Dissident Directors and one was a Board Appointee. Eighteen were considered insiders (4.7 percent), of which four were Dissident Directors appointed in settlements and 14 were Board Appointees. It is worth pointing out that the measure of "independence" focused on the nominees' degrees of separation from management rather than from the dissident.
According to Board Refreshment Trends at S&P 1500 Firms, the proportion of all S&P 1500 board seats held by independent directors increased from 78.7 percent in 2011 to 80.9 percent in 2015, while the proportion of board seats held by affiliated directors and insiders decreased from 15.5 percent and 5.8 percent in 2011 to 14.3 percent and 4.6 percent in 2015, respectively.
The proportion of Study Directors classified as independent outsiders increased from 91.5 percent in 2011 to 96.7 percent in 2015, while the proportion of Study Directors classified as insiders decreased from 8.5 percent in 2011 to 3.3 percent in 2015. There were no Study Directors classified as affiliated outsiders in 2011 or 2015. There were four affiliated outsiders in 2012 (5.6 percent), two in 2013 (three percent), and four in 2014 (4.4 percent).
Exhibit 10: Percentage of Directors Who Were Independent Outsiders
91.5% 90.1%
92.5%91.2%
96.7%
78.7% 79.1% 79.7% 80.6% 80.9%
75.0%
80.0%
85.0%
90.0%
95.0%
100.0%
2011 2012 2013 2014 2015
Study Directors S&P 1500

The Impact of Shareholder Activism on Board Refreshment Trends at S&P 1500 Firms
July 2017 | Page 24 of 50
Exhibit 11: Percentage of Directors Who Were Affiliated Outsiders
Exhibit 12: Percentage of Directors Who Were Insiders
The distribution of independence across the S&P 1500 sub-‐indexes aligned with the distribution of Study Directors in general.
› The S&P 500 accounted for 107 of the 380 Study Directors (28.2 percent) and 100 of the 352 independent outsiders (28.4 percent).
› The S&P 400 accounted for 93 of the Study Directors (24.5 percent) and 86 of the independent outsiders (24.4 percent).
0.0%
5.6%
3.0%
4.4%
0.0%
5.8% 5.5% 5.4%4.8% 4.6%
0.0%
1.0%
2.0%
3.0%
4.0%
5.0%
6.0%
7.0%
2011 2012 2013 2014 2015
Study Directors S&P 1500
8.5%
4.2% 4.5% 4.4%3.3%
15.5% 15.5% 15.0% 14.6% 14.3%
0.0%2.0%4.0%6.0%8.0%
10.0%12.0%14.0%16.0%18.0%
2011 2012 2013 2014 2015Study Directors S&P 1500

The Impact of Shareholder Activism on Board Refreshment Trends at S&P 1500 Firms
July 2017 | Page 25 of 50
› The S&P 600 accounted for 180 of the Study Directors (47.4 percent) and 166 of the independent outsiders (47.2 percent).
Study Directors were more likely to be independent outsiders or affiliated outsiders when activist shareholders contributed to their selection and more likely to be insiders when appointed unilaterally by boards.
› Of the 266 Dissident Directors, 253 were independent (95.1 percent), nine were affiliated outsiders (3.4 percent), and four were insiders (1.5 percent).
› Of the 114 Board Appointees, 99 were independent (86.8 percent), one was an affiliated outsider (0.9 percent), and 14 were insiders (12.3 percent).
Exhibit 13: Director Classification by Sub-‐Index
The average age of Study Directors classified as independent outsiders was 54.1 years. However, the 253 independent outsiders who were Dissident Directors averaged 52.9 years, while the 99 independent outsiders who were Board Appointees averaged 57.2 years.
The average age of Study Directors classified as affiliated outsiders was 56.6 years. The nine affiliated outsiders who were Dissident Directors averaged 56.6 years, while the lone affiliated outsider who was a Board Appointee was 57 years old.
The average age of Study Directors classified as insiders was 53.2 years. The four insiders appointed in settlements averaged 55.8 years, while the 14 insiders who were Board Appointees averaged 52.4 years.
28.4%
30.0%
22.2%
24.4%
30.0%
22.2%
47.2%
40.0%
55.6%
Independent Outsiders
Affiliated Outsiders
Insiders
S&P 500 S&P 400 S&P 600

The Impact of Shareholder Activism on Board Refreshment Trends at S&P 1500 Firms
July 2017 | Page 26 of 50
Of the 32 female Study Directors, 30 were independent outsiders, one was an affiliated outsider, and one was an insider.
Of the 16 minority Study Directors, 15 were independent outsiders and one was an insider. The sole female and minority insiders were appointed by boards unilaterally in connection with shareholder activism.
Exhibit 14: Average Age by Director Classification
Outside Board Experience
While most Study Directors (55 percent) held additional outside board seats, the majority served on just one (113) or two (60) outside boards. However, a sizable minority of the Study Directors pushed the over-‐boarded envelope, as 27 served on three outside boards, six on four outside boards, four on five outside boards, and one on six outside boards.
› For example, Vincent J. Intrieri, a long-‐time associate of Carl Icahn, served on six outside boards at the time of his appointment to the Dynegy board in 2011—XO Holdings, American Railcar Industries, National Energy Group, Federal-‐Mogul, Motorola Solutions, and Viskase Companies.
Female and minority Study Directors were more likely to serve on outside boards than their Caucasian male counterparts. Of the 306 Caucasian male study directors, 179 served on at least one outside
52.9
56.6
55.8
57.2 57
52.4
54.1
56.6
53.2
50
51
52
53
54
55
56
57
58
Independent Outsiders Affiliated Outsiders Insiders
Age (Years)
Dissident Directors Board Appointees All

The Impact of Shareholder Activism on Board Refreshment Trends at S&P 1500 Firms
July 2017 | Page 27 of 50
board (58.5 percent), while 20 of the 32 female study directors (62.5 percent) and 12 of the 16 minority study directors (75 percent) served on at least one outside board.
Exhibit 15: Distribution of Outside Board Service
Prior board service was an important attribute for both insurgent investors and incumbent boards. Dissident Directors accounted for 70 percent of the Study Directors and 68.7 percent of the study directors serving on at least one outside board. Board Appointees accounted for 30 percent of the Study Directors and 31.3 percent of the Study Directors serving on at least one outside board.
Activist shareholders and boards acting unilaterally appear to have selected multi-‐board Study Directors at approximately the same rate.
Boardroom service appears to be most important at large-‐cap firms. Directors who served on at least one outside board were disproportionately selected at larger-‐cap companies.
› The S&P 500 accounted for 28.2 percent of the Study Directors and 34.6 percent (73 of the 211) multi-‐board study directors.
› The S&P 400 accounted for 24.5 percent of the Study Directors and 28 percent (59 of 211) multi-‐board study directors
› The S&P 600 accounted for 47.4 percent of the Study Directors and 37.4 percent (79 of 211) of the multi-‐board study directors.
The average number of boards that multi-‐board Study Directors served on decreased through the course of the study. The average multi-‐board Study Director served on 2.1 outside boards in 2011,
169
113
60
27
6
4
1
0 20 40 60 80 100 120 140 160 180
0
1
2
3
4
5
6
Number Directors
Numbe
r of O
utsid
e Bo
ards

The Impact of Shareholder Activism on Board Refreshment Trends at S&P 1500 Firms
July 2017 | Page 28 of 50
1.7 outside boards in 2012, 1.8 outside boards in 2013, 1.7 outside boards in 2014, and 1.5 outside boards in 2015.
Exhibit 16: Distribution of Multi-‐Board Study Directors by Sub-‐Index Vs. All Study Directors
Occupations
Occupational data, which was available for 372 of the Study Directors, demonstrates preferences regarding the experience, qualifications, attributes, and skills (EQAS) of nominees in contested situations. “Corporate executives” (93 Study Directors) and “financial services professionals” (92 Study Directors) were in a virtual dead heat at the front of the pack. In slightly less demand were nominees classified as “retired” (75 Study Directors) or “professional directors” (three Study Directors). “Consultants” showed up in significant (48 Study Directors) numbers as well. Bringing up the rear, five or fewer Study Directors were classified as: “academics” (five), “attorneys” (three), “real estate services professionals” (three), or “accountants” (one). A variety of professional qualifications drew “other” classifications for 49 Study Directors.
Occupations were not evenly distributed—investors generally favored investment professionals and incumbent boards generally tapped sitting executives. Dissident Directors were nearly three times more likely to be “financial services professionals” (30.1 percent of the insurgent subset) than Board Appointees (10.5 percent of the incumbent boards’ candidate pools). Conversely, Board Appointees were nearly twice as likely to be “executives” (36 percent of that pool) than Dissident Directors (19.5 percent).
34.6%
28.0%
37.4%
28.2%24.5%
47.4%
0.0%
5.0%
10.0%
15.0%
20.0%
25.0%
30.0%
35.0%
40.0%
45.0%
50.0%
S&P 500 S&P 400 S&P 600
Percen
t of D
irectors
Multi-‐Board Study Directors All Study Directors

The Impact of Shareholder Activism on Board Refreshment Trends at S&P 1500 Firms
July 2017 | Page 29 of 50
Some backgrounds were more popular based on market cap. “Consultants” were in the mix in 15 percent of S&P 500 cases, 12.9 percent of S&P 400 cases, and 11.1 percent of S&P 600 cases. “Retirees” were selected in 22.4 percent of S&P 500 cases, 21.5 percent of S&P 400 cases, and 17.2 percent of S&P 600 cases. "Financial services professionals" were more likely to be selected at smaller-‐cap companies, having been selected in 26.1 percent of S&P 600 cases, 22.6 percent of S&P 400 cases, and 22.4 percent of S&P 500 cases.
Exhibit 17: Director Occupations
Exhibit 18: Distribution of Occupation by Director Classification
1%0%
1%
13%
24%
24%1%
1%
20%
13%
2%
Academic (5)Accountant (1)Attorney (3)Consultant (48)Executive (93)Financial Services (92)Professional Director (3)Real Estate Services (3)Retired (75)Other (49)Not Available (8)
0.0% 5.0% 10.0% 15.0% 20.0% 25.0% 30.0% 35.0% 40.0%
Academic
Accountant
Attorney
Consultant
Executive
Financial Services
Professional Director
Real Estate Services
Retired
Other
Not Available
Board Appointees Dissident Directors

The Impact of Shareholder Activism on Board Refreshment Trends at S&P 1500 Firms
July 2017 | Page 30 of 50
Exhibit 19: Distribution of Director Occupations by Sub-‐Index
Twenty-‐six Study Directors were CEOs of outside companies and three others previously served as CEO of the company at which they were selected. Six of the outside-‐CEO Study Directors were selected at S&P 500 companies, eight at S&P 400 companies, and 12 at S&P 600 companies.
Three of the outside-‐CEOs were selected as Study Directors more than once.
› Philip T. Blazek, CEO of Special Diversified Opportunities, was selected five times, in each case by Mario Gabelli’s GAMCO;
› Jose Maria Alapont, CEO of Federal-‐Mogul, was selected twice, in both cases by Icahn Group, and
› Sardar Biglari, CEO of Biglari Holdings, self-‐selected three times.
ISS classified 22 Study Directors as "financial experts." These financial experts were most likely to be selected at larger-‐cap companies. Fourteen of the 22 financial experts were selected at S&P 500 companies, four at S&P 400 companies, and four at S&P 600 companies.
Occupational data was available for all female and minority Study Directors. Both female and minority candidates were more likely to be “retired” than Study Directors in general, as 34.4 percent of females and 37.5 percent of minorities were “retired” while only 19.7 percent of Study Directors drew that designation. Female directors were most likely to be “retired.” Minority candidates were most likely (12 of the 16) to be “executives” or “retired”, including the sole female minority study director None of the women and minority candidates were academics, accountants, or attorneys.
0.0%
5.0%
10.0%
15.0%
20.0%
25.0%
30.0%
S&P 500 S&P 400 S&P 600

The Impact of Shareholder Activism on Board Refreshment Trends at S&P 1500 Firms
July 2017 | Page 31 of 50
Exhibit 20: Distribution of Female Director Occupational Data
Exhibit 21: Distribution of Minority Director Occupational Data
0.0% 5.0% 10.0% 15.0% 20.0% 25.0% 30.0% 35.0% 40.0%
Academic
Accountant
Attorney
Consultant
Executive
Financial Services
Professional Director
Real Estate Services
Retired
Other
Not Available
Female All Study Directors
0.0% 5.0% 10.0% 15.0% 20.0% 25.0% 30.0% 35.0% 40.0%
Academic
Accountant
Attorney
Consultant
Executive
Financial Services
Professional Director
Real Estate Services
Retired
Other
Not Available
Minorities All Study Directors

The Impact of Shareholder Activism on Board Refreshment Trends at S&P 1500 Firms
July 2017 | Page 32 of 50
Exhibit 22: Number of Financial Experts by Sub-‐Index
Twenty of the 26 Study Directors who were the CEO of an outside company served on at least one outside board, while all three Study Directors who previously served as CEO of the company at which they were selected served on at least one outside board. Similarly, 16 of the 22 Study Directors classified as "financial experts" served on at least one outside board. None of the outside-‐CEO study directors were female, and there were only two unique minority CEOs, Jose Maria Alapont and Sardar Biglari. Three of the "financial experts" were female, but only one was a minority. Race/ethnicity information was not available for two of the "financial experts."
Exhibit 23: Percent of Directors Who Sat on At Least One Outside Board by Category
107
1493
4180
4
0%
10%
20%
30%
40%
50%
60%
70%
80%
90%
100%
Study Directors Financial ExpertsS&P 500 S&P 400 S&P 600
76.9% 72.7%
55.5%
0.0%10.0%20.0%30.0%40.0%50.0%60.0%70.0%80.0%90.0%100.0%
Outside-‐CEOs Financial Experts All Study Directors

The Impact of Shareholder Activism on Board Refreshment Trends at S&P 1500 Firms
July 2017 | Page 33 of 50
Part II: Board Profile Trends
Part I examined the entire pool of individuals who were selected as board members or nominees in activist situations. Part II focuses on the board-‐level changes caused by activism campaigns and examines the profile of boards before and after activist events.
Director Age
Activism decreased the average director age at targeted boards. Activism (or the threat of it) decreased the average age of board members at Study Companies by more than 2.5 years—from 62.2 years to 59.6 years. These changes were widespread, as average director age decreased at 73 (78.5 percent) of the 93 study companies.
As a result, a typical board at the Study Companies was younger than its index peers. According to Board Refreshment Trends at S&P 1500 Firms, average S&P 1500 director age increased from 61.5 years in 2011 to 62.5 in 2015.
Exhibit 24: Average Director Age
Regis and Motorola Solutions experienced the largest decrease and increase in average director age, respectively.
› At Regis, Starboard ran a successful proxy contest in 2011 for three dissident nominees, Birch Run Capital Advisors settled for one nominee in 2012, and Regis added several other new directors. Only one of the eight director nominees at the 2013 annual meeting had been with
62.261.8
63.8
61.2
59.6
58.5
61.1
60
55
56
57
58
59
60
61
62
63
64
65
Study companies S&P 600 Study Companies S&P 400 Study Companies S&P 500 Study Companies
Years
Year Prior to Activism Year After Activism

The Impact of Shareholder Activism on Board Refreshment Trends at S&P 1500 Firms
July 2017 | Page 34 of 50
the company pre-‐activism. The turnover decreased the board's average age from 63.6 years in 2010 to 52.8 years in 2013.
› At Motorola Solutions, Icahn Group settled for one nominee in 2011, Vincent Intrieri, age 54, who replaced director Keith Meister, age 36. Both Meister, who had joined the Motorola board via a settlement in 2008, and Intrieri were top lieutenants at Icahn's hedge fund at the time of their appointments. Although Intrieri resigned before the 2012 annual meeting, the removal of Meister, who had left Icahn's investment firm to form his own fund, and the addition of three management nominees in 2011 increased the board's average age from 57.1 years in 2010 to 63.6 years in 2012.
There was a correlation between company size and the impact of public shareholder activism on average director age. Smaller-‐cap companies tended to experience more pronounced declines in director age at a greater frequency. Average director age decreased from 61.2 years to 60 years at S&P 500 companies, from 63.8 years to 61.1 years at S&P 400 companies, and from 61.8 years to 58.5 years at S&P 600 companies. Moreover, while only 64 percent of S&P 500 companies experienced a decrease in average director age, 80 percent of S&P 400 and 86 percent of S&P 600 companies experienced a decrease.
When segmented by the year in which shareholder activism occurred, companies that experienced shareholder activism in all five years experienced declines in average director age. Study companies with activism in 2011, 2012, and 2015 had averages below the average of the broader S&P 1500 both pre-‐ and post-‐activism, while companies with activism in 2013 and 2014 experienced declines in average director age from above the S&P 1500 pre-‐activism to below the S&P 1500 post-‐activism.
Exhibit 25: Average Director Age by Year of Activism
60.960.3
62.563.2
62.1
59.358.8
60.160.8
60.3
56.0
57.0
58.0
59.0
60.0
61.0
62.0
63.0
64.0
2011 2012 2013 2014 2015
Years
Year Prior to Activism Year After Activism

The Impact of Shareholder Activism on Board Refreshment Trends at S&P 1500 Firms
July 2017 | Page 35 of 50
Board Tenure
Activism cut average board tenure by more than three years—from 9.5 years to 6.1 years—at targeted companies. Average board tenure decreased at 82.8 percent of Study Companies. According to Board Refreshment Trends at S&P 1500 Firms, average S&P 1500 director tenure was 8.9 years in both 2011 and 2015 (though it was as high as nine years in 2012 and 2013).
Exhibit 26: Average Board Tenure
There was a correlation between company size and the impact of public shareholder activism on average board tenure. While 17 of the 25 S&P 500 Study Companies (68 percent) experienced a decline in average tenure, 16 of the 20 S&P 400 Study Companies (80 percent) and 38 of the 43 S&P 600 Study Companies (88.4 percent) experienced a decline.
Cracker Barrel Old Country Store and Biglari Holdings (which was coincidentally the activist shareholder at Cracker Barrel) experienced the largest decrease and increase in average director tenure, respectively. Biglari Holdings ran three consecutive proxy contests at Cracker Barrel between 2011 and 2013. Although the activist was unsuccessful in all three years, the company responded to the challenges by adding seven new management-‐sponsored directors, which decreased average tenure from 19.8 years in 2010 to 3.6 years in 2014. The Groveland Group ran a proxy contest at Biglari Holdings in 2015 in a bid to replace the entire six-‐member board. Although no dissident nominees
9.59.9 9.8
8.6
6.1 6.06.5 6.3
82.8%
88.4%
80.0%
68.0%
17.2%11.6%
20.0%
32.0%
0.0%
10.0%
20.0%
30.0%
40.0%
50.0%
60.0%
70.0%
80.0%
90.0%
100.0%
0.0
2.0
4.0
6.0
8.0
10.0
12.0
Study Companies S&P 600 Study Companies
S&P 400 Study Companies
S&P 500 Study Companies
Percen
t of C
ompanies
Years
Year Prior to Activism Year After Activism Percent With Decrease Percent With Increase

The Impact of Shareholder Activism on Board Refreshment Trends at S&P 1500 Firms
July 2017 | Page 36 of 50
were elected, the board decreased in size, which increased average tenure from 5.3 years in 2014 to 8 years in 2016.
When segmented by the year in which shareholder activism occurred, companies that experienced shareholder activism in all five years had a decline in average director tenure. Study Companies with activism in 2011, 2012, 2013, and 2015 had averages below the average of the broader S&P 1500 both pre-‐ and post-‐activism, while companies with activism in 2014 experienced a decline in average director tenure from above the S&P 1500 pre-‐activism to below the S&P 1500 post-‐activism. Study Companies with activism in 2014 had average director tenure of 9.7 years in 2013 and 6.4 years in 2015. Average director tenure decreased from nine years to 8.9 years across the broader S&P 1500 over the same period.
Exhibit 27: Average Board Tenure by Year of Activism
Board Size
Average board size at Study Companies increased from nine to 9.4 seats. According to Board Refreshment Trends at S&P 1500 Firms, average S&P 1500 board size increased from nine seats in 2011 to ten seats in 2015.
Fewer than half (41.9 percent) of the Study Companies saw a post-‐activism boost in board size. The number of post-‐activism seats dropped at 18.3 percent of Study Companies and was unchanged at 39.8 percent of Study Companies.
7.97.0
8.3
9.78.8
5.85.2
4.4
6.4 6.4
0.0
2.0
4.0
6.0
8.0
10.0
12.0
2011 2012 2013 2014 2015
Years
Year Prior to Activism Year After Activism

The Impact of Shareholder Activism on Board Refreshment Trends at S&P 1500 Firms
July 2017 | Page 37 of 50
Exhibit 28: Average Board Size
Smaller-‐cap companies experienced more pronounced increases in board size at a greater frequency. Average board size increased from 10.6 seats to 10.8 seats at S&P 500 companies, from 9.3 seats to 9.8 seats at S&P 400 companies, and from eight seats to 8.5 seats at S&P 600 companies. While only 36 percent of S&P 500 study companies and 35 percent of S&P 400 study companies experienced an increase in board size, 48.8 percent of S&P 600 study companies added board seats.
Exhibit 29: Changes in Board Size
9.08.0
9.3
10.69.4
8.5
9.810.8
0.0
2.0
4.0
6.0
8.0
10.0
12.0
Study companies S&P 600 Study Companies
S&P 400 Study Companies
S&P 500 Study Companies
Numbe
r of B
oard Se
ats
Year Prior to Activism Year After Activism
41.9%48.8%
35.0% 36.0%39.8%34.9%
55.0%
36.0%
18.3% 16.3%10.0%
28.0%
0.0%
10.0%
20.0%
30.0%
40.0%
50.0%
60.0%
Study Companies S&P 600 Study Companies
S&P 400 Study Companies
S&P 500 Study Companies
Percen
t of C
ompanie
% With Increase % With No Change % With Decrease

The Impact of Shareholder Activism on Board Refreshment Trends at S&P 1500 Firms
July 2017 | Page 38 of 50
Tessera Technologies and Transocean experienced the largest increase and decrease in board size, respectively. Starboard settled a proxy contest at Tessera in 2013 for six board seats and the incumbent board added four new directors, which increased the board from six seats in 2012 to ten seats in 2014. Icahn Group settled with Transocean in 2014 for two board seats and the company agreed to reduce the size of the board from 14 to 11 directors. Prior to the 2015 annual meeting, CEO and director Steven Newman resigned. As a result, the board decreased from 14 to ten seats.
When segmented by the year in which shareholder activism occurred, Study Companies increased in size every year except 2014. Average board size was unchanged at 9.5 seats for Study Companies with shareholder activism in 2014.
Exhibit 30: Average Board Size by Year of Activism
8.58.4
9.39.5
8.88.6
9.1
10.0
9.59.3
7.5
8
8.5
9
9.5
10
10.5
2011 2012 2013 2014 2015
Numbe
r of B
oard Se
ats
Year Prior to Activism Year After Activism
The Impact of Shareholder Activism on Board Refreshment Trends at S&P 1500 Firms
July 2017 | Page 39 of 50
Independence
Exhibit 31: Average Board Independence
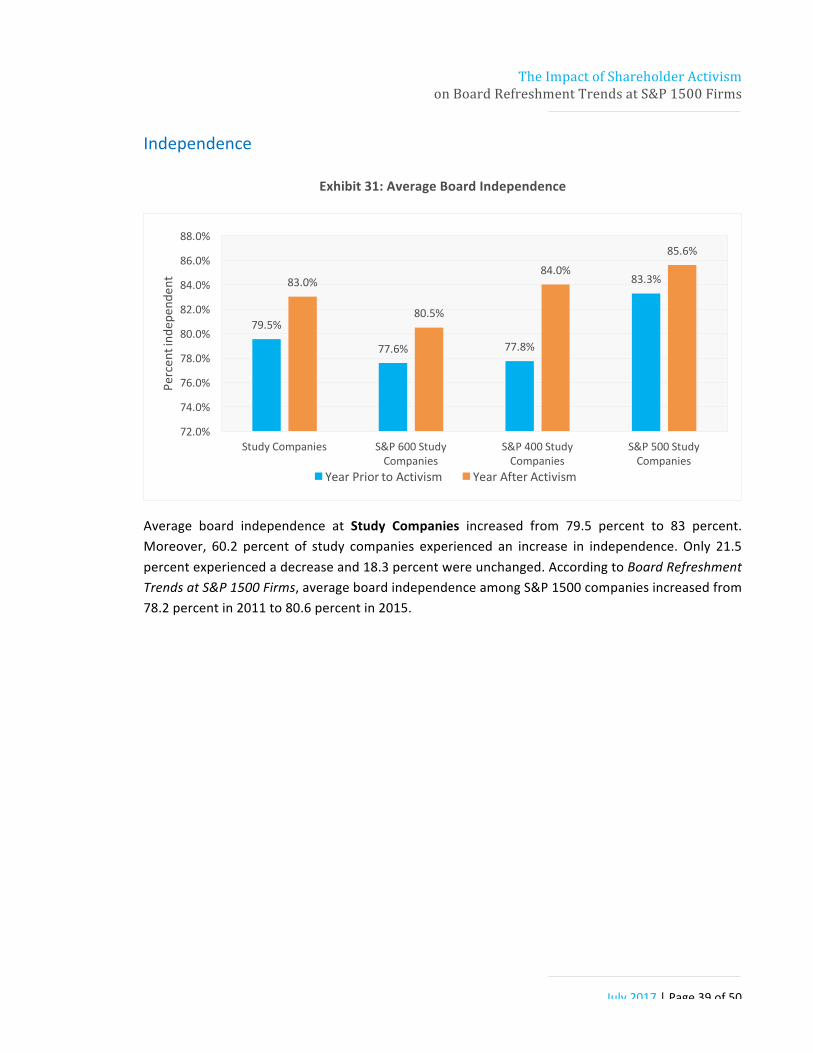
Average board independence at Study Companies increased from 79.5 percent to 83 percent. Moreover, 60.2 percent of study companies experienced an increase in independence. Only 21.5 percent experienced a decrease and 18.3 percent were unchanged. According to Board Refreshment Trends at S&P 1500 Firms, average board independence among S&P 1500 companies increased from 78.2 percent in 2011 to 80.6 percent in 2015.
79.5%
77.6% 77.8%
83.3%83.0%
80.5%
84.0%85.6%
72.0%
74.0%
76.0%
78.0%
80.0%
82.0%
84.0%
86.0%
88.0%
Study Companies S&P 600 Study Companies
S&P 400 Study Companies
S&P 500 Study Companies
Percen
t ind
epen
dent
Year Prior to Activism Year After Activism

The Impact of Shareholder Activism on Board Refreshment Trends at S&P 1500 Firms
July 2017 | Page 40 of 50
Exhibit 32: Changes in Board Independence
Average board independence increased from 83.3 percent to 85.6 percent at S&P 500 Study Companies, from 77.8 percent to 84 percent at S&P 400 study companies, and from 77.6 percent to 80.5 percent at S&P 600 Study Companies. Shifts in board independence were most pronounced and occurred in the greatest frequency at Study Companies with less than 75 percent independence pre-‐activism. Average director independence increased from 68.5 percent to 77.4 percent at the 33 Study Companies with less than 75 percent pre-‐activism independence. Average director independence increased from 79.5 percent to 83 percent at the remaining 60 Study Companies. While average independence increased at 66.7 percent of study companies with less than 75 percent independence pre-‐activism, it increased at only 60.2 percent of the remaining 60 Study Companies.
LSB Industries and Perry Ellis International shared the lowest level of pre-‐activism board independence among Study Companies at 57.1 percent. Although Starboard and Engine Capital settled threatened proxy contests for three independent directors in 2014 and five in 2015 at LSB Industries, independence decreased to 54.6 percent in 2016. The decrease was due to a reduction in board size from 14 to 11 seats coupled with the appointment of one of the independent directors as interim-‐CEO. Legion Partners and the California State Teachers' Retirement System intended to nominate three independent directors at the 2015 Perry Ellis annual meeting, but withdrew after the Perry Ellis board announced that it would replace the CEO and nominate two independent directors. As a result, the Perry Ellis board increased from seven to eight members and the number of independent directors increased from four to six.
60.2% 62.8%60.0% 60.0%
18.3% 16.3%
25.0%
12.0%
21.5% 20.9%15.0%
28.0%
0.0%
10.0%
20.0%
30.0%
40.0%
50.0%
60.0%
70.0%
Study Companies S&P 600 Study Companies
S&P 400 Study Companies
S&P 500 Study Companies
Percen
t of C
ompanies
% With Increase % With No Change % With Decrease

The Impact of Shareholder Activism on Board Refreshment Trends at S&P 1500 Firms
July 2017 | Page 41 of 50
Exhibit 33: Board Independence by Year of Activism
When segmented by the year in which shareholder activism occurred, average board independence declined at Study Companies that experienced shareholder activism in 2011 and 2012. Average board independence decreased from 85.4 percent to 84.1 percent for Study Companies that experienced shareholder activism in 2011, while independence among the broader S&P 1500 increased from 77.5 percent to 78.7 percent over the same period. Similarly, average board independence decreased from 83 percent to 74.6 percent for Study Companies that experienced shareholder activism in 2012, while independence among the broader S&P 1500 increased from 78.2 percent to 79.3 percent over the same period.
Female Directors
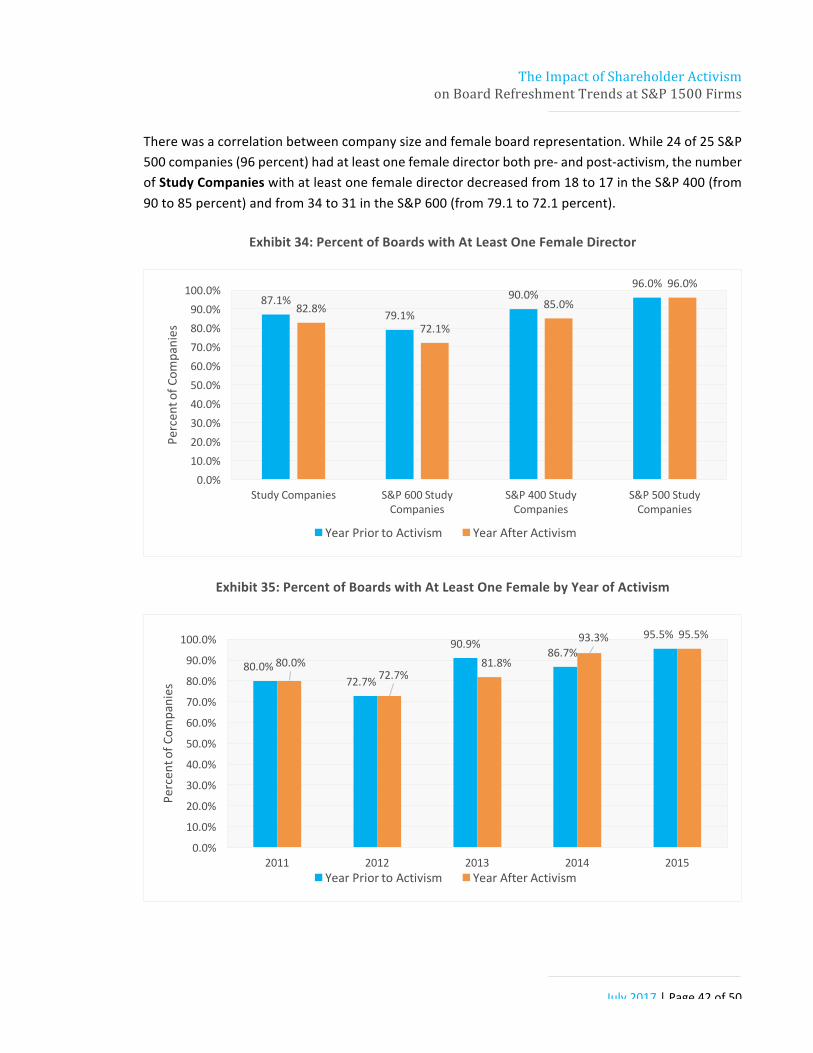
The number of female directors at Study Companies increased from 137 to 142, but the number of Study Companies with at least one female director decreased from 81 to 77 (from 87.1 percent to 82.8 percent). Although the proportion of Study Companies with at least one female director decreased, it nonetheless remained above that of the broader S&P 1500. According to Board Refreshment Trends at S&P 1500 Firms, the proportion of S&P 1500 companies with at least one female director increased from 72 percent in 2011 to 82.7 percent in 2015. When segmented by the year in which shareholder activism occurred, Study Companies that experienced shareholder activism in 2012 had a lower proportion of female directors both pre-‐ and post-‐activism. Study companies that experienced shareholder activism in all other study years had a higher proportion of female directors both pre-‐ and post-‐activism.
85.4% 83.0%77.4% 78.0%
83.0%84.1%
74.6%
89.6%83.3% 84.3%
0.0%
10.0%
20.0%
30.0%
40.0%
50.0%
60.0%
70.0%
80.0%
90.0%
100.0%
2011 2012 2013 2014 2015
Percen
t Ind
epen
dent
Year Prior to Activism Year After Activism
The Impact of Shareholder Activism on Board Refreshment Trends at S&P 1500 Firms
July 2017 | Page 42 of 50
There was a correlation between company size and female board representation. While 24 of 25 S&P 500 companies (96 percent) had at least one female director both pre-‐ and post-‐activism, the number of Study Companies with at least one female director decreased from 18 to 17 in the S&P 400 (from 90 to 85 percent) and from 34 to 31 in the S&P 600 (from 79.1 to 72.1 percent).
Exhibit 34: Percent of Boards with At Least One Female Director
Exhibit 35: Percent of Boards with At Least One Female by Year of Activism
87.1%79.1%
90.0%96.0%
82.8%
72.1%
85.0%
96.0%
0.0%10.0%20.0%30.0%40.0%50.0%60.0%70.0%80.0%90.0%100.0%
Study Companies S&P 600 Study Companies
S&P 400 Study Companies
S&P 500 Study Companies
Percen
t of C
ompanies
Year Prior to Activism Year After Activism
80.0%72.7%
90.9%86.7%
95.5%
80.0%72.7%
81.8%
93.3% 95.5%
0.0%
10.0%
20.0%
30.0%
40.0%
50.0%
60.0%
70.0%
80.0%
90.0%
100.0%
2011 2012 2013 2014 2015
Percen
t of C
ompanies
Year Prior to Activism Year After Activism
The Impact of Shareholder Activism on Board Refreshment Trends at S&P 1500 Firms
July 2017 | Page 43 of 50
Minority Directors
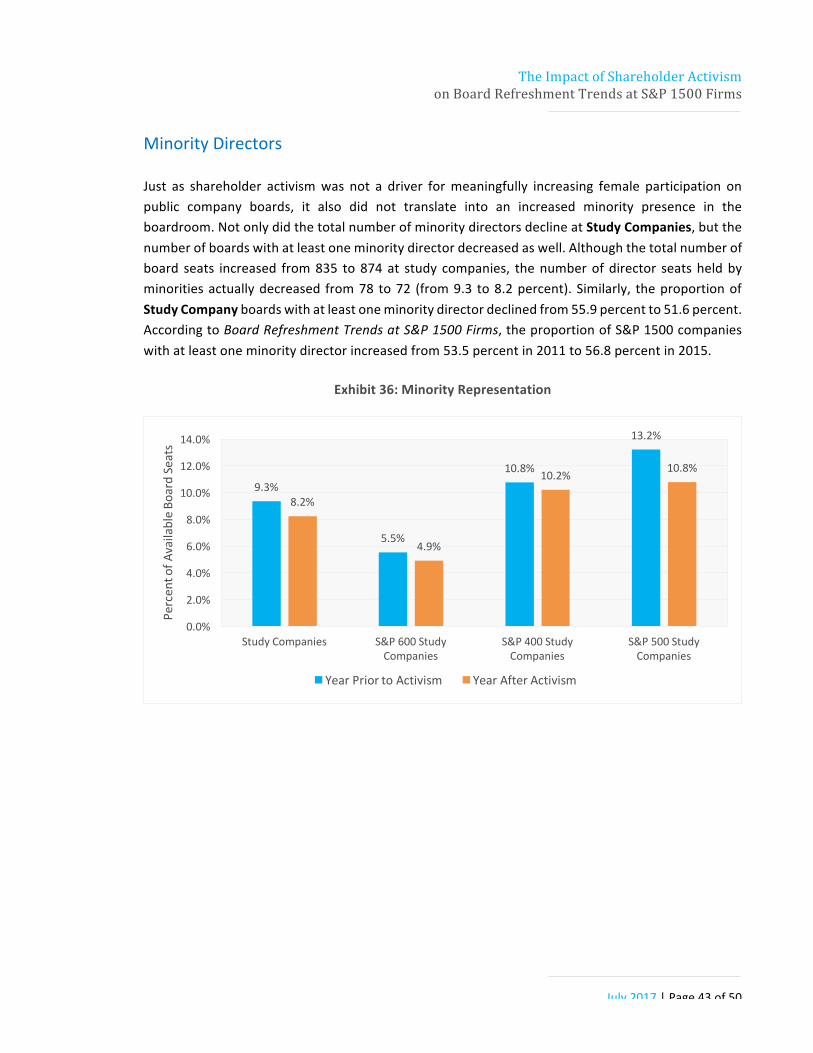
Just as shareholder activism was not a driver for meaningfully increasing female participation on public company boards, it also did not translate into an increased minority presence in the boardroom. Not only did the total number of minority directors decline at Study Companies, but the number of boards with at least one minority director decreased as well. Although the total number of board seats increased from 835 to 874 at study companies, the number of director seats held by minorities actually decreased from 78 to 72 (from 9.3 to 8.2 percent). Similarly, the proportion of Study Company boards with at least one minority director declined from 55.9 percent to 51.6 percent. According to Board Refreshment Trends at S&P 1500 Firms, the proportion of S&P 1500 companies with at least one minority director increased from 53.5 percent in 2011 to 56.8 percent in 2015.
Exhibit 36: Minority Representation
9.3%
5.5%
10.8%
13.2%
8.2%
4.9%
10.2% 10.8%
0.0%
2.0%
4.0%
6.0%
8.0%
10.0%
12.0%
14.0%
Study Companies S&P 600 Study Companies
S&P 400 Study Companies
S&P 500 Study Companies
Percen
t of A
vailable Bo
ard Seats
Year Prior to Activism Year After Activism
The Impact of Shareholder Activism on Board Refreshment Trends at S&P 1500 Firms
July 2017 | Page 44 of 50
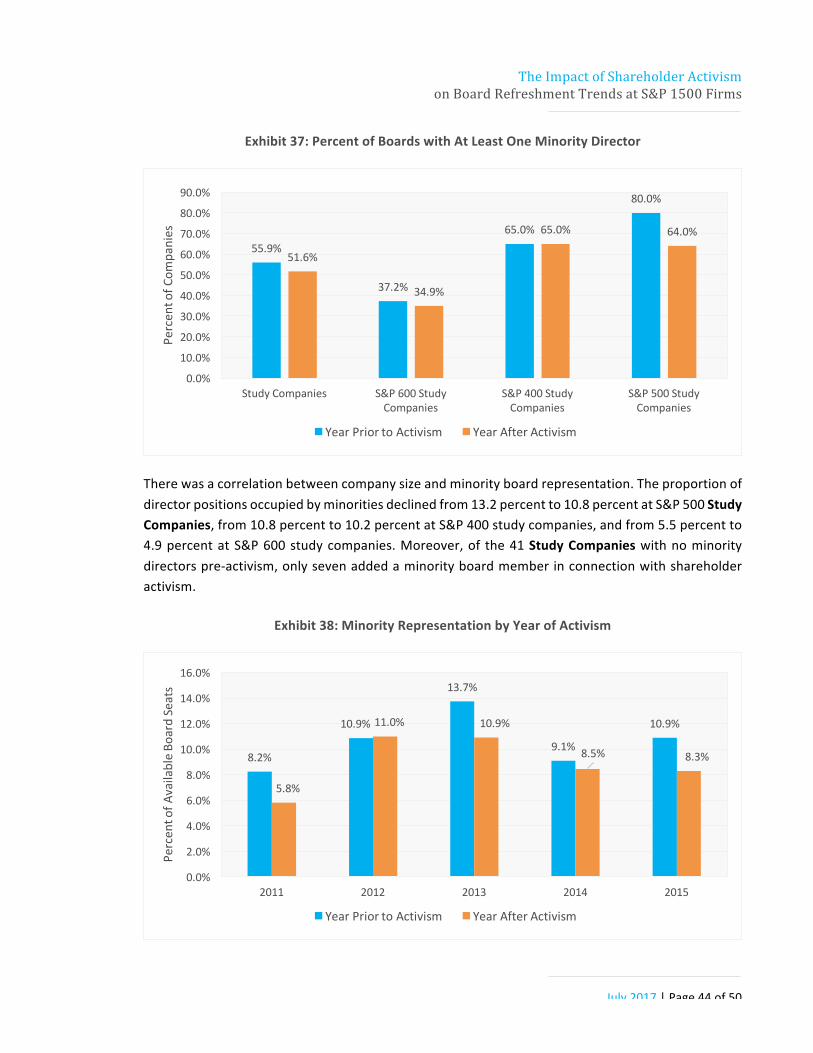
Exhibit 37: Percent of Boards with At Least One Minority Director
There was a correlation between company size and minority board representation. The proportion of director positions occupied by minorities declined from 13.2 percent to 10.8 percent at S&P 500 Study Companies, from 10.8 percent to 10.2 percent at S&P 400 study companies, and from 5.5 percent to 4.9 percent at S&P 600 study companies. Moreover, of the 41 Study Companies with no minority directors pre-‐activism, only seven added a minority board member in connection with shareholder activism.
Exhibit 38: Minority Representation by Year of Activism
55.9%
37.2%
65.0%
80.0%
51.6%
34.9%
65.0% 64.0%
0.0%
10.0%
20.0%
30.0%
40.0%
50.0%
60.0%
70.0%
80.0%
90.0%
Study Companies S&P 600 Study Companies
S&P 400 Study Companies
S&P 500 Study Companies
Percen
t of C
ompanies
Year Prior to Activism Year After Activism
8.2%
10.9%
13.7%
9.1%
10.9%
5.8%
11.0% 10.9%
8.5% 8.3%
0.0%
2.0%
4.0%
6.0%
8.0%
10.0%
12.0%
14.0%
16.0%
2011 2012 2013 2014 2015
Percen
t of A
vailable Bo
ard Seats
Year Prior to Activism Year After Activism

The Impact of Shareholder Activism on Board Refreshment Trends at S&P 1500 Firms
July 2017 | Page 45 of 50
When segmented by the year in which shareholder activism occurred, Study Companies that experienced shareholder activism in 2012 were the only annual cohort with an increase in the proportion of minority directors and the only with an increase in the proportion of boards with at least one minority.
Exhibit 39: Percent of Boards with At Least One Minority Director by Year of Activism
Outside Boards
The average number of outside boards on which Study Companies' directors served remained virtually flat with a small increase from 0.8 to 0.9. The number of study companies without a director who sat on more than one outside board decreased from four to two. There was a correlation between company size and outside board service, as directors at S&P 500 and S&P 400 study companies sat on a higher average number of outside boards than their counterparts at S&P 600 study companies.
50.0%54.5%
63.6%
53.3%
72.7%
30.0%
72.7%
63.6%
46.7%
59.1%
0.0%
10.0%
20.0%
30.0%
40.0%
50.0%
60.0%
70.0%
80.0%
2011 2012 2013 2014 2015
Percen
t of C
ompanies
Year Prior to Activism Year After Activism

The Impact of Shareholder Activism on Board Refreshment Trends at S&P 1500 Firms
July 2017 | Page 46 of 50
Exhibit 40: Average Number of Outside Boards per Director
Exhibit 41: Average Number of Outside Boards per Director by Year of Activism
When segmented by the year in which shareholder activism occurred, Study Companies that experienced shareholder activism in 2013 had the largest increase in outside board service, as the average number of outside boards on which directors at these companies served increased from 1 to 1.3.
0.8
0.6
0.8
1.1
0.9
0.7
0.9
1.2
0.0
0.2
0.4
0.6
0.8
1.0
1.2
1.4
Study Companies S&P 600 Study Companies S&P 400 Study Companies S&P 500 Study Companies
Numbe
r of O
utsid
e Bo
ards
Year Prior to Activism Year After Activism
1.01.0 1.0
0.7
0.90.8
1.1
1.3
0.80.9
0.0
0.2
0.4
0.6
0.8
1.0
1.2
1.4
2011 2012 2013 2014 2015
Numbe
r of O
utsid
e Bo
ards
Year Prior to Activism Year After Activism

The Impact of Shareholder Activism on Board Refreshment Trends at S&P 1500 Firms
July 2017 | Page 47 of 50
Financial Expert Representation
The proportion of board seats at Study Companies occupied by "financial experts" as defined by ISS increased from 22.6 percent (189 of 835) to 24.5 percent (214 of 874). The number of Study Companies with at least one, two, or three "financial experts" also increased.
Exhibit 42: Financial Expert Representation
Exhibit 43: Percent of S&P 1500 Study Companies with Financial Experts
22.6%20.9% 19.9%
24.9%24.5%22.3% 20.9%
28.6%
0.0%
5.0%
10.0%
15.0%
20.0%
25.0%
30.0%
35.0%
Study Companies S&P 600 Study Companies
S&P 400 Study Companies
S&P 500 Study Companies
Percen
t of A
vailable Bo
ard Seats
Year Prior to Activism Year After Activism
2.2%
97.8%
52.7%
33.3%
0.0%
100.0%
66.7%
38.7%
0.0%
20.0%
40.0%
60.0%
80.0%
100.0%
120.0%
% With Zero % With at least 1 % With at least 2 % With at least 3
Percen
t of C
ompanies
Year Prior to Activism Year After Activism

The Impact of Shareholder Activism on Board Refreshment Trends at S&P 1500 Firms
July 2017 | Page 48 of 50
LSB Industries and Pulse Electronics were the only two Study Companies without a "financial expert" on their pre-‐activism boards. LSB added three "financial experts" in 2015, two in connection with a settlement agreement with Starboard, and one management nominee. Pulse added two "financial experts" in 2012, both of whom were management nominees.
Exhibit 44: Percent of S&P 500 Study Companies with Financial Experts
Larger-‐cap Study Companies tended to have a higher concentration of "financial experts" than smaller-‐cap Study Companies. The S&P 500 had the highest proportion of Study Companies with at least two or three financial experts, and financial experts occupied a greater proportion of available board seats at S&P 500 companies, both pre-‐ and post-‐activism.
0.0%
100.0%
68.0%
48.0%
0.0%
100.0%
84.0%
56.0%
0.0%
20.0%
40.0%
60.0%
80.0%
100.0%
120.0%
% With Zero % With at least 1 % With at least 2 % With at least 3
Percen
t of C
ompanies
Year Prior to Activism Year After Activism

The Impact of Shareholder Activism on Board Refreshment Trends at S&P 1500 Firms
July 2017 | Page 49 of 50
Exhibit 45: Financial Expert Representation by Year of Activism
When segmented by the year in which shareholder activism occurred, Study Companies that experienced activism in 2011 and 2012 had a decrease in the proportion of directors classified as "financial experts." However, there was an increase in the proportion of directors classified as "financial experts" at Study Companies that experienced shareholder activism during the final three years of the study. The proportion of directors classified as "financial experts" at Study Companies that experienced shareholder activism in 2013 increased from 17.6 percent to 20.9 percent, the lowest concentration both pre-‐ and post-‐activism.
27.1%
31.5%
17.6%
26.6%23.8%
26.7% 27.0%
20.9%
27.5%25.4%
0.0%
5.0%
10.0%
15.0%
20.0%
25.0%
30.0%
35.0%
2011 2012 2013 2014 2015
Percen
t of A
vailable Bo
ard Seats
Year Prior to Activism Year After Activism
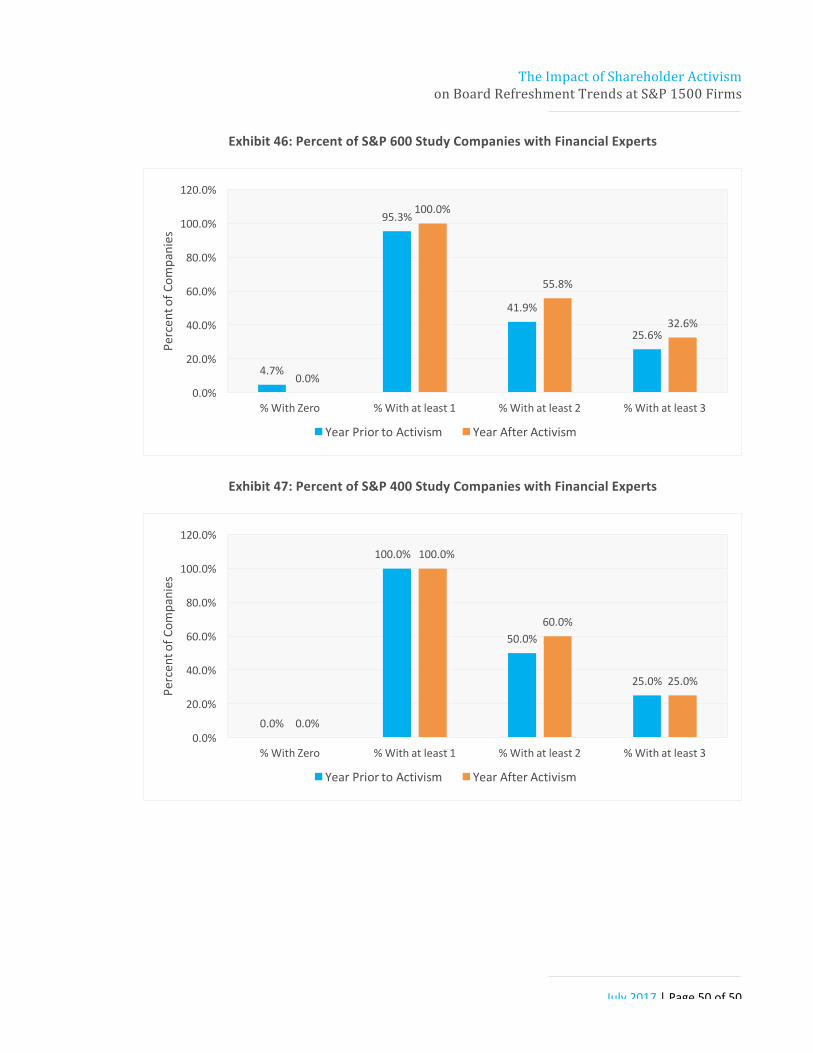
The Impact of Shareholder Activism on Board Refreshment Trends at S&P 1500 Firms
July 2017 | Page 50 of 50
Exhibit 46: Percent of S&P 600 Study Companies with Financial Experts
Exhibit 47: Percent of S&P 400 Study Companies with Financial Experts
4.7%
95.3%
41.9%
25.6%
0.0%
100.0%
55.8%
32.6%
0.0%
20.0%
40.0%
60.0%
80.0%
100.0%
120.0%
% With Zero % With at least 1 % With at least 2 % With at least 3
Percen
t of C
ompanies
Year Prior to Activism Year After Activism
0.0%
100.0%
50.0%
25.0%
0.0%
100.0%
60.0%
25.0%
0.0%
20.0%
40.0%
60.0%
80.0%
100.0%
120.0%
% With Zero % With at least 1 % With at least 2 % With at least 3
Percen
t of C
ompanies
Year Prior to Activism Year After Activism