occupational and public field exposure from … · locations in the frequency range of 255 khz to...
TRANSCRIPT
Abstract- Electromagnetic exposure (occupational and general public) to 14 types of air
traffic control (ATC) systems is assessed. Measurement methods are proposed for in-situ
exposure assessment of these ATC systems. In total 50 sites are investigated at 1073
locations in the frequency range of 255 kHz to 24 GHz. For all installations, typical and
maximal exposure values for workers and the general public are provided. Two of the 14
types of systems, Non-Directional Beacons (NDB) (up to 881.6 V/m) and Doppler Very
High Frequency (VHF) Omni-directional Range (DVOR) (up to 92.3 V/m), exhibited
OCCUPATIONAL AND PUBLIC FIELD
EXPOSURE FROM COMMUNICATION,
NAVIGATION, AND RADAR SYSTEMS USED
FOR AIR TRAFFIC CONTROL
Wout Joseph*, Francis Goeminne*, Günter Vermeeren*, Leen Verloock*, and Luc Martens*
(email:[email protected], tel: +32 9 33 14918, fax:+32 9 33 14899)
*Department of Information Technology, Ghent University / IBBT
Gaston Crommenlaan 8, B-9050 Ghent, Belgium
Manuscript (Abstract, Text, References, Footnotes, List of Figure Captions)

levels requiring recommended minimum distances such that the ICNIRP reference
levels are not exceeded. Cumulative exposure of all present radiofrequency (RF) sources
is investigated and it is concluded that the ATC source dominates the total exposure in
its neighborhood.
Key Words- air traffic control, ATC, occupational exposure, general public exposure,
radar, VHF, UHF, NDB, DME, VOR, ILS, trunking, radiolink, microwave link,
multilateration, beacon, PSR, SSR, surface radar
I. INTRODUCTION
A wide range of air traffic control (ATC) systems exists for communication and navigation
with air planes. Exposure to these ATC systems is only rarely investigated up to now.
Operators working on these systems and the general public being and living closely in the
neighborhood of these systems, are exposed to the electromagnetic (EM) fields of these
systems. Moreover, when EU Directive 2004/40/EC (European Parliament 2004, 2008) will
be implemented, employers in the European Union will face new requirements concerning the
exposure of their employees to electromagnetic fields. This directive will also affect the
working areas in the vicinity of the ATC systems where workers are exposed.
In this paper electromagnetic (EM) exposure to most types of ATC systems is investigated,
namely the following 14 different types: (i) VHF/UHF-transmission centers (Very High
Frequency/Ultra High Frequency), (ii) trunking antennas, (iii) ILS (Instrument Landing
System) (Glide Path GP, Localizer LOC, markers), (iv) NDB (Non-Directional Beacon), (v)
DME (Distance Measuring Equipment), (vi) VOR (VHF Omni-directional Range), (vii)
radiolink, (viii) primary radar (PSR), (ix) secondary radar (SSR), (x) surface radars, (xi)

multilateration, (xii) microwavelink, (xiii) beacons, and (xiv) weather radar. Table 1 explains
the functionality of these air traffic control systems.
Measurement procedures for exposure assessment of these systems are proposed and exposure
is assessed. In total, 1073 measurement locations spread over 50 sites with ATC equipment
are investigated. Moreover, cumulative exposure to all present sources in the frequency range
of 80 MHz to 24 GHz is investigated at an airport site and it is determined whether the ATC
source dominates the total exposure in its neighborhood. For the first time to our knowledge,
exposure is experimentally assessed and characterized for most of the ATC systems. The
purpose of this study is to provide a range of typical exposure values and to check compliance
with the ICNIRP guidelines for occupational and general public exposure (ICNIRP, 1998).
Moreover, recommendations for limiting exposure near some of these installations are
proposed, taking into account the proposed regulations of the European directives (European
Parliament 2004, 2008; Bolte and Pruppers 2006). As access for researchers to these systems
is very difficult (permission of air control organizations is needed), this study will give a
unique insight about occupational and general public exposure due to these systems.
To our knowledge, only very limited procedures for exposure assessment in the vicinity of
most ATC systems have been developed up to now. Concerning exposure assessment for
ATC systems mainly radars are investigated (Tell and Nelson 1974; Tell 1977; Mantiply et al.
1997; Jokela and Puranen 1999). Mantiply et al. (1997) summarizes electromagnetic fields in
general and in work environments (also radars). In Jokela and Puranen (1999), occupational
exposures of radars and broadcast antennas are discussed. Also Mild (1981) investigates RF
electromagnetic fields in Swedish radio stations and tall frequency modulation (FM
radio)/television FM/TV towers. High fields are measured in the vicinity of the transmitters

and near metallic structures. Schanker (2003) discusses measurements to determine the
radiation resistance of top-loaded monopoles operating at 190 – 535 kHz and used for NDBs.
Finally, Mild et al. (2009) identifies problems and possible solutions when applying
(European Parliament 2004, 2008) and assessing occupational exposure. Among other
sources, radars and broadcasting systems are identified in Mild et al. (2009) as sources of EM
field exposure at the workplace.
II. MATERIALS AND METHODS
A. Overview of considered ATC systems
Table 1 provides a short description of their purpose related to air traffic control. Table 2
summarizes the different EM sources (ATC systems), their main characteristics and the used
frequencies. Also the different abbreviations are explained in a footnote below Tables 1 and 2.
Fourteen types of ATC systems are here identified and categorized according to their
functionality. The following sources of EM radiation are considered:
category I ―Communication‖: (i) VHF/UHF-transmission centers and (ii) trunking
antennas
category II ―Navigation‖: (iii) ILS (GP, LOC, markers), (iv) NDB, (v) DME, (vi)
VOR, and (vii) radiolink
category III ―Surveillance‖: (viii) primary radar, (ix) secondary radar, (x) surface
radar, (xi) multilateration, (xii) microwavelink, and (xiii) beacons
category IV ―Meteo‖: weather radar (xiv)
For each type of source, mostly 3 to 5 sites (installations) are investigated. In total 50 sites and
1073 locations are considered (Table 2). The functionality of the ATC equipment is shortly

explained in Table 1 (Helfrick 2004). In category I ―communication‖, installations for
communications and control with airplanes are included. Category II ―navigation‖ contains
equipment for radio guidance and positioning of airplanes. Category III ―surveillance‖
contains radars for scanning and detecting airplanes. Finally, category IV ―meteo‖ consists of
a weather radar.
For confidentiality and security reasons no further details about the locations of the sites will
be given. The measurements were executed from January 2010 until February 2011.
B. Measurement equipment
1) NDB
The fields are measured using an (isotropic) electric- and magnetic-field analyzer of type PMM
EHP-200 (http://www.pmm.it, Narda Safety Test Solutions,Via Leonardo da Vinci, 21/23—
20090 Segrate, Milano, Italy). The maximal frequency range setting of the PMM EHP-200
probe is 9 kHz up to 30 MHz. The detection ranges are 0.6 mA/m – 300 A/m for the magnetic
field and 0.02 – 1000 V/m for the electric field. The expanded measurement uncertainty is
smaller than 23.4 % (Joseph et al 2011). The fields are also measured using a broadband probe
of type PMM 8053 (measurement equipment) – EP330 (measurement probe) with a dynamic
range of 0.3 - 300 V/m and a frequency range of 100 kHz to 3 GHz, to identify the locations
of maximal fields.
2) UHF-VHF/ILS/DME/DVOR
The measurement setup consists of tri-axial Rohde and Schwarz TS-EMF Isotropic Antennas
(dynamic range of 1 mV/m – 100 V/m for a frequency range of 70 MHz – 3 GHz, and
2.5 mV/m – 200 V/m for a frequency range of 2 GHz – 6 GHz) in combination with a

spectrum analyzer (SA) of type Rohde and Schwarz FSL6 (frequency range of 9 kHz –
6 GHz) (http://www2.rohde-schwarz.com, R&S Belgium, Excelsiorlaan 31 1930 Zaventem
Belgium). The measurement uncertainty is ± 3 dB for the considered setup (CENELEC 2008).
This uncertainty represents the expanded uncertainty evaluated using a confidence interval of
95 % (thus estimated at the level of twice the standard deviation, corresponding in the case of
a normal distribution, to a confidence level of 95 %). Again, the same broadband probe is
used to identify locations of maximal fields.
3) Radars: PSR, SSR, surface radars (MSR, ASDE), microwave links
The measurement setup is similar as the one described above, but consists for frequencies above
6 GHz also of an omnidirectional Rohde and Schwarz HF907OM antenna for large frequency
bands (frequency range of 800 MHz – 26.5 GHz and maximal input power of 10 W – 50 W)
in combination with a spectrum analyzer (SA) of type FSEM Rohde and Schwarz (frequency
range of 20 Hz – 26.5 GHz).
For the radars and microwave links, locations of maximal fields are identified using broadband
probes of type PMM 8053 (measurement equipment) – EP330 and Narda 2600 Probe 338
(measurement probe) with a dynamic range of 0.8 - 800 V/m and a frequency range of 1 MHz
to 40 GHz.
C. Measurement procedure
Short-term or spot measurements to assess exposure at different locations are performed. The
following steps are repeated for the assessment of exposure near and around all the considered
types of installations.

1) Selection of sources per category
For each category relevant sources are selected for the experimental assessment; these are
typical examples of the different ATC installations and sources in ―sensitive‖ environments
(i.e., sources in areas outside the perimeters of the airport, where the general public can get
relatively close to them). Table 2 summarizes the number of installations investigated for each
type of source.
2) Selection of measurement locations
The locations of the measurements are determined in three ways: locations where workers are
(often) present (selected in collaboration with the workers: e.g., at control panel, near
antenna), locations where a maximal value in an area was observed with the broadband probe,
and locations where the general public is present (e.g., houses in the neighborhood of the
source). The locations of the high field values at the site under consideration are identified
through sweeping the area with the broadband probe (Joseph et al. 2002).
3) Spectral survey with spectrum analyzer
The frequency spectrum of the magnetic and electric fields is first determined at the
considered site. Figures 1 (a) and (b) show a typical spectral overview of the electric field
from 80 MHz to 3 GHz and from 3 GHz to 24 GHz at an airport site. This figure will be
discussed in detail in Section III.C. After allocating the present signals by this spectral survey,
the signals are measured more in detail. For NDB (working around 300 kHz), spectral
measurements from 9 kHz up to 30 MHz are performed.
4) Narrowband measurement
Narrowband measurements of electric fields E and magnetic fields H are executed. This setup
for narrowband measurements (Joseph et al 2011, using the equipment described above)

enables accurate assessment of in-situ exposure from various sources (CENELEC 2008;
IEC 2010). Optimal settings are used for the narrowband measurements as discussed in
Verloock et al. 2010 and Joseph et al. 2012. The rms (root mean square) detector mode in
combination with the maximum-hold (―max-hold‖) mode is used. The analyzer’s max-hold
setting retains the maximum measured values during a time interval until the field analyzer
reading stabilizes. The measurement probe is positioned at 1.5 m above the ground
(CENELEC 2008; ECC 2004).
5) Duty cycle
During the max-hold measurements, all signals are assumed to be present continuously. This
results in an overestimation of the exposure for non-continuous signals (such as VHF signals
from UHF/VHF transmission centers, radar signals, etc.). By applying a duty cycle for the
non-continuous signals, realistic electric field strength values can be determined. The duty
cycle expresses the presence (active time) of a certain signal. On the one hand, the duty cycle
is assessed experimentally and on the other hand it is determined from ATC data and
specifications. A worst-case approach was used: duty cycles were determined for realistic
worst-case conditions. Table 2 lists the duty cycles obtained for the investigated installations.
For radars also max-hold measurements are performed. Because radar signals are pulsed, the
peak power of the pulse is measured in this way and the corresponding peak value of the
electric field Epk. Using the measured peak value and the duty cycle D (i.e., the ratio of the
pulse duration and the period = 1/PRF, with PRF Pulse Repetition Frequency), the rms
exposure Erms,omni can be calculated as follows:
durationpulsePRFD (1)

pkomnirms EDE , (2)
With omni representing omnidirectional, i.e., not accounting for the far-field characteristics of
the radar. Furthermore, the radar rotates with a small azimuthal beam. For locations in the far
field (
22 antennaDR
,with Dantenna, the largest dimension of the antenna and λ the wavelength)
of the radar, the rms value (max-hold measurement) has to be rescaled with a duty cycle.
Using the half-power (3 dB) beam width of the radar (beam), the duty cycle (Tbeam) of
exposing a location in the far field can be calculated as follows:
360
)(BeamTbeam
(3)
The rms exposure Erms,dir in the far field can then be calculated:
pkbeamomnirmsbeamdirrms EDTETE ,, (4)
For locations in the near field, the rotation of the radar is not taken into account (distances
smaller than R) and thus Erms,omni is used. We assume thus that the locations are continuously
exposed in the near field.
6) Measurements as a function of distance: minimum distances
Max-hold measurements as a function of distance to the ATC equipment are executed. For
occupational exposure assessment, the considered equipment are control panels, antennas,
cable connections, etc. For general public exposure assessment, measurements as a function
of the distance from the antennas and outside the fence of the different sites are executed.
―Minimum distances‖ are then defined as the distances outside which the electric and
magnetic field levels of the systems do not exceed the ICNIRP reference levels for

occupational and general public exposure, respectively. Uncertainties of the measured field
values should also be taken into account when proposing measures and recommendations.
D. Exposure ratio
To enable a comparison between the different sites we define here the exposure ratio of an
ATC system. The exposure ratio ER is defined as the ratio between the maximal measured
electric field value due to the ATC installation over the considered locations and the
corresponding ICNIRP reference level (occupational, general public):
X
E
iNiX
L
EER
)(max100 ...1 (%) (5)
With X = occupational (occ.) or general public (gen.) exposure, max() the maximum value
over N locations (N in Table 2), Ei the field strength of the ATC signal at location i, LE the
corresponding ICNIRP reference level for electric-field strength in V/m, respectively. A ratio
smaller than 100% means that the ICNIRP reference levels are satisfied. We compare here
compliance with the guidelines of (ICNIRP 1998) as a lot of countries based their laws and
exposure limits on these guidelines.
III. RESULTS AND DISCUSSION
A. General overview of measurements
Table 3 lists the maximal and average measured electric-field strengths Emax and Eavg (V/m)
for all installations of all types of ATC systems, both for occupational and general public
exposure. Also the exposure ratios ERX (X = occ. or gen.) are listed. Systems where the field
levels exceed the reference levels are indicated in bold (ER > 100%). Most systems are
compliant with the ICNIRP reference levels except NDB and DVOR installations, for which

minimum distances are defined. The reference levels are not exceeded for locations accessible
to the general public.
Figure 2 summarizes the ranges of electric field strengths and investigated frequency bands
for all 14 ATC installations for occupational and general public exposure. A data set is shown
as a rectangle, its boundaries give the frequency and ranges of field strengths (maximal and
average values are listed in Table 3).
1) Communication
Measured electric-field values of VHF/UHF transmission centers satisfy the ICNIRP
guidelines (ICNIRP 1998). The maximal total field value for locations where workers are
present equals 21.1 V/m (Table 3, Figure 2), this is 35% of the ICNIRP reference levels for
occupational exposure. For the general public maximal field levels of 8.0 V/m (28 % of the
ICNIRP reference levels) are measured. Fields vary from 0.17 to 21.1 V/m for occupational
exposure and from 0.007 to 8.0 V/m for general public exposure. The average of the total
values for all locations equals 5.2 V/m for workers and 0.7 V/m for general public. For
general public exposure, field values of the same order are obtained due to broadcasting. In
Mantiply et al. (1997), typical exposures of radio and TV broadcast of 0.1 V/m are reported.
Tell and Mantiply (1980) obtained a median exposure level of 0.005 µW/cm2
(1.5 mV/m). For
occupational exposure, higher values are reported for broadcasting as no duty cycles are
present and broadcast transmitters often have higher powers than the transmission centers for
ATC. Mild (1981) measured high fields in the vicinity of the transmitters; the values were
lower than 250 W/m2 (307 V/m) from 0.3 - 0.5 m from the nearest metallic structure.
For trunking the maximal rms value is 0.3 V/m, 0.5% of the ICNIRP reference levels for
occupational exposure and 1.1% for general public exposure.

2) Navigation
The maximal measured rms field for ILS systems is 17.7 V/m, about 30% of the ICNIRP
guidelines for occupational exposure (Table 3, Figure 2). At public locations, the maximal
measured value is 1.7 V/m (ER = 6%). In literature, no exposure assessment of these systems
was found.
For occupational exposure due to NDB, the maximal electric field (rms) value is 881.6 V/m
(site 2), 1.4 times above the reference levels (ICNIRP, 1998) (ER varies from 129 to 144% for
all sites, Table 3 and Figure 2). The maximum electric fields exceed the reference levels at all
investigated NDB sites. The average of the total values for all locations equals 379.2 V/m for
occupational exposure and 9.3 V/m for general public exposure. As field values exceed the
reference levels, it is needed to provide minimum distances (see further). At public places
(general public exposure), the maximal rms electric field is 33.6 V/m, which is 39% of the
reference values for general public.
For radiolinks, the maximal measured rms field is 0.8 V/m, 1.2% of the ICNIRP guidelines
for occupational exposure. At public locations the maximal measured value is 0.2 V/m
(ER = 0.6%).
Occupational exposure due to DVOR systems exceeds the reference levels with a factor 1.5,
maximally 92.3 V/m is obtained. RE varies in Table 3 from 92-143%, again minimum
distances will be provided. At public locations, maximally 0.4 V/m is obtained (1.3% of
ICNIRP).
For DME the maximal measured value is equal to 20.5 V/m, 21.5% of ICNIRP for
occupational exposure. At public places 1.2 V/m is measured, 2.6% of ICNIRP. No

comparison can be made with other studies as to our knowledge this is the first study
investigating exposure due to systems as DVOR, DME, etc.
3) Surveillance
All systems within this category satisfy the ICNIRP reference levels for workers and general
public as shown in Table 3. It has to be mentioned that for all radar systems already sensors
are installed that deactivate the radar antenna when entering the roof of the radar tower. Thus,
presence of workers on the roof with active radar is not possible. Therefore, for primary
radars PSR, rms values of maximally 51.2 V/m (occupational, ER = 37.4%, Figure 2) and
16.3 V/m (general public, ER = 26.8%) are measured. For secondary radars SSR, maximally
17.2 and 0.7 V/m are obtained for occupational and general public exposure, respectively.
Mantiply et al. (1997) discusses exposure to pulsed radars: for a typical air traffic radar, a 1-μs
pulse is transmitted every 1000 μs. Also, the antenna rotates and the horizontal width of the
beam is about 3o, resulting in a duty factor of 3/360 = 0.0083 for a full rotation. Therefore,
peak fields are much higher than rms values. Here, the primary radars PSR use beams of 1.05
– 1.4o and a PRF (Pulse Repetition Frequency) of 456 to 1136 Hz while the secondary radars
SSR have beams of 2.4o and PRF = 76 – 280 Hz. Mantiply et al. (1997) and Tell and
Nelson (1974) mention electric field strengths at 200-600 m from the air traffic radars (1.3 or
2.8 GHz) from 57 mV/m rms (or 4.7 V/m peak) to 2.5 V/m rms (or 960 V/m peak). We obtain
values of the same order of magnitude in Table 3 and Figure 2: on average up to 2.6 V/m and
0.1 V/m and maximally 16.3 V/m and 0.7 V/m rms for PSRs and SSRs for general public
exposure, respectively.
Also surface radars (9 and 16 GHz) satisfy the ICNIRP guidelines with maximal values of
0.8 V/m (occupational) and 0.2 V/m (general public). Electric field strengths (rms) ranging

from 10 to 64 mV/m from radars operating from 1.3 to 9.5 GHz are measured at three
randomly chosen sites in the San Francisco area (general public) (Tell 1977; Mantiply et al.
1997). We obtained comparable maximal values of 30 mV/m to 150 mV/m for the surface
radars operating around 9 and 16 GHz (Table 3).
For microwave links, maximally 23 V/m (rms, ER = 16.8%) is obtained. Here, only
occupational exposure is assessed (Table 3, Figure 2 (a)) at places accessible for workers.
Exposure due to multilateration systems is maximally 52.1 V/m (workers) and 2.0 V/m
(general public), while beacons caused maximally 0.5 V/m (workers) and 0.4 V/m (general
public). Again all values satisfy the ICNIRP reference levels.
4) Meteo
Table 3 shows that the maximal measured fields due to the weather radar (for lowest elevation
angles or tilts, see further) are 9.7 V/m (workers) and 2.7 V/m (general public). This is 7 and
4% of the ICNIRP reference levels, respectively. The weather radar scans both in azimuthal
direction and in elevation (3D scanning) with tilts from 0.5 to 35 degrees. At each
measurement location (1.5 m above ground or floor level), exposure is assessed for the
different tilt angles. Figure 3 shows the variation of the electric-field exposure versus the
radar tilts at four different locations. Highest field levels are obtained for the lowest tilts
(< 5 degrees). This is expected as for lowest tilts the weather radar radiates more towards
ground level. Lowest field levels are measured at a 35° tilt angle.
B. Minimum distances
For most types of ATC equipment no minimum distances have to be defined. In the
following, installations requiring safety distances and typical examples will be discussed.

1) Communication
In Joseph et al. 2012c, the field levels due to the VHF antennas as a function of distance in the
neighborhood of the transmission centers for general public are provided. Field values
decrease with increasing separations from the transmission centers. The correlation between
field levels and distance is equal to -0.71 and is significant at a 5% value (p-value of 8.7∙10-7
).
So distance can here be used as a metric to obtain values lower than a certain threshold in the
near environment of the transmission centers.
2) Navigation
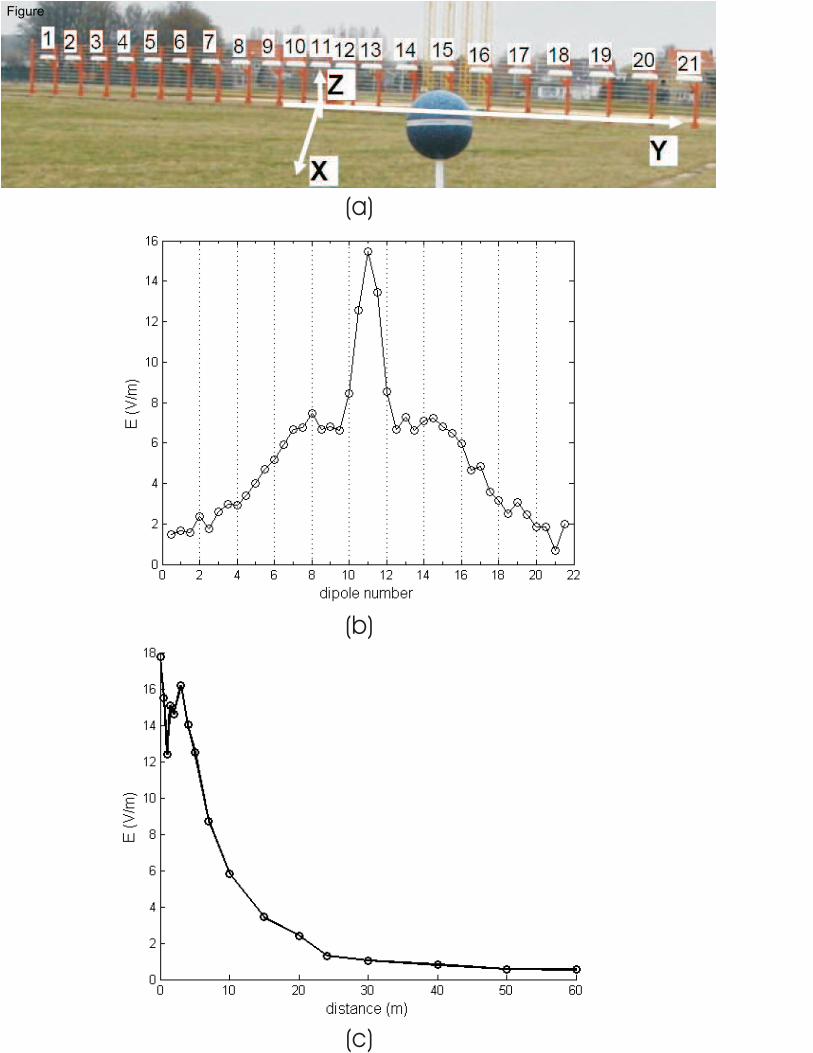
Figure 4 (a) shows a picture of ILS localizer (LOC), consisting of 21 dipoles. Also the (x, y,
z) axes are indicated. The maximal electric field values are measured in front of the LOC
(using a broadband probe), as shown in Figure 4 (b) (at 50 cm along y-axis). The maximal
field levels can be noticed at dipole 11 (middle of LOC). Then measurements as a function of
distance to the localizer are executed along to the x-axis (Figure 4) starting from the
maximum at the middle of the LOC. Figure 4 (c) shows the electric field due to the ILS LOC
as a function of the distance (x-axis). Fields are maximally 17.7 V/m at x = 0 m and 16.2 V/m
at x = 3 m. After this distance the fields decrease again. Figures 4 (b)-(c) show that the
radiation pattern of the dipole array of the localizer causes maximal values in the middle
(y = 0 m, x = 0 m) and at distance x = 3 m.
The minimum distances from the NDB antenna for occupational and general public exposure
are investigated in Joseph et al. 2012b. Minimum distances for workers of 0.5 m from NDB
cable connections and 1.6 m from the NDB antenna are advised in Joseph et al. 2012b. For the
general public, minimum distances up to 10.6 m from the NDB antenna are advised.

Figure 5 (a) shows a picture of the raster of a DVOR with part of the circular array of
antennas. Measurements as a function of the distance along the x-axis from the origin (center
of DVOR and central DVOR antenna) are performed and shown in Figure 5 (b). The rms
values are compared with the ICNIRP reference level of 61 V/m (workers). A minimum
distance of 83 cm is obtained for workers in Figure 5 (b). For the different DVORs minimum
distances from 27 cm up to 1 m are obtained.
3) Surveillance
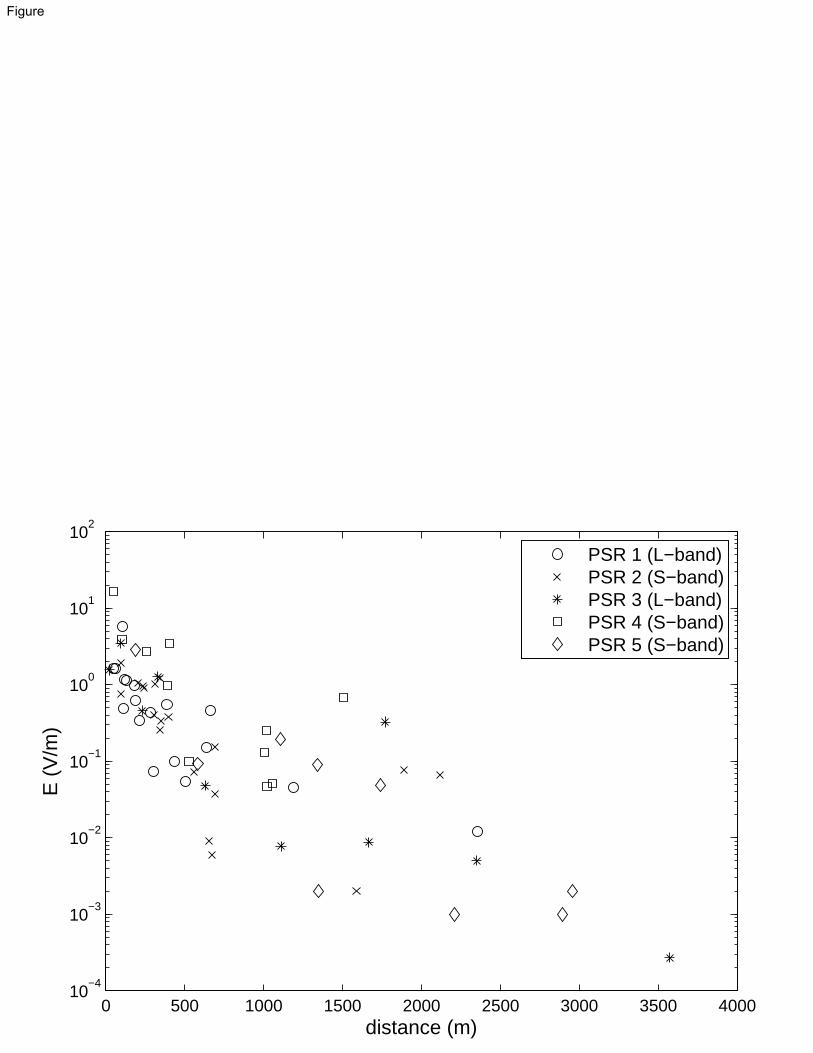
In Figure 6 the field levels due to the primary radars as a function of distance for general
public are shown (L-band: 1200-1400 MHz, S-band: 2700-2900 MHz). Field values decrease
with increasing separations from the PSRs. The correlation between field levels and distance
is equal to -0.80 and is significant at a 5% value (p-value of 3.1·10-16
). All values satisfy the
reference levels, so no minimum distances have to be defined.
C. Cumulative measurements
In this section cumulative exposure of all present sources at an airport site is investigated. We
want to determine here whether the individual ATC source dominates the total exposure in its
neighborhood and whether other sources have to be taken into account to characterize the
exposure near and around an ATC source. Figures 1 (a) and (b) show a typical spectral
overview of the electric field from 80 MHz to 3 GHz and from 3 GHz to 24 GHz. At this
position the signals of the primary radar PSR dominate the exposure (S-band, 2700 MHz or
2800 MHz). Other present signals in Figure 1 (a) are FM (frequency modulation; FM radio),

VHF (transmission center), T-DAB (Terrestrial-digital audiobroadcasting), TETRA
(terrestrial trunked radio access), trunking, DVB-T (digital video broadcasting – terrestrial at
480 MHz, 505 MHz, 625 MHz, 650 MHz, 672 MHz, and 750 MHz), GSM900 (Global
System for Mobile Communications at 900 MHz), DME (960 - 1215 MHz), MSSR
(monopulse secondary surveillance radar) (1030 MHz), PSR in L-band (1200 - 1400 MHz),
GSM1800 (GSM at 1800 MHz), UMTS (Universal Mobile Telecommunications System).
Figure 1 (b) shows the ATC sources from 3 GHz to 24 GHz; weather radar (5620 MHz) and
surface radars (surface movement radar (SMR) around 9 GHz and airport surface detection
equipment (ASDE) around 15 GHz). Also satellite and military radio localization systems are
measured. No signal from microwave links is measured, only noise is displayed at 22-
23 GHz.
The maximal measured cumulative (or total) field is 14.8 V/m and satisfies the ICNIRP
guidelines for (cumulative) occupational exposure (ICNIRP, 1998). At this location (only
accessible to workers) the exposure due to the primary radar PSR dominates. At public
locations the maximal measured value is 8.0 V/m. The contribution of each signal to the total
cumulative field is expressed using X:
100.
2
,
,
cumrms
irms
E
EX (%) (6)
With Erms,i the measured rms electric–field strength for the different signals i at a location and
Erms,cum the cumulative rms electric-field value at this location, in V/m. Figure 7 shows the
contributions X of the different electromagnetic sources at the 10 considered locations. For
positions 4-6 and 8, the VHF signal of the transmission center is dominant (X varies from
81.1% to 99.8%), while at positions 2, 3, and 7, the primary radar dominates the total
exposure with values of X from 65.1 to 97.9%. FM is measured at all locations with
contributions of more than 20% at locations 1, 7, 9, and 10.
Figure 7 shows that in the near environment (about 500 m or less from the airport site) of an
ATC source the cumulative field is indeed dominated by the ATC source. Only at positions 1
(outside the radiation sector of a surface radar) and position 9 and position 10 (far from all
ATC sources) FM dominates the exposure. To assess human exposure of all present EMF
sources, these (time-consuming) cumulative measurements should be performed in
combination with (faster) broadband measurements for compliance assessment.
D. Recommendations
In this section recommendations for workers and the general public near NDB stations are
provided. These are useful for air control organizations and authorities (Bolte and Pruppers
2006). For most ATC installations (VHF/UHF, trunking, ILS, DME, radiolink, radars,
multilateration, microwave links, beacons, weather radar) no additional measures are needed
as the ICNIRP reference levels for workers and the general public are satisfied. The following
additional measures are needed:
• A safety distance for workers of 1 m from the central DVOR antenna is advised for
occupational exposure. A fence should be installed around the antenna. When
adjustments to the antenna have to be made, the antenna should be switched off.
• A safety distance for workers of 1.6 m from the NDB antenna and 0.5 m from NDB
signal cable connection is advised for occupational exposure. For the general public a
safety distance of 10.6 m is advised. A fence should be installed around the antenna

(e.g., at 1.6 m for workers and at 10.6 m for the general public). When adjustments to
the antenna have to be made, the antenna should be switched off.
• For NDB, the field levels exceed mostly the reference levels for opened control panel
inside the control house. The control panels allow workers to adapt the NDB
installation’s parameters such as powers, frequency, etc. When closed, these field
values are much lower (Joseph et al. 2012b) and satisfy the ICNIRP reference levels.
Therefore it is advised to install controllers on the panel to enable control by workers
with closed panel.
• Different ATC installations should not be entered by visitors (general public), as the
reference levels of ICNIRP for the general public can be exceeded near the antennas of
these installations (e.g., minimum distances from the NDB antenna up to 10.6 m are
possible). Examples of such installations are NDB, DVOR, roof of radars and weather
radar, multilateration.
• For radar towers, sensors which switch off the radar when entering the roof (where the
radar antenna is placed) are often installed. These are very important as fields near the
radar antenna might exceed reference levels.
• If possible, the power of some transmitters could be lowered (NDB, DVOR). This is
not always possible as certain field levels have to be realized to ensure safe air traffic
navigation.
IV. CONCLUSIONS
Electromagnetic field exposure (occupational and general public) to 14 types of air traffic
control (ATC) systems is investigated. Measurement methods are proposed for in-situ

exposure assessment of these ATC systems. In total 50 sites are investigated at in total 1073
locations in the frequency range of 255 kHz to 24 GHz. For all installations typical and
maximal exposure values for workers and the general public are provided. For NDB and
DVOR systems minimum distances outside which the field levels of the systems do not
exceed the ICNIRP reference levels should be respected. Cumulative exposure of all present
RF sources is investigated and it is concluded that the ATC source dominates the total
exposure in its neighborhood.
Future research could also consist of performing more measurements, to increase the current
set of in-situ exposure evaluations of ATC systems. Further research is needed by executing
measurements or simulations of basic quantities to investigate compliance of NDB and
DVOR systems with the basic restrictions.
REFERENCES
Bolte J and Pruppers M. Electromagnetic Fields in the Working Environment. Ministry of
Social Affairs and Employment (SZW) report; 2006 Available at
http://www.rivm.nl/bibliotheek/rapporten/610015001.pdf Accessed 5 April 2011.
CENELEC European Committee for Electrotechnical Standardisation. TC 106x WG1 EN
50492 in situ. Basic standard for the in-situ measurement of electromagnetic field
strength related to human exposure in the vicinity of base stations. Avenue Marnix
Brussels Belgium: CENELEC; 2008.
Electronic Communications Committee (ECC). Electronic Communications Committee
within the European Conference of Postal and Telecommunications Administrations
(CEPT), 2004, ECC recommendation (02)04 (revised Bratislava 2003, Helsinki 2007)
Measuring non-ionising electromagnetic radiation (9 kHz – 300 GHz); 2004.
Available at: http://www.ero.dk Accessed 23 November 2011.
European Parliament and Council of the European Union. Directive 2004/40/EC of the
European Parliament and of the Council of 29 April 2004 on the minimum health and
safety requirements regarding the exposure of workers to the risks arising from
physical agents (electromagnetic fields) (18th individual Directive within the meaning
of Article 16(1) of Directive 89/391/EEC). Off J Eur Comm L184(1); 2004.
European Parliament and Council of the European Union. Directive 2008/46/EC of the
European Parliament and of the Council of 23 April 2008 amending Directive
2004/40/EC on minimum health and safety requirements regarding the exposure of
workers to the risks arising from physical agents (electromagnetic fields) (18th
individual Directive within the meaning of Article 16(1) of Directive 89/391/EEC).
Off J Eur Comm L114: 88-89; 2008.
Helfrick A. Principles of Avionics, Third Edition Leesburg, VA, USA: Avionics
Communications Inc.; 2004.
International Electrotechnical Commission (IEC). Determination of RF field strength and
SAR in the vicinity of radiocommunication base stations for the purpose of evaluating
human exposure, 1st ed. Rue de Varembé Geneva Switzerland: International
Electrotechnical Commission IEC 62232; 2010.
International Commission on Non-ionizing Radiation Protection (ICNIRP). Guidelines for
limiting exposure to time-varying electric, magnetic, and electromagnetic fields (up
300 GHz). Health Phys 74(4):494-522; 1998.

International Commission on Non-ionizing Radiation Protection (ICNIRP). Guidelines for
limiting exposure to time-varying electric and magnetic fields (1 Hz to 100 kHz) (up
300 GHz). Health Phys. 99(6): 818-836; 2010.
Jokela K and Puranen L. Occupational RF exposures. Radiation Protection Dosimetry 83( 1–
2):119–124; 1999.
Joseph W, Vermeeren G, Verloock L, and Goeminne F. In-situ magnetic field exposure and
ICNIRP based safety distances for electronic article surveillance systems‖, Radiation
protection dosimetry, ID: NCR206 doi 10.1093/rpd/NCR206 1- 8; 2011.
Joseph W, Verloock L, Goeminne F, Vermeeren G, and Martens L. Assessment of RF
exposures from emerging wireless communication technologies in different
environments. Health Phys 102(2): 161-72; 2012.
Joseph W, Goeminne F, Vermeeren G, Verloock L, and Martens L. In-situ occupational and
general public exposure to non-directional beacons for air traffic control.
Bioelectromagnetics, in press; 2012b.
Joseph W, Goeminne F, Vermeeren G, Verloock L, and Martens L. In-situ occupational and
general public exposure to vhf/uhf transmission for air traffic communication. Radiation
protection dosimetry 2012: ID: doi:10.1093/rpd/ncs016 1–9; 2012c.
Joseph W, Olivier C, Martens L. A Robust, Fast and Accurate Deconvolution Algorithm for
EM-field Measurements around GSM and UMTS base stations with a spectrum analyzer.
IEEE Trans. Instr. Meas. 51(6): 1163 – 1169; 2002.
Mantiply E, Pohl K, Poppell S, Murphy J. Summary of measured radiofrequency electric and
magnetic fields (10 kHz to 30 GHz) in the general and work environment.
Bioelectromagnetics 18(8): 563–577; 1997.

Mild KH. Radiofrequency electromagnetic fields in Swedish radio stations and tall FM/TV
towers. Bioelectromagnetics 2(1): 61–69; 1981.
Mild KH, Alanko T, Decat G, Falsaperla R, Gryz K, Hietanen M, Karpowicz J, Rossi P,
Sandström M. Exposure of Workers to Electromagnetic Fields. A Review of Open
Questions on Exposure Assessment Techniques. International Journal of Occupational
Safety and Ergonomics (JOSE) 15(1): 3–33; 2009.
Schanker J. Field Measurement and Verification of the Radiation Resistance of a 18.3 m Top-
Loaded Monopole Antenna Operating at 190-535 kHz. IEEE Antennas and Propagation
Magazine(45)4: 62-65; 2003.
Verloock L, Joseph W, Vermeeren G, and Martens L. Procedure for assessment of general
public exposure from WLAN in offices and in wireless sensor network testbed. Health
Physics 98(4): 628-638; 2010.
Tell RA, Nelson JC. RF Pulse Spectral Measurements in the Vicinity of Several Air Traffic
Control Radars. Silver Spring, Maryland: U.S. Environmental Protection Agency EPA-
520/1- 74-005; 1974.
Tell RA. An Analysis of Radar Exposure in the San Francisco Area. Las Vegas, Nevada: U.S.
Environmental Protection Agency ORP/EAD-77-3; 1977.
Author affiliations
Wout, Joseph*, Francis, Goeminne*, Günter Vermeeren*, Leen, Verloock*, and Luc,
Martens*
*Department of Information Technology, Ghent University / IBBT
Gaston Crommenlaan 8, B-9050 Ghent, Belgium, fax: +32 9 33 14899
(email:[email protected])
Acknowledgement: W. Joseph is a Post-Doctoral Fellow of the FWO-V (Research Foundation
- Flanders).

List of captions
TABLE 1: Functionality of ATC equipment.
TABLE 2: Characteristics of the investigated ATC systems, number of sites, and measurement
positions.
TABLE 3: Maximal and average electric-field strengths (V/m) and exposure ratios for the
different ATC installations for occupational and general public exposure.
Figure 1: Spectral overview of the electric field in the frequency range of (a) 70 MHz to
3 GHz and (b) from 3 GHz to 24 GHz.
Figure 2: Ranges of electric field strengths for all 14 ATC installations for (a) occupational
and (b) general public exposure.
Figure 3: rms-electric field levels due to the weather radar as a function of the radar tilt
(elevation angles) at different locations.
Figure 4: (a) Picture of ILS localizer (LOC) with indication of 21 dipoles, (b) maximal
measured electric field values in front of the different dipoles of the LOC (along x-axis), and
(c) rms electric-field strength of ILS LOC along x-axis (y = 0 and z = 1.5 m).
Figure 5: (a) Picture of raster of DVOR with circular antenna array and (b) rms electric-field
strength of central DVOR antenna versus distance (along x-axis).
Figure 6: rms electric field of primary radars as a function of distance (L-band: 1200-
1400 MHz, S-band: 2700-2900 MHz).
Figure 7: Comparison of the contribution of the different RF sources at the considered
positions.

Table 1 Functionality of ATC equipment. Category and EM source description
I Communication
(i) VHF/UHF
(ii) Trunking
For voice communication with aircraft, located on and near each airport. The main purpose is to prevent aircraft
collisions, to organize the flow of traffic, and to provide support for pilots.
Trunking is radio communication based on the TETRA (Terrestrial Trunked Radio) standard.
II Navigation
(iii) ILS – GP, LOC, Markers
(iv) Radiolink (UHF)
(v) NDB
(vi) DME
(vii) VOR
ILS (Instrument Landing System) for precision approachment to a runway. An ILS consists of a Localizer (LOC) for lateral guidance and a Glide Path Beacon (ILS-GP) for vertical guidance to the aircraft approaching a runway. Also ILS
Markers are part of the ILS, namely Outer Marker, Middle Marker, and Inner Marker.
Radiolink is responsible for data communication (e.g., status updates ILS).
The NDB (Non-Directional Beacon) system is used for navigation and consists of NDB beacon transmitters on the
ground and the Automatic Direction Finder (ADF) on the aircraft.
DME (Distance Measuring Equipment): this system determines the distance between the airplane and the runway.
VOR (VHF Omni-directional Range): is an accurate radio navigation equipment for aviation.
III Surveillance
(viii) Primary radar
PSR L-band
PSR S-band
(ix) Secondary radar (SSR)
(x) Surface radar (SMR, ASDE)
(xi) Multilateration system
(xii) Microwave link
(xiii) Beacon (transponder)
Radar (”RAdio Detection And Ranging”): two types of radars can be identified namely primairy radars (Primary
Surveillance Radar PSR) and secondary radars (Secondary Surveillance Radar SSR). Primairy radars are radars where
the receiver the reflection of transmited signal on the object (e.g., the airplane) receives. Secondary radars are radars
where the received signal is not a part of the transmitted signal but a signal that is transmitted by the object (airplane). Surface radars (ASDE, SMR) are short-range radars, often placed on a control tower, to scan the lower layers of air and
movement on the ground.
Multilateration or hyperbolic positioning is used to determine accurately the location of an object by calculation of the
TDOA (Time Difference Of Arrival) of a signal of the object with 3 or more synchronized receivers.
Microwavelink: this is a communication system using a bundle of waves to transmit data, video, and audio between two
locations in the microwave frequency range (for ATC typically 22-23 GHz)
A beacon is a transmitter at 1090 MHz. The pulsed signal has the same characteristics as the transponders in airplanes.
For a secondary radar, two beacons are present.
IV Meteo
(xiv) Weather radar
A weather radar is used to locate rain, snow, hail, etc. (called precipitation) and calculate its motion, type, and forecast the precipitations future position and intensity.
Alphabetical order: ASDE: airport surface detection equipment, DME: Distance Measuring Equipment, GP: Glide Path, ILS: instrument Landing System, LOC: localizer, NDB:
Non-Directional Beacon, PSR: primary surveillance radar, VOR: VHF Omnidirectional Ranging, VHF/UHF: Very High Frequency/Ultra High Frequency, SMR: surface movement radar, SSR: secondary surveillance radar
Table

Table 2 Characteristics of the investigated ATC systems, number of sites, and measurement
positions.
category and EM source frequency band no. sites no. meas
locations
characteristics
power, duty cycle D, duration T
I Communication
(i) VHF/UHF
(ii) Trunking
118 - 137 MHz
225 – 400 MHz
410 -430 MHz
4
3
74
75
43-47 dBm, cw and D = 29 %
(worst-case)
428 MHz, 33 dBm, cw
II Navigation
(iii) ILS
ILS – GP
ILS – LOC
ILS Markers
(iv) NDB
(v) DME
(vi) VOR (vii) Radiolink (UHF)
328 – 335 MHz
108 – 112 MHz
75 MHz
255 – 526.5 kHz
960 – 1215 MHz
108 – 118 MHz 440 – 460 MHz
5
1
1
3
7
6
3 3
116
28
27
61
168
165
60 56
GP: 47.3 dBm
LOC: max. 61 dBm
Markers: 41.5 dBm
50 dBm, cw
27-68 dBm, T = 3.5 μs,
D = 3.4 %
52.5 dBm, cw 43.6-44.3 dBm, D = 16-32 %
III Surveillance (viii) Primary radar
PSR L-band
PSR S-band
(ix) Secondary radar (SSR)
(x) Surface radar (SMR,
ASDE)
(xi) Multilateration system
(xii) Microwave link
(xiii) Beacon (transponder)
1200 -1400 MHz
2700 – 2900 MHz
1030 & 1090 MHz
9170 & 9437.5,
15700-16200 MHz
1030 & 1090 MHz
22134 & 23142 MHz
1090 MHz
5
4
2
3
3
1
104
82
45
34
46
14
72-94 dBm T =1-2 μs,
D= 0.09-7.5 %
38-61 dBm, D = 0.02 - 60 %
64-74 dBm, T =0.04 μs,
D = 0.02-0.07 %
52-55 dBm, D = 100%
20 dBm, cw
50 dBm, D = 100 %
IV Meteo
(xiv) Weather radar
5620 MHz
1
34
84 dBm, T =1- 2.5 μs
D = 0.06-0.12 %
total
50 1073
Alphabetical order: ASDE: airport surface detection equipment, cw: continuous wave, DME: Distance Measuring Equipment, D = duty cycle, GP: Glide Path, ILS: instrument Landing System, LOC: localizer, NDB: Non-Directional Beacon, PSR: primary surveillance radar, PRF: Pulse Repetition Frequency, VOR: VHF Omnidirectional Ranging, VHF/UHF: Very High
Frequency/Ultra High Frequency, SMR: surface movement radar, SSR: secondary surveillance radar, T = Pulse duration
Table

Table 3 Maximal and average electric-field strengths (V/m) and exposure ratios for the different
ATC installation for occupational and general public exposure.
Category and EM source maximal value of Emax over
locations (V/m), rms
Eavg (V/m), rms ER
(%)
occ gen occ gen occ gen
I Communication
(i) VHF/UHF
1.
2.
3.
(ii) Trunking
1.
2.
3.
4.
21.07
0.45
5.59
0.33
-
-
-
7.96
0.89
2.23
0.32
0.21
0.05
0.04
6.53
0.45
1.71
0.18
-
-
-
0.95
0.24
0.43
0.13
0.08
0.02
0.01
34.54
0.73
9.17
0.53
-
-
-
28.42
3.17
7.96
1.14
0.75
0.17
0.13
II Navigation
(iii) ILS
1.
2. 3.
4.
5.
(iv) NDB
1.
2.
3.
4.
5.
6.
7. (v) DME
1.
2.
3.
4.
5.
6.
(vi) VOR
1.
2.
3. (vii) Radiolink (UHF)
1.
2.
3.
17.74
13.14 0.38
9.29
-
863.80
881.60
871.90
879.50
789.70
789.50
835.60
0.87
20.45
1.71
5.28
5.00
2.33
56.35
92.28
87.25
0.79
0.25
0.09
-
- 0.25
0.46
1.73
11.70
33.60
0.60
4.70
-
0.32
28.50
0.01
0.003
-
1.23
0.25
0.25
0.37
0.31
0.19
0.14
0.17
0.14
8.67
4.39 0.22
3.60
-
281.55
484.73
463.99
331.20
288.73
364.82
377.29
0.35
3.48
0.53
2.15
1.47
0.95
23.31
18.96
16.23
0.29
0.12
0.07
-
- 0.06
0.20
0.77
6.27
20.76
0.58
2.82
-
0.32
12.54
0.01
0.003
-
0.27
0.11
0.08
0.24
0.09
0.08
0.03
0.05
0.04
29.08
21.54 0.62
15.23
-
141.61
144.52
142.94
144.18
129.46
129.43
136.98
0.86
21.52
1.70
5.13
4.80
2.26
92.37
151.28
143.03
1.24
0.39
0.15
-
- 0.88
1.63
6.17
13.44
38.61
0.67
5.39
-
0.37
32.77
0.02
0.01
-
2.61
0.53
0.52
1.31
1.09
0.68
0.46
0.56
0.47
III Surveillance
(viii) Primary radar (PSR)
1.
2.
3.
4.
5.
(ix) Secondary radar (SSR)
1.
37.40
19.96
28.19
51.20
12.45
10.25
5.75
1.93
3.50
16.34
2.86
0.64
5.61
6.35
7.31
15.50
3.95
2.41
0.84
0.51
0.72
2.61
0.37
0.14
34.48
14.57
26.01
37.37
9.09
10.67
11.11
3.17
7.01
26.79
4.69
1.44
Table

2.
3.
4.
(x) Surface radar (SMR,
ASDE)
1.
2.
(xi) Multilateration system
1. 2.
3.
(xii) Microwave link
1.
2.
3.
(xiii) Beacon (transponder)
1.
0.11
17.24
0.04
0.15
0.80
52.07 15.99
4.73
23.00
5.98
10.57
0.52
0.04
0.67
0.01
0.13
0.15
1.21 -
1.99
-
-
-
0.38
0.04
0.01
0.02
0.05
0.60
20.06 6.97
1.58
6.00
2.71
3.24
0.23
0.01
0.003
0.003
0.04
0.11
1.06 -
0.77
-
-
-
0.33
0.11
17.96
0.04
0.11
0.58
54.08 16.61
4.91
16.79
4.36
7.72
0.53
0.09
1.52
0.02
0.21
0.24
2.74 -
4.51
-
-
-
0.84
IV Meteo
(xiv) Weather radar
1.
9.70
2.67
4.21
0.86
7.08
4.38
1st column: Roman numbers indicate installation type, arabic numbers indicate the number of system within an installation type bold numbers indicate field levels exceeding the ICNIRP reference levels ER = Exposure ratio = maximal field value/ICNIRP reference level in % occ = occupational exposure; gen = general public exposure

(a)
(b)
Figure

(a)
(b)
Figure

0 5 10 15 20 25 30 351
2
3
4
5
6
7
8
9
10
elevation (degrees)
Erm
s (V
/m)
Position 1Position 2Position 3Position 4
Figure
(b)
(c)
(a)
Figure

(b)
(a)
x
Figure
0 500 1000 1500 2000 2500 3000 3500 400010
−4
10−3
10−2
10−1
100
101
102
E (
V/m
)
distance (m)
PSR 1 (L−band)PSR 2 (S−band)PSR 3 (L−band)PSR 4 (S−band)PSR 5 (S−band)
Figure

0%
10%
20%
30%
40%
50%
60%
70%
80%
90%
100%
1 2 3 4 5 6 7 8 9 10
Position
ASDE
SMR
Weather radar
PSR no. 2
UMTS
DECT
GSM1800
PSR no. 1
MSSR
DME
GSM900
DVB-T
Trunking
TETRA
T-DAB
VHF/UHF
FM
Figure