number 5: the epidemiology of diabetes mellitus in the act
TRANSCRIPT
Health SeriesNumber 5
TheEpidemiology ofDiabetes Mellitus
in the ACT
Carol GilbertChris Gordon
Epidemiology UnitPopulation Health Division
ACT Department of Health and Community Care
July 1996
2
ACKNOWLEDGEMENTS
This publication has drawn on the expertise and knowledge of several individuals and sections within theDepartment of Health and Community Care, the Australian Bureau of Statistics, and the AustralianInstitute of Health.
The authors are particularly grateful to colleagues in the Department of Health and Community Careincluding Dr Bruce Shadbolt, Norma Briscoe and the staff of the Epidemiology Section for their support,advice and patience; the Performance Information Section for providing data; the Diabetes Clinic atWoden Valley Hospital; Public Affairs Section for publishing assistance.
The ACT Division of General Practice and Diabetes Australia also provided valuable advice.
A special thank you to Kelli Mimis for her excellent cover design.
Australian Capital Territory, Canberra 1996
ISSN 1325-1090
This work is copyright. Apart from any use as permitted under the Copyright Act 1968, no part may be reproducedwithout written permission from the Director, Publications and Public Communication, Department of Urban Services,ACT Government, GPO Box 158, Canberra ACT 2601.
Published by Publications and Public Communication for the Department of Health and Community Care'sEpidemiology and Population Health Section and printed by the Authority of Nigel Hardiman, ACT GovernmentPrinter.
200 - 6/96 A4 (96/4284))
Suggested citation: Gilbert C, Gordon C (1996) The Epidemiology of Diabetes Mellitus in the ACT,Epidemiology Unit, ACT Dept of Health and Community Care: Health Series No 5, ACT Government Printer, ACT
3
The Epidemiology of Diabetes Mellitusin the ACT
Table of contents
1. Introduction 51.1 What is diabetes mellitus? 51.2 Overview 51.3 Prevalence of diabetes mellitus in Indigenous Australians 6
2. Mortality 72.1 Age-specific mortality 82.2 Years of potential life lost 8
3. Morbidity 93.1 Division of GPs Diabetes Project 93.2 1989-90 National Health Survey 93.3 Third National Survey of Morbidity in General Practice in Australia 103.4 Hospital morbidity 11
3.4.1 Separations 113.4.2 Re-admissions 123.4.3 Average length of stay 133.4.4 Gestational diabetes, complications of pregnancy and childbirth 14
3.5 Disability and/or reduction in quality of life caused by diabetes 143.5.1 National Health Survey 1989-90 143.5.2 Other research 15
4. Diabetes management strategies 164.1 Medical Outpatients Clinic, Woden Valley Hospital 164.2 ACT Division of General Practice Diabetes Project 174.3 ACT Health Goals and Targets for the Year 2000 194.4 National Action Plan - Diabetes - To the year 2000 and beyond 194.5 Collection of accurate data 19
4.5.1 ACT Hospital Morbidity Collection 194.5.2 The National Health Survey 194.5.3 The ACT Care Continuum and Health Outcomes of Hospital Inpatients Project 20
5. References 21
6. Glossary 22
Appendix 1: Limitations in developing a diabetes mellitus profile 231989-90 National Health Survey 23
Appendix 2: Diabetes Australia activities 24Diabetes Australia 24National Action Plan - Diabetes - To the year 2000 and beyond 24
Health Series Publications 25
4
Tables
Table 1: Deaths caused by diabetes mellitus, by age groups, by sex, ACT, 1991-94 8Table 2: Selected health risk factors, ACT and Australia, 1989-90 9Table 3: Self-reported diabetes/high blood sugar levels, by age, by sex, Australia 10Table 4: Estimated number of hospital separations for principal or secondary diagnosis of diabetes,
by age, ACT, 1993-94 11Table 5: Estimated number of hospital separations for pricipal diagnosis of diabetes, by age,
ACT, 1993-94 12Table 6: Estimated number of hospital separations for principal or secondary diagnosis of diabetes,
by type, by sex, by age, ACT, 1993-94 12Table 7: Number of hospital separations per individual, for principal or secondary diagnosis of
diabetes, ACT, 1993-94 13Table 8: Number of hospital separations per individual, for principal diagnosis of diabetes,
ACT, 1993-94 13Table 9: Number of hospital separations for principal or secondary diagnosis of diabetes, by type,
by sex, by length of stay, ACT, 1993-94 14Table 10: Number of hospital separations for principal or secondary diagnosis of gestational diabetes,
complications of pregnancy or childbirth due to diabetes, ACT, 1993-94 14
Figures
Figure 1 : Number of deaths caused by diabetes mellitus, ACT, 1990-94 7Figure 2: Crude death rates per 1,000 population, by sex, ACT and Australia, 1991-94 7Figure 3: Persons aged 45 yrs or more with and without diabetes or high blood sugar,
by reported long-term conditions, Australia, 1989-90 15
5
Diabetes Mellitus
1. Introduction
1.1 What is diabetes mellitus?
Diabetes Mellitus, usually referred to as diabetes, is a condition in which the body is unable to properly useglucose or sugar which is required for basic cell and organ function. It occurs when the pancreas isunable to produce sufficient insulin, or the insulin produced is unable to work effectively. Insulin is ahormone which normally circulates in the blood and assists the passage of glucose into the bloodstreamand body cells. The most common types of diabetes mellitus are:
• Juvenile, insulin dependent diabetes (IDDM);• Mature-age onset non-insulin dependent diabetes (NIDDM); and• Gestational diabetes (first diagnosed when a woman is pregnant).
Serious clinical complications which can be caused by diabetes include adult blindness (leading cause),chronic kidney failure (major cause), coronary heart disease, stroke, peripheral vascular disease,amputations (leading cause) and impotence.
IDDM or Juvenile Diabetes refers to a disorder usually diagnosed in childhood although it can bedeveloped during adolescence or adulthood. Its cause is unknown and diagnosis always results fromsevere symptoms. People with this type of diabetes will always need daily doses of insulin since thepancreas will never be able to process blood sugars without it.
NIDDM constitutes about 85-90 per cent of all diabetes in developed countries5 and usually occurs afterthe age of about forty years. Diagnosis may not be made for several years after onset, since symptomsare often not evident until the disease starts to seriously effect bodily functioning. NIDDM is stronglyfamilial, but lifestyle factors are also major triggers. Potentially modifiable risk factors include: poor eatingpatterns (particularly the consumption of refined fats, sugars and alcohol) and lack of exercise oftenresulting in obesity. Appropriate diet, weight control and physical activity increases insulin sensitivityamong insulin resistant patients and are effective treatments for patients with NIDDM, or may prevent thedevelopment of NIDDM in susceptible people 15. Incidence increases significantly with increasing age.
Women who develop gestational diabetes usually only require careful monitoring during pregnancy toensure that no complications arise. Such women are more likely to develop NIDDM in later life than therest of the population however.
1.2 Overview
Diabetes is a condition of considerable public health significance in that it affects at least half a millionAustralians (some estimates are as high as 700,000)6 and is associated with a variety of other healthconditions. Furthermore, it is associated with significant human and financial cost to the community and itsprevalence is likely to increase significantly as the population ages. People from low socio-economicbackgrounds7 (who are likely to follow poor dietary habits), those from certain racial groups such asAboriginal people and Torres Strait Islanders, those born in Southern Europe, Pacific Islanders, Asians,and the elderly are more likely to be affected than the general population. Aboriginal people have aprevalence of diabetes approximately five times that of other Australians.
6
The financial cost of diabetes and its complications has been estimated at a staggering $4 billion per yearin Australia6. There is also considerable pain and suffering associated with the disease, stress onindividuals and their families, and loss of independence3.
The condition is amenable to prevention (NIDDM only) and early intervention, as are the complicationsassociated with the condition.3 Diabetes cannot be cured however, and requires lifelong treatment. Themajority of sufferers can manage their diabetes with diet therapy, weight control and regular exercise,although some need oral hypoglycaemic tablets or insulin.
There are therefore, considerable implications for health planners in developing health targets and servicedelivery programs. This is particularly relevant when using capitation budgets16.
There are no accurate statistics available to gauge the exact number of diabetes cases nor the number ofexact deaths caused by diabetes, in the ACT or Australia. Some of the major limitations in developing anaccurate profile are discussed in Appendix 1. The Australian Bureau of Statistics Population SurveyMonitor results indicate the national prevalence to be 3.8 per cent of all adults and 8.2 per cent of peopleaged 55 years and over.4 This equates to 8,380 cases of diabetes in the ACT including 4,357 cases inpeople over 55 years of age in 1994. The Diabetes Clinic at Woden Valley Hospital suggests that this is avery conservative estimate and puts the figure at more like 12,000, including 170 children - but thisestimate includes NSW patients being treated in the ACT. Deaths actually identified as caused bydiabetes represent the seventh major cause of death in the ACT in 1994.
The purpose of this report is to give as broad an overview as possible of the health profile of diabetesmellitus in the Australian Capital Territory with some comparative information in relation to the Australianpopulation as a whole. It will assist ACT planners and policy makers of health and related services toensure that people with diabetes are considered in appropriate planning of new or existing services.
1.3 Prevalence of diabetes mellitus in Indigenous Australians
As mentioned, indigenous Australians suffer diabetes mellitus at an alarmingly higher rate than that ofother Australians. Crude prevalence rates lie between 7.5 and 16 per cent for Aborigines compared to 3.4per cent for non-Aborigines. The peak of prevalence is at about forty years which is about thirty yearsearlier than for non-Aboriginal Australians. In the 20-50 year age group, the prevalence is over ten timeshigher than for non Aboriginals.7
Since NIDDM is related to nutrition, housing and lifestyle factors, and since two of the major predisposingrisk factors for diabetes, hyperinsulinaemia and obesity, are common in Aboriginal populations8, it would beappropriate to consider positive interventions in these areas to ensure improvements in the prevalence ofsuch diseases as diabetes mellitus.
There is little information on Aboriginal people living in the ACT. What is available concerns the SouthEast Region or the ATSIC Queanbeyan Region and not the ACT specifically. It is known that there were1775 indigenous people living in the ACT in 199111 and 196912 in 1994. Although the increase in recentyears is small, it is significant in planning for the prevention and control of diabetes for the group.
As part of the National Aboriginal and Torres Strait Islander Survey, 1994, data were collected on peopleliving in the Queanbeyan ATSIC region. This region covers the ACT and parts of NSW bounded byQueanbeyan, Yass, Nowra, Batemans Bay and Eden. It was a self-reporting survey conducted throughinterviews. Of the 4575 people over the age of 13 who were interviewed, 551 (12%) reported thatdiabetes was a major health problem for them.
7
2. Mortality
Diabetes by itself is not a major life threatening condition if it is properly managed. It often has co-morbidities which are life threatening however, such as heart disease.
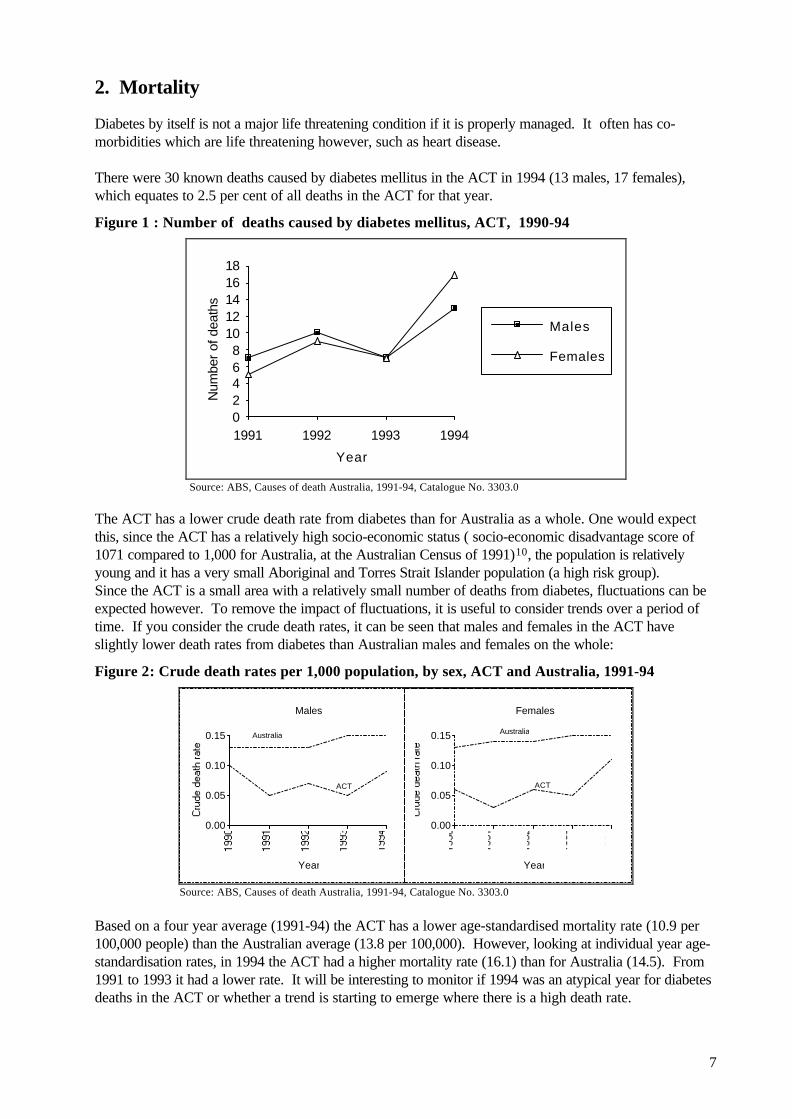
There were 30 known deaths caused by diabetes mellitus in the ACT in 1994 (13 males, 17 females),which equates to 2.5 per cent of all deaths in the ACT for that year.
Figure 1 : Number of deaths caused by diabetes mellitus, ACT, 1990-94
Year
Num
ber
of d
eath
s
02468
1012141618
1991 1992 1993 1994
Males
Females
Source: ABS, Causes of death Australia, 1991-94, Catalogue No. 3303.0
The ACT has a lower crude death rate from diabetes than for Australia as a whole. One would expectthis, since the ACT has a relatively high socio-economic status ( socio-economic disadvantage score of1071 compared to 1,000 for Australia, at the Australian Census of 1991)10, the population is relativelyyoung and it has a very small Aboriginal and Torres Strait Islander population (a high risk group).Since the ACT is a small area with a relatively small number of deaths from diabetes, fluctuations can beexpected however. To remove the impact of fluctuations, it is useful to consider trends over a period oftime. If you consider the crude death rates, it can be seen that males and females in the ACT haveslightly lower death rates from diabetes than Australian males and females on the whole:
Figure 2: Crude death rates per 1,000 population, by sex, ACT and Australia, 1991-94
Males
Year
0.00
0.05
0.10
0.15 Australia
ACT
Females
Year
0.00
0.05
0.10
0.15 Australia
ACT
Source: ABS, Causes of death Australia, 1991-94, Catalogue No. 3303.0
Based on a four year average (1991-94) the ACT has a lower age-standardised mortality rate (10.9 per100,000 people) than the Australian average (13.8 per 100,000). However, looking at individual year age-standardisation rates, in 1994 the ACT had a higher mortality rate (16.1) than for Australia (14.5). From1991 to 1993 it had a lower rate. It will be interesting to monitor if 1994 was an atypical year for diabetesdeaths in the ACT or whether a trend is starting to emerge where there is a high death rate.
8
2.1 Age-specific mortality
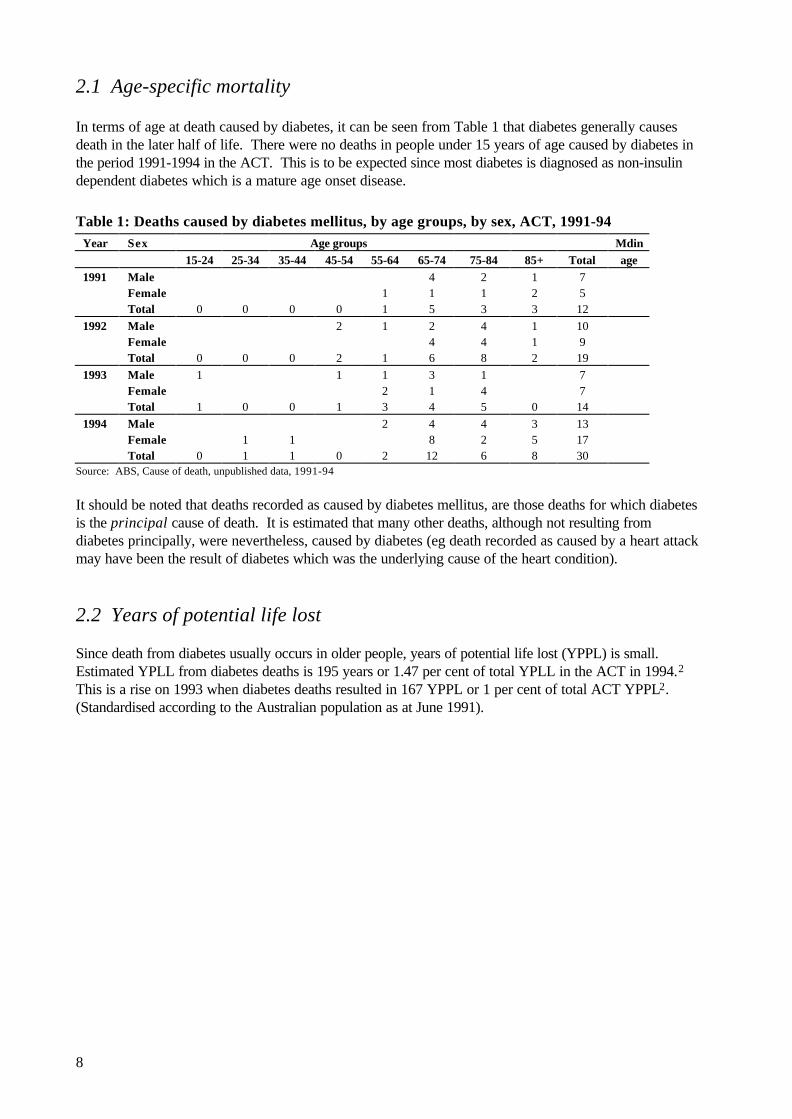
In terms of age at death caused by diabetes, it can be seen from Table 1 that diabetes generally causesdeath in the later half of life. There were no deaths in people under 15 years of age caused by diabetes inthe period 1991-1994 in the ACT. This is to be expected since most diabetes is diagnosed as non-insulindependent diabetes which is a mature age onset disease.
Table 1: Deaths caused by diabetes mellitus, by age groups, by sex, ACT, 1991-94Year Sex Age groups Mdin
15-24 25-34 35-44 45-54 55-64 65-74 75-84 85+ Total age1991 Male 4 2 1 7
Female 1 1 1 2 5Total 0 0 0 0 1 5 3 3 12
1992 Male 2 1 2 4 1 10Female 4 4 1 9Total 0 0 0 2 1 6 8 2 19
1993 Male 1 1 1 3 1 7Female 2 1 4 7Total 1 0 0 1 3 4 5 0 14
1994 Male 2 4 4 3 13Female 1 1 8 2 5 17Total 0 1 1 0 2 12 6 8 30
Source: ABS, Cause of death, unpublished data, 1991-94
It should be noted that deaths recorded as caused by diabetes mellitus, are those deaths for which diabetesis the principal cause of death. It is estimated that many other deaths, although not resulting fromdiabetes principally, were nevertheless, caused by diabetes (eg death recorded as caused by a heart attackmay have been the result of diabetes which was the underlying cause of the heart condition).
2.2 Years of potential life lost
Since death from diabetes usually occurs in older people, years of potential life lost (YPPL) is small.Estimated YPLL from diabetes deaths is 195 years or 1.47 per cent of total YPLL in the ACT in 1994.2
This is a rise on 1993 when diabetes deaths resulted in 167 YPPL or 1 per cent of total ACT YPPL2.(Standardised according to the Australian population as at June 1991).

9
3. Morbidity
Diabetes is a chronic condition which rarely warrants hospitalisation. General practitioners and staff at theDiabetes Clinic at Woden Valley Hospital typically attend to the care and treatment of people withdiabetes. It has been estimated that diabetes is the eleventh most frequent condition managed by generalpractice in the ACT and represents 2 per cent of all patient encounters (ACT Division of GPs).
3.1 Division of GPs Diabetes Project
A project being undertaken by the ACT Division of General Practice aims, amongst other things, toestablish a central database of diabetics which will assist in developing a more accurate profile of diabetesincidence and treatment in the ACT.
In the meantime, National Health Survey results, the Third National Survey of Morbidity in GeneralPractice in Australia and ACT hospital separation data assist in developing a profile of diabetes prevalencein the Territory.
3.2 1989-90 National Health Survey
The Australian Bureau of Statistics (ABS) 1989-90 National Health Survey collected data fromapproximately 54,000 people living throughout Australia. The sample was designed so that the states andterritories could be separately analysed. Limitations of the survey are outlined in Appendix 1.
Although the National Health Survey 1989-90 only used a small sample of ACT residents, some trendsemerged. In relation to lifestyle factors, survey results (refer Table 2) showed a slightly higher proportionof adults in the ACT smoked tobacco and drank alcohol at a moderate or high risk level than in Australiaoverall. However, they exercised more and were either underweight or at more acceptable weight levelsthan national figures. It would appear that Territorians are generally not at high risk from lifestyle factorsrelated to the onset of diabetes.
Table 2: Selected health risk factors, ACT and Australia, 1989-90
Selected health risk factors ACT ACT Australia ratio per cent per cent
Smoker status -Smokers 100.3 30.3 28.4Ex-smoker/never smoked n/a 69.7 71.6Alcohol consumption -No alcohol/low risk level 82.2 (no),
110.2 (low)87.2 88.9
Moderate or high risk level 106.3 (moderate) 112.3 (high)
12.8 11.1
Exercise -No /low exercise level 83.2 (no)
106.1 (low)63.3 68.0
Moderate or high exercise level 110.6 (moderate) 112.9 (high)
36.7 32.0
Body Mass -Underweight/acceptable weight 92.9 64.9 60.0Overweight/obese 89.9 31.6 36.5
(a) Persons aged 18 and over (b) age-sex standardised ratio where Australia is 100.0 n/a means not availableSource: ABS 1989-90 National Health Survey
10
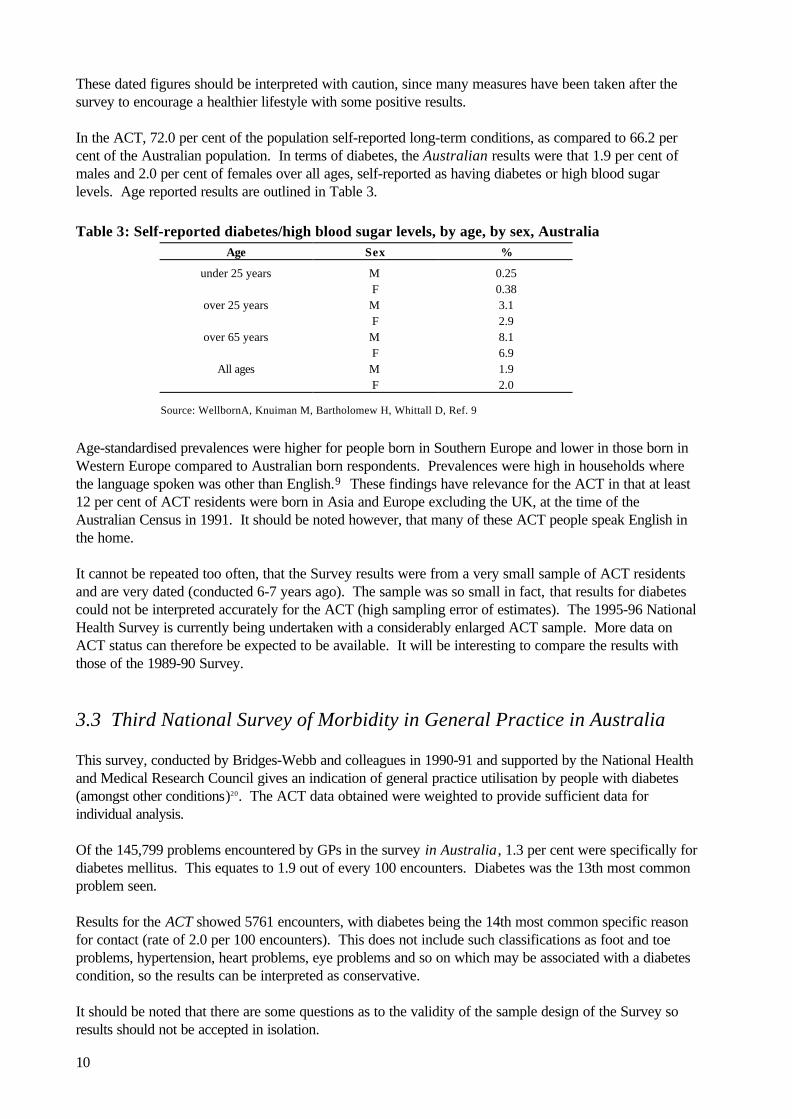
These dated figures should be interpreted with caution, since many measures have been taken after thesurvey to encourage a healthier lifestyle with some positive results.
In the ACT, 72.0 per cent of the population self-reported long-term conditions, as compared to 66.2 percent of the Australian population. In terms of diabetes, the Australian results were that 1.9 per cent ofmales and 2.0 per cent of females over all ages, self-reported as having diabetes or high blood sugarlevels. Age reported results are outlined in Table 3.
Table 3: Self-reported diabetes/high blood sugar levels, by age, by sex, AustraliaAge Sex %
under 25 years M 0.25F 0.38
over 25 years M 3.1F 2.9
over 65 years M 8.1F 6.9
All ages M 1.9F 2.0
Source: WellbornA, Knuiman M, Bartholomew H, Whittall D, Ref. 9
Age-standardised prevalences were higher for people born in Southern Europe and lower in those born inWestern Europe compared to Australian born respondents. Prevalences were high in households wherethe language spoken was other than English.9 These findings have relevance for the ACT in that at least12 per cent of ACT residents were born in Asia and Europe excluding the UK, at the time of theAustralian Census in 1991. It should be noted however, that many of these ACT people speak English inthe home.
It cannot be repeated too often, that the Survey results were from a very small sample of ACT residentsand are very dated (conducted 6-7 years ago). The sample was so small in fact, that results for diabetescould not be interpreted accurately for the ACT (high sampling error of estimates). The 1995-96 NationalHealth Survey is currently being undertaken with a considerably enlarged ACT sample. More data onACT status can therefore be expected to be available. It will be interesting to compare the results withthose of the 1989-90 Survey.
3.3 Third National Survey of Morbidity in General Practice in Australia
This survey, conducted by Bridges-Webb and colleagues in 1990-91 and supported by the National Healthand Medical Research Council gives an indication of general practice utilisation by people with diabetes(amongst other conditions)20. The ACT data obtained were weighted to provide sufficient data forindividual analysis.
Of the 145,799 problems encountered by GPs in the survey in Australia, 1.3 per cent were specifically fordiabetes mellitus. This equates to 1.9 out of every 100 encounters. Diabetes was the 13th most commonproblem seen.
Results for the ACT showed 5761 encounters, with diabetes being the 14th most common specific reasonfor contact (rate of 2.0 per 100 encounters). This does not include such classifications as foot and toeproblems, hypertension, heart problems, eye problems and so on which may be associated with a diabetescondition, so the results can be interpreted as conservative.
It should be noted that there are some questions as to the validity of the sample design of the Survey soresults should not be accepted in isolation.
11
3.4 Hospital morbidity
It is not easy to gauge the incidence of diabetes, since most people are diagnosed and treated by theirgeneral practitioner and data concerning these visits is not extensive. Hospital separation data will give anindication of acute occurrences of the disease however.
3.4.1 Separations
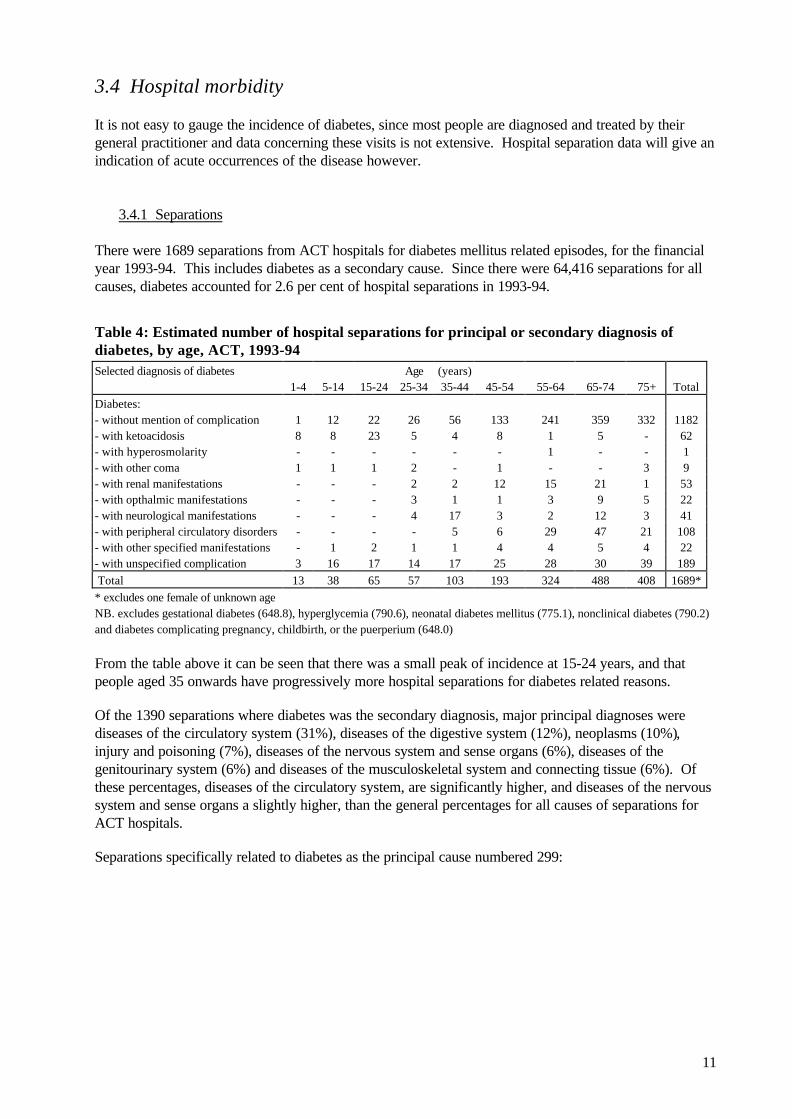
There were 1689 separations from ACT hospitals for diabetes mellitus related episodes, for the financialyear 1993-94. This includes diabetes as a secondary cause. Since there were 64,416 separations for allcauses, diabetes accounted for 2.6 per cent of hospital separations in 1993-94.
Table 4: Estimated number of hospital separations for principal or secondary diagnosis ofdiabetes, by age, ACT, 1993-94Selected diagnosis of diabetes Age (years)
1-4 5-14 15-24 25-34 35-44 45-54 55-64 65-74 75+ TotalDiabetes:- without mention of complication 1 12 22 26 56 133 241 359 332 1182- with ketoacidosis 8 8 23 5 4 8 1 5 - 62- with hyperosmolarity - - - - - - 1 - - 1- with other coma 1 1 1 2 - 1 - - 3 9- with renal manifestations - - - 2 2 12 15 21 1 53- with opthalmic manifestations - - - 3 1 1 3 9 5 22- with neurological manifestations - - - 4 17 3 2 12 3 41- with peripheral circulatory disorders - - - - 5 6 29 47 21 108- with other specified manifestations - 1 2 1 1 4 4 5 4 22- with unspecified complication 3 16 17 14 17 25 28 30 39 189 Total 13 38 65 57 103 193 324 488 408 1689** excludes one female of unknown ageNB. excludes gestational diabetes (648.8), hyperglycemia (790.6), neonatal diabetes mellitus (775.1), nonclinical diabetes (790.2)and diabetes complicating pregnancy, childbirth, or the puerperium (648.0)
From the table above it can be seen that there was a small peak of incidence at 15-24 years, and thatpeople aged 35 onwards have progressively more hospital separations for diabetes related reasons.
Of the 1390 separations where diabetes was the secondary diagnosis, major principal diagnoses werediseases of the circulatory system (31%), diseases of the digestive system (12%), neoplasms (10%),injury and poisoning (7%), diseases of the nervous system and sense organs (6%), diseases of thegenitourinary system (6%) and diseases of the musculoskeletal system and connecting tissue (6%). Ofthese percentages, diseases of the circulatory system, are significantly higher, and diseases of the nervoussystem and sense organs a slightly higher, than the general percentages for all causes of separations forACT hospitals.
Separations specifically related to diabetes as the principal cause numbered 299:
12
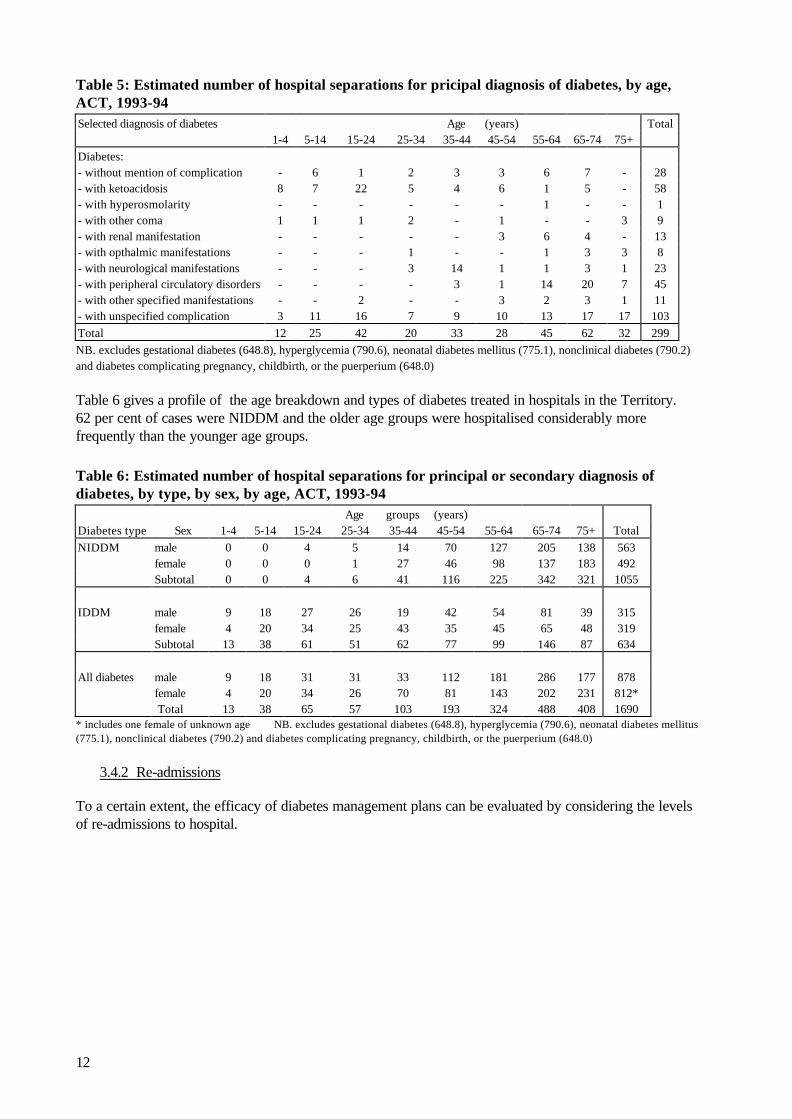
Table 5: Estimated number of hospital separations for pricipal diagnosis of diabetes, by age,ACT, 1993-94Selected diagnosis of diabetes Age (years) Total
1-4 5-14 15-24 25-34 35-44 45-54 55-64 65-74 75+Diabetes:- without mention of complication - 6 1 2 3 3 6 7 - 28- with ketoacidosis 8 7 22 5 4 6 1 5 - 58- with hyperosmolarity - - - - - - 1 - - 1- with other coma 1 1 1 2 - 1 - - 3 9- with renal manifestation - - - - - 3 6 4 - 13- with opthalmic manifestations - - - 1 - - 1 3 3 8- with neurological manifestations - - - 3 14 1 1 3 1 23- with peripheral circulatory disorders - - - - 3 1 14 20 7 45- with other specified manifestations - - 2 - - 3 2 3 1 11- with unspecified complication 3 11 16 7 9 10 13 17 17 103Total 12 25 42 20 33 28 45 62 32 299NB. excludes gestational diabetes (648.8), hyperglycemia (790.6), neonatal diabetes mellitus (775.1), nonclinical diabetes (790.2)and diabetes complicating pregnancy, childbirth, or the puerperium (648.0)
Table 6 gives a profile of the age breakdown and types of diabetes treated in hospitals in the Territory.62 per cent of cases were NIDDM and the older age groups were hospitalised considerably morefrequently than the younger age groups.
Table 6: Estimated number of hospital separations for principal or secondary diagnosis ofdiabetes, by type, by sex, by age, ACT, 1993-94
Age groups (years)Diabetes type Sex 1-4 5-14 15-24 25-34 35-44 45-54 55-64 65-74 75+ TotalNIDDM male 0 0 4 5 14 70 127 205 138 563
female 0 0 0 1 27 46 98 137 183 492Subtotal 0 0 4 6 41 116 225 342 321 1055
IDDM male 9 18 27 26 19 42 54 81 39 315female 4 20 34 25 43 35 45 65 48 319Subtotal 13 38 61 51 62 77 99 146 87 634
All diabetes male 9 18 31 31 33 112 181 286 177 878female 4 20 34 26 70 81 143 202 231 812* Total 13 38 65 57 103 193 324 488 408 1690
* includes one female of unknown age NB. excludes gestational diabetes (648.8), hyperglycemia (790.6), neonatal diabetes mellitus(775.1), nonclinical diabetes (790.2) and diabetes complicating pregnancy, childbirth, or the puerperium (648.0)
3.4.2 Re-admissions
To a certain extent, the efficacy of diabetes management plans can be evaluated by considering the levelsof re-admissions to hospital.
13
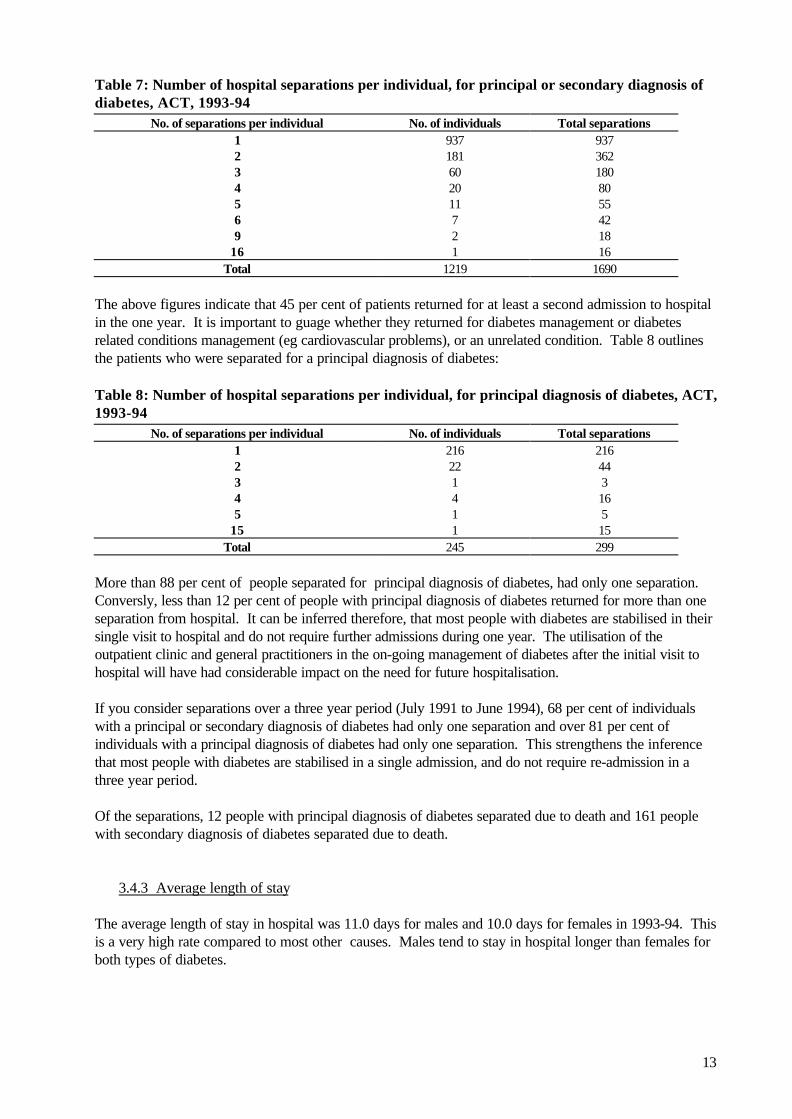
Table 7: Number of hospital separations per individual, for principal or secondary diagnosis ofdiabetes, ACT, 1993-94
No. of separations per individual No. of individuals Total separations1 937 9372 181 3623 60 1804 20 805 11 556 7 429 2 18
16 1 16Total 1219 1690
The above figures indicate that 45 per cent of patients returned for at least a second admission to hospitalin the one year. It is important to guage whether they returned for diabetes management or diabetesrelated conditions management (eg cardiovascular problems), or an unrelated condition. Table 8 outlinesthe patients who were separated for a principal diagnosis of diabetes:
Table 8: Number of hospital separations per individual, for principal diagnosis of diabetes, ACT,1993-94
No. of separations per individual No. of individuals Total separations1 216 2162 22 443 1 34 4 165 1 5
15 1 15Total 245 299
More than 88 per cent of people separated for principal diagnosis of diabetes, had only one separation.Conversly, less than 12 per cent of people with principal diagnosis of diabetes returned for more than oneseparation from hospital. It can be inferred therefore, that most people with diabetes are stabilised in theirsingle visit to hospital and do not require further admissions during one year. The utilisation of theoutpatient clinic and general practitioners in the on-going management of diabetes after the initial visit tohospital will have had considerable impact on the need for future hospitalisation.
If you consider separations over a three year period (July 1991 to June 1994), 68 per cent of individualswith a principal or secondary diagnosis of diabetes had only one separation and over 81 per cent ofindividuals with a principal diagnosis of diabetes had only one separation. This strengthens the inferencethat most people with diabetes are stabilised in a single admission, and do not require re-admission in athree year period.
Of the separations, 12 people with principal diagnosis of diabetes separated due to death and 161 peoplewith secondary diagnosis of diabetes separated due to death.
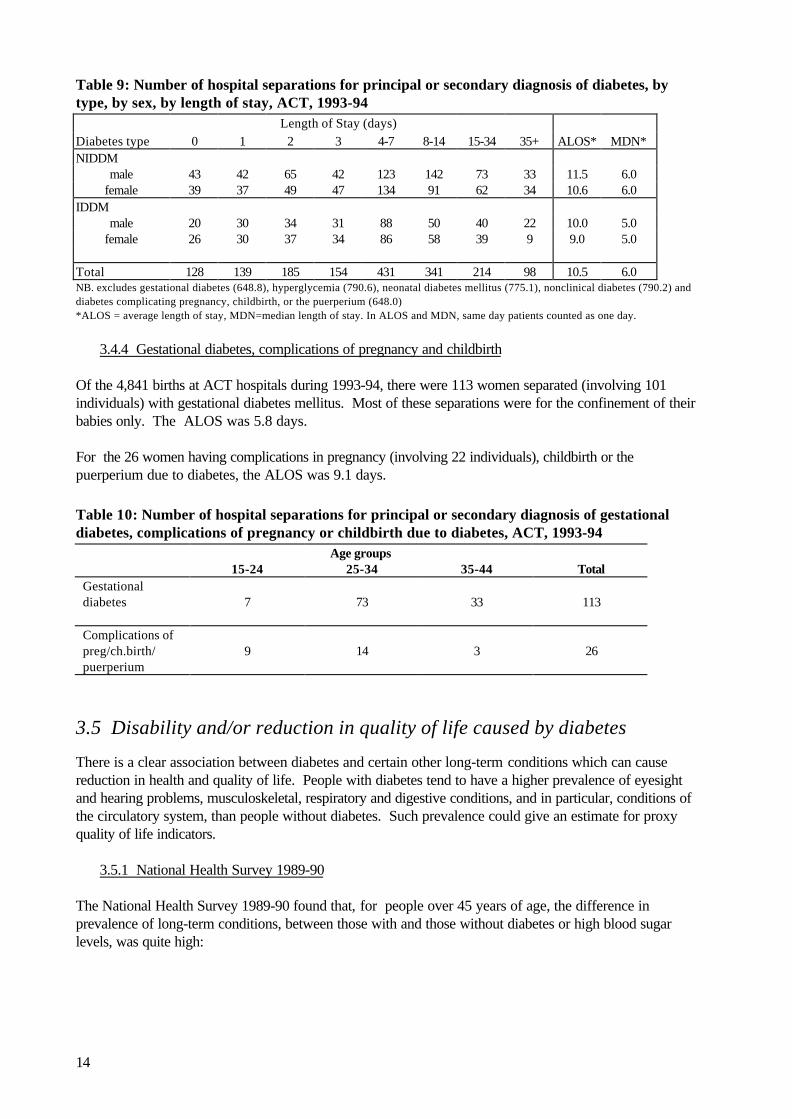
3.4.3 Average length of stay
The average length of stay in hospital was 11.0 days for males and 10.0 days for females in 1993-94. Thisis a very high rate compared to most other causes. Males tend to stay in hospital longer than females forboth types of diabetes.
14
Table 9: Number of hospital separations for principal or secondary diagnosis of diabetes, bytype, by sex, by length of stay, ACT, 1993-94
Length of Stay (days)Diabetes type 0 1 2 3 4-7 8-14 15-34 35+ ALOS* MDN*NIDDM
male 43 42 65 42 123 142 73 33 11.5 6.0female 39 37 49 47 134 91 62 34 10.6 6.0
IDDMmale 20 30 34 31 88 50 40 22 10.0 5.0
female 26 30 37 34 86 58 39 9 9.0 5.0
Total 128 139 185 154 431 341 214 98 10.5 6.0NB. excludes gestational diabetes (648.8), hyperglycemia (790.6), neonatal diabetes mellitus (775.1), nonclinical diabetes (790.2) anddiabetes complicating pregnancy, childbirth, or the puerperium (648.0)*ALOS = average length of stay, MDN=median length of stay. In ALOS and MDN, same day patients counted as one day.
3.4.4 Gestational diabetes, complications of pregnancy and childbirth
Of the 4,841 births at ACT hospitals during 1993-94, there were 113 women separated (involving 101individuals) with gestational diabetes mellitus. Most of these separations were for the confinement of theirbabies only. The ALOS was 5.8 days.
For the 26 women having complications in pregnancy (involving 22 individuals), childbirth or thepuerperium due to diabetes, the ALOS was 9.1 days.
Table 10: Number of hospital separations for principal or secondary diagnosis of gestationaldiabetes, complications of pregnancy or childbirth due to diabetes, ACT, 1993-94
Age groups15-24 25-34 35-44 Total
Gestationaldiabetes 7 73 33 113
Complications ofpreg/ch.birth/puerperium
9 14 3 26
3.5 Disability and/or reduction in quality of life caused by diabetes
There is a clear association between diabetes and certain other long-term conditions which can causereduction in health and quality of life. People with diabetes tend to have a higher prevalence of eyesightand hearing problems, musculoskeletal, respiratory and digestive conditions, and in particular, conditions ofthe circulatory system, than people without diabetes. Such prevalence could give an estimate for proxyquality of life indicators.
3.5.1 National Health Survey 1989-90
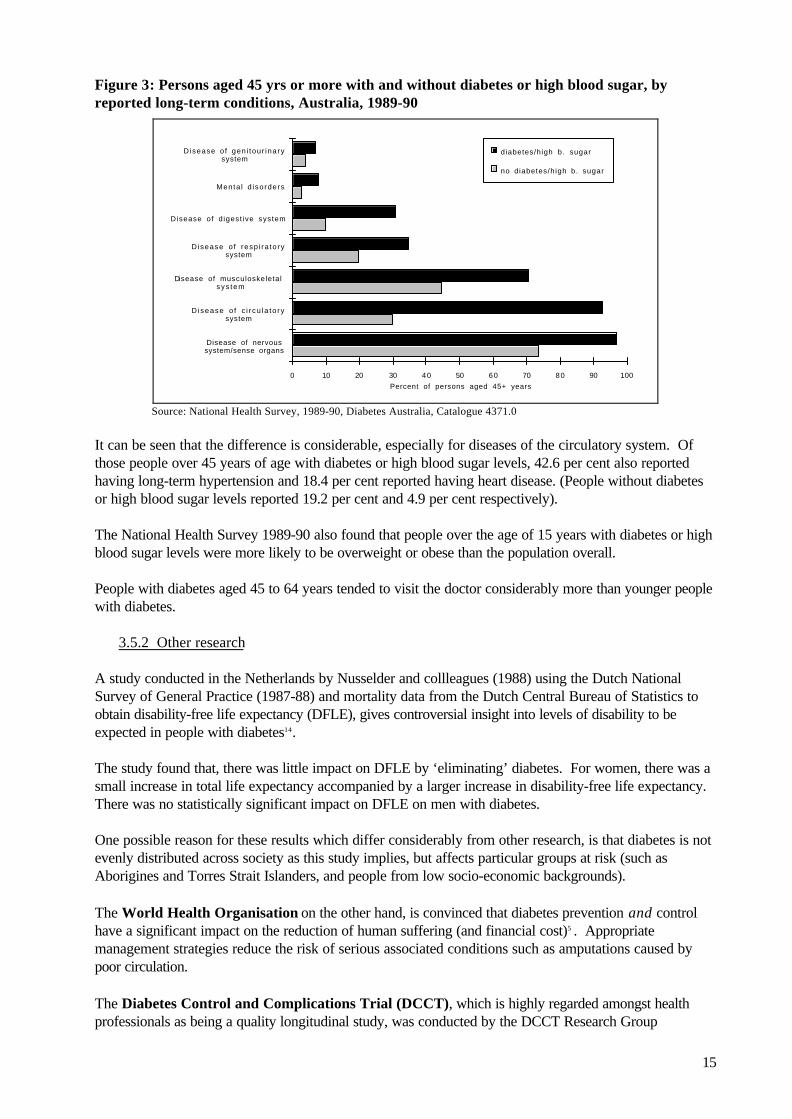
The National Health Survey 1989-90 found that, for people over 45 years of age, the difference inprevalence of long-term conditions, between those with and those without diabetes or high blood sugarlevels, was quite high:
15
Figure 3: Persons aged 45 yrs or more with and without diabetes or high blood sugar, byreported long-term conditions, Australia, 1989-90
Percent of persons aged 45+ years0 10 20 30 40 50 60 70 80 90 100
Disease of nervoussystem/sense organs
D isease o f c i r cu la to rysystem
Disease of musculoskeletalsys tem
Disease o f resp i ra to rysystem
Disease of d igest ive system
Menta l d isorders
Disease o f gen i tour inarysystem
diabetes/high b. sugar
no diabetes/high b. sugar
Source: National Health Survey, 1989-90, Diabetes Australia, Catalogue 4371.0
It can be seen that the difference is considerable, especially for diseases of the circulatory system. Ofthose people over 45 years of age with diabetes or high blood sugar levels, 42.6 per cent also reportedhaving long-term hypertension and 18.4 per cent reported having heart disease. (People without diabetesor high blood sugar levels reported 19.2 per cent and 4.9 per cent respectively).
The National Health Survey 1989-90 also found that people over the age of 15 years with diabetes or highblood sugar levels were more likely to be overweight or obese than the population overall.
People with diabetes aged 45 to 64 years tended to visit the doctor considerably more than younger peoplewith diabetes.
3.5.2 Other research
A study conducted in the Netherlands by Nusselder and collleagues (1988) using the Dutch NationalSurvey of General Practice (1987-88) and mortality data from the Dutch Central Bureau of Statistics toobtain disability-free life expectancy (DFLE), gives controversial insight into levels of disability to beexpected in people with diabetes14.
The study found that, there was little impact on DFLE by ‘eliminating’ diabetes. For women, there was asmall increase in total life expectancy accompanied by a larger increase in disability-free life expectancy.There was no statistically significant impact on DFLE on men with diabetes.
One possible reason for these results which differ considerably from other research, is that diabetes is notevenly distributed across society as this study implies, but affects particular groups at risk (such asAborigines and Torres Strait Islanders, and people from low socio-economic backgrounds).
The World Health Organisation on the other hand, is convinced that diabetes prevention and controlhave a significant impact on the reduction of human suffering (and financial cost)5 . Appropriatemanagement strategies reduce the risk of serious associated conditions such as amputations caused bypoor circulation.
The Diabetes Control and Complications Trial (DCCT), which is highly regarded amongst healthprofessionals as being a quality longitudinal study, was conducted by the DCCT Research Group
16
representing a large number of National Institutes and individuals in the USA. The trial was a multi-centre, randomised clinical trial of 1441 patients who were recruited from 29 Centres over the period 1983to 1989. Results offered clear evidence of the central role of diabetes educators and health care teams inimplementing intensive management to produce outcomes of improved blood glucose control. Suchintensive intervention and education of patients to self-manage their disease resulted in marked reductionsin complications caused by diabetes. The study results showed a 76 per cent reduction in the incidence ofnew onset retinopathy, 54 per cent reduction in the incidence of albuminuria (and hopefully, of consequentrenal failure), 60 per cent reduction in the incidence of neuropathy and a 41 per cent reduction in theincidence of macrovascular disease in patients with insulin dependent diabetes mellitus.18, 19. The studyrecommended that patients with NIDDM could also benefit greatly by such a regime of intensive, closelymonitored intervention as used in the Trial.
4. Diabetes management strategies
4.1 Medical Outpatients Clinic, Woden Valley Hospital
The centre is part of the Endocrinology Department of the hospital and is accredited by the NationalAssociation of Accredited Diabetes Centres and is linked to the NSW Association. It operates on thephilosophy espoused by the American Association of Diabetes Educators after it had completed manyyears research in the Diabetes Control and Complications Trial:
• that achieving better glycemic control depends upon greater access to quality diabetes education froma variety of health professionals and
• that patients must be encouraged to assume more individual responsibility and become empowered tobe the leading member of their diabetes self-management planning team17,18.
It also believes that the strengthening and maintenance of its ambulatory care program will assist inensuring that people with diabetes will be admitted or re-admitted to hospital at a reduced level.
People are usually referred to the Clinic by hospital staff or general practitioners, for medical assessment,stabilisation and often, on-going management of their disease. Annual full medical assessments areencouraged to ensure that clients remain stable in the management of their diabetes. The Clinic has twoendocrinologists, an endocrinology registrar and four diabetes educators and other paramedics on staff.They have access to hospital dietitians, social workers and psychologists. Approximately 1,200 patientswith diabetes are seen each year. These are predominately insulin dependent patients or patients withestablished complications of the condition.
Services provided include:
• an ambulatory care centre where new patients are medically assessed, individual interventionprograms are designed, and patients assisted in managing their programs;
• education of hospital staff and patients (group and individual sessions - eg a children’s clinic for youngpatients with Type 1 diabetes is held once a month);
• educational up-dates for regional GPs, nursing staff and other health professionals to assist continuityof care and appropriate co-ordination;
• on-going clients are encouraged to participate in annual medical reviews and education sessions;
17
• an after hours intervention service where an endocrinologist and diabetes educator are on 24 hour callto assist clients in times of crisis. This service, mainly offered by telephone contact, assists clients inovercoming urgent symptoms through telephone counselling and monitoring, and reduces the need forclients to be admitted to hospital. A recent case-mix exercise estimated that approximately 6400telephone occasions of service are made each year;
• assess and assist in the management of women with gestational diabetes (about 130 per year);
• provide a podiatry service for clients which has significant impact on reducing serious foot problemsand the need for amputations;
• teaching role for medical students, graduate students and paramedical staff;• a consultation service on diabetes and its management is provided to other specialists who have
patients with diabetes in hospital for reasons other than their diabetes to ensure that patients aredischarged as early as possible with as little disruption to their metabolic state as possible;
• conduct school visits to educate teaching staff in relation to individual students with diabetes;
• produce educational leaflets on various aspects of diabetes management for use by patients and healthprofessionals;
• conduct on-going research into the prevention and control of diabetes - this currently includescollaboration with the Division of Molecular Medicine at John Curtin School of Medicine and theVascular and Thrombosis Research Unit at WVH;
• keep comprehensive records on clients with diabetes, especially those with gestational or childhooddiabetes. When resources allow, it is envisioned that a data base will be more regularly up-dated forepidemiological analysis.
4.2 ACT Division of General Practice Diabetes Project
A project which commenced in 1995 and funded by the Commonwealth Department of Health and FamilyServices, is being undertaken by the ACT Division of General Practice. It aims to strengthen the role ofGPs in the care of people with diabetes using a primary health care approach, to identify diabetesknowledge and risk factors in the local area and to develop a broader network of support by improving co-ordination amongst the range of services, and to develop best practice protocols for health gain across thepublic health continuum. It will establish a central database of diabetics which will assist in developing amore accurate profile of diabetes incidence and treatment in the ACT.
Activities undertaken by the project include:
• publication of a monthly newsletter to provide GPs, specialists and allied health professionals withproject information, information on services available in the treatment of diabetes, current treatmentprotocols, advances in knowledge about diabetes and its treatment and information onseminars/workshops on diabetes held in the region;
• a survey of 300 GPs in the Division (with a response rate of 80 per cent) to identify gaps in services,and GP and client needs and gaps. Doctors noted the need for strengthened co-ordination of diabetesservice delivery and ongoing education and expressed a willingness to contribute;
• a survey of Diabetes Educators and meetings with health professionals identified similar needs for bestpatient care and complication prevention;

18
• a two day certified diabetes course and seminar on GP management of childhood diabetes;
• development of a poster on risk factors, patient information pamphlets, talks by GPs to communitygroups, newspaper articles and a radio interview about the role of GPs in the management of diabetes;
• conducted health promotion campaigns with Diabetes Australia ACT during ‘Family Doctor Week’and ‘Diabetes Week’ ;
• developed protocols on early detection, management and complication prevention in diabetesmanagement which are now being utilised;
• developed and trialled a patient held diabetes record which will be utilised soon.
19
4.3 ACT Health Goals and Targets for the Year 2000
The ACT Health Goals and Targets for the Year 2000 document outlines some specific goals forimproving diabetes services:
• to reduce the prevalence of non-insulin dependent diabetes; • to achieve early diagnosis of diabetes so that early intervention can assist in reducing the prevalence
and severity of diabetes-related complications; and • to obtain accurate baseline data about the prevalence and health outcomes associated with diabetes.
A working party to address the issues will be established as part of the ACT Goals and Targets and healthoutcomes process. Membership will include experts, departmental officers, non-government organisationalpeople and consumers.
4.4 National Action Plan - Diabetes - To the year 2000 and beyond
This plan for the prevention and control of non-insulin dependent diabetes mellitis in Australia was releasedby the Australian Diabetes Society in 1993. Refer Appendix 2.
4.5 Collection of accurate data
The implementation of health goals and targets and the maintenance and improvements to service deliverywill depend in part on the availability of quality base-line data on which to base evaluations of programsand interventions.
4.5.1 ACT Hospital Morbidity Collection
The ACT Department of Health and Community Care has a comprehensive collection of separation datafor ACT hospitals. This is maintained by the Performance Information Section.
In addition, the ACT Department, with assistance from the Commonwealth Government AmbulatoryCare Reform initiatives, has developed a comprehensive data collection project which will strengthenimprovements in the collection of accurate outpatient clinic statistics from Woden Valley and Calvaryhospitals. This will assist in enhancing knowledge about diabetes (and other disease) incidence in theTerritory.
The data collection system has been installed and will be operational shortly. It is compatible with thenew NSW data system, thus allowing cross border comparisons. It will utilise the National InjurySurveillance data definitions and national emergency definitions currently being developed.
4.5.2 The National Health Survey
The National Health Survey, which is conducted every five years, is another excellent source ofinformation. This will be particularly so for the 1995-96 survey, since the ACT had negotiated anextended ACT sample to ensure greater accuracy.
20
4.5.3 The ACT Care Continuum and Health Outcomes of Hospital Inpatients Project
An innovative method for collecting data is the ACT Care Continuum and Health Outcomes of HospitalInpatients Project.21 This is a two year pilot project, funded by the Commonwealth Department ofHealth and Family Services, which commenced in early 1995 and is being undertaken by the EpidemiologyUnit of the ACT Department of Health and Community Care in collaboration with The Australian NationalUniversity. The project involves investigating approximately 7,000 inpatients and their experiences prior toadmission, during their hospital stay and up to six months after discharge. Questions regarding formal andinformal service utilisation, costs across the care continuum and how to make better use of resources, andhealth outcomes including quality of life are being addressed. Data are collected through an interviewquestionnaire, a diary maintained by the patient and self-completion questionnaires complemented byexisting data bases. The information collected will allow for the development of a profile of patient careand outcomes on which to base future planning for the enhancement of quality of care and relevance ofhealth interventions.
21
5. References
1. ACT Department of Health, ACT Health Goals and Targets for the Year 2000, 19942. Australian Bureau of Statistics, unpublished data, Causes of Death, Australia, 1991-94, Catalogue
No. 3303.02(a) Australian Bureau of Statistics, Causes of Death, Australia, 1991-94, Catalogue No. 3303.03. Nutbeam D, Thomas M, Wise M, National Action Plan - Diabetes to the Year 2000 and
Beyond, Australian Diabetes Society (Diabetes Australia), Canberra, 19934. ABS, Population Survey Monitor, February 1994, Catalogue No. 4103.05. WHO Technical Report Series, Prevention of diabetes mellitus, Report of a WHO study group,
Geneva, 19946. Zimmet P, Cohen M, The diabetes epidemic in Australia: prevalence, patterns and public
health, Medical J of Australia, Vol 163, August 19957. National Health Strategy research paper No. 1, Enough to make you sick , 19928. Bhatia K, Anderson P, An overview of Aboriginal and Torres Strait Islander health: present
status and future trends, AIHW, 19959. WellbornA, Knuiman M, Bartholomew H, Whittall D, 1989-90 National health Survey:
prevalence of self-reported diabetes in Australia , Medical J of Australia, Vol 163, August 199510. Gilbert C, White U, ACT's Health: A report on the health status of ACT residents, ACT
Department of Health and Community Care, Health Series No. 1, October 199511. ABS, Australian Social Trends 1994, Catalogue No. 4102.012. ABS, Deaths Australia 1994, Catalogue No. 3302.013. ABS, 1989-90 National Health Survey, Diabetes, Australia , Catalogue No. 4371.014. Nusselder WJ, van der Velden J, Lenior ME, van Sonsbeek JLA, van den Bos GA, The effect of
elimination of selected chronic diseases on disability-free life expectancy: compression orexpansion of morbidity? Preliminary results, in Advances in health expectancies, Proceedings otthe 7th Meeting of the International Network on Health Expectancy, Canberra February 1994,AIHW, 1994
15. Horton ES, NIDDM - the devastating disease, Diabetes-Res-Clin-Pract. August:28 Suppl: S3-11,1995
16. Meadows P, Variation of diabetes mellitus prevalence in general practice and its relation todeprivation, Diabet-Med. August; 12(8): 696-700, 1995
17. Fain JA, Editorial: DCCT; Model of Partnerships, The Diabetes Educator, Jan/Feb Vol 20, No1, 1994
18. AADE Position Statement: Diabetes Control and Complications Trial (DCCT), The DiabetesEducator, Mar/Apr, Vol 20, No 2, 1994
19. Diabetes Control & Complications Trial (DCCT) Research Group, Effect of intensive treatment ofdiabetes on the development and progression of long-term complications, N England J ofMedicine, 329 (14): 977-86, 1993
20. Bridges-Webb C, Britt H, Miles DA, Neary S, Charles J, Traynor V, Morbidity and treatment ingeneral practice in Australia 1990 - 1991, Medical J of Australia, Supplement, Oct 1992
21. Shadbolt B, The Care Continuum and Health Outcomes Project: The Research Plan, ACTDept of Health & Community Care, Canberra, 1995
22
6. Glossary
Age-sex standardisation - demographic technique for adjusting for the effects of age and sex betweenpopulations which allows comparisons between populations.4
Age-sex standardised ratio - The expected number of events is given by calculating the number ofevents which would have occurred if the rates for each age/sex group in a given population (thestandard) were applied to the population of interest.3
Crude death rate is the number of deaths per 1,000 population (unless otherwise stipulated) in a givenyear.4
Incidence refers to the number of instances of illness commencing, or of persons falling ill, during a givenperiod in a specified population.1
Median is a measure of central tendency. It refers to the point between the upper and lower halves ofthe set of measurements.1
Mortality is the relative number of deaths, or death rate, as in a district or community.2
Morbidity is the proportion of sickness in a locality.2
Potential Years of Life Lost (PYLL) is a measure of the relative impact of various diseases and lethalforces on society. PYLL highlights the loss to society as a result of youthful or early deaths.The figure for PYLL due to a particular cause is the sum, over all persons dying from thatcause, of the years that these persons would have lived had they experienced normal lifeexpectation.1
Prevalence refers to the number of instances of a given disease or other condition in a given population ata designated time.1
Separation (from hospital) refers to when a patient is discharged from hospital, transferred to anotherhospital or other health care accommodation, or dies in hospital following formal admission.4
Sex differentials are the differences in rates between males and females.1
Standardised death rate is the overall death rate that would have prevailed in a standard population, inthis case the 1991 Australian population, if it had experienced at each stage the death rates ofthe population being studied.4
Statistically significant infers that it can be concluded on the basis of statistical analysis that it is highlyprobable.
References1. Last J, A Dictionary of Epidemiology, IEA, 19882. Delbridge A, Bernard JRL, The Macquarie Concise Dictionary, 2nd Edition, 19883. Glover J, Woollacott T. A Social Health Atlas. ABS Catalogue No. 4385.0, 1992.4. Australian Bureau of Statistics definitions.
23
Appendix 1: Limitations in developing a diabetes mellitus profile
Developing a profile on diabetes is not easy. Some of the problems are:
• Classification of diabetes, where diagnosis is often delayed, is not easy. No symptoms ornon-severe symptoms may be present for years before a person is diagnosed as havingdiabetes, making it a ‘hidden disease’.
• Comprehensive data are not readily available; • What data are available, generally record small numbers of occurrences of particular
events. The smaller the numbers, the more likely it is to have inexplicable fluctuations inresults. Where changes in pattern from year to year are noted, time series are utilised toensure a more reliable analysis;
• There could be inconsistencies in recording of cause of death (eg. a person may be
recorded as dying from heart attack rather than from the diabetes which causedcardiovascular weaknesses);
• There may also be inconsistencies in coding hospital admissions (eg. a person may be
coded as having a heart attack as the principal diagnosis, but it may have been caused bydiabetes - a different coder may have coded principal diagnosis as "diabetes" with theheart attack as the secondary diagnosis);
• In many cases, especially non-acute cases, people treat themselves or seek treatment
from outside the hospital system (eg medical practitioner, podiatrist, pharmacist). Thereare no structured mechanisms for recording these occurrences. The recent projectconducted by the ACT Division of general practice (Refer section 4.2) will assist inestimating some of these contacts.
1989-90 National Health Survey
The Australian Bureau of Statistics (ABS) 1989-90 National Health Survey collected data fromapproximately 54,000 people living throughout Australia. The sample was designed so that the states andterritories could be separately analysed. However:
• Until the 1995-96 survey, the sample size of respondents was very small in the ACT. Thisresulted in fluctuations in results and reduced reliability of findings. When responses werebroken down into sub-groups (eg people aged under 18), the sample became even smallerresulting in more inaccuracies. It should also be noted that the Survey utilises a self-reporting format. Results represent respondents' perceptions, not necessarily healthprofessionals' findings. It also depends in part, on the literacy of the respondents and theirability to understand English.
• Since the last Survey was conducted in 1989-90, results are quite out-dated and should be
interpreted with caution.
24
Appendix 2: Diabetes Australia activities
Diabetes Australia
Diabetes Australia is the national co-ordinating body for the diabetes movement in Australia and iscomposed of twelve member organisations including:
• an Association in each capital city representing consumers and providing advocacy, group support,education, consumer products and related training services;
• a medical and scientific section (the Australian Diabetes Society);• an education advisory section (the Australian Diabetes Education Association); and• diabetes research involving several diabetes research trusts.
National Action Plan - Diabetes - To the year 2000 and beyond
This plan for the prevention and control of non-insulin dependent diabetes mellitis in Australia was releasedby the Australian Diabetes Society in 1993. It has nine goals and 75 targets which are complementary tothose outlined in Goals and Targets for Australia’s Health in the Year 2000 and Beyond.
The goals of the plan are:
• to obtain accurate data on the prevalence and incidence of NIDDM in the Australian population by1995;
• to reduce the prevalence of NIDDM;• to reduce the prevalence of NIDDM in Aboriginal and Torres Strait Islander populations;• to reduce the prevalence of NIDDM in the migrant populations in Australia that have high
prevalence of the disease, including those from Southern Europe, the Middle East and South-EastAsia, and among Polynesians and Asian Indians;
• to achieve early diagnosis of NIDDM;• to obtain accurate data on the prevalence and incidence of complications of NIDDM among
persons in Australia who have NIDDM;• to reduce the prevalence and incidence of complications of NIDDM;• to reduce the prevalence and incidence of end-stage complications of NIDDM, especially lower
limb amputations, kidney failure and blindness;• to increase the quantity and maintain or improve the quality of research in the prevention and
management of NIDDM, particularly in those areas where fundamental information is lacking.
One recent result of addressing the above goals was the commissioning of research into the epidemiologyand costs of diabetes mellitis in Australia. A report The rise and rise of diabetes in Australia, 1996was released in April 1996. It outlines current knowledge about the disease, its incidence and prevalencein Australia, and suggests a national action plan for diabetes to the year 2000.
25
Health Series Publications
The Epidemiology Unit of the Department of Health and Community Care has developed an on-goinghealth series of publications to inform health professionals, policy developers and the community on healthstatus in the Territory. Information contained therein will assist in the development of appropriate policyand service delivery models, the evaluation of programs, and an understanding of how the ACT compareswith Australia as a whole with regard health status.
Number 1: ACT’s Health: A report on the health status of ACT residents,Carol Gilbert, Ursula White, October 1995
Number 2: The Epidemiology of Injury in the ACT,Carol Gilbert, Chris Gordon, February 1996
Number 3: Cancer in the Australian Capital Territory 1983-1992,Norma Briscoe, April 1996
Number 4: The Epidemiology of Asthma in the ACT,Carol Gilbert, April 1996
Number 5: The Epidemiology of Diabetes Mellitus in the ACT,Carol Gilbert, Chris Gordon, July 1996
Future imminent publications are being planned for cancer services strategic planning (nearing completion),stroke and cardiovascular disease.