north birmingham air toxics risk assessment · north birmingham air toxics risk assessment iii list...
TRANSCRIPT

North Birmingham Air Toxics
Risk Assessment
Prepared by:
US Environmental Protection Agency
Region 4
Atlanta, GA
March 2013

North Birmingham Air Toxics Risk Assessment
ii
TABLE OF CONTENTS
LIST OF FIGURES ........................................................................................................... iii LIST OF TABLES ............................................................................................................. iv
EXECUTIVE SUMMARY ................................................................................................ 1 1.0 INTRODUCTION ........................................................................................................ 4
1.1 Previous Air Studies ................................................................................................. 4 1.2 Description of Study Area ........................................................................................ 5 1.3 Organization of This Report ..................................................................................... 6
2.0 DATA COLLECTION AND ANALYSIS ................................................................... 7 2.1 Site Selection and Monitoring .................................................................................. 7 2.2 Monitoring Schedule and Analytical Parameters ..................................................... 8 2.3 Data Quality and Validation Analysis ...................................................................... 9
2.3.1 Air Monitoring Data and Analysis ..................................................................... 9 2.3.2 Acrolein Sampling and Analysis Issues ............................................................. 9
2.4 Air Sample Laboratory Analysis ............................................................................ 10 2.5 Data Screening and Preliminary Analysis .............................................................. 11 2.6 Chemical Screening Results ................................................................................... 11
3.0 EXPOSURE ASSESSMENT ..................................................................................... 13 3.1 Assessment of Chronic Exposures .......................................................................... 13
3.2 Assessment of Acute Exposures ............................................................................. 15 4.0 TOXICITY ASSESSMENT (DOSE-RESPONSE ASSESSMENT) ......................... 16
4.1 Hazard Assessment for Chronic Effects ................................................................. 18
4.1.1 Cancer Toxicity Values.................................................................................... 21 4.1.2 Chronic Non-cancer Values ............................................................................. 21
4.2 Hazard Assessment for Acute Effects ..................................................................... 22 4.3 Total Chromium Toxicity Assessment ................................................................... 23
5.0 RISK CHARACTERIZATION .................................................................................. 24 5.1 Risk Characterization for Chronic Exposures ......................................................... 24
5.1.1 Cancer Risk ...................................................................................................... 24 5.1.2 Non-Cancer Hazards ....................................................................................... 26 5.1.3 Cancer Risk Results ......................................................................................... 27 5.1.4 Chronic Non-Cancer Hazard Results ............................................................... 29
5.1.5 Lead (Pb) Hazard Evaluation .......................................................................... 29 5.2 Acute Hazard Characterization ............................................................................... 32 5.3 Description of Risk Drivers .................................................................................... 33
6.0 UNCERTAINTY ASSESSMENT.............................................................................. 36 7.0 CONCLUSIONS......................................................................................................... 40
7.1 Chronic Risk Characterization ................................................................................ 40 7.2 Chronic Hazard Characterization ............................................................................ 40
7.3 Acute Hazard Characterization ............................................................................... 41 7.4 Comparison with the 2009 Birmingham Air Toxics Study .................................... 41
8.0 REFERENCES ........................................................................................................... 42 Figures............................................................................................................................... 46 Tables ................................................................................................................................ 50

North Birmingham Air Toxics Risk Assessment
iii
LIST OF FIGURES
Figure 1.2-1. Travel Map of Birmingham, AL Area
Figure 1.2-2. Wind Rose in the Birmingham Area, from June 2011 to August 2012
Figure 2.1-1. Approximate Locations of the 4 Monitoring Sites

North Birmingham Air Toxics Risk Assessment
iv
LIST OF TABLES
Table 1.2-1. Monthly Weather Conditions Data for the Monitoring Time Period
Table 2.2-1. Sample Analysis List for all Monitoring Sites.
Table 2.3.1-1. Sampling Dates at Each of the Monitoring Sites
Table 2.6-1. Chemicals Screening Results for the Hudson K-8 School Site
Table 2.6-2. Chemical Screening Results for the Lewis Elementary School Site
Table 2.6-3. Chemical Screening Results for the Riggins School Site
Table 2.6-4. Chemical Screening Results for the Shuttlesworth Station Site
Table 2.6-5. Comparison of Monitoring Sites in the Number of Chemicals of Potential
Concern
Table 2.6-6. Comparison of Monitoring Sites in Maximum Concentrations and Detection
Frequency for COPCs
Table 3.1-1. Statistical Summary of Concentrations for the Hudson K-8 School Air
Monitor (µg/m3)
Table 3.1-2. Statistical Summary of Concentrations for the Lewis Elementary School Air
Monitor (µg/m3)
Table 3.1-3. Statistical Summary of Concentrations for the Riggins School Air Monitor
(µg/m3)
Table 3.1-4. Statistical Summary of Concentrations for the Shuttlesworth Station Air
Monitor (µg/m3)
Table 5.1.1-1. Cancer Risks for the Hudson K-8 School Chemicals of Potential Concern
Table 5.1.1-2. Cancer Risks for the Lewis Elementary School Chemicals of Potential
Concern
Table 5.1.1-3. Cancer Risks for the Riggins School Chemicals of Potential Concern
Table 5.1.1-4. Cancer Risks for the Shuttlesworth School Chemicals of Potential Concern
Table 5.1.2-1. Non-cancer Hazard Quotients for the Hudson K-8 School Chemicals of
Potential Concern
Table 5.1.2-2. Non-cancer Hazard Quotients for the Lewis Elementary School Chemicals
of Potential Concern
Table 5.1.2-3. Non-cancer Hazard Quotients for the Riggins School Chemicals of
Potential Concern
Table 5.1.2-4. Non-cancer Hazard Quotients for the Shuttlesworth Station Chemicals of
Potential Concern
Table 5.2-1 Comparison of Maximum Chemical Concentrations to Acute Benchmark
Screening Limits for the 4 Monitoring Sites

North Birmingham Air Toxics Risk Assessment
1
EXECUTIVE SUMMARY
This document reports on ambient air toxics monitoring and the resulting human health risk assessment in
four North Birmingham, Alabama, communities. This study was designed as an extension of a previous
effort, the national School Air Toxics (SAT) study, which focused on assessing outdoor air pollution near
schools. The SAT results from data collected at two of the Birmingham schools suggested a need for
additional monitoring in the four communities to better assess the long term potential risks of airborne
contaminants in the neighborhoods. This monitoring and risk study is part of a larger initiative, the North
Birmingham Pilot Community Air Toxics Initiative, which was designed in early 2011 by the US
Environmental Protection Agency (EPA) and the Jefferson County Department of Health (JCDH), to
address the overall air quality concerns in the four North Birmingham communities.
Monitoring stations were established at Hudson K-8 Elementary School in Collegeville, Lewis
Elementary School in North Birmingham, Riggins School in Fairmont, and at the Shuttlesworth
monitoring station in Harriman Park. Air samples were collected at the four sites from June 2011 to
August 2012 and analyzed for volatile organic compounds (VOCs), semi-volatile organic compounds
(SVOCs), and metals. Over 60 samples were collected at each location. The sampling and laboratory
analysis process was subject to rigorous quality assurance/quality control procedures. Sampling results
were evaluated and contaminants of potential concern (COPCs) were identified.
Both chronic (long-term) and acute (short term) inhalation exposures were estimated for individuals
residing within the four communities. The chronic exposure assessment assumed an individual is exposed
to the identified COPCs continuously for 24 hours per day over a 70-year period. The 95% Upper
Confidence Level (95UCL) of the mean of the chemical concentration in air at a given monitor was used
as the exposure concentration for an individual. The 95UCL is a value that, 95% of the time, equals or
exceeds the true average concentration. The 95UCL is typically used as a conservative estimate of the true
average concentration. Potential risk at each monitoring site was calculated by combining the 95UCL
concentrations of each COPC identified in the analysis with toxicity data for the pollutants. For the
chronic risk assessment, a distinction is made between potential risk of developing cancer and the
potential for non-cancer health effects.
Results for the chronic cancer risk assessment indicate that each of the four of the monitoring sites has a
total or “cumulative” risk of 1x10⁻⁴
(one potential additional cancer case in 10,000 exposed people). In
general, the US EPA considers excess cancer risks that are below about 1 chance in 1,000,000 (1×10⁻⁶
) to
be negligible and excess cancer risks that range from 1x10⁻⁶
and 1x10⁻⁴
are considered to be acceptable.
Cancer risks calculated at each of the four monitoring sites fell within EPA’s range of acceptability. In
this study, the chemicals that contributed most to the total cancer risk are benzene and naphthalene.
Long-term non-cancer health hazards are evaluated in a two step process. First, a Hazard Quotient (HQ) is
calculated by comparing the 95UCL concentrations to a reference dose considered to be a safe level of
exposure. The HQs for COPCs are summed to determine the Hazard Index (HI) at a monitoring site. A
HI of less than or equal to 1 is an indication that the cumulative impact of all of the COPCs at a given
monitoring site is not likely to result in adverse, non-carcinogen health impacts. For monitoring sites
where the HI exceeds 1, a second analysis is conducted to better assess the impact of COPCs on specific
organs or systems (a Target Organ Specific Hazard Index, or TOSHI, analysis). The TOSHI is
determined by summing each HQ for COPCs which affect the same target organ/system or have the same
mechanism of action. A TOSHI value of less than or equal to 1 is an indication that the cumulative

North Birmingham Air Toxics Risk Assessment
2
impact of all of the COPCs to the same toxicological endpoint or mechanism of action at a given
monitoring site is not likely to result in adverse, non-carcinogen health impacts.
In this study, the Hudson K-8 School, Lewis Elementary School, and Riggins School sites each had an
initial HI of 2 and the Shuttlesworth site had an initial HI of 1. The Hudson K-8 School, Lewis
Elementary School, and Riggins School results were further evaluated for impacts using the TOSHI
approach. None of the resulting TOSHI values exceeded 1. All four of the monitoring sites in the study
had the same chemicals as the largest contributors to non-cancer risk: Manganese, benzene, naphthalene,
arsenic, 1,3-butadiene, and cadmium. Because no monitoring sites were found to have TOSHI values
exceeding 1, it is unlikely that adverse non-cancer affects will occur.
Potential health effects from acute, or short-term, exposures were also evaluated. Acute exposures last a
few minutes to several days. The acute exposure analysis consisted of comparing the maximum
concentration of chemicals that were detected at least once to health-based comparison values. The
individual sample results of this analysis indicated that benzene exceeded its acute comparison value in 3
out of 75 samples at the Riggins School site. This indicates that potential short-term health hazards
resulting from elevated levels of benzene at this site at the time of sampling were possible on those days.
The benchmark value for benzene was the ATSDR acute Minimum Risk Level (MRL), a concentration
level considered protective of exposures lasting 24 hours to 14 days.
In general, the four monitors collected data that reflected similar outdoor air quality in each of the four
monitored neighborhoods. The four sites appeared to be similar in the number and identity of COPCs,
total cancer risks, non-cancer hazard indices and risk drivers. A summary table of the results is provided
on the next page.

North Birmingham Air Toxics Risk Assessment
3
North Birmingham Air Toxics Study Summary of Results
Monitoring Site/
Community
Cancer Risk Chronic Non-Cancer Hazard Acute
Hazard Total
Risk
Risk Drivers and %
Contribution to Total
Risk
Hazard
Index
Hazard Drivers and %
Contribution to
Hazard Index
Hudson K-8
School/
Collegeville
1x10⁻⁴
Benzene (47%),
Naphthalene (19%),
Arsenic (7%), 1,3-
Butadiene(5%), Carbon
Tetrachloride (4%),
Benzo(a)pyrene (3%), p-
Dichlorobenzene (3%),
Cadmium (3%)
2 Manganese (44%),
Benzene (13%),
Naphthalene (12%),
Cadmium (10%),
Arsenic (7%), 1,3-
Butadiene (5%)
None
Lewis Elementary
School/North
Birmingham
1x10⁻⁴
Benzene (39%),
Naphthalene (22%),
Arsenic (8%),
Benzo(a)pyrene (6%), 1,3-
Butadiene (6%), Carbon
Tetrachloride (4%), 1,2-
Dichloroethane (3%),
Ethylbenzene (3%)
2 Manganese (51%),
Naphthalene (12%)
Benzene (9%),
Arsenic (7%),
1,3-Butadiene (5%)
Cadmium (5%),
None
Riggins
School/Fairmont
1x10⁻⁴
Benzene (45%),
Naphthalene (25%),
Arsenic (8%),
Benzo(a)pyrene (6%), 1,3-
Butadiene (4%), Carbon
Tetrachloride (3%),
Dibenz(a,h)anthracene
(2%)
2 Manganese (26%),
Naphthalene (24%),
Benzene (19%), Arsenic
(12%), 1,3-Butadiene
(7%)
Cadmium (4%)
Benzene
Exceedances:
3 out 75
samples)
Shuttlesworth
Station/Harriman
Park
1x10⁻⁴
Benzene (37%),
Naphthalene (26%),
Arsenic (11%), 1,3-
Butadiene (5%), Carbon
Tetrachloride (4%), 1,2-
Dichloroethane (4%),
Benzo(a)pyrene (3%)
1 Manganese (36%),
Naphthalene (19%),
Arsenic (13%),
Benzene (12%), 1,3-
Butadiene (6%)
Cadmium (5%),
None

North Birmingham Air Toxics Risk Assessment
4
1.0 INTRODUCTION
This risk assessment was conducted as a part of the North Birmingham Pilot Community Air Toxics
Initiative (BPAT), which was designed in early 2011 by the US Environmental Protection Agency (EPA)
and the Jefferson County Department of Health (JCDH), to address the overall air quality concerns in the
four North Birmingham communities. Previous activities conducted as part of the BPAT include several
outreach and educational workshops on sources of air toxics, permitting of industries, radon, mold,
asthma management, and lead exposure.
The air toxics sampling data used in this risk assessment was collected from air monitors in each of the
four North Birmingham communities. More than 60 samples were taken at each location for 24-hour
periods from June 2011 through August 2012.
The purpose of this risk assessment is to provide information to decision-makers and other stakeholder
on: 1) potential cancer risks and non-cancer hazards posed by chemicals present in ambient air as
measured at the monitoring stations in four north Birmingham neighborhoods; and 2) the chemicals that
pose the most risk to humans through inhalation at these four locations. This risk assessment does not
address past or present health outcomes associated with current or previous exposures, potential risks
through exposure pathways other than inhalation, or potential risks to ecosystems in the vicinity of the
monitors.
This risk assessment was prepared in consideration of available EPA guidance documents, primarily the
Air Toxics Risk Assessment Reference Library Volume 1 (USEPA, 2004). It should be noted, however,
that EPA relies on a number of approaches and assumptions to evaluate environmental data to assess
risks. For this analysis, we considered several approaches and assumptions to calculate risks and found
them to result in similar estimates of risk. The approach and assumptions ultimately used in this
assessment are described in the text of this document, and uncertainties associated with these decisions
are discussed in Section 6.
1.1 Previous Air Studies
In late 2008, a series of articles in USA Today ranked the schools in the United States according to the
risk from air toxics in the air around the schools. The ranking was based on a modeling approach
developed by the newspaper’s contractor. In response to the results of that report, the EPA developed a
health risk screening study, the School Air Toxics (SAT) Initiative, to measure the levels of toxics in the
air around schools throughout the nation to help understand whether the air quality posed potential health
concerns (USEPA, 2009a). In March 2009, EPA selected the schools to be the focus of a targeted
monitoring study using a number of factors, including results from an EPA computer modeling analysis,
results from the newspaper series, and consultation with state and local air agencies. EPA and state and
local air agency partners planned to use the results of this short-term screening study to determine next
steps as they work to protect children’s health where they live, play, and learn.
Three schools in the Birmingham, Alabama, area (Riggins, North Birmingham Elementary School, and
Lewis Elementary School) were selected for the screening study primarily because they were located near
industrial sources of air toxics emissions, including coke plants and a furnace steel mill. Data analyses
suggested that the levels of a number of pollutants at the three schools, some of which are associated with

North Birmingham Air Toxics Risk Assessment
5
coke plant emissions (Benzene, arsenic, naphthalene, and benzo(a)pyrene), posed a potential for concern
based on long-term continuous exposure, particularly in areas of the community close to the source of
emissions. The study also found that manganese, while not found at levels of potential concern at the
Lewis Elementary School, could be found at higher concentrations in other areas. Given that this analysis
was a screening study and was based on limited short-term, EPA decided that a longer-term study was
necessary. Conclusions regarding potential long-term effects of air toxics can only be drawn from a
human health risk assessment that is based typically on a dataset from a minimum of one year of
monitoring. The data collected in this screening study and associated reports are available at
http://www.epa.gov/schoolair/.
In February 2009, the JCDH released the results of a risk assessment based on the Birmingham Air
Toxics Study (JCDH, 2009). The effort consisted of an analysis of air toxics data collected over a one-
year period from (2005-2006) at 4 locations in Birmingham. Samples were collected on a 12-day
schedule for VOCs, SVOCs, and metals. One site, the Shuttlesworth Station, had levels above the long-
term cancer risk acceptability range with benzene contributing most to the cumulative risk. Three sites
were found to have non-cancer hazard indexes greater than 1.
1.2 Description of Study Area
The Birmingham Metropolitan Statistical Area consists of five counties including Jefferson, St. Clair,
Walker, Blount, and Shelby. The City of Birmingham is centrally located in Jefferson County within the
north central portion of the state (see Figure 1.2-1). Jefferson County is physically located in the foothills
of the Appalachian Mountains, which creates a great diversity in topography, varying from fairly level to
very steep while predominantly consisting of hilly terrain with the ridges oriented in a southwest-to-
northeast direction. This topography has played a role in the development of the area as well as
influencing land use. The city was once the primary industrial center of the southeastern United States.
Birmingham is the largest city in Alabama. It has an estimated population of 212,237 and a population
density of 1,453 people per square mile (US Census Bureau, 2010). Age groups most often associated
with sensitivity to chemical exposures (e.g., the young, the elderly, and physically/medically
compromised individuals) are prevalent in the Birmingham area. For example, 7% of the population in
the city of Birmingham is children under the age of 5 and approximately 22% of Birmingham’s
population is under 18. Almost 12% of the population is over 65. The population is predominantly
African American (73%) compared to the entire state 26% African American. Whites represent 23%, and
the remainder, American Indian and Alaska Native, Asians and mixed races, are 4% of the population.
According to the US Census Bureau (2010), about one in four people (26%) in the city of Birmingham
lived below the poverty level between 2006 and 2010 while the state estimate was only 17%. During the
same time period, the median household income was $31,827, about 14% lower than the state’s median
estimate. Between 2000 and 2010, the city lost about 13% of its population while the state gained 8%.
Monthly average temperature, rainfall, and wind speed data for the air sampling period of this study was
obtained from the Birmingham International Airport’s weather station. This data is maintained by the
National Climatic Data Center (NCDC, 2012) and is presented in Table1.2-1. The warmest month was
August 2012 with an average monthly temperature of 83.4 degrees Fahrenheit (ºF). The lowest average
monthly temperature of 38.8ºF occurred in January 2012. The monthly average rainfall varied from 0.48
inches in August 2011 to 12.1 inches in September 2011. The wind rose for the Birmingham area during
the period of June 2011 to August 2012 is presented in Figure 1.2-2. A wind from the north implies that

North Birmingham Air Toxics Risk Assessment
6
airborne chemicals will predominantly move from north to south across the monitoring areas. The wind
rose for the sampling period shows calm conditions about 36% of the time and winds from all directions
the remainder of the time, with some peaks for winds out of the north, northwest, and southeast. (See
Figure 1.2-2)
1.3 Organization of This Report
The remainder of this report is organized into the following main sections:
Section 2, Data Collection and Analysis, presents details for the monitoring sites used in this
assessment along with sampling and preliminary data analysis. Chemicals that were detected at
least once are listed, and the Chemicals of Potential Concern (COPCs) are identified and listed for
each monitoring site.
Section 3, Exposure Assessment, determines exposure concentrations for each COPC. This
section discusses both chronic (lifetime) and acute (hours to several days) exposures.
Section 4, Toxicity Assessment, describes the hazard identification, dose-response assessment,
and the potential health effects associated with the COPCs.
Section 5, Risk Characterization, describes how cancer risks and chronic and acute non-cancer
hazards are determined. It provides also a summary of the risk assessment results at each
monitoring site.
Section 6, Uncertainty Analysis, summarizes important sources of uncertainty in this assessment
and the potential impacts on the risk and hazard estimates.
Section 7 summarizes the conclusions of the risk assessment.
References are provided in Section 8 followed by a Glossary of important acronyms and terms.

North Birmingham Air Toxics Risk Assessment
7
2.0 DATA COLLECTION AND ANALYSIS
This Section describes the monitoring process and summarizes the analytical data collected at the four
monitors located in North Birmingham. Chemicals that were detected at least once at a given monitor and
chemicals of potential concern (COPCs) were identified for detailed analysis. For the risk assessment,
each monitor location is evaluated separately; as such, the data analysis and selection of the COPCs are
presented individually for each monitor.
2.1 Site Selection and Monitoring
In June 2011, the EPA and JCDH started the North Birmingham Pilot Community Air Toxics Initiative
(BPAT). The BPAT included a one-year air toxics monitoring and risk assessment study and several
outreach and educational workshops on sources of air toxics, permitting of industries, radon, mold,
asthma management, and lead exposure. The air monitoring portion of this initiative was designed to
collect ambient air data that characterized the airborne concentrations of toxic air pollutants in four
communities in the North Birmingham area.
The four communities selected for this air monitoring study were: Harriman Park, Collegeville, North
Birmingham, and Fairmont. These communities were selected based on data from previous studies that
suggested the possibility of ongoing air quality concerns. Monitoring stations were established at Hudson
K-8 School in Collegeville, Lewis Elementary School in North Birmingham, Riggins School in Fairmont,
and at the Shuttlesworth Monitoring Station in Harriman Park. Figure 2.1-1 provides approximate
locations of the monitoring sites. Each of the sites was selected to represent a different scenario of land
uses and potential types of sources of air pollution. A brief description of each site follows.
Hudson K-8 School Site
The Hudson K-8 School site is located on the roof of the school at 3300 Huntsville Road North,
Birmingham, Alabama, 35207, in the Collegeville Neighborhood. This site is in the vicinity of a recovery
metallurgical coke plant and a steel mill. The area around the site also includes residential homes,
churches, and small businesses.
Lewis Elementary School Site
The Lewis Elementary School site is located on school’s property off Finley Blvd. at 2015 26th
Avenue
North, Birmingham, Alabama, 35234. This site is near mobile sources (roadways), gasoline dispensing
facilities, and a ductile iron pipe manufacturing facility. The area around the site consists of mixed
commercial/industrial and residential. Lewis Elementary School was also a monitoring site during the
short-term School Air Toxics Study.
Riggins School Site
The Riggins School site is located on school property in the Fairmont Neighborhood at 3177 44th
Court
North, Birmingham, Alabama, 35207. This site is near an asphalt batch plant and a recovery
metallurgical coke plant. The area surrounding the site is primarily residential. This site was also a
monitoring site during the short-term School Air Toxics Study.

North Birmingham Air Toxics Risk Assessment
8
Shuttlesworth Station Site
The Shuttlesworth site is located at 4113 Shuttlesworth Drive, Birmingham, Alabama, 35207. This site is
near several large industrial sources, including a recovery metallurgical coke plant, asphalt batch plant
and quarrying operations. This monitor is located alongside a road that serves as a major thoroughfare for
both industrial and residential vehicular traffic. The area around the site is a residential/industrial mixture.
The monitor at this site was also used to collect air toxics samples for the 2009 Birmingham Air Toxics
study.
2.2 Monitoring Schedule and Analytical Parameters
Monitoring at the four sites was planned to be conducted over a one-year period, from June 2011 to June
2012. To account for potential seasonal variability, the monitoring consisted of collecting samples every
sixth day, which would have resulted in approximately sixty sampling events at each location. However,
the sampling was extended to August 2012 to replace samples that were void, missed or invalidated as a
result of, for example, laboratory errors or malfunctioning equipment during the originally planned 1-year
sampling period (See Section 2.3.1). From June to August 2012, samples were collected every third day
at sites that had incomplete data sets after one year of sampling. In all cases, each composite sample was
collected over a 24-hour period to account for potential temporal/diurnal variability. Samples were
collected and handled according to the procedures presented in the Quality Assurance Project Plan
(QAPP), which is available at http://www.epa.gov/ttn/amtic/files/ambient/airtox/2009sat/SATQAPP.pdf.
Three types of chemicals were collected at the four monitoring sites. They are defined by unique
characteristics as shown below. Separate monitoring devices were used to evaluate air quality for each of
these groups of chemicals.
Volatile Organic Compounds (VOCs)
VOCs are organic chemicals that have a high vapor pressure and tend to have low water solubility. They
have a high propensity to evaporate and remain airborne. Many VOCs are human-made chemicals that are
used in the manufacture of paints, pharmaceuticals, and refrigerants. VOCS are commonly used as
industrial solvents, such as trichloroethylene , or are created as by-products, such as chloroform produced
as a result of chlorination in water treatment. VOCs (e.g., benzene) are often components of petroleum
fuels, hydraulic fluids, paint thinners, and dry cleaning agents.
Semi-Volatile Organic Compounds (SVOCs)
SVOCs are organic chemicals that have a lower vapor pressure than VOCs and, thus, have a lower
propensity to evaporate from the liquid or solid form. Once airborne, they also tend to condense out of the
gas phase more readily. Examples of SVOCs include most organic pesticides (e.g., chlordane), and certain
components of petroleum, such as polycyclic aromatic hydrocarbons. Note that the demarcation between
SVOCs and VOCs is not exact. For example, the two separate air sampling and analytical methods for
VOCs and SVOCs will both usually detect naphthalene when present, indicating that this chemical is on
the lower end of the VOC scale of volatility and on the higher end of the SVOC scale of volatility. In
general, as chemicals increase in molecular weight and/or polarity, they become more SVOC-like.

North Birmingham Air Toxics Risk Assessment
9
Metals
Metals are a group of elements with a set of distinct characteristics that can be found across much of the
periodic chart. Metals can exist in particle form, including as a constituent of particulate matter (PM).
Some metals exist in liquid or gaseous form. Metals can react with other chemicals to form a variety of
metal-containing compounds.
A complete list of all chemicals sampled for at each of the four monitoring sites and analyzed in the
laboratory for concentration levels is presented in Table 2.2-1. The list consists of a total of 91 chemicals,
of which 58 are VOCs, 22 are SVOCs, and 11 are metals.
2.3 Data Quality and Validation Analysis
2.3.1 Air Monitoring Data and Analysis
The monitors at each site collected samples on the same schedule whenever possible. Rigorous data
validation and quality assurance/quality control procedures were implemented for both sample collection
and laboratory sample analysis. All samples were validated by checking monitoring parameters, including
sampling flow rates. Samples were invalidated if: 1) The samplers did not run continuously over the 24-
hour period; 2) When equipment malfunctions occurred; and/or 3) when the monitors did not maintain
proper flows. Whenever samples were invalided, additional samples were collected on a three-day
schedule beyond the originally planned 1-year sampling period in order to obtain at least 60 valid samples
at each of the monitoring sites. Quality Assurance/Quality Control measures used in this study included
collecting and analyzing duplicate samples and preparing and analyzing laboratory replicates, field
blanks, and laboratory blanks.
Table 2.3.1-1 contains the sampling dates on which each valid samples was collected at each monitoring
site. From June 24, 2011 to August 26, 2012, monitoring was reported for 75, 75, 75, and 72 sampling
dates at the Hudson K-8 School, Lewis Elementary School, Riggins School, and Shuttlesworth Station
sites, respectively.
2.3.2 Acrolein Sampling and Analysis Issues
Acrolein is a widespread pollutant that is an eye and respiratory irritant. The National Air Toxics
Assessment (NATA) analysis of the 2005 inventory of air toxics emissions data indicates that acrolein is
prevalent in many communities throughout the country, including Birmingham. Acrolein is a product of
incomplete combustion and comes from fires, boats and planes, wood heating, industrial boilers and
exhaust from cars and trucks. It is also found in cigarette smoke and smoke from cooking animal fats, and
can form in the air when other chemicals break down. Children and adults with asthma and allergies may
be more sensitive to Acrolein.
EPA, state and local air quality agencies are concerned about acrolein in the outdoor air and are working
to reduce this pollutant across the country. However, results of a recent short-term laboratory study have
raised significant questions about the consistency and reliability of acrolein monitoring results. It is one of
the most difficult chemicals to measure in the air because it reacts easily with other chemicals to form

North Birmingham Air Toxics Risk Assessment
10
other compounds thus complicating laboratory analysis. This result is that, while we know that monitors
are detecting acrolein in the air, we cannot determine precisely how much. In light of this uncertainty,
EPA did not use acrolein monitoring data in evaluating the potential for health risks from exposure to air
toxics in the School Air Toxics Monitoring Project. The Agency concluded that additional work is
necessary to improve the accuracy of acrolein sample collection and analytical methods and is in the
process of evaluating promising new technologies that may provide accurate data. To learn more about
acrolein issues and the status of the project visit the SAT website:
http://www.epa.gov/schoolair/pdfs/acroleinfsupdate.pdf.
The EPA decided not to perform analysis of acrolein data in this study because the data were collected
and analyzed using the same problematic protocol as that associated with the SAT study. Additionally,
concentration levels detected in this study were generally similar to what air quality monitors at other
locations have measured in recent years. For example, similar levels were found in the SAT project at two
locations in North Birmingham, the Birmingham air toxics study (JCDH, 2009), and the Loudon County,
TN air toxics study (USEPA, 2009b). In all of these studies, the monitoring process and analytical
methods were the same.
2.4 Air Sample Laboratory Analysis
All the samples were analyzed in the Eastern Research Group (ERG) laboratory in Morrisville, NC.
Laboratory analyses were performed using EPA-approved methods, as follows:
Compendium Method TO-15 for the analysis of VOCs air toxics. Samples were analyzed with the
gas chromatograph/flame ionization detector/mass selective detector (GC/FID/MSD) using the
Entech Instruments preconcentrator and 16-position autosamplers. The method is applicable to
ambient air, indoor air, landfill gas, and any air samples where VOCs are not present at levels
above hundreds of parts per billion by volume (ppbv). A copy of the document detailing this
procedure is available at the EPA website at: http://www.epa.gov/ttnamti1/airtox.html
Compendium Method TO-13A for the analysis of SVOCs. The method uses Selected Ion
Monitoring procedures with gas chromatography. More information is available :
http://www.epa.gov/ttnamti1/airtox.html
Compendium Method IO-3.5. This method is for the sample preparation and analysis of
suspended particulate matter. Metals are determined by Inductively Coupled Plasma - Mass
Spectrometry (ICP-MS). A copy of this procedure is available at:
http://www.epa.gov/ttn/amtic/inorg.html.
All detection limits were reported as Method Detection Limits (MDLs) for each chemical contaminant
and by each analytical method. The detection limits were determined by the ERG laboratory using 40
CFR, Part 136 Appendix B procedures (USEPA, 2005a) in accordance with the specifications presented
in the National Air Toxics Trends Station (NATTS) Technical Assistance Document (USEPA, 2009c). By
definition, MDLs represent the lowest concentration at which laboratory equipment can reliably quantify
concentrations of specific pollutants at a specific confidence level. If a chemical concentration in ambient
air did not exceed the method sensitivity (as gauged by the MDL), the analytical method might not
differentiate the pollutant from other pollutants in the sample or from the random “noise” inherent in

North Birmingham Air Toxics Risk Assessment
11
laboratory analyses. While quantifications below the MDL were sometimes reported in the analytical
results, the measurement reliability is lower. Therefore, all measurements under the respective MDL were
considered non-detects in this study.
2.5 Data Screening and Preliminary Analysis
The purpose of selecting a subset of all detected chemicals is to narrow the focus of the risk assessment to
just those chemicals detected during the monitoring study that are thought to have a significant
contribution to inhalation risk at a given monitoring location. The basic steps used in the screening
analysis and selection process to identify chemicals of interest were as follows:
1. Chemicals that were not detected at or above the detection limit in any of the samples at a monitoring
site were eliminated and not carried through the risk assessment of monitoring data at that site.
2. Chemicals that were detected at or above the detection limit at least once but that did not have available
dose-response values were retained for further analysis (See Section 4.0). At the end of this analysis, if a
dose-response value was not available and could not be derived from ancillary sources, the chemical was
excluded from the risk assessment.
3. Chemicals that were detected at least once at a monitoring site and for which dose-response values
were available were retained and used in the acute hazard characterization analysis (see Section 5.2). The
rational for retaining these chemicals for acute hazard characterization only, is that a chemical that is
detected just once, or a few times, has the potential to result in an acute health hazard if present at
relatively high concentrations.
4. Chemicals that were detected in 10% or more of the samples were selected as Chemicals of Potential
Concern (COPCs). These COPCs were used in the chronic risk and hazard assessments. It is important to
note that the selection of COPCs also eliminated from further consideration chemicals of low detection
frequencies but with relatively high concentrations. Pollutants with this pattern of detection are not
expected to result in significant exposure concentrations or chronic health impacts.
2.6 Chemical Screening Results
The results of the screening process are summarized in Tables 2.6-1 to 2.6-4 for all four monitors. These
tables show chemicals that were detected at or above respective detection limits at least once, associated
frequencies of detection and other descriptive statistics. Chemicals showing frequencies of detection of
10% or above were COPCs as indicated by an “X” in the last column of the tables. Fifty five chemicals
out of a total of 91 were detected at least once in samples collected from the Hudson K-8 School site.
Similarly, 44 chemicals for Lewis Elementary School, 46 chemicals for the Riggins School, and 45
chemicals for Shuttlesworth Station site were detected. The number of COPCs identified at these sites
was 38, 38, 37, and 37 at the Hudson K-8 School, Lewis Elementary School, Riggins School, and
Shuttlesworth Station sites, respectively (Table 2.6-5).
.
Note that there is general agreement among the number and identity of COPCs identified at all four of
these sites (See Table 2.6-5), indicating that air quality is relatively similar from site to site (but with

North Birmingham Air Toxics Risk Assessment
12
some important differences as discussed below). About a third of the 58 VOCs sampled and analyzed
for, a third of the 22 SVOCs, and all 11 metals, except Antimony, were identified as COPCs at these sites.
A side by side comparison of monitoring sites in terms of maximum concentrations and frequency
distributions shows some similarities but also some differences among the sites (Table 2.6-6). For
example, all sites were identical with respect to COPCs, except for the chemical Trichloroethylene, which
was a COPC at Hudson K-8 School and Lewis Elementary School sites, but not at Riggins School and
Shuttlesworth Station sites. The detection frequencies were also similar across the sample locations.

North Birmingham Air Toxics Risk Assessment
13
3.0 EXPOSURE ASSESSMENT
Exposure assessment is the process that characterizes the route, duration, intensity, and frequency of
contact with a chemical by a receptor. In this assessment, the potential receptors were individuals that
may reside within the communities surrounding the monitoring sites, and the exposure route was
inhalation. Two exposure durations were evaluated: chronic and acute.
3.1 Assessment of Chronic Exposures
Chronic exposures are usually relatively long in duration, but relatively low in concentration and may
result in health effects that do not show up immediately and that persist over the long term, such as
cardiovascular disease, respiratory disease, liver and kidney disease, reproductive effects, neurological
damage, and cancer.
The 95th
% Upper Confidence Limit (95UCL) of the long-term average concentration for each COPC at
each monitoring site was estimated to represent a public health conservative estimate of chronic exposure
to outdoor air at that location. The 95UCL is used in lieu of the arithmetic mean of the sampling results
because the latter may underestimate the true annual average. The 95UCL is more likely to overestimate
the true long-term average exposure and unlikely to underestimate the true chronic exposure. EPA’s
Superfund program has routinely used this procedure to evaluate exposures at hazardous waste sites, and
this process has garnered long-term acceptance as a public health protective approach, in light of the
uncertainties (e.g., using monitoring data collected every sixth day to represent air quality on unsampled
days). EPA’s air toxics program also uses this approach as indicated in its Air Toxics Risk Assessment
guidance documents (USEPA, 2004). The following assumptions were used in the assessment of chronic
exposure at the 95UCL:
A person lives, works, and otherwise stays near a given monitoring location 24 hours per day for a 70-
year lifetime.
The air that the person breathes, both while indoors and outdoors, contains the same concentrations of
pollutants measured in this North Birmingham study.
Air quality, as reflected by the monitoring results, was assumed to remain constant over the entire 70-
year lifetime of a person living in the area.
A concentration equal to one half of the detection limit was assigned to non-detects for COPCs.
Using one half of the detection limit, when no chemical was detected due to equipment limitations (or
the chemical was detected below the detection limit), assumes that a chemical may be present in the
environment, although at undetectable quantities. It should be noted that the USEPA recommends the
Sample Quantitation Limits (SQLs), as opposed to the minimum detection limits, be used when they
are available from the laboratory. EPA also suggests that MDLs may be used if SQLs cannot be
obtained (see Air Toxics Risk Assessment Reference Library. Vol. 1. Appendix H). In this case, SQLs
were not available.
The arithmetic mean, median and standard deviation of the chemical data were calculated as follows:

North Birmingham Air Toxics Risk Assessment
14
The arithmetic mean was calculated as:
n
cc
n
i i 1 Equation 3-1
where:
c = the arithmetic mean concentration;
ci = an individual sample measurement; and
n = the total number of sample measurements.
The standard deviation was calculated as:
1
)(1
2
n
ccs
n
i i Equation 3-2
where:
s = the standard deviation of the concentration data;
c = the arithmetic mean concentration;
ci = an individual sample measurement; and
n = the total number of sample measurements.
The median concentration was calculated for each chemical and monitor as the concentration value of the
term in the middle of all the number of concentration data points if this number was odd. If the number of
concentration data was even, then the median was the average concentration of the two terms in the
middle.
The 95UCL value for normally distributed data is calculated using the following formula:
n
tscc 95
95
Equation 3-2
where:
95c = 95th
percentile upper confidence limit on the mean;
c = the arithmetic mean concentration;
s = the standard deviation of the concentration data;
t95 = student’s t statistic based on n-1 degree of freedom; and
n = the total number of sample measurements.
The 95UCL of the mean for each COPC was calculated based on the distribution of the chemical’s
sampling data using ProUCL version 4.1 (USEPA, 2010). For highly skewed concentration datasets,
those that did not fit any known distribution such as normal, lognormal, and gamma, ProUCL used
nonparametric tests such as Chebyshev (mean Sd) to derive the exposure concentrations.
The 95UCL calculated values for chronic exposure concentrations of all COPCs at all four monitoring
sites are presented in Tables 3.1-1 to 3.1-4. These concentration values are the numbers used to represent

North Birmingham Air Toxics Risk Assessment
15
chronic exposure concentrations of COPCs and are expressed in micrograms-per-cubic-meter (µg/m3).
Other descriptive statistics were developed and are provided in the tables, including minimum, maximum,
mean, and median concentrations, and the standard deviation. Note that the minimum chemical values in
these tables may be surrogate values of ½ MDLs if the chemicals had at least one non-detect.
3.2 Assessment of Acute Exposures
Acute exposures are usually relatively short in duration (up to 24 hours), but relatively high in
concentration and may result in immediate respiratory and sensory irritation, chemical burns, narcosis,
eye damage, and various other effects (USEPA, 2004). Health effects that people may experience due to
short–term exposures to airborne contaminants can vary significantly from those experienced after long-
term exposure to low doses, depending on the contaminant and its concentration. For example, a
substance that produces an increase in lung cancer risk after exposure to low concentrations continuously
over a long period of time might also cause immediate and severe eye irritation if present at sufficiently
high levels for a short period of time.
An acute exposure assessment is, however, more challenging than an assessment of chronic exposures.
This is because available acute dose-response values are more diverse than chronic values; specifically,
they were developed for a variety of purposes and frequently are based on different exposure durations.
As a conservative approach for this risk assessment, the highest sampled concentration of each pollutant
that was detected at least once at a monitoring site was compared to available acute exposure benchmark
concentrations. Reliance on maximum measured concentrations to evaluate the potential for adverse
effects from short-term exposures, as opposed to upper confidence limits of means, treats each sample
independently, and thus avoids the potential to “average out” spikes in concentration. All chemicals that
were detected at least once were used in the acute characterization rather than just the COPCs. This is
because a chemical, although it may detected only once or a few times, may have elevated concentrations
high enough to cause short-term effects.

North Birmingham Air Toxics Risk Assessment
16
4.0 TOXICITY ASSESSMENT (DOSE-RESPONSE ASSESSMENT)
The purpose of the toxicity assessment is to weigh available evidence regarding the potential for toxicity
in exposed individuals (hazard identification) and to quantify the toxicity by deriving an appropriate
dose-response value (dose-response assessment). Although the toxicity assessment is an integral and
important part of the overall air toxics risk assessment, it is usually accomplished prior to the risk
assessment. EPA has completed this toxicity assessment for many toxic air pollutants and has made
available the resulting toxicity information and dose-response values for both chronic and acute
exposures. One set of dose-response values has been developed for cancer-causing chemicals. A separate
set of dose-response values has been developed for other non-cancer health effects (such as neurological
damage). The assessment of risks posed by chronic exposure to chemicals typically evaluates the
potential for chemicals to pose both cancer risks and non-cancer hazards. Assessment of acute exposures
is usually limited to an assessment of non-cancer hazard (although cancer risks from short term, high-
level exposures cannot be ruled out).
In general, these chronic and acute dose-response values were developed by the EPA and other
government bodies. The chronic dose-response values used in this risk assessment were taken from EPA’s
Dose-Response Assessment for Assessing Health Risks Associated with Exposure to Hazardous Air
Pollutants – Chronic Table 1, except for Lead (Pb). It is important to note that the value for lead in this
table is not a dose-response value but its national ambient air quality standard (NAAQS). As a result,
lead was analyzed as a criteria pollutant and not as a hazardous air pollutant (HAP) (See Section 5.1.5).
The acute dose-response values used in this risk assessment were retrieved from Acute Table 2 of this
same reference. Both tables can be found online at http://www.epa.gov/ttn/atw/toxsource/summary.html.
The toxicity values in Chronic Table 1 were themselves selected from available sources, based on the
general hierarchy of data sources advocated by the USEPA’s Office of Air Quality Planning and
Standards (OAQPS). Wherever available, USEPA Inhalation Unit Risk estimates (IUR) for cancer and
USEPA reference concentrations (RfCs) for non-cancer effects were used. When these values were not
available, other toxicity values were used in the following hierarchical preference: (i) chronic minimal
risk levels (MRLs) developed by ATSDR, (ii) California EPA inhalation unit risks and reference exposure
levels (RELs), and (iii) USEPA’s Health Effects Assessment Summary Table (HEAST) values. A
description of each of these sources of information follows. Some chemicals lack inhalation assessments
from these sources and, therefore, were not carried through the quantitative risk assessment. The potential
consequences of having omitted these chemicals from the quantitative risk estimates are discussed in the
uncertainty analysis. The toxicity values in Acute Table 2 were themselves selected from a set of
available sources as described in Section 4.2 below.
U.S. Environmental Protection Agency (EPA). EPA has developed dose-response assessments
for chronic exposure to many pollutants. These assessments typically specify an RfC (to protect
against effects other than cancer) and/or IUR (to estimate the probability of contracting cancer).
Background documents, particularly for the more recent files, also contain information on physical
and chemical properties, toxicokinetics, and hazard characterization. EPA disseminates dose-
response assessment information in several forms, based on the level of review. Dose-response
assessments that have achieved full intra-agency consensus are incorporated in the Integrated
Risk Information System (IRIS), which is regularly updated and available on-line
(www.epa.gov/iris). All IRIS assessments since 1996 also have undergone independent external
North Birmingham Air Toxics Risk Assessment
17
peer review. In the past, dose-response assessments for some substances were prepared by the
EPA Office of Research and Development, but were never submitted for EPA consensus. EPA has
assembled the results of many such assessments in the Health Effects Assessment Summary
Tables (HEAST). Although the values in HEAST have undergone some review and have the
concurrence of individual Agency program offices, they have not had enough review to be
recognized as Agency-wide consensus information. In addition, since HEAST has not been
updated since 1997, other sources described here are, for many chemicals, more reliable.
Agency for Toxic Substances and Disease Registry (ATSDR). ATSDR, which is part of the US
Department of Health and Human Services, develops and publishes Minimum Risk Levels
(MRLs) for many toxic substances. The MRL is defined as an estimate of daily human exposure to
a substance that is likely to be without an appreciable risk of adverse effects (other than cancer)
over a specified duration of exposure. MRLs are derived for acute (1-14 days), intermediate (>14-
364 days), and chronic (365 days and longer) exposures by inhalation and oral routes. ATSDR
describes MRLs as substance-specific estimates to be used by health assessors to select
environmental contaminants for further evaluation. MRLs are considered to be levels below which
contaminants are unlikely to pose a health threat. Exposures above an MRL do not necessarily
represent a threat, and MRLs are therefore not intended for use as predictors of adverse health
effects or for setting cleanup levels. The MRL data undergo a rigorous review process, including
internal ATSDR review, peer reviews, and public comment periods. The ATSDR chronic MRL is
used where no IRIS value is available, because the MRL's concept, definition, and derivation are
philosophically consistent (though not identical) with EPA's guidelines for assessing noncancer
effects. ATSDR publishes MRLs as part of pollutant-specific toxicological profile documents, and
also in regularly-updated on-line tables.
California Environmental Protection Agency (CalEPA). The CalEPA Office of Environmental
Health Hazard Assessment (OEHHA) has developed dose-response assessments for many
substances, based both on carcinogenicity and health effects other than cancer. The process for
developing these assessments is similar to that used by EPA to develop IRIS values and includes
significant external scientific peer review. The non-cancer information includes inhalation health
risk guidance values expressed as chronic inhalation reference exposure levels (RELs). CalEPA
defines the REL as a concentration level at (or below) which no health effects are anticipated, a
concept that is substantially similar to EPA’s approach to non-cancer dose-response assessment.
CalEPA’s quantitative dose-response information on carcinogenicity by inhalation exposure is
expressed in terms of the IUR, defined similarly to EPA’s IUR. Specific CalEPA Unit Risk
Estimates (UREs) are used where no IRIS values exist. CalEPA’s dose response assessments for
carcinogens and noncarcinogens are available on-line at
http://www.oehha.org/air/hot_spots/index.html.
International Agency for Research on Cancer (IARC). The IARC, a branch of the World
Health Organization, coordinates and conducts research on the causes of human cancer and

North Birmingham Air Toxics Risk Assessment
18
develops scientific strategies for cancer control. The IARC sponsors both epidemiological and
laboratory research, and disseminates scientific information through meetings, publications,
courses and fellowships. As part of its mission, the IARC assembles evidence that substances
cause cancer in humans and issues judgments on the strength of evidence. IARC’s categories are
Group 1 (carcinogenic in humans), Group 2A (probably carcinogenic), Group 2B (possibly
carcinogenic), Group 3 (not classifiable), and Group 4 (probably not carcinogenic). The
categorization scheme may be applied to either single chemicals or mixtures; however, IARC does
not develop quantitative dose-response metrics such as UREs. IARC’s categories for substances
support or augment EPA’s weight-of evidence (WOE) determinations, which do not cover all
substances and in some cases may be out-of-date. The list of IARC evaluations to date is available
on-line at http://www.IARC.fr.
The remainder of this section describes in more detail the hazard assessment process, the types of chronic
and acute dose-response values that were used in this inhalation risk assessment, and additional
information on the sources of these dose-response values.
4.1 Hazard Assessment for Chronic Effects
The hazard assessment, or hazard identification, process is usually part of an existing dose-response
assessment for a chemical, and provides a summary of the available toxicity information for the air toxics
being studied, and includes the weight of evidence determination and identification of critical effects. This
step should answer the following questions:
• Can exposure to a chemical be linked causally to particular health effects?
• Could these effects occur at environmentally relevant concentrations?
• What is the nature and strength of the evidence of causation?
In the hazard identification step, evidence is gathered from a variety of sources regarding the potential for
an air toxic to cause adverse health effects in humans for exposures occurring at relatively low levels over
a long period of time (i.e., chronic exposure) and occurring at relatively high concentrations over
relatively short exposure durations (i.e., acute exposure). These sources may include human data,
experimental animal studies, and supporting information such as in vitro laboratory tests. The source and
quality of data affects the overall uncertainties in the resulting human chronic dose-response values.
Human data. Human toxicity data associated with exposures to air toxics may be generated from
epidemiological studies, controlled exposure studies, or studies of accidental exposures. Well-
conducted epidemiological studies that show a positive association between exposure to a
chemical and adverse health effects often provide evidence about human health effects associated
with chronic exposures. Such data, however, are available only for a limited number of air toxics.
Epidemiological data also are very difficult to interpret, because the number of exposed
individuals may be small, the incidence of effects may be low, doses are usually not well-
characterized, and there may be complicating factors such as simultaneous exposure to multiple

North Birmingham Air Toxics Risk Assessment
19
chemicals and heterogeneity among the exposed group in terms of age, sex, diet, and other factors.
Controlled exposure studies provide stronger evidence, since both the exposure duration and
exposure concentrations are more accurately known. However, such studies with humans are
generally limited to acute exposure durations. Studies reporting health effects associated with
accidental exposures may be helpful, although exposure concentrations to air toxics may be high,
and effects may be acute rather than chronic. In addition, a small sample size is often a significant
limitation to interpreting controlled and accidental exposure studies.
Animal data. The toxicity database for most air toxics is drawn from experiments conducted on
non-human mammals such as rats, mice, rabbits, guinea pigs, hamsters, dogs, or monkeys. The
underlying assumption is that the susceptibility of humans and these animals to the effects of the
chemicals is broadly similar because we share many common biological attributes (e.g., similar
organs, similar and, in some cases, identical metabolic processes). However, some observations in
animals may be of uncertain relevance to humans (e.g., if tumors are observed in an animal
experiment, but the organ in which the tumor is formed does not exist in humans). Also, it is
necessary to adjust the results from animal studies to humans due to differences in body mass,
anatomy, metabolic rate, and other species-specific factors (see, for example, Section 12.3.3). This
is why derivation of dose-response values from animal studies requires considerable expertise.
Supporting data. Metabolic, pharmacokinetic, and genotoxicity studies are sometimes used to
infer the likelihood of adverse effects in humans. Metabolic studies on absorption, distribution,
metabolism and elimination can provide information about the mechanisms of toxicity associated
with a particular chemical in humans. In physiologically-based pharmacokinetic (PBPK) models
the body is subdivided into a series of anatomical or physiological “compartments” that represent
specific organs or lumped tissue and organ groups, and the behavior of the chemical is modeled in
each compartment. Data on a chemical’s pharmacokinetics, genotoxicity, and possible mode of
action can be used to refine a toxicity assessment. In some cases, computer models using
structure-activity relationships (i.e., predictions of toxicological activity based on analysis of
chemical structure) also may be used as supporting evidence. EPA considers these types of data to
be supportive, not definitive, evidence of a chemical’s toxicity.
In hazard identification of carcinogens under the EPA guidelines, human data, animal data, and
supporting evidence are combined to characterize the weight–of–evidence (WOE) regarding the agent's
potential as a human carcinogen. Under this approach, the following categories have been established
(USEPA, 1986):
Group A – Carcinogenic to Humans: Agents with adequate human data to demonstrate the causal
association of the agent with human cancer (typically epidemiological data).
Group B – Probably Carcinogenic to Humans: Agents with sufficient evidence (i.e., indicative of a
causal relationship) from animal bioassay data, but either limited (i.e., indicative of a

North Birmingham Air Toxics Risk Assessment
20
possible causal relationship, but not exclusive of alternative explanations) human
evidence (Group B1), or with little or no human data (Group B2).
Group C – Possibly Carcinogenic to Humans: Agents with limited animal evidence and little or no
human data.
Group D – Not Classifiable as to Human Carcinogenicity: Agents without adequate data either to
suggest or refute the suggestion of human carcinogenicity.
Group E – Evidence of Non–carcinogenicity for Humans: Agents that show no evidence for
carcinogenicity in at least two adequate animal tests in different species or in both
adequate epidemiologic and animal studies.
Weight-of-evidence determinations for carcinogenicity developed by the International Agency for
Research on Cancer (IARC) were used for carcinogens not characterized by USEPA. Carcinogens are
categorized by IARC as Group 1 (agents carcinogenic to humans), Group 2A (probable human
carcinogen), and Group 2B (possible human carcinogen).
The USEPA has revised the Guidelines for Carcinogenic Risk Assessment (USEPA, 2005b). Revisions
to the Cancer Guidelines are intended to make greater use of the increasing scientific understanding of
processes of cancer development. One area is the use of default options applied when critical information
about the human health effects of a substance is lacking. For example, if no information is available
regarding the human health effects of a substance, then a common default option is to assume that adverse
health effects seen in animals from exposure to a substance have the potential to occur in humans as well.
The revised Guidance provides greater detail on the EPA’s policy for using the default options. The
weight-of-evidence approach to characterizing the potential for a substance to be a human carcinogen has
been retained, but a more complete narrative summary of the available evidence and the uncertainties and
default assumptions used is recommended. The new guidelines also stress the importance of
understanding the effects that a substance may cause in the body and how they might lead to the
development of cancer. This information can be useful in determining the potency of a chemical as a
carcinogen, the potential effects at low doses, who may be more susceptible to the substance, and whether
animal studies are reliable indicators of potential effects in humans. The Guidelines have placed particular
emphasis on the potential for increased vulnerability on childhood exposures. Although the new guidance
is available, Regional risk assessments are not including the new narrative approach until such is applied
in available Toxicity tables.
With regard to characterization of the available information on non-cancer health effects (or including
cancer, if a threshold mode of action has been established), the targets of chemical toxicity within the
body are identified, along with what have been termed “critical effects” associated with the toxicity. A
critical effect is described as “either the adverse effect that first appears in the dose scale as dose is
increased, or as a known precursor to the first adverse effect.”
Underlying this designation is the assumption that if the critical effects are prevented, then all other
adverse effects observed at higher exposure concentrations or doses are also prevented. Note that not all
observed effects in toxicity studies are considered adverse effects. The identification of the critical
effect(s) depends on a comprehensive review of the available data with careful consideration of the
exposure conditions associated with each observed effect, so that comparisons of effect levels or potential
reference values are made on a common basis. A more comprehensive discussion of hazard identification

North Birmingham Air Toxics Risk Assessment
21
and the evaluation of the underlying database for non-cancer effects is included in the EPA documents
Methods for Derivation of Inhalation Reference Concentrations and Application of Inhalation Dosimetry
(USEPA, 1994) and A Review of the Reference Dose and Reference Concentration Process (USEPA,
2002).
4.1.1 Cancer Toxicity Values
A cancer toxicity value is a numerical value that, when matched with environmental exposure data,
provides an estimate of the risk of developing cancer in the exposed population. For a carcinogen, the
inhalation toxicity value is generally expressed as a risk per unit concentration of the chemical in air (e.g.,
risk per μg/m3). This value is called an Inhalation Unit Risk (IUR) factor.
Also note that only those substances that are known or suspected human carcinogens were considered in
calculating cancer risks (USEPA WOE groups A, B, or C, or IARC classifications of 1, 2A or 2B). The
toxicity information resulting from this assessment is presented later in Tables 5.1.1-1 to 5.1.1-4.
4.1.2 Chronic Non-cancer Values
For non–cancer effects, toxicity benchmarks are generally expressed as a concentration in air (e.g., an
inhalation reference concentration or RfC in units of mg/m3 air). The RfC is an estimate (with uncertainty
spanning perhaps an order of magnitude) of a continuous inhalation exposure to the human population
(including sensitive subgroups) that is likely to be without an appreciable risk of deleterious effects during
a lifetime. The RfC considers toxic effects for both the respiratory system (portal-of-entry) and for effects
peripheral to the respiratory system (extra-respiratory effects).
Inhalation RfCs are derived according to Methods for Derivation of Inhalation Reference Concentrations
and Application of Inhalation Dosimetry (USEPA, 1994). Because RfCs can also be derived for the
noncarcinogenic health effects of substances that are carcinogens, it is essential to refer to other sources of
information concerning the carcinogenicity of dual effect chemicals.
The toxicity information resulting from this assessment is presented later in Tables 5.1.2-1 to 5.1.2-4.
Inhalation Unit Risk (IUR): The upper-bound excess lifetime
cancer risk estimated to result from continuous exposure to an
agent via inhalation per µg/m3
over a lifetime. The interpretation of
the IUR would be as follows: if IUR = 2×10⁻⁶
per µg/m3, not more
than 2 excess tumors are expected to develop per 1,000,000 people
if exposed continuously for a lifetime to 1μg of the chemical per
cubic meter of inhaled air. The number of expected tumors is
likely to be less; it may even be none.
North Birmingham Air Toxics Risk Assessment
22
4.2 Hazard Assessment for Acute Effects
The set of acute benchmarks used in this assessment are from EPA’s Dose-Response Assessment for
Assessing Health Risks Associated with Exposure to Hazardous Air Pollutants – Acute Table 2 which can
be found online at http://www.epa.gov/ttn/atw/toxsource/summary.html. A description of the underlying
sources is provided below:
AEGLs: National Advisory Committee for Acute Exposure Guideline Levels (NAC) EPA's Office of Prevention, Pesticides and Toxic Substances established the NAC in 1995 to develop
Acute Exposure Guideline Levels (AEGLs) and supplementary information on hazardous substances for
federal, state, and local agencies and organizations in the private sector concerned with emergency
planning, prevention, and response. The NAC is a discretionary Federal advisory committee that
combines the efforts of stakeholders from the public and private sectors to promote efficiency and utilize
sound science.
Since it began AEGL development with an initial priority list of 85 chemicals in May 1997, the NAC has
produced AEGLs for 146 substances (available on EPA's website at http://www.epa.gov/oppt/aegl/).
More information on procedures that are used to develop AEGLs is available (USEPA, 2001). The
AEGLs for a substance take the form of a matrix, with separate levels for mild (AEGL-1), moderate
(AEGL-2), and severe (AEGL-3) effects.
ERPGs: American Industrial Hygiene Association (AIHA)
AIHA has developed emergency response planning guidelines (ERPGs) for acute exposures at three
different levels of severity (AIHA, 2001). These guidelines (available on-line through the US Department
of Energy) represent concentrations for exposure of the general population for up to 1-hour. The expected
effects of such exposures are categorized as mild or transient (ERPG-1), irreversible or serious (ERPG-2),
and potentially life-threatening (ERPG-3).
MRLs: The U.S. Agency for Toxic Substances and Disease Registry (ATSDR)
ATSDR develops chronic, intermediate and acute minimal risk levels (MRLs) for some contaminants. An
acute MRL is considered protective of exposures lasting from 24 hours to 14 days (ATSDR, 2002).
RELs: California Environmental Protection Agency (CalEPA) CalEPA has developed acute dose-response assessments for many substances, expressing the results as
acute inhalation reference exposure levels (RELs). As with its chronic RELs, CalEPA defines the acute
REL (1-hr) as a concentration level at (or below) which no health effects are anticipated (CalEPA, 2002).
CalEPA's acute RELs are available on-line at: http://www.oehha.ca.gov/air/acute_rels/index.html.
IDLH10: National Institute for Occupational Safety and Health (NIOSH) As part of its mission to study and protect worker health, NIOSH determines concentrations of substances
that are immediately dangerous to life or health (IDLH). IDLH values were originally determined for 387
substances in the mid-1970's as part of the Standards Completion Program (SCP), a joint project by
NIOSH and the Occupational Safety and Health Administration (OSHA), for use in assigning respiratory
protection equipment. NIOSH is currently evaluating the scientific adequacy of the criteria and
procedures used during the SCP for establishing IDLHs. In the interim, the IDLHs have been reviewed
and revised. NIOSH maintains an on-line database of IDLHs, including the basis and references for both
the current and original IDLH values (as paraphrased from the SCP draft technical standards). Table 2
provides IDLH values divided by 10 to more closely match the mild-effect levels developed by other
North Birmingham Air Toxics Risk Assessment
23
sources, consistent with methodology used to develop levels of concern under Title III of the Superfund
Amendments and Reauthorization Act, and their use in the accidental release prevention requirements
under section 112(r) of the Clean Air Act.
TEELs: U.S. Department of Energy (DOE) DOE has defined Temporary Emergency Exposure Limits (TEELs), which are temporary levels of
concern (LOCs) derived according to a tiered, formula-like methodology (described at
http://www.orau.gov/emi/scapa/Method_for_deriving_TEELs.pdf , and available on-line at
http://www.atlintl.com/DOE/teels/teel/teel_pdf.html). DOE has developed TEELs with the intention of
providing a reference when no other LOC is available. DOE describes TEELs as "approximations of
potential values" and "subject to change." The EPA's emergency planning program (section 112(r)) does
not generally rely on TEELs. They are provided in Table 2 purely to inform situations in which no other
acute values are available. For example, a finding of an acute exposure near a TEEL value may indicate
the need for a more in-depth investigation into the health effects literature. TEELs are not recommended
as the basis of regulatory decision-making. Like ERPGs, TEELs are multiple-tiered one hour exposures,
representing concentrations associated with no effects (TEEL-0), mild, transient effects (TEEL-1),
irreversible or serious effects (TEEL-2), and potentially life-threatening effects (TEEL-3).
4.3 Total Chromium Toxicity Assessment
This study sampled and analyzed for total chromium, but not specifically hexavalent chromium (Cr+6
),
the carcinogenic species of chromium, or trivalent chromium (Cr+3
), the noncarinogenic form. No
toxicity values for total Cr are available to estimate its potential health risks. To evaluate the potential
impact of chromium exposures, we estimated Cr+6
(which does have toxicity values) from tot Cr
concentrations by multiplying total Cr by 1/100. The basis for this conversion is as follow:
1) The BATS study, which is referenced in this document, did analyze total Cr and Cr+6
in the
North Birmingham study area and found that Cr+6
comprised about 1/100th
of the total amount
of chromium present (the remainder is assumed to be Cr+3
).
2) In using the 1/100 ratio, we assumed that the conditions under which this study was conducted
(e.g, sources, meteorology) are similar to those in the BATS study.
Toxicity values (IUR and RfC) for Cr+6
were used with estimated Cr+6
exposure concentrations to
calculate health risks and hazards.

North Birmingham Air Toxics Risk Assessment
24
5.0 RISK CHARACTERIZATION
The risk characterization combines the exposure concentrations with the chronic and acute toxicity values
to provide a quantitative estimate of the potential health impacts. Both chronic and acute exposures were
evaluated. This section: 1) details how the risk characterization was conducted; 2) presents the results of
the assessment; and 3) identifies the key risk drivers and provides a brief description of each. Risk and
hazard results are reported in tables following standard rules for rounding and with one significant figure
(USEPA, 2004). An assessment of uncertainties associated with the risk assessment is provided in
Section 6.
5.1 Risk Characterization for Chronic Exposures
The risk characterization for chronic inhalation exposures was conducted by combining the relevant
toxicity values with the exposure concentrations estimated from the monitoring data. The 95UCL
exposure concentration was selected to represent a conservative estimate of exposure based on the 95UCL
concentration of the COPCs in air.
5.1.1 Cancer Risk
In this assessment, risk estimates for COPCs with a cancer health endpoint were expressed in terms of the
probability of developing cancer over a lifetime from continuous exposure to a constant ambient air
concentration of the COPC. Cancer risk for each COPC at a monitoring location was derived as follows:
Riskx = ECx x IURx Equation 5-1
Where:
Riskx = the risk of the Xth
COPC at a monitor;
ECx = the exposure concentration of the Xth
COPC (95UCL air concentration); and
IURx = the inhalation unit risk of the Xth
COPC.
The total cancer risk posed by all chemicals detected at a monitor is the sum of the individual COPC
risks.
Estimates of cancer risk are usually expressed as a statistical probability represented in scientific notation
as a negative exponent of 10. For example, an additional risk of developing cancer of one chance in
10,000 (or one additional person in 10,000) is written as 1x10⁻⁴
(or 1E-04). This means that for every
10,000 people that are exposed, in the way that we have presumed, one of those people may develop
cancer over their lifetime. Likewise, a risk of one person in one million is written 1x10⁻⁶
(or 1E-06) and a
risk or one in one hundred thousand is written 1x10⁻⁵
(or 1E-05). Note that the calculated risks presented
in this study are in excess of a person’s chance of developing cancer for reasons other than the chemical
exposures being evaluated (e.g., lifestyle risks such as smoking, genetic predisposition to certain cancers,
etc.).
The Clean Air Act directed EPA to manage risks under Section 112 and according to the criteria specified
in the 1989 National Emission Standard (NESHAP) for benzene (USEPA, 1999). In short, the benzene

North Birmingham Air Toxics Risk Assessment
25
NESHAP identified a cancer risk level of one in ten thousand (1x10⁻⁴
) as the approximate upper limit of
acceptability and a cancer risk level of one in one million (1x10⁻⁶
) to be safe with an ample margin
(USEPA, 1989).
Because IURs are typically upper-bound estimates, actual risks may be lower than predicted, and the true
value of the risk is unknown and may be as low as zero. These statistical projections of hypothetical risk
are intended as screening tools for risk managers and cannot make realistic predictions of biological
effects. Such risk estimates also cannot be used to determine whether someone who already has cancer is
ill because of a past exposure.
Risks for cancer are generally expressed as individual risks (i.e., the risk borne by an individual in a larger
exposed population). In addition to assessing the risk to an individual in an exposed population, it is also
possible to calculate the number of expected cases of cancer in that population over a 70-year period by
multiplying the cancer risk to an individual by the number of individuals exposed; however, even though
the calculation might yield a low predicted cancer incidence rate (even vanishingly small), that does not
mean that individuals within the population will not get cancer because of air toxics exposures.
Risk Evaluation for Chemicals that are Carcinogens by a Mutagenic Mode of Action
For the COPCs benzo(a)pyrene, dibenz(a,h)anthracene, dichloromethane, and trichloroethylene, EPA has
concluded that they are carcinogenic by a mutagenic mode of action and recommended that cancer risk
assessments include additional assessment for ages younger than 16 years using age-specific default
adjustment factors (ADAFs) with the slope factor provided in OAQPS Dose-Response values in Table 1
and age-specific exposure estimates as described in EPA’s Supplemental Guidance for Assessing
Susceptibility from Early-Life Exposure to Carcinogens (USEPA, 2005c). The ADAFs are 10 for
exposures prior to 2 years of age (i.e., spanning 2-year interval from birth until second birthday), and 3
from ages 2 through 16 (i.e., spanning a 14-year interval from second until sixteenth birthday). For the
compound trichloroethylene, we used the recently published IRIS-adjusted IUR of 4.8 × 10⁻⁶
per µg/m3
(USEPA, 2011b). Assuming continuous exposure within the age group, the cancer risk for each of the
remaining three compounds was estimated by:
1. Calculating the adjusted IUR, and
2. Multiplying the adjusted IUR by the exposure concentration
The calculations are as follows:
Adjusted IUR = (IUR*ED*ADAF)/70 Equation 5-2
Where:
IUR = Individual unit risk in 1/µg/m3
ED = Exposure duration in number of years
ADAF = Age-dependent adjustment factor for a given age group
The overall adjusted IUR is calculated by summing all age group-adjusted IURs
Cancer Risk for a compound = Adjusted IUR *EC Equation 5-3

North Birmingham Air Toxics Risk Assessment
26
Where:
EC = Exposure concentration of the chemical, which in this case is the 95UCL
concentration.
An example of calculations is provided below for benzo(a)pyrene at the Hudson K-8 School site:
Chemical
Name
Age
(Years)
IUR
(1/ µg/m3)
Exposure
Duration (Years)
ADAF
(Unitless)
Adjusted IUR
(1/ µg/m3)
Benzo(a)pyrene
0 - <2 1.10x10⁻³
2 10 3.14x10⁻⁴
2 - <16 1.10x10⁻³
14 3 6.60x10⁻⁴
16-70 1.10x10⁻³
54 1 8.49x10⁻⁴
Total 1.82x10⁻³
Cancer risk for benzo(a)pyrene at the Hudson K-8 School site =
0.0020 µg/m3 * 1.82 x10
-3 1/ µg/m
3 = 4x10
-6
5.1.2 Non-Cancer Hazards
In contrast to cancer risks, chronic non-cancer hazards are not expressed as a probability of an individual
suffering an adverse effect. Instead, non-cancer hazard is expressed in terms of a hazard quotient (HQ),
defined as the ratio between the estimated exposure concentration and the Reference Concentration (RfC)
or safe limit. For a given air toxic, exposures equals or below the RfC (HQ≤1) are not likely to be
associated with adverse health effects, including for sensitive subpopulations. With exposures
increasingly greater than the RfC, the potential for adverse effects increases. HQs were calculated as
follows:
HQx = x
x
RfC
EC Equation 5-4
Where:
HQx = the hazard quotient of the Xth
COPC at a monitor;
ECx = the exposure concentration of the Xth
COPC (95UCL air concentration); and
RfCx = the reference concentration of the Xth
COPC.
When multiple non-carcinogens were present simultaneously, as was the case at each of the individual
monitoring stations in this study, the individual HQs are summed to create a hazard index (HI), thus:
HI = )....321( xHQHQHQHQ Equation 5-5
Where:

North Birmingham Air Toxics Risk Assessment
27
HI = the hazard index of all the COPCs detected at a monitor; and
HQ1 = the Hazard Quotients of individual COPCs 1 through x.
The HI is a measure of the potential for an adverse health effect from all of the COPCs combined.
Different pollutants, however, may cause different adverse health effects or act via different mechanisms
of action, so the initial step of adding all HQs together is only a screening step (USEPA, 2001). Based on
the definition of RfC (see Section 4.2.1), a HQ or HI less than or equal to 1 indicates that adverse long-
term noncancer effects are not likely to occur, and thus are considered to pose acceptably low hazard.
However, when the initially calculated hazard index at a monitor exceeds a value of 1, a second step is
typically required. Specifically, the aggregate hazards from COPCs that have the same toxic endpoint or
act by a similar mechanism of action are added separately to give Target Organ Specific Hazard Indices
(TOSHIs). For example, when the initial HI is greater than a value of one (1), the risk assessor may go
back, for example, and separate those chemicals that just affect the respiratory system from chemicals that
just affect the neurological system.
Unless otherwise noted, the hazard indices presented in this Section are the sum of all hazard quotients for
all the COPCs detected at a monitor, which conservatively assumes that all of the COPCs have
similarities in their mechanisms of action or all affect the same target organs. Where a TOSHI was
developed, it has been noted.
In the following discussion of risk results, the total cancer risk and HI were presented for each monitor
based on all COPCs selected for each monitoring site. For each site, the “risk drivers” (the chemicals that
contribute to most of the estimated risk) were identified based on COPCs that are responsible for 90% of
the risk. The use of risk drivers helps to focus the risk assessment (and subsequent risk management) on
those COPCs with the greatest potential to impact human health. For chronic non-cancer hazard
assessments, a HQ value of at least 0.1 was used to identify the hazard drivers or those COPCs that
significantly contributed to a HI that exceeded a value of 1 at a monitoring site.
5.1.3 Cancer Risk Results
As discussed above, EPA typically considers an estimate cancer risk falling within the range of 1x10⁻⁶
and 1x10⁻⁴
to be acceptably low, with risks below 1x10⁻⁶
to be insignificant. The risks calculated in this
study are discussed within the context of that risk range. The potential cancer risk estimates, along with
percent contribution to the total risk, are presented for all COPCs at each of the four monitoring sites in
Procedure for Segregation of HIs by Effect
Segregation of HIs requires identification of the major effects of each
chemical. Major effect categories include neurotoxicity, developmental
toxicity, reproductive toxicity, immunotoxicity, and adverse effects by
target organ (i.e., hepatic, renal, respiratory, cardiovascular,
gastrointestinal, hematological, musculoskeletal, and dermal/ocular
effects).

North Birmingham Air Toxics Risk Assessment
28
Tables 5.1.3-1 through 5.1.3-4. The tables also contain chronic inhalation carcinogenic toxicity values for
the carcinogenic COPCs, the EPA and IARC WOE for each chemical, as well as the source of this
information. Following is a summary of the chronic cancer risk results by monitoring site.
Hudson K-8 School site
The total cancer risk from all COPCs at the Hudson K-8 School site was 1x10⁻⁴
. The risk drivers and
percent contribution of each at this site were benzene (47%), naphthalene (19%), arsenic (7%), 1,3-
butadiene (5%), carbon tetrachloride (4%), benzo(a)pyrene (3%), p-dichlorobenzene (3%), and cadmium
(3%). The highest cancer risk was from benzene, which had a risk of 5x10⁻⁵
, followed by naphthalene
and arsenic (2x10⁻⁵
and 8x10⁻⁶
, respectively). These top three risk drivers accounted for 73% of the total
risk. Their WOE are “carcinogenic to humans” for benzene and for arsenic, and “possible human
carcinogen” for naphthalene. The remaining five risk drivers, which contributed 5% or less each to the
total risk, had risk levels that varied from 3x10⁻⁶
to 5x10⁻⁶
. Non-risk drivers that were at or above the
1x10⁻⁶
risk level at this site included 1,2-dichloroethane, ethylbenzene, hexavalent chromium,
benzo(a)anthracene , and dibenz(a,h)anthracene.
Lewis Elementary School site
The Lewis Elementary School site had a total cancer risk of 1x10⁻⁴
. The risk drivers were benzene (39%),
naphthalene (22%), arsenic (8%), benzo(a)pyrene (6%), 1,3-Butadiene (6%), carbon tetrachloride (4%),
1,2-dichloroethane (3%), and ethylbenzene (3%). The highest cancer risk was from benzene, which had a
risk of 4x10⁻⁵
, followed by naphthalene and arsenic with risk levels of 2x10⁻⁵
and 8x10⁻⁶
respectively.
These top three risk drivers accounted for 69% of the total risk. Each of the remaining five risk drivers,
which contributed 6% or less each to the total risk, had risk values between from 3x10⁻⁶
to 6x10⁻⁶
. Other
COPCs (but not risk drivers) that had cancer risks above of or 1x10⁻⁶
at this location were p-
dicholobenzene, cadmium, hexavalent chromium, dibenz(a,h)anthracen and benzo(a)anthracene.
.
Riggins School site
The total cancer risk from all COPCs at the Riggins School site was 1x10⁻⁴
. The risk drivers were
benzene (45%), naphthalene (25%), arsenic (8%), benzo(a)pyrene (6%), 1,3-butadiene (4%), carbon
tetrachloride (3%) and dibenz(a,h)anthracene (2%). The highest cancer risk was due to benzene, which
had a risk value of 7x10⁻⁵
, followed by naphthalene and arsenic with risk values of 4x10⁻⁵
and 1x10⁻⁵
,
respectively. These three risk drivers accounted for 77% of the total risk. Seven other COPCs had a
cancer risk level at or above 1x10⁻⁶
at this site. They were 1,2-dichloroethane, p-dichlorobenzene,
benzo(a)anthracene , hexavalent chromium, ethylbenzene, benzo(b)fluoranthene and cadmium.
Shuttlesworth Station site
The Shuttlesworth Station site had a total cancer risk of 1x10⁻⁴
. The risk drivers were benzene (37%),
naphthalene (26%), arsenic (11%), 1,3-butadiene (5%), carbon tetrachloride (4%), 1,2-dichloroethane
(4%) and benzo(a)pyrene (3%). Benzene had the highest risk (4x10⁻⁵
) followed by naphthalene and
arsenic (3X10⁻⁵
and 1x10⁻⁵
, respectively). These three risk drivers contributed 74% of the total risk. Each
of the remaining four risk drivers accounted for 5% or less each of the total risk. Five other COPCs (p-
dichlorobenzene, hexavalent chromium, ethylbenzene, cadmium and dibenz(a,h)anthracene) had risk
values of or above 1x10⁻⁶
.

North Birmingham Air Toxics Risk Assessment
29
5.1.4 Chronic Non-Cancer Hazard Results
Non-cancer health hazards with percent contributions to the HIs are provided for each monitoring site in
Tables 5.1.4-1 through 5.1.4-4. The tables also contain the chronic non-carcinogenic toxicity values for
the COPCs, the target organ potentially affected by the respective COPCs as well as the source of the
information. As explained in Section 5.1.2, when a HI value is equal to or less than 1 or, where the HI
exceeds 1 but the TOSHI value is equal to or less than 1, it is an indication that non-cancer effects are not
likely to occur.
Hudson K-8 site
The 95UCL HI for the Hudson K-8 School site was 2. Chemicals at or above the 0.1 HQ-threshold were
manganese (0.7), benzene (0.2), naphthalene (0.2), cadmium, (0.2), arsenic (0.1) and 1,3-Butadiene (0.1).
At this site, no chemicals that affect the same organ/systems had a combined HQ (the TOSHI value)
above 1.
Lewis Elementary School site
The 95UCL HI for the Lewis Elementary School site was 2. Manganese (0.9), naphthalene (0.2), benzene
(0.2), arsenic (0.1), 1,3-butadiene (0.1), and cadmium (0.1) had HQs at or above the 0.1 HQ-threshold.
No chemicals that affect the same organ/systems had a combined HQ (the TOSHI value) above 1.
Riggins School Site
The Riggins School site 95UCL HI was 2. Chemicals with HQ values above 0.1 at this site were
manganese (0.4), naphthalene (0.4), benzene (0.3), arsenic (0.2), 1,3-Butadiene (0.1), and cadmium(0.1).
No chemicals that affect the same organ/systems had a combined HQ (the TOSHI value) above 1.
Shuttlesworth Station site
At the Shuttlesworth Station site, the 95UCL HI was 1. Manganese (0.5), naphthalene (0.3), arsenic (0.2),
benzene (0.2), 1,3-Butadiene (0.1), and cadmium (0.1) had HQs of 0.1 or above.
The results for non-cancer hazards analysis at each of the four monitoring sites indicate that non-cancer
effects are not likely to occur.
5.1.5 Lead (Pb) Hazard Evaluation
Lead is a naturally occurring bluish-gray metal found in small amounts in the earth's crust. Much of the
lead found in the ambient air comes from human activities including metals industries, burning fossil
fuels, mining, and manufacturing. Lead is used in the production of batteries, ammunition, metal products
(solder and pipes), and devices to shield X-rays. Because of health concerns, lead from gasoline, paints
and ceramic products, caulking, and pipe solder has been dramatically reduced in recent years.
Lead can affect human health in several ways, including effects on the nervous system, red blood cells
and cardiovascular and immune systems. Infants and young children are especially sensitive to even low

North Birmingham Air Toxics Risk Assessment
30
levels of lead, which may contribute to learning problems and lowered IQ (see also
http://www.atsdr.cdc.gov/ToxProfiles/tp13.pdf).
Lead can be found in the air, the soil, the water, and inside our homes. Much of the lead in the
environment comes from past use of leaded gasoline in cars and trucks, some types of industrial facilities
and past use of lead-based paint in homes. Lead and lead compounds have been used in a wide variety of
products found in and around our homes, including paint, ceramics, pipes and plumbing materials,
solders, gasoline, batteries, ammunition, and cosmetics. Babies and young children can be more highly
exposed to lead because they often put their hands and other objects that can have lead from dust or soil
on them, into their mouths. Children may also be exposed to lead by eating and drinking food or water
containing lead or from dishes or glasses that contain lead. They may also breathe lead dust by spending
time in areas where lead-based paint is deteriorating or from playing with toys with lead paint.
Concentrations of lead in outside air have greatly declined over the past few decades as a result of
regulatory efforts to reduce lead emissions. To protect the public from harmful levels of lead in outside
air, lead is regulated under the federal Clean Air Act by both the hazardous air pollutant (HAP) and
criteria air pollutant (CAP) programs. CAPs are pollutants for which EPA establishes national ambient
air quality standards (NAAQSs). There currently are no NAAQS for HAPs other than lead. In late 2008,
EPA substantially strengthened this standard, revising it to be 10 times tighter than the previous standards,
improving health protection for at-risk groups, especially children. The current NAAQS for lead is a
“not-to-be-exceeded” 3-month rolling average concentration of 0.15 µg/m3, in terms of lead in total
suspended particles (Pb-TSP). A TSP sampler collects both small particles captured by PM10 samplers as
well as larger particles and, thus, can capture a larger range of lead particles that might contribute to
exposure. A significant lead exposure pathway for young children is hand-to-mouth contact with settled
dust particles. The lead NAAQS is established in terms of lead in TSP in recognition of the potential
contribution to this exposure pathway of particles not captured by PM10 samplers.
North Birmingham Risk Assessment Monitoring for lead: In this study, lead was measured, along
with a suite of other toxic metals, in PM10 samples collected at the four neighborhood monitoring
locations. The air samplers used do not meet the specific requirements for determining compliance with
the lead NAAQS as this was not identified as an objective in the planning stage of the study. The results
from these four locations provide important information about general air quality in these neighborhoods,
but they are not definitive with respect to any of these neighborhoods’ compliance with the lead NAAQS.
As a standard for public health protection has been established for lead, the lead NAAQS is considered
the most relevant comparison value for evaluating the lead monitoring data. Accordingly, the rolling
three-month lead concentrations measured at each of the four neighborhood monitoring sites was
compared to the lead NAAQS level of 0.15 µg/m3
as a way to screen the data for a potential lead issue in
air in these neighborhoods. The results of this screening analysis indicated that the 3-month rolling
average concentrations calculated at all four locations were below the lead NAAQS of 0.15 µg/m3,
although above 0.10 µg/m3 three times at the Hudson K-8 School site (see table next page). The
relatively high average concentrations at the Hudson K-8 School site were a result of two spikes in
individual samples on 3/15/12 (1.13 µg/m3) and 3/27/12 (0.53 µg/m
3).

North Birmingham Air Toxics Risk Assessment
31
Three-Month Rolling Lead Average Concentrations at the North Birmingham Air
Monitoring Sites
Three-Month
Average as of
Month/Year
Pb-PM10 Concentration (µg/m3)
Hudson K-8
School
Lewis
Elementary
Riggins
School
Shuttlesworth
Station
11-Aug 0.04 0.02 0.01 0.01
11-Sep 0.05 0.03 0.01 0.01
11-Oct 0.07 0.03 0.02 0.01
11-Nov 0.04 0.02 0.02 0.01
11-Dec 0.03 0.02 0.02 0.01
12-Jan 0.01 0.01 0.01 0.01
12-Feb 0.01 0.01 0.01 0.01
12-Mar 0.12 0.07 0.02 0.01
12-Apr 0.12 0.07 0.02 0.01
12-May 0.12 0.07 0.02 0.01
12-Jun 0.02 0.01 0.01 0.01
12-Jul 0.02 0.01 0.01 0.01
Other North Birmingham lead Monitoring: Lead monitoring is also conducted in the North
Birmingham area at a multi-pollutant monitoring site (called an “NCore” site), located at 3009 28th Street
in North Birmingham. This site, which is about a mile west of the Hudson K-8 School and just over a
mile east of the Lewis Elementary school, has been collecting PM10 samples that are analyzed for lead
since January 2012. The sampling method is different (“low volume PM10”) than that used at the
neighborhood samplers (“high volume” PM10) and samples are collected on a different schedule.
Preliminary analysis of the available data collected at this site (January 2012 through September 2012),
indicates 3-month rolling averages well below the lead standard as shown in the following table.
Three-Month Rolling Lead Average Concentration at the North Birmingham NCore Site
3-Month Average as of
Month/Year 3/12 4/12 5/12 6/12 7/12 8/12 9/12
Pb-PM10 Concentration
(µg/m3)
0.05 0.02 0.02 0.01 0.01 0.01 0.01
Conclusions: From this monitoring and meteorological evidence and from information about potential
sources of lead in the area, the following conclusions are suggested:
1. Lead concentrations at the four neighborhood monitoring sites (3-month rolling averages) have
been well below the NAAQS. One site (Hudson K-8), however, recorded three 3-month rolling

North Birmingham Air Toxics Risk Assessment
32
averages high enough to suggest that additional monitoring using TSP samplers may be needed.
Monitoring with a TSP sampler at this location would enable a more complete evaluation of the
potential for lead exposures of concern in the neighborhood around this site. But this comparison
of results from the four neighborhood monitoring sites to the lead NAAQS has limitations because
as indicated above, sampling at these sites used “high volume” PM10 samplers, as opposed to “low
volume” PM10 samplers.
2. The three 3-month rolling averages at the Hudson K-8 School site that exceeded 0.10 µg/m3
were
the result of the high concentrations of lead in two samples (3/15/12 and 3/27/12). Otherwise the
vast majority of 3-month averages at this site are significantly below the NAAQS. Elevated lead
concentrations, although lower than at the Hudson K-8 School site, were also recorded at the other
three neighborhood monitoring sites on 3/15/2012, indicating a common source.
3. Three-month average lead concentrations at the Ncore site were lower than those at the four
neighborhood monitoring sites, but exhibited a generally similar pattern, seemingly reflecting the
short March 2012 period of increased air lead concentrations.
4. Sources of airborne lead, such as current metals industries, exist in the North Birmingham area,
although, none are estimated to individually emit lead at a rate above the trigger at which
consideration of source-oriented monitoring is required by regulation. Small, unknown sources of
airborne lead in the area, such as those associated with illegal metal smelting activities and
industrial sites with historically contaminated surface soil/dust, are also possible.
5. The JCDH performed an investigation of the potential source(s) of the elevated lead
concentrations measured on March 15 and 27, 2012, including discussions with local industries
which may have had a startup, shutdown, or malfunction issue on those days. No apparent source
of the high lead readings was identified. Likewise, meteorology on these days was also reviewed
to determine if, for example, winds were blowing from a known potential lead source towards the
monitors. No apparent meteorological connection to a source could be identified.
5.2 Acute Hazard Characterization
The acute toxicity characterization was based on a comparison of the maximum daily sample
concentration for each chemical detected at least once at a given site to a range of acute benchmarks,
when available (see Section 4.2 for the description of acute toxicity values). A chemical concentration
higher than any of the benchmark values indicates that short-term health effects were possible on the day
associated with that sampling event.
Table 5.2-1 compares the maximum concentration of each chemical that was detected at least once at a
monitoring site to a series of acute dose-response values. Benzene was the only chemical for which the
maximum concentration exceeded its respective acute benchmark and only at the Riggins School site.
Benzene exceeded its acute benchmark value (ATSDR Acute MRL of 29 µg/m3) on three different dates:
12/4/2011, 1/15/2012 and 4/2/2012. Corresponding concentration values for these exceedances were 38,
31, and 55 µg/m3, respectively. No major variations in weather conditions were observed on the days of
these occurrences that explain the high benzene concentration values. Also, based on a review of

North Birmingham Air Toxics Risk Assessment
33
operational records and other information obtained from industries in the area, no unusual events or
malfunctions were noted on the days these samples were collected.
5.3 Description of Risk Drivers
Following is a brief description of potential risk drivers identified in this study, including sources and
potential health effects. Additional information on each of the compounds can be obtained from the the
EPA and ATSDR websites http://www.epa.gov/ttn/atw/hlthef/hapindex.html and
http://www.atsdr.cdc.gov/toxfaqs/index.asp, respectively. They are presented in alphabetical order.
1,2-Dichloroethane
1,2-dichloroethane, also called ethylene dichloride, is a manufactured chemical that is not found naturally
in the environment. It is a clear liquid and has a pleasant smell and sweet taste. The most common use of
1,2-dichloroethane is in the production of vinyl chloride which is used to make a variety of plastic and
vinyl products including polyvinyl chloride (PVC) pipes, furniture and automobile upholstery, wall
coverings, housewares, and automobile parts. It is also used to as a solvent and is added to leaded gasoline
to remove lead. Breathing high levels of 1,2-dichloroethane can cause damage to the nervous system,
liver, kidneys, and lungs and may cause cancer.
1,3-Butadiene
Motor vehicle exhaust is a constant source of 1,3-butadiene. Its sources also include manufacturing and
processing facilities, forest fires or other combustion, and cigarette smoke. High levels of 1,3-butadiene
may be found in highly industrialized cities or near oil refineries, chemical manufacturing plants, and
plastic and rubber factories. Although 1,3-butadiene breaks down quickly in the atmosphere, it is usually
found in ambient air at low levels in urban and suburban areas. Acute (short-term) exposure to 1,3-
butadiene by inhalation in humans results in irritation of the eyes, nasal passages, throat, and lungs.
Epidemiological studies have reported a possible association between 1,3-butadiene exposure and
cardiovascular diseases. Epidemiological studies of workers in rubber plants have shown an association
between 1,3-butadiene exposure and increased incidence of leukemia.
Arsenic
Arsenic is a naturally occurring element widely distributed in the earth’s crust. Arsenic, in its inorganic
form, is found throughout the environment; it is released into the air by volcanoes, the weathering of
arsenic-containing minerals and ores, and by commercial or industrial processes. Workers in metal
smelters and nearby residents may be exposed to elevated inorganic arsenic released into the air. Other air
sources of inorganic arsenic exposure include burning plywood treated with an arsenic wood preservative.
Acute (short-term) high-level inhalation exposure to arsenic dust or fumes can cause gastrointestinal
effects (nausea, diarrhea, abdominal pain) and nervous system disorders. Chronic (long-term) inhalation
exposure to inorganic arsenic can cause irritation of the skin and mucous membranes and lung cancer.
Benzene
Benzene is a widely used chemical formed from both natural processes and human activities. It ranks in
the top 20 chemicals for production volume. Some industries use benzene to make other chemicals which

North Birmingham Air Toxics Risk Assessment
34
are used to make plastics, resins, and nylon and other synthetic fibers. Benzene is also used to make some
types of rubbers, lubricants, dyes, detergents, drugs, and pesticides. Benzene is also a natural part of crude
oil, gasoline, and cigarette smoke. Benzene is found in airborne emissions from burning coal and oil,
motor vehicle exhaust, and evaporation from gasoline service stations and in industrial solvents. These
sources contribute to elevated levels of benzene in the ambient air, which may subsequently be breathed
by the public. Tobacco smoke contains benzene and accounts for nearly half the national exposure to
benzene. Breathing very high levels of benzene can cause drowsiness, dizziness, and unconsciousness;
long-term benzene exposure causes effects on the bone marrow and can cause anemia and leukemia.
Benzo(a)pyrene
Benzo(a)pyrene is a polycyclic aromatic hydrocarbon (PAH). Polycyclic aromatic hydrocarbons (PAHs)
are a group of over 100 different chemicals that are formed during the incomplete burning of coal, oil and
gas, garbage, or other organic substances like tobacco or charbroiled meat. PAHs are also found in coal
tar, crude oil, creosote, and roofing tar, and a few are used in medicines or to make dyes, plastics, and
pesticides. PAHs are usually found as a mixture containing two or more of these compounds, such as in
soot. Benzo(a)pyrene (BAP) is the most well-studied of these compounds and long-term repeated
exposure to BaP has been found to cause cancer.
Cadmium
The largest sources of airborne cadmium in the environment are the burning of fossil fuels such as coal or
oil, and incineration of municipal waste materials. Cadmium may also be emitted into the air from zinc,
lead, or copper smelters. For nonsmokers, food is generally the largest source of cadmium exposure.
Cadmium levels in some foods can be increased by the application of phosphate fertilizers or sewage
sludge to farm fields. Smoking is another important source of cadmium exposure.
Carbon Tetrachloride
Carbon tetrachloride was banned from consumer use in the United States in 1970. It is still used as a
refrigerant and solvent, a primary source of exposure. Individuals may be exposed to carbon tetrachloride
in the air from accidental releases from production and uses, and from its disposal in landfills where it
may evaporate into the air or leach into groundwater. Carbon tetrachloride is also a common contaminant
of indoor air; the sources of exposure appear to be building materials or products, such as cleaning agents,
used in the home. Workers directly involved in the manufacture or use of carbon tetrachloride are most
likely to have significant exposures to carbon tetrachloride. The primary targets of chronic and acute
exposure are the liver and kidneys. It is also considered a probable carcinogen.
Hexavalent Chromium
Chromium is a naturally occurring element found in rocks, animals, plants, and soil. It can exist as a
liquid, solid, or gas. The most common forms are chromium (0), chromium (III), and chromium(VI) also
known as hexavalent chromium. No taste or odor is associated with chromium compounds. Chromium
(VI) eventually forms trivalent chromium (Cr+3) after combining with dust particles and other pollutants
in the atmosphere. The primary sources of hexavalent chromium in the atmosphere are chromate
chemicals used as rust inhibitors in cooling towers and emitting as mists, particulate matter emitted during
manufacture and use of metal chromates, and chromic acid mist from the plating industry. Hexavalent

North Birmingham Air Toxics Risk Assessment
35
chromium is a known human carcinogen. Exposure to chromium occurs from ingesting contaminated
food or drinking water or breathing contaminated workplace air. Ingesting high levels of chromium (VI)
may result in anemia or damage to the stomach or intestines.
Ethylbenzene
Ethylbenzene is a colorless, flammable liquid that smells like gasoline. It is found in natural products such
as coal tar and petroleum and is also found in manufactured products such as inks, insecticides, and
paints. Ethylbenzene is used primarily to make another chemical, styrene. Other uses include as a solvent,
in fuels, and to make other chemicals. Breathing very high levels of Ethylbenzene can cause dizziness,
and throat and eye irritation. Breathing lower levels has resulted in hearing effects and kidney damage in
animals.
Manganese
Manganese occurs naturally. Manganese can be released into the air by iron and steel production plants,
power plants, and coke ovens. In the still making process, Manganese is used as an additive to harden,
stiffen and strengthen steel. Manganese is essential to human life, but only in small amounts. Exposure
to excess levels of manganese can most commonly occur from breathing air in areas impacted by
industrial sources of manganese. The most common health problems in workers exposed to high levels of
manganese involve the nervous system. These health effects include behavioral changes and other
nervous system effects, which include movements that, with high exposures, may become slow and
clumsy.
Naphthalene
Naphthalene is a white solid that evaporates easily. Its sources include fossil fuels, such as petroleum and
coal, tobacco, and wood burning. The major commercial use of naphthalene is to make other chemicals. It
is used in such products as polyvinyl chloride (PVC) plastics, moth repellents, and toilet deodorant
blocks. Other uses include making dyes, resins, leather tanning agents, and the insecticide carbaryl.
About 10% of the naphthalene entering the environment is from coal production and distillation.
Naphthalene has a strong but not unpleasant smell. Exposure to a large amount of naphthalene may
damage or destroy some of the body red blood cells, a condition called hemolytic anemia. People,
particularly children, have developed this problem after eating naphthalene-containing mothballs or
deodorant blocks. Chronic exposure to naphthalene from these sources can cause respiratory
inflammation and diseases of the eye, such as cataracts.
p-Dichlorobenzene
p-dichlorobenzene, also known as “para-dichlorobenzene” and “1,4-dichlorobenzene,” is considered a
“possible human carcinogen” by USEPA. No information is available on human cancer effects of this
chemical. The poor Weight of Evidence (WOE) for increased risk diminishes the significance of the
risk/hazard values obtained, as no specific research has been done to link exposure to cancer in humans.
It is commonly found as an indoor air pollutant in pest controls, deodorizers and disinfectants

North Birmingham Air Toxics Risk Assessment
36
6.0 UNCERTAINTY ASSESSMENT
The risk estimates used in air toxics risk assessments usually are not fully probabilistic estimates of risk
but conditional estimates given a considerable number of assumptions about exposure and toxicity. Air
toxics risk assessments make use of many different kinds of scientific concepts and data (e.g., exposure,
toxicity, epidemiology), all of which are used to characterize the expected risk in a particular
environmental context. Informed use of reliable scientific information from many different sources is a
central feature of the risk assessment process. Reliable information may or may not be available for many
aspects of a risk assessment. Scientific uncertainty is inherent in the risk assessment process, and risk
managers almost always must make decisions using assessments that are not as definitive in all important
areas as would be desirable.
Risk assessments also incorporate a variety of professional and science policy judgments (e.g., where to
locate monitors and which toxicity studies to use as the basis of developing dose-response values). Risk
managers therefore need to understand the strengths and the limitations of each assessment, and to
communicate this information to all participants and the public. A critical part of the risk characterization
process, therefore, is an evaluation of the assumptions and uncertainties inherent in the risk assessment in
order to place the risk estimates in proper perspective. In most cases, the assessment of uncertainty is
presented in a qualitative or semi-quantitative fashion, including a discussion of the likely direction and
magnitude of the error associated with each important source of uncertainty. Some of the key areas of
uncertainty in this risk analysis are presented below.
Monitor Location Selection: The risk and hazard estimates provided in this assessment were based on
monitoring results from 4 monitoring sites in the North Birmingham communities. In each case, the
assumption is made that the air quality data at the monitoring location is representative of exposures
within some distance from the monitor (e.g., at the neighborhood level). However, it is not known how
well each of these sites represent the potential receptors in immediate vicinity of the monitor (i.e., ambient
air concentrations can vary at distance from the monitor); thus, exposure to individuals located at various
distances from the monitoring site (and their actual risk) may also vary. If the monitoring sites were
unrepresentative of any location beyond where they were sited, the monitoring data may over- or
underestimate the true health impacts at the unmonitored locations.
Sampling Data Sufficiency: The risk and hazard assessment assumes that the sampling data are
sufficient to draw conclusions regarding the populations that are localized near the monitor’s placement.
Furthermore, it is assumed that the sampling regime is sufficient to represent the exposures seen by the
populations. The following are some of the potential shortcomings of the monitoring data:
The monitoring data cover a little more than one year, but are used to represent a full lifetime
(approximately 70 years) of exposure. This assumption, while pragmatic from a monitoring study
point of view, is also problematic because of possibly of changing conditions over a long period of
time. For example, environmental conditions and economic conditions can change over time (e.g.,
companies come and go and/or make different things), leading to a different exposure profile for
people living in the vicinity of a monitor.
Monitoring was staggered during the sampling study to capture samples on every day of the week
and every season of the year (it was not sample to monitor continuously during the sampling

North Birmingham Air Toxics Risk Assessment
37
program). This approach, however, left some of the days unsampled over the course of the
monitoring program.
The monitors capture a combined 24-hr sample and so do not reflect spikes in concentrations
throughout the course of a day.
The monitors only evaluate a specific short list of potential chemical contaminants. Other
chemicals may have been present, but not analyzed for.
The monitors only look at outdoor air. No indoor air samples were taken where concentrations of
certain toxics may be higher and where exposure times may be greater.
Making these assumptions may have resulted in over- or under-estimation of the potential risks.
Missed and Invalidated Samples and Void Data: The initial 1-year monitoring program was conducted
at a schedule of 1 in 6 days. This schedule should have yielded 60 samples. However, some sites had had
less than 60 valid samples. This is because some sampling events were missed or invalidated due to harsh
weather conditions or equipment malfunctioning. Samples were also been voided in the laboratory if the
conditions of analysis were not ideal. As a result, the monitoring program was extended for 2 more
months and yielded at least 60 samples for each site. This resulted in an uneven number of samples and
descrepancies in the dates of sampling. All of the replacement samples were taken in summer to replace
missing samples, some of which were not taken in summer. This may have had the effect of either over-
or underestimating the risk.
Data Utilized at ½ Method Detection Limit: Sampling data that were reported by the laboratory as “Not
Detected” (ND) in a given sample were carried through the risk assessment using ½ the respective
chemical’s method detection limit as a surrogate for concentration. This reasonably conservative approach
ensures that the chemical is considered to be present at least at some concentration (as opposed to not
being present at all). Given the available MDLs, this approach is unlikely to significantly underestimate
risk.
Sampling Data Reported as less than the Detection Limit: Analytical laboratories sometimes appear to
measure trace level concentrations of chemicals at levels below the method detection limit when
analyzing air samples. By definition, both the identity and concentration of such low level analytical
results are suspect. For this risk assessment, we assumed “detections below the MDL” to be present at a
concentration of ½ MDL since, on average, one could reasonably expect that outcome. This approach is
not expected to have a significant impact on the overall conclusions of the assessment.
Exposure Duration: The risk estimates for exposure to the airborne concentration found at the four sites
assume that an individual is continuously exposed at the same location for 70 years. Furthermore, it is
assumed that the residents would be exposed 24-hrs per day, 7-days per week. The actual activity patterns
of the residents are not considered but could lead to lower or higher exposures and resulting risks (for
example, higher risks might occur for a person who lived in the area, but commuted to a job which
involved relatively higher level exposures to toxic chemicals). Thus, this risk assessment may under- or
overestimate the actual risks. Detailed information on the population in the North Birmingham area
would be needed to reduce this uncertainty.

North Birmingham Air Toxics Risk Assessment
38
Exposure Concentration: It is assumed that the exposure concentration calculated using essentially 1
year of monitoring data does not change over a 70-year lifetime. Using the 95UCL as a conservative
estimator of the true average helps reduce uncertainty in the annual estimated for the year monitored, but
does not provide information about changing exposure patterns over the long term in which exposures
may go up or down. As such, the computation of the exposure concentration for chemicals in air may
have resulted in an overestimate or underestimate of risks. To reduce this uncertainty would require
monitoring over several years, or modeling based on changes in estimated future meteorology and
chemical emissions.
Toxicity Analysis - Chemicals without Dose-Response Values: Detected chemicals with no available
dose-response values were not carried through the risk assessment process. This is likely to result in an
underestimate of risk.
Toxicity Analysis - Route to Route Extrapolation: In limited circumstances, risk assessments may use
route to route extrapolation (i.e., oral potency estimates extrapolated to inhalation potency) in an attempt
to evaluate a chemical with no relevant toxicity information. Route to route extrapolation is recommended
only from oral to inhaled exposure and only for carcinogens (USEPA, 2004). However, there were no
instances where IUR values were missing while Oral Slope factors were available. Therefore, these
approaches were not implemented.
Toxicity Assessment: The dose-response values used in this assessment were developed using a variety
of assumptions and data, such as using information from laboratory animal studies and extrapolating from
high-doses used in experiments to the low-doses actually expected in the environment. A variety of
methods are used to ensure a margin of safety in the resulting dose-response values.
Total Chromium Toxicity: Total chromium does not have an established dose-response value but toxic
hexavalent chromium, a potential component of total chromium, does. We estimated the hexavalent
chromium concentrations from total chromium values based on the ratio of these two compounds
previously determined in the North Birmingham area, and used that information to estimate the risk posed
by total chromium. While the risks posed by hexavalent chromium are uncertain, it is noteworthy that
results in this study are comparable to those found in the BATS study.
Acrolein Sampling and Analysis: During the School Air Toxics Monitoring Project (SAT), EPA raised
questions about the consistency and reliability of air monitoring and analysis results for acrolein. The
Agency decided not to analyze acrolein data as part of the SAT and has been working since that time on
developing new technologies that may provide more accurate data. Likewise, we did not analyze acrolein
data reported in this study. Excluding acrolein analysis means that hazard indices are likely to be
underestimated. But, we do not know how high hazard quotients were and how much they would have
contributed to hazard indices.
Lead (Pb) Hazard Evaluation: A comparison of this study’s lead samples and the lead NAAQS is
complicated by the samples not having been collected using TSP samplers. The samples are nevertheless
relevant for screening potential exposures to airborne lead in the four North Birmingham neighborhoods.
Several important uncertainties in this analysis include the following:
The lead monitoring for this study used PM10 samplers which, in areas where airborne lead is
present in larger particle sizes, may underestimate the airborne lead.

North Birmingham Air Toxics Risk Assessment
39
One monitoring site (Hudson K-8 School) had three 3-month rolling concentration averages
greater than 0.10 µg/m3, a result which, if recorded using a low-volume PM10 sampler, would
require siting of a TSP monitor.
An additional uncertainty is with regard to the potential for increased neurological hazard as a result
simultaneous exposures to other neurotoxicants (e.g., manganese).
Acute Hazard Assessment: Many acute benchmark values used in this study were developed for 8-hour
or shorter exposure time periods and then compared to 24-hour sample concentrations. Comparing 24-
hour composite sample data to acute toxicity values with significantly lower exposure periods results in
uncertainty as to whether some acute risks were undetected. This, coupled with having only sampled on a
subset of days during the monitoring program means that the acute risks may be underestimated.
North Birmingham Air Toxics Risk Assessment
40
7.0 CONCLUSIONS
A risk assessment of the potential for adverse chronic and acute human health impacts from inhalation of
air toxics has been conducted in four North Birmingham communities. Data were collected from four air
monitoring sites in these communities from June 2011 to August 2012 and included 58 VOCs, 22
SVOCs, and 11metals. Acrolein was excluded from the risk analysis because present sampling and
analysis methods are not reliable enough to accurately measure this chemical in ambient air. The EPA is
working on developing more accurate methods. However, NATA analysis of the 2005 inventory of air
toxics emissions data does indicate that acrolein is expected to be prevalent in many communities
throughout the country, including Birmingham, as a product of incomplete combustion (e.g., from motor
vehicles).
For each monitoring site, the COPCs were determined to be chemicals found in at least 10% of the
samples. Data for the COPCs were then used in potential chronic risk and hazard assessments. All four
sites had the same COPCs, except for trichloroethylene. This chemical was identified at Husdon K-8 and
Lewis Elementary Schools as a COPC, but not at the Riggins School and Shuttlesworth Station sites. For
acute hazard assessments, all chemicals that were detected at least once, rather than the COPCs, were
evaluated.
In this risk assessment, the potential human health implications of the chronic exposures were
characterized for both chronic cancer and non-cancer health effects using the 95UCL concentrations and
chronic toxicity benchmark values. In addition, an acute risk characterization was performed. In this
analysis, individual sample monitoring concentrations were compared to acute benchmarks.
The remainder of this Section provides the conclusions of the chronic and acute assessments, and end
with a comparison with the BATS study.
7.1 Chronic Risk Characterization
In this risk assessment, each of the monitoring sites had a total cancer risk of 1x10⁻⁴
. While the level of
cancer risk that is of concern is a matter of personal and community judgment, the USEPA considers
excess cancer risks below about 1 chance in 1,000,000 (1x10⁻⁶
) to be negligible, and excess cancer risks
that range between 1x10⁻⁶
to approximately1x10-4
to be generally acceptable. The three chemicals that
pose the greatest portion of these risks are the same at all the sites and consist of benzene, naphthalene,
and arsenic. Combined, they contributed 69 to 78% of the total risk at these sites. 1,3-butadiene and
carbon tetrachloride are other risk drivers that were found at the four sites, although contributing 6% or
less of the risk at each site. The remaining risk drivers, although contributing less to the cumulative risk,
include benzo(a)pyrene, p-dichlorobenzene and cadmium at the Hudson K-8 School; 1,2-dichloroethane
and ethylbenzene at the Lewis Elementary School; Benzo(a)pyrene and dibenz(a,h)anthracene at the
Riggins School; and 1,2-dichloroethane and benzo(a)pyrene at the Shuttlesworth Station.
7.2 Chronic Hazard Characterization
The initial screening HI calculated for the Shuttlesworth Station is 1. The HI at the Hudson K-8 School,
Lewis Elementary School, and Riggins School sites is 2. None of the individual risk drivers have an HQ

North Birmingham Air Toxics Risk Assessment
41
above 1. When additional toxicological information was taken into account (e.g., target organs), no HI
was above 1, which indicates that adverse non-cancer effects are unlikely at each of the four sites. All the
four sites have the same hazard drivers although in different concentrations. These COPCs were
manganese, naphthalene, benzene, arsenic, 1,3-butadiene and cadmium.
7.3 Acute Hazard Characterization
The acute exposure analysis consisted of comparing the maximum concentrations of chemicals that were
detected at least once at a monitoring site to acute benchmark values. The results indicate that benzene
concentrations exceed the ATSDR acute MRL on 3 separate occasions at the Riggins School site. This
indicates that potential short-term health hazards resulting from elevated levels of benzene at this site at
the time of sampling were possible on those days. No major variations in weather conditions or unusual
events or malfunctions at nearby industries were noted at on the days these samples were collected to
explain the high levels of benzene.
7.4 Comparison with the 2009 Birmingham Air Toxics Study
The findings of this risk assessment are generally consistent with a prior risk assessment, the 2009
Birmingham Air Toxics Study, although cancer risk and non-cancer health hazard levels are lower in the
present study. A comparison is made for only the results at the Shuttlesworth Station site because this
monitoring site was used in both studies. Sampling protocols and analytical methods were nearly the
same in both studies. The present study found a cumulative cancer risk of 1x10⁻⁴
at this site compared to
2x10⁻⁴
in the BATS study. Benzene, which contributed most to the total risk in both studies, decreased
from 6 x10⁻⁵
in BATS to 4 x10⁻⁵
in this study. The risk levels associated with benzene, naphthalene, and
arsenic were the top risk drivers in both studies. For non-cancer hazard effects, this study yielded an HI
of 1 compared to 6 in the BATS study (excluding acrolein). The highest contributor to the HI (excluding
acrolein) in both studies was manganese, but this COPC had an HQ of 4 in the BATS project compared to
an HQ of 0.5 in the current study. Benzene exceeded the ATSDR acute MRL three times in this study but
only once in the BATS project.

North Birmingham Air Toxics Risk Assessment
42
8.0 REFERENCES
Agency for Toxic Substances and Disease Registry (ATSDR). 2002. Minimum Risk Levels, URL:
http://www.atsdr.cdc.gov/mrls.html., Agency for Toxic Substances and Disease Registry, Atlanta, GA.
California Environmental Protection Agency (CalEPA). 2002. Acute and Chronic RELs and Supporting
Documentation URL: http://www.oehha.org/air/hot_spots/index.html.
American Industrial Hygiene Association (AIHA). 2001. AIHA ERPG/WEEL Handbook, American
Industrial Hygiene Association. Fairfax, VA.
Jefferson County Health Department (JCDH). 2009. Birmingham Air Toxics Study (BATS).
Environmental Health Services. Air and Radiation Protection Division. Birmingham, AL. 128p.
National Climate Data Center (NCDC). 2012. Quality Controlled Local Climatological
Data. NOAA. http://cdo.ncdc.noaa.gov/qclcd/QCLCD
National Research Council (NRC). 2001. Standing Operations for Developing Acute Exposure Guideline
Levels (AEGL) for Hazardous Chemicals. Committee of Toxicology. National Academy Press.
Washington, DC. 224pp.
US Census Bureau. 2010. The 2010 Census. See: http://2010.census.gov/2010census/
USEPA. 1986. Guidelines for Carcinogen Risk Assessment. Federal Register 51(185): 33992-34003.
Available from: http://www.epa.gov/ncea/raf/.
USEPA. 1989. National Emission Standards for Hazardous Air Pollutants: Benzene. Federal Register
54(177):38044-38072. Rule and Proposed Rule. September 14, 1989.
USEPA. 1994. Methods for Derivation of Inhalation Reference Concentrations (RfCs) and Application of
Inhalation Dosimetry. Office of Research and Development. 409pp.
USEPA 1999. Residual Risk Report to Congress. EPA-453/R-99-001. Office of Air Quality, Planning,
and Standards. 225pp.
USEPA. 2001. National-Scale Air Toxics Assessment for 1996 -(Draft for USEPA Science Advisory
Board Review), Office of Air Quality Planning and Standards, Research Triangle Park, N.C. USEPA–
453/R–01–003.
USEPA. 2002. A Review of the Reference Dose and Reference Concentration Process EPA/630/P-
02/002F. Risk Assessment Forum. Final Report. December 2002.
USEPA. 2003. Draft Final Guidelines for Carcinogen Risk Assessment (External Review Draft, February
2003). Risk Assessment Forum, Washington, DC.
USEPA. 2004. Air Toxics Risk Assessment Reference Library, Office of Air Quality Planning and
Standards, EPA-453-K-04-001A.
North Birmingham Air Toxics Risk Assessment
43
USEPA. 2005a. Code of Federal Regulations - Title 40: Protection of Environment. 40 CFR Appendix B
to Part 136 - Definition and Procedure for the Determination of the Method Detection Limit - Revision
1.11.
USEPA. 2005b. Guidelines for Carcinogen Risk Assessment, EPA/630/P-03/001F, Risk Assessment
Forum , March 2005
USEPA. 2005c. Supplemental Guidance for Assessing Susceptibility from Early-Life Exposure to
Carcinogens. Risk Assessment Forum. U.S. EPA. EPA/630/R-03/003F March 2005.
USEPA. 2006. On the Computation of a 95% Upper Confidence Limit of the Unknown Population Mean
Based Upon Data Sets with Below Detection Limit Observations. EPA/600/R-06/022 Office of Research
and Development, Las Vegas, NV 89119
USEPA. 2009a. USEPA School Air Toxics Study. Data and technical documents available at
http://www.epa.gov/schoolair.
USEPA. 2009b. Technical Assistance Document for the National Air Toxics Trends Stations (NATTS)
Program. Office of Air Quality Planning and Standards. Revision 2.
USEPA. 2009c. The Loudon County Air Toxics Risk Assessment. EPA Region 4.
USEPA. 2010. ProUCL Version 4.1. User Guide (Draft). Statistical Software for Environmental
Applications for Data Sets with and without Nondetect Observations. EPA/600/R-07/041. Office of
Research and Development . Lockheed Martin Environmental Services. Las Vegas. Nevada.
USEPA. 2011a. An Overview of Methods for EPA’s National-Scale Air Toxics Assessment (NATA).
Office of Air Quality, Planning, and Standards. ICF International. Durham, NC.
USEPA, 2011b. Toxicological Review of Trichloroethylene (CAS No. 79-01-6) in Support of Summary
Information on the Integrated Risk Information System (IRIS). EPA/635/R-09/011F. September 2011.

North Birmingham Air Toxics Risk Assessment
44
9.0 GLOSSARY
AEGLs Acute Exposure Guideline Levels
ATSDR Agency for Toxic Substances and Disease Registry
BPAT North Birmingham Pilot Community Air Toxics Initiative
BW Body weight
CalEPA California Environmental Protection Agency
CAP Criteria Air Pollutant
CARD Cardiovascular effects
CAS Chemical Abstract Service
COPCs Chemicals of potential concern
CPSo Oral cancer potency slope
DEV Developmental effects
DL Detection Limit
ERG Eastern Research Group
ERPGs Emergency Response Planning Guidelines
HAP Hazardous Air Pollutant
HCl Hydrochloric acid
HEAST Health Effects Assessment Summary Table
HEM Hematological effect
HEP Hepatic effect
HI Hazard Index
HQ Hazard Quotient
IARC International Agency for Research on Cancer
IR Inhalation Rate
IRIS Integrated Risk Information System
JCDH Jefferson County Department of Health
IMM Immunological effect
MRLs Minimum Risk Levels
NAAQS National Ambient Air Quality Standard
NATA National Air Toxics Assessment
NATTS National Air Toxics Trends Stations
NEUR Neurological effect
Pb-PM10 Lead measured as particulate matter less than 10 micrometers in diameter
Pb-TSP Lead measured as total suspended particles
PCBs Polychlorinated Biphenyls
QA Quality Assurance
QAPP Quality Assurance Project Plan
QC Quality Control
RELs Reference Exposure Levels
RfC Reference Concentration
RME Reasonable Maximum Exposure
RPR Reproductive effect
RSP Respiratory effect
SAT School Air Toxics
SKIN Skin effect
SQL Sample Quantitation Limit
SVOCs Semi-Volatile Organic Compounds

North Birmingham Air Toxics Risk Assessment
45
TICs Tentatively identified compounds
TOSHI Target Organ Specific Hazard Indices
TSP Total Suspended Particles
UCL Upper Confidence Limit
URE Unit Risk Estimate
VOCs Volatile Organic Compounds
WOE Weight of Evidence

North Birmingham Air Toxics Risk Assessment
46
Figures

North Birmingham Air Toxics Risk Assessment
47
Figure 1.2-1 Travel Map of the Birmingham, AL Area

North Birmingham Air Toxics Risk Assessment
48
Figure 1.2-2. Wind Rose in the Birmingham Area, from June 2011 to August 2012
WRPLOT View - Lakes Environmental Software
WIND ROSE PLOT:
Station #13876 - BIRMINGHAM/MUNICIPAL ARPT, AL
COMMENTS: COMPANY NAME:
U.S. EPA Region 4
MODELER:
Rick Gillam, APTMD/APB/AQMTS
DATE:
10/29/2012
PROJECT NO.:
NORTH
SOUTH
WEST EAST
2%
4%
6%
8%
10%
WIND SPEED
(m/s)
>= 11.1
8.8 - 11.1
5.7 - 8.8
3.6 - 5.7
2.1 - 3.6
0.5 - 2.1
Calms: 36.47%
TOTAL COUNT:
10989 hrs.
CALM WINDS:
36.47%
DATA PERIOD:
Start Date: 6/1/2011 - 01:00End Date: 8/31/2012 - 23:00
AVG. WIND SPEED:
2.23 m/s
DISPLAY:
Wind SpeedDirection (blowing from)

North Birmingham Air Toxics Risk Assessment
49
Figure 2.1-1. Approximate Locations of the 4 Monitoring Sites

North Birmingham Air Toxics Risk Assessment
50
Tables

North Birmingham Air Toxics Risk Assessment
51
Table 1.2-1 Monthly Weather Conditions Data For the Monitoring Time Period1
Year/
Month
Temperature (oF)
2
Temperature (oF)
-Deviation from Normal Rainfall (inches)
Ave Wind
Speed
(mph) Min Max Ave Min Max Ave Amount
Deviation
From
Normal
11-Jun 70.5 94.7 82.6 7 2.8 4.9 2.81 -1.57 5.4
11-Jul 73.6 92.5 83.1 1.7 2.2 2 8 3.2 4
11-Aug 71.8 94.6 83.2 4 1 2.5 0.48 -3.45 4.3
11-Sep 61.8 82.7 72.3 -2.4 -2.5 -2.4 12.14 8.24 4.9
11-Oct 49 73.4 61.2 -1.9 -3.9 -2.9 0.36 -3.08 4.9
11-Nov 45.6 66.1 55.9 0.7 2.1 1.5 6.37 1.52 7
11-Dec 39.5 59.6 49.6 3.7 3.2 3.5 5.24 0.79 5.3
12-Jan 38.8 60.7 49.8 6.9 5 6 5.9 1.06 6.7
12-Feb 42.3 61.6 52 3.2 5.2 4.3 2.96 -1.6 6.7
12-Mar 54.8 76.3 65.6 9.6 11.1 10.4 4.72 -0.5 6.6
12-Apr 54.5 77.7 66.1 3.3 4 3.6 1.26 -3.2 6.0
12-May 63.8 84.5 74.2 3 4.1 3.6 4.95 -0.04 4.0
12-Jun 67.7 89.9 78.8 2.2 0.0 1.1 2.44 -1.9 4.7
12-Jul 73.9 92.9 83.4 2.1 2.5 2.3 6.26 1.5 5.1
12-Aug 69.8 87.2 78.5 -3.4 -1.0 -2.2 4.07 0.14 4.1
1As Recorded at the Birmingham International Airport
2Min = Minimum, Max = maximum; Ave = Average

North Birmingham Air Toxics Risk Assessment
52
Table 2.2-1 Sample Analysis List for All Monitoring Sites
Chemical CAS # TYPE Chemical CAS # TYPE
1,1,1-Trichloroethane 71-55-6 VOC Coronene 191-07-1 SVOCs
1,1,2,2-Tetrachloroethane 79-34-5 VOC Cyclopenta[cd]pyrene 27208-37-3 SVOCs
1,1,2-Trichloroethane 79-00-5 VOC Dibenz (a,h) anthracene 53-70-3 SVOCs
1,1-Dichloroethane 75-34-3 VOC Dibromochloromethane 124-48-1 VOC
1,1-Dichloroethene 75-35-4 VOC Dichlorodifluoromethane 75-71-8 VOC
1,2,4-Trichlorobenzene 120-82-1 VOC Dichloromethane 75-09-2 VOC
1,2,4-Trimethylbenzene 95-63-6 VOC Dichlorotetrafluoroethane 76-14-2 VOC
1,2-Dibromoethane 106-93-4 VOC Ethyl Acrylate 140-88-5 VOC
1,2-Dichloroethane 107-06-2 VOC Ethyl tert-Butyl Ether 637-92-3 VOC
1,2-Dichloropropane 78-87-5 VOC Ethylbenzene 100-41-4 VOC
1,3,5-Trimethylbenzene 108-67-8 VOC Fluoranthene 206-44-0 SVOCs
1,3-Butadiene 106-99-0 VOC Fluorene 86-73-7 SVOCs
9-Fluorenone 486-25-9 SVOCs Hexachloro-1,3-Butadiene 87-68-3 VOC
Acenaphthene 83-32-9 SVOCs Indeno(1,2,3-cd)pyrene 193-39-5 SVOCs
Acenaphthylene 208-96-8 SVOCs Lead 7439-92-1 Metal
Acetonitrile 75-05-8 VOC m,p-Xylene
108-38-3,
106-42-3 VOC
Acetylene 74-86-2 VOC Manganese 7439-96-5 Metal
Acrolein 107-02-8 VOC m-Dichlorobenzene 541-73-1 VOC
Acrylonitrile 107-13-1 VOC Mercury 7439-97-6 Metal
Anthracene 120-12-7 SVOCs Methyl Ethyl Ketone1 78-93-3 VOC
Antimony 7440-36-0 Metal Methyl Isobutyl Ketone 108-10-1 VOC
Arsenic 7440-38-2 Metal Methyl Methacrylate 80-62-6 VOC
Benzene 71-43-2 VOC Methyl tert-Butyl Ether 1634-04-4 VOC
Benzo (a) anthracene 56-55-3 SVOCs Naphthalene 91-20-3 SVOCs
Benzo (a) pyrene 50-32-8 SVOCs Nickel 7440-02-0 Metal
Benzo (b) fluoranthene 205-99-2 SVOCs n-Octane 111-65-9 VOC
Benzo (e) pyrene 192-97-2 SVOCs o-Dichlorobenzene 95-50-1 VOC
Benzo (g,h,i) perylene 191-24-2 SVOCs o-Xylene 95-47-6 VOC
Benzo (k) fluoranthene 207-08-9 SVOCs p-Dichlorobenzene 106-46-7 VOC
Beryllium 7440-41-7 Metal Perylene 198-55-0 SVOCs
Bromochloromethane 74-97-5 VOC Phenanthrene 85-01-8 SVOCs
Bromodichloromethane 75-27-4 VOC Propylene 115-07-1 VOC
Bromoform 75-25-2 VOC Pyrene 129-00-0 SVOCs
Bromomethane 74-83-9 VOC Retene 483-65-8 SVOCs
Cadmium 7440-43-9 Metal Selenium 7782-49-2 Metal
Carbon Disulfide 75-15-0 VOC Styrene 100-42-5 VOC
Carbon Tetrachloride 56-23-5 VOC tert-Amyl Methyl Ether 994-05-8 VOC
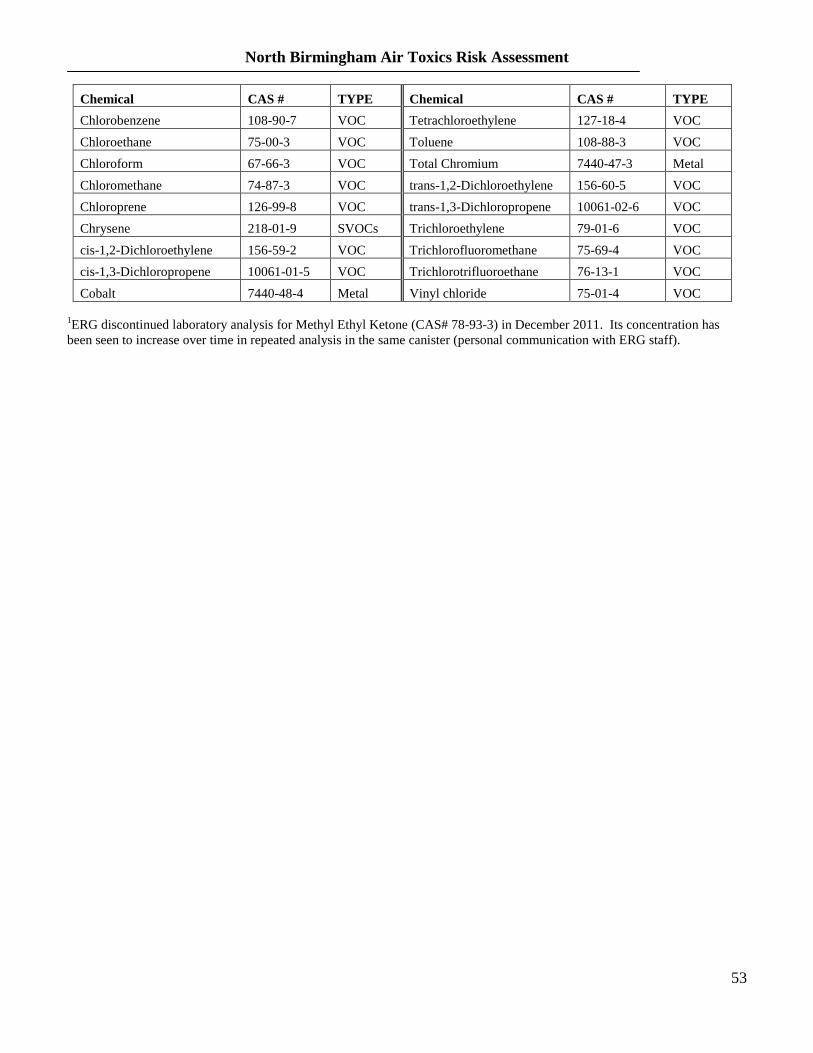
North Birmingham Air Toxics Risk Assessment
53
Chemical CAS # TYPE Chemical CAS # TYPE
Chlorobenzene 108-90-7 VOC Tetrachloroethylene 127-18-4 VOC
Chloroethane 75-00-3 VOC Toluene 108-88-3 VOC
Chloroform 67-66-3 VOC Total Chromium 7440-47-3 Metal
Chloromethane 74-87-3 VOC trans-1,2-Dichloroethylene 156-60-5 VOC
Chloroprene 126-99-8 VOC trans-1,3-Dichloropropene 10061-02-6 VOC
Chrysene 218-01-9 SVOCs Trichloroethylene 79-01-6 VOC
cis-1,2-Dichloroethylene 156-59-2 VOC Trichlorofluoromethane 75-69-4 VOC
cis-1,3-Dichloropropene 10061-01-5 VOC Trichlorotrifluoroethane 76-13-1 VOC
Cobalt 7440-48-4 Metal Vinyl chloride 75-01-4 VOC
1ERG discontinued laboratory analysis for Methyl Ethyl Ketone (CAS# 78-93-3) in December 2011. Its concentration has
been seen to increase over time in repeated analysis in the same canister (personal communication with ERG staff).

North Birmingham Air Toxics Risk Assessment
54
Table 2.3.1-1 Sampling Dates at Each of the Monitoring Sites
Monitoring Sites
Hudson K-8 School Lewis Elementary School Riggins School Shuttlesworth Station
6/24/2011 6/24/2011 6/24/2011 6/24/2011
7/7/2011 7/7/2011 7/7/2011 7/7/2011
-1 7/8/2011 - 7/8/2011
7/13/2011 7/13/2011 7/13/2011 7/13/2011
7/19/2011 7/19/2011 7/19/2011 7/19/2011
7/20/2011 7/20/2011 - 7/20/2011
- - 7/24/2011 -
7/25/2011 7/25/2011 7/25/2011 7/25/2011
7/31/2011 7/31/2011 7/31/2011 7/31/2011
8/1/2011 8/1/2011 - 8/1/2011
8/6/2011 8/6/2011 8/6/2011 8/6/2011
8/12/2011 8/12/2011 8/12/2011 8/12/2011
8/18/2011 8/18/2011 8/18/2011 8/18/2011
8/24/2011 8/24/2011 8/24/2011 8/24/2011
8/30/2011 8/30/2011 8/30/2011 8/30/2011
9/11/2011 9/11/2011 9/11/2011 9/11/2011
9/12/2011 9/12/2011 - -
9/17/2011 9/17/2011 9/17/2011 9/17/2011
9/23/2011 9/23/2011 9/23/2011 9/23/2011
9/29/2011 9/29/2011 9/29/2011 9/29/2011
10/5/2011 10/5/2011 10/5/2011 10/5/2011
10/11/2011 10/11/2011 10/11/2011 10/11/2011
10/17/2011 10/17/2011 10/17/2011 10/17/2011
10/23/2011 10/23/2011 10/23/2011 10/23/2011
10/29/2011 10/29/2011 10/29/2011 10/29/2011
11/4/2011 11/4/2011 11/4/2011 11/4/2011
11/10/2011 11/10/2011 11/10/2011 11/10/2011
11/16/2011 11/16/2011 11/16/2011 11/16/2011
11/22/2011 11/22/2011 11/22/2011 11/22/2011
11/28/2011 11/28/2011 11/28/2011 11/28/2011
12/4/2011 12/4/2011 12/4/2011 12/4/2011
12/10/2011 12/10/2011 12/10/2011 12/10/2011
12/16/2011 12/16/2011 12/16/2011 12/16/2011
12/22/2011 12/22/2011 12/22/2011 12/22/2011
1/9/2012 1/9/2012 1/9/2012 1/9/2012
1/15/2012 1/15/2012 1/15/2012 1/15/2012
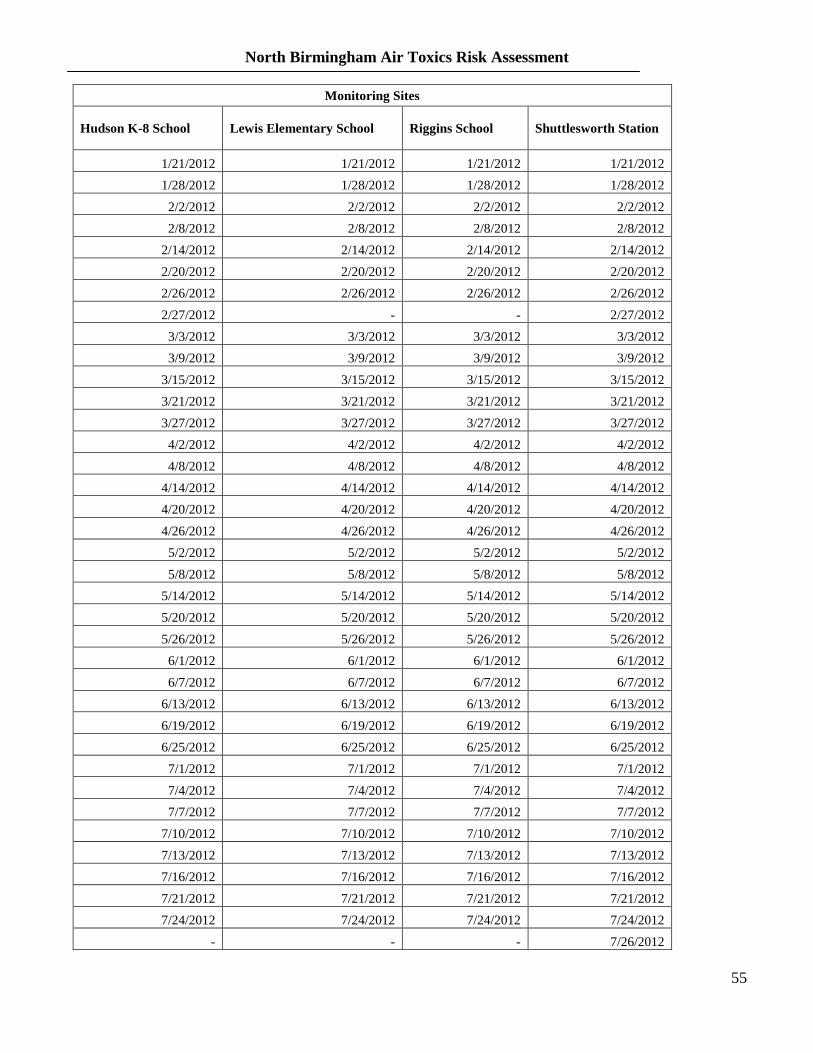
North Birmingham Air Toxics Risk Assessment
55
Monitoring Sites
Hudson K-8 School Lewis Elementary School Riggins School Shuttlesworth Station
1/21/2012 1/21/2012 1/21/2012 1/21/2012
1/28/2012 1/28/2012 1/28/2012 1/28/2012
2/2/2012 2/2/2012 2/2/2012 2/2/2012
2/8/2012 2/8/2012 2/8/2012 2/8/2012
2/14/2012 2/14/2012 2/14/2012 2/14/2012
2/20/2012 2/20/2012 2/20/2012 2/20/2012
2/26/2012 2/26/2012 2/26/2012 2/26/2012
2/27/2012 - - 2/27/2012
3/3/2012 3/3/2012 3/3/2012 3/3/2012
3/9/2012 3/9/2012 3/9/2012 3/9/2012
3/15/2012 3/15/2012 3/15/2012 3/15/2012
3/21/2012 3/21/2012 3/21/2012 3/21/2012
3/27/2012 3/27/2012 3/27/2012 3/27/2012
4/2/2012 4/2/2012 4/2/2012 4/2/2012
4/8/2012 4/8/2012 4/8/2012 4/8/2012
4/14/2012 4/14/2012 4/14/2012 4/14/2012
4/20/2012 4/20/2012 4/20/2012 4/20/2012
4/26/2012 4/26/2012 4/26/2012 4/26/2012
5/2/2012 5/2/2012 5/2/2012 5/2/2012
5/8/2012 5/8/2012 5/8/2012 5/8/2012
5/14/2012 5/14/2012 5/14/2012 5/14/2012
5/20/2012 5/20/2012 5/20/2012 5/20/2012
5/26/2012 5/26/2012 5/26/2012 5/26/2012
6/1/2012 6/1/2012 6/1/2012 6/1/2012
6/7/2012 6/7/2012 6/7/2012 6/7/2012
6/13/2012 6/13/2012 6/13/2012 6/13/2012
6/19/2012 6/19/2012 6/19/2012 6/19/2012
6/25/2012 6/25/2012 6/25/2012 6/25/2012
7/1/2012 7/1/2012 7/1/2012 7/1/2012
7/4/2012 7/4/2012 7/4/2012 7/4/2012
7/7/2012 7/7/2012 7/7/2012 7/7/2012
7/10/2012 7/10/2012 7/10/2012 7/10/2012
7/13/2012 7/13/2012 7/13/2012 7/13/2012
7/16/2012 7/16/2012 7/16/2012 7/16/2012
7/21/2012 7/21/2012 7/21/2012 7/21/2012
7/24/2012 7/24/2012 7/24/2012 7/24/2012
- - - 7/26/2012

North Birmingham Air Toxics Risk Assessment
56
Monitoring Sites
Hudson K-8 School Lewis Elementary School Riggins School Shuttlesworth Station
7/27/2012 7/27/2012 7/27/2012 -
7/30/2012 - 7/30/2012 7/30/2012
7/31/2012 - - -
8/2/2012 8/2/2012 8/2/2012 -
8/5/2012 8/5/2012 - -
- 8/8/2012 8/8/2012 -
- 8/11/2012 - -
- - 8/17/2012 -
- - 8/20/2012 -
- - 8/23/2012 -
- - 8/26/2012 -
1Samples missed or invalidated. For more information as to why, see Section 2.3.1 of this document

North Birmingham Air Toxics Risk Assessment
57
Table 2.6-1 Chemical Screening Results for the Hudson K-8 School Site
Chemical1
Chemical
Type CAS #
Min Conc.
(µg/m3)
Max Conc.
(µg/m3)
Ave Conc.
(µg/m3)
Number of
Valid
Samples
Number of
Detections
(≥1)
Detection
Frequency
(%)
COPC2
1,1,1-Trichloroethane VOC 71-55-6 0.12004 0.22371 0.17187 60 2 3
1,1,2,2-Tetrachloroethane VOC 79-34-5 0.71396 0.71396 0.71396 60 1 2
1,1,2-Trichloroethane VOC 79-00-5 0.22916 0.22916 0.22916 60 1 2
1,1-Dichloroethane VOC 75-34-3 0.15380 0.15380 0.15380 60 1 2
1,1-Dichloroethene VOC 75-35-4 0.04361 0.13084 0.08723 60 2 3
1,2,4-Trichlorobenzene VOC 120-82-1 0.97218 0.97218 0.97218 60 1 2
1,2-Dibromoethane VOC 106-93-4 0.38418 0.38418 0.38418 60 1 2
1,2-Dichloroethane VOC 107-06-2 0.06476 0.22666 0.09431 60 43 72 X
1,2-Dichloropropane VOC 78-87-5 0.19409 0.19409 0.19409 60 1 2
1,3-Butadiene VOC 106-99-0 0.02655 0.64157 0.13871 60 60 100 X
Acetonitrile VOC 75-05-8 0.06548 3.59313 0.38705 60 58 97 X
Acrylonitrile VOC 107-13-1 0.10200 0.25609 0.17905 60 2 3
Arsenic Metal 7440-38-2 0.00013 0.00400 0.00151 63 63 100 X
Benzene VOC 71-43-2 0.00013 21.88453 3.44210 60 60 100 X
Benzo(a)anthracene SVOC 56-55-3 0.00005 0.01610 0.00230 68 62 91 X
Benzo(a)pyrene SVOC 50-32-8 0.00006 0.00955 0.00154 68 47 69 X
Benzo(b)fluoranthene SVOC 205-99-2 0.00006 0.01930 0.00280 68 68 100 X
Benzo(k)fluoranthene SVOC 207-08-9 0.00005 0.00545 0.00107 68 51 75 X
Beryllium Metal 7440-41-7 0.00001 0.00008 0.00002 63 35 56 X
Bromoform VOC 75-25-2 0.85794 0.85794 0.85794 60 1 2
Bromomethane VOC 74-83-9 0.03883 0.14755 0.06130 60 42 70 X
Cadmium Metal 7440-43-9 0.00008 0.00779 0.00089 63 63 100 X
Carbon Disulfide VOC 75-15-0 0.04360 0.27092 0.08732 60 25 42 X
Carbon Tetrachloride VOC 56-23-5 0.04360 0.89966 0.70002 60 60 100 X
Chlorobenzene VOC 108-90-7 0.11969 0.29924 0.18261 60 3 5

North Birmingham Air Toxics Risk Assessment
58
Chemical1
Chemical
Type CAS #
Min Conc.
(µg/m3)
Max Conc.
(µg/m3)
Ave Conc.
(µg/m3)
Number of
Valid
Samples
Number of
Detections
(≥1)
Detection
Frequency
(%)
COPC2
Chloroethane VOC 75-00-3 0.10027 0.10818 0.10379 60 3 5
Chloroform VOC 67-66-3 0.07324 0.28807 0.15272 60 43 72 X
Chloromethane VOC 74-87-3 0.07324 1.76139 1.22334 60 60 100 X
Chloroprene VOC 126-99-8 0.14484 0.14484 0.14484 60 1 2
Chrysene SVOC 218-01-9 0.00013 0.01660 0.00289 68 68 100 X
Cobalt Metal 7440-48-4 0.00005 0.00122 0.00024 63 63 100 X
Dibenz(a,h)anthracene SVOC 53-70-3 0.00006 0.00225 0.00045 68 39 57 X
Dichloromethane VOC 75-09-2 0.28137 4.82849 0.77157 60 60 100 X
Ethylbenzene VOC 100-41-4 0.10856 1.81070 0.51144 60 60 100 X
Hexachloro-1,3-Butadiene VOC 87-68-3 1.16250 1.16250 1.16250 60 1 2
Indeno(1,2,3-cd)pyrene SVOC 193-39-5 0.00006 0.00712 0.00122 68 53 78 X
Lead Metal 7439-92-1 0.00006 1.13000 0.05286 63 63 100 X
m, p-Xylenes VOC
108-38-3,
106-42-3 0.00006 6.90411 1.49082
60 60 100 X
Manganese Metal 7439-96-5 0.00006 0.11700 0.03095 63 63 100 X
Mercury Metal 7439-97-6 0.00002 0.00028 0.00006 63 20 32 X
Methyl Isobutyl Ketone VOC 108-10-1 0.06554 0.51616 0.21234 60 54 90 X
Methyl Methacrylate VOC 80-62-6 0.14332 0.28254 0.21293 60 2 3
Methyl tert-Butyl Ether VOC 1634-04-4 0.11176 0.11176 0.11176 60 1 2
Naphthalene SVOC 91-20-3 0.03750 2.02000 0.48373 68 68 100 X
Nickel Metal 7440-02-0 0.00055 0.01260 0.00234 63 60 95 X
o-Xylene VOC 95-47-6 0.108555 2.848489 0.626146 61 61 100 X
p-Dichlorobenzene VOC 106-46-7 0.11424 0.94395 0.31522 60 28 47 X
Propylene VOC 115-07-1 0.0000642 4.06174 0.95270 60 60 100 X
Selenium Metal 7782-49-2 0.00021 0.00223 0.00089 63 57 90 X
Styrene VOC 100-42-5 0.11075 4.43015 0.63288 60 56 93 X
Tetrachloroethylene VOC 127-18-4 0.12887 0.83426 0.25587 60 29 48 X

North Birmingham Air Toxics Risk Assessment
59
Chemical1
Chemical
Type CAS #
Min Conc.
(µg/m3)
Max Conc.
(µg/m3)
Ave Conc.
(µg/m3)
Number of
Valid
Samples
Number of
Detections
(≥1)
Detection
Frequency
(%)
COPC2
Toluene VOC 108-88-3 0.12887 27.43479 3.24394 60 60 100 X
Total Chromium Metal 7440-47-3 0.00831 0.01780 0.01380 63 18 29 X
Trichloroethylene VOC 79-01-6 0.13434 0.24719 0.17375 60 6 10 X
Vinyl chloride VOC 75-01-4 0.02301 0.07669 0.04175 60 3 5
1Chemicals that were detected at or above respective detection limits at least once.
2X- Retained as COPC since detected at or above the detection limit in at least 10 percent of the samples
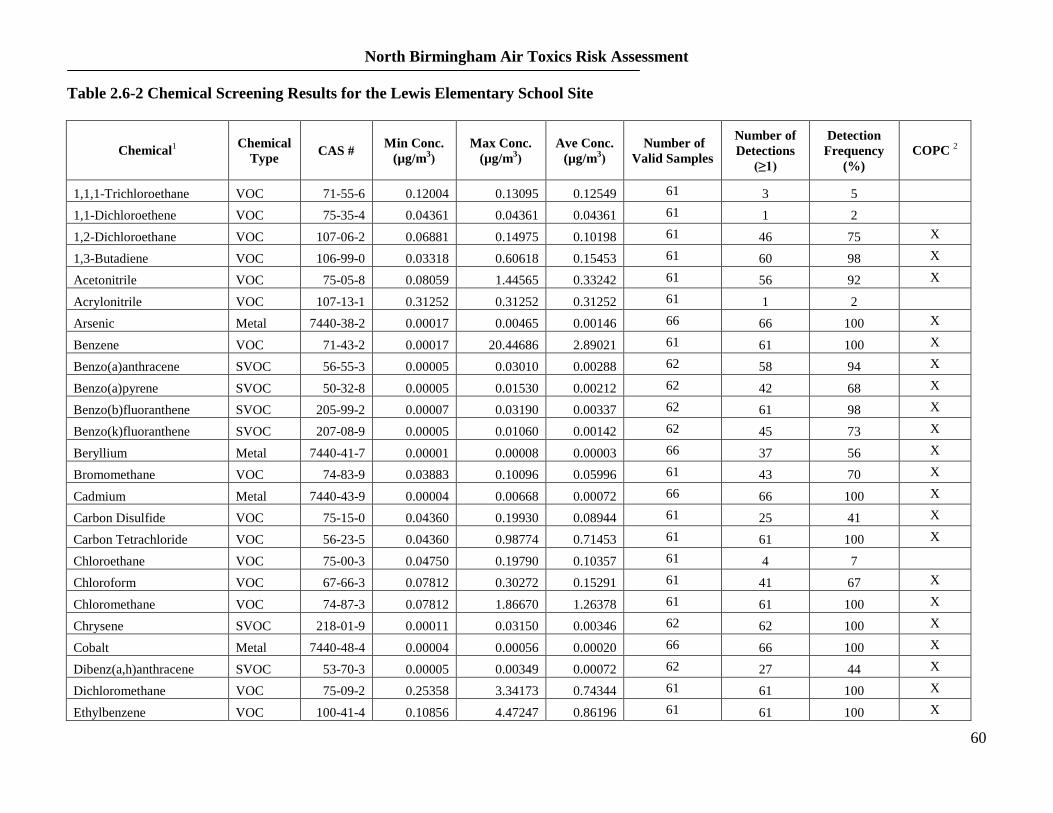
North Birmingham Air Toxics Risk Assessment
60
Table 2.6-2 Chemical Screening Results for the Lewis Elementary School Site
Chemical1
Chemical
Type CAS #
Min Conc.
(µg/m3)
Max Conc.
(µg/m3)
Ave Conc.
(µg/m3)
Number of
Valid Samples
Number of
Detections
(≥1)
Detection
Frequency
(%)
COPC 2
1,1,1-Trichloroethane VOC 71-55-6 0.12004 0.13095 0.12549 61 3 5
1,1-Dichloroethene VOC 75-35-4 0.04361 0.04361 0.04361 61 1 2
1,2-Dichloroethane VOC 107-06-2 0.06881 0.14975 0.10198 61 46 75 X
1,3-Butadiene VOC 106-99-0 0.03318 0.60618 0.15453 61 60 98 X
Acetonitrile VOC 75-05-8 0.08059 1.44565 0.33242 61 56 92 X
Acrylonitrile VOC 107-13-1 0.31252 0.31252 0.31252 61 1 2
Arsenic Metal 7440-38-2 0.00017 0.00465 0.00146 66 66 100 X
Benzene VOC 71-43-2 0.00017 20.44686 2.89021 61 61 100 X
Benzo(a)anthracene SVOC 56-55-3 0.00005 0.03010 0.00288 62 58 94 X
Benzo(a)pyrene SVOC 50-32-8 0.00005 0.01530 0.00212 62 42 68 X
Benzo(b)fluoranthene SVOC 205-99-2 0.00007 0.03190 0.00337 62 61 98 X
Benzo(k)fluoranthene SVOC 207-08-9 0.00005 0.01060 0.00142 62 45 73 X
Beryllium Metal 7440-41-7 0.00001 0.00008 0.00003 66 37 56 X
Bromomethane VOC 74-83-9 0.03883 0.10096 0.05996 61 43 70 X
Cadmium Metal 7440-43-9 0.00004 0.00668 0.00072 66 66 100 X
Carbon Disulfide VOC 75-15-0 0.04360 0.19930 0.08944 61 25 41 X
Carbon Tetrachloride VOC 56-23-5 0.04360 0.98774 0.71453 61 61 100 X
Chloroethane VOC 75-00-3 0.04750 0.19790 0.10357 61 4 7
Chloroform VOC 67-66-3 0.07812 0.30272 0.15291 61 41 67 X
Chloromethane VOC 74-87-3 0.07812 1.86670 1.26378 61 61 100 X
Chrysene SVOC 218-01-9 0.00011 0.03150 0.00346 62 62 100 X
Cobalt Metal 7440-48-4 0.00004 0.00056 0.00020 66 66 100 X
Dibenz(a,h)anthracene SVOC 53-70-3 0.00005 0.00349 0.00072 62 27 44 X
Dichloromethane VOC 75-09-2 0.25358 3.34173 0.74344 61 61 100 X
Ethylbenzene VOC 100-41-4 0.10856 4.47247 0.86196 61 61 100 X

North Birmingham Air Toxics Risk Assessment
61
Chemical1
Chemical
Type CAS #
Min Conc.
(µg/m3)
Max Conc.
(µg/m3)
Ave Conc.
(µg/m3)
Number of
Valid Samples
Number of
Detections
(≥1)
Detection
Frequency
(%)
COPC 2
Hexachloro-1,3-Butadiene VOC 87-68-3 0.43727 0.43727 0.43727 61 1 2
Indeno(1,2,3-cd)pyrene SVOC 193-39-5 0.00005 0.00987 0.00149 62 46 74 X
m,p-Xylenes VOC
108-38-3,
106-42-3 0.00005 0.83500 0.02754
61 61 100
X
Lead Metal 7439-92-1 0.00005 0.83500 0.02755 66 66 100 X
Manganese Metal 7439-96-5 0.00005 0.16500 0.03422 66 66 100 X
Mercury Metal 7439-97-6 0.00002 0.00009 0.00003 66 19 29 X
Methyl Isobutyl Ketone VOC 108-10-1 0.07783 0.98317 0.30469 61 53 87 X
Naphthalene SVOC 91-20-3 0.02030 1.83000 0.45615 62 62 100 X
Nickel Metal 7440-02-0 0.00055 0.01040 0.00270 66 62 94 X
o-Xylenes VOC 95-47-6 0.09987 7.51202 1.10306 61 61 100 X
p-Dichlorobenzene VOC 106-46-7 0.12025 0.62529 0.26767 61 25 41 X
Propylene VOC 115-07-1 0.00008 4.457597 1.21776 61 61 100 X
Selenium Metal 7782-49-2 0.00007 0.00224 0.00079 66 58 88 X
Styrene VOC 100-42-5 0.11075 3.02443 0.49924 61 55 90 X
Tetrachloroethylene VOC 127-18-4 0.13565 0.80034 0.29246 61 42 69 X
Toluene VOC 108-88-3 0.13565 105.14158 4.41726 61 61 100 X
Total Chromium Metal 7440-47-3 0.00822 0.02610 0.01397 66 18 27 X
Trichloroethylene VOC 79-01-6 0.11822 0.27944 0.18540 61 8 13 X
Vinyl chloride VOC 75-01-4 0.02812 0.04090 0.03579 61 3 5
1Chemicals that were detected at or above respective detection limits at least once.
2X- Retained as COPC since detected at or above the detection limit in at least 10 percent of the samples

North Birmingham Air Toxics Risk Assessment
62
Table 2.6-3 Chemical Screening Results for the Riggins School Site
Chemical1
Chemical
Type CAS #
Min Conc.
(µg/m3)
Max Conc.
(µg/m3)
Ave Conc.
(µg/m3)
Number of
Valid
Samples
Number of
Detections
(≥1)
Detection
Frequency
(%)
COPC2
1,1-Dichloroethane VOC 75-34-3 0.04250 0.04452 0.04351 65 2 3
1,2,4-Trichlorobenzene VOC 120-82-1 1.16513 1.16513 1.16513 65 1 2
1,2-Dichloroethane VOC 107-06-2 0.06881 0.13660 0.09651 65 47 72 X
1,3-Butadiene VOC 106-99-0 0.02710 0.91978 0.17245 65 63 97 X
Acetonitrile VOC 75-05-8 0.11040 9.04160 0.58497 65 62 95 X
Acrylonitrile VOC 107-13-1 0.11611 0.88113 0.50980 65 5 8
Arsenic Metal 7440-38-2 0.00023 0.01075 0.00233 67 66 99 X
Benzene VOC 71-43-2 0.00023 55.11068 6.09708 65 65 100 X
Benzo(a)anthracene SVOC 56-55-3 0.00006 0.03853 0.00692 71 71 100 X
Benz (a)pyrene SVOC 50-32-8 0.00006 0.02148 0.00417 71 59 83 X
Benzo(b)fluoranthene SVOC 205-99-2 0.00006 0.04710 0.00828 71 71 100 X
Benzo(k)fluoranthene SVOC 207-08-9 0.00005 0.01323 0.00285 71 62 87 X
Beryllium Metal 7440-41-7 0.00001 0.00008 0.00003 67 36 54 X
Bromomethane VOC 74-83-9 0.04271 0.44654 0.07177 65 47 72 X
Cadmium Metal 7440-43-9 0.00005 0.00274 0.00048 67 67 100 X
Carbon Disulfide VOC 75-15-0 0.04515 0.46867 0.13268 65 38 58 X
Carbon Tetrachloride VOC 56-23-5 0.04515 0.96572 0.69313 65 65 100 X
Chlorobenzene VOC 108-90-7 0.09783 11.39396 2.37363 65 5 8
Chloroethane VOC 75-00-3 0.06333 0.35753 0.16360 65 6 9
Chloroform VOC 67-66-3 0.07446 0.25389 0.13321 65 52 80 X
Chloromethane VOC 74-87-3 0.07446 20.63904 1.55923 65 65 100 X
Chrysene VOC 218-01-9 0.00017 0.04620 0.00882 71 71 100 X
Cobalt Metal 7440-48-4 0.00004 0.00067 0.00020 67 67 100 X
Dibenz(a,h)anthracene SVOC 53-70-3 0.00006 0.00469 0.00110 71 52 73 X
Dichloromethane VOC 75-09-2 0.21103 5.47634 0.83461 65 65 100 X

North Birmingham Air Toxics Risk Assessment
63
Chemical1
Chemical
Type CAS #
Min Conc.
(µg/m3)
Max Conc.
(µg/m3)
Ave Conc.
(µg/m3)
Number of
Valid
Samples
Number of
Detections
(≥1)
Detection
Frequency
(%)
COPC2
Ethylbenzene VOC 100-41-4 0.04597 3.60186 0.45773 65 65 100 X
Indeno(1,2,3-cd)pyrene SVOC 193-39-5 0.00006 0.01573 0.00327 71 60 85 X
Lead Metal 7439-92-1 0.00006 0.06730 0.01340 67 67 100 X
m,p-Xylenes VOC
108-38-3,
106-42-3 0.000056 7.18636 1.32945
65 65 100
X
Manganese Metal 7439-96-5 0.00006 0.05760 0.01669 67 67 100 X
Mercury Metal 7439-97-6 0.00002 0.00053 0.00007 67 23 34 X
Methyl Isobutyl Ketone VOC 108-10-1 0.08193 0.43014 0.18016 65 53 82 X
Methyl Methacrylate VOC 80-62-6 0.19245 3.04446 1.61846 65 2 3
Methyl tert-Butyl Ether VOC 1634-04-4 0.06850 0.06850 0.06850 65 1 2
Naphthalene SVOC 91-20-3 0.03430 5.73500 0.87183 71 71 100 X
Nickel Metal 7440-02-0 0.00053 0.01210 0.00274 67 64 96 X
o-Xylenes VOC 95-47-6 0.0966 4.4508 0.57012 65 65 100 X
p-Dichlorobenzene VOC 106-46-7 0.11424 1.27463 0.23328 65 15 23 X
Propylene VOC 115-07-1 0.000077 9.85318 1.23060 65 65 100 X
Selenium Metal 7782-49-2 0.00015 0.00304 0.00103 67 64 96 X
Styrene VOC 100-42-5 0.10756 3.71451 0.64878 65 62 95 X
Tetrachloroethylene VOC 127-18-4 0.12378 2.72320 0.28738 65 31 48 X
Toluene VOC 108-88-3 0.12378 31.80627 3.07301 65 65 100 X
Total Chromium Metal 7440-47-3 0.01030 0.01660 0.01374 67 14 21 X
Trichloroethylene VOC 79-01-6 0.16659 0.53200 0.30362 65 3 5
Vinyl chloride VOC 75-01-4 0.02045 0.08052 0.03579 65 5 8
1Chemicals that were detected at or above respective detection limits at least once.
2X- Retained as COPC since detected at or above the detection limit in at least 10 percent of the samples

North Birmingham Air Toxics Risk Assessment
64
Table 2.6-4 Chemical Screening Results for the Shuttlesworth Station Site
Chemical1
Chemical
Type CAS #
Min Conc.
(µg/m3)
Max Conc.
(µg/m3)
Ave Conc.
(µg/m3)
Number of
Valid
Samples
Number of
Detections
(≥1)
Detection
Frequency
(%)
COPC2
1,1,1-Trichloroethane VOC 71-55-6 0.10912 0.30009 0.18006 60 3 5
1,1-Dichloroethene VOC 75-35-4 0.0555 0.0555 0.0555 60 1 2
1,2-Dichloroethane VOC 107-06-2 0.0648 0.8621 0.1175 60 48 80 X
1,3-Butadiene VOC 106-99-0 0.0310 0.4933 0.1493 60 60 100 X
Acetonitrile VOC 75-05-8 0.0823 0.6061 0.2843 60 54 90 X
Acrylonitrile VOC 107-13-1 0.0760 1.3629 0.8551 60 3 5
Arsenic Metal 7440-38-2 0.0004 0.0075 0.0024 62 60 97 X
Benzene VOC 71-43-2 0.0004 22.7152 4.1336 60 60 100 X
Benzo(a)anthracene SVOC 56-55-3 0.0001 0.0137 0.0033 68 68 100 X
Benzo(a)pyrene SVOC 50-32-8 0.0001 0.0075 0.0017 68 61 90 X
Benzo(b)fluoranthene SVOC 205-99-2 0.0001 0.0153 0.0040 68 68 100 X
Benzo(k)fluoranthene SVOC 207-08-9 0.0001 0.0044 0.0013 68 63 93 X
Beryllium Metal 7440-41-7 0.0000 0.0001 0.0000 62 37 60 X
Bromomethane VOC 74-83-9 0.0388 0.1010 0.0608 60 43 72 X
Cadmium Metal 7440-43-9 0.0000 0.0025 0.0004 62 62 100 X
Carbon Disulfide VOC 75-15-0 0.0436 0.1837 0.0881 60 32 53 X
Carbon Tetrachloride VOC 56-23-5 0.0436 0.9374 0.7136 60 60 100 X
Chloroethane VOC 75-00-3 0.0396 0.0396 0.0396 60 1 2
Chloroform VOC 67-66-3 0.0928 0.8056 0.1753 60 43 72 X
Chloromethane VOC 74-87-3 0.0928 1.7593 1.2081 60 60 100 X
Chloroprene VOC 126-99-8 0.2643 0.2643 0.2643 60 1 2
Chrysene SVOC 218-01-9 0.0003 0.0163 0.0045 68 68 100 X
Cobalt Metal 7440-48-4 0.0001 0.0006 0.0002 62 60 97 X
Dibenz(a,h)anthracene SVOC 53-70-3 0.0001 0.0018 0.0005 68 52 76 X
Dichloromethane VOC 75-09-2 0.1533 23.1698 1.0396 60 60 100 X

North Birmingham Air Toxics Risk Assessment
65
Chemical1
Chemical
Type CAS #
Min Conc.
(µg/m3)
Max Conc.
(µg/m3)
Ave Conc.
(µg/m3)
Number of
Valid
Samples
Number of
Detections
(≥1)
Detection
Frequency
(%)
COPC2
Ethylbenzene VOC 100-41-4 0.0501 1.8454 0.4952 60 60 100 X
Indeno(1,2,3-cd)pyrene SVOC 193-39-5 0.0001 0.0050 0.0014 68 65 96 X
Lead Metal 7439-92-1 0.0001 0.0432 0.0108 62 62 100 X
m,p-Xylenes VOC
108-38-3,
106-42-3 0.00006 7.42518 1.44632
60 60 100
X
Manganese Metal 7439-96-5 0.0001 0.0607 0.0228 62 62 100 X
Mercury Metal 7439-97-6 0.0000 0.0001 0.0001 62 16 26 X
Methyl Isobutyl Ketone VOC 108-10-1 0.0737 0.6800 0.2026 60 50 83 X
Methyl tert-Butyl Ether VOC 1634-04-4 0.0541 0.0541 0.0541 60 1 2
Naphthalene SVOC 91-20-3 0.0465 2.0600 0.6951 68 68 100 X
Nickel Metal 7440-02-0 0.0007 0.0122 0.0030 62 59 95 X
o-Xylenes VOC 95-47-6 0.09553 3.0135 0.6006 60 60 100 X
p-Dichlorobenzene VOC 106-46-7 0.1142 0.7936 0.3000 60 29 48 X
Propylene VOC 115-07-1 0.00006 2.54719 1.012397 60 60 100 X
Selenium Metal 7782-49-2 0.0002 0.0024 0.0009 62 56 90 X
Styrene VOC 100-42-5 0.1108 4.3024 0.7642 60 56 93 X
Tetrachloroethylene VOC 127-18-4 0.1221 0.7393 0.2541 60 32 53 X
Toluene VOC 108-88-3 0.1221 15.5263 2.8899 60 60 100 X
Total Chromium Metal 7440-47-3 0.0097 0.0304 0.0163 62 16 26 X
Trichloroethylene VOC 79-01-6 0.2203 0.2257 0.2230 60 2 3
Vinyl chloride VOC 75-01-4 0.0204 0.0358 0.0275 60 4 7
1Chemicals that were detected at or above respective detection limits at least once.
2X- Retained as COPC since detected at or above the detection limit in at least 10 percent of the samples

North Birmingham Air Toxics Risk Assessment
66
Table 2.6-5 Comparison of Monitoring Sites in the Number of Chemicals of Potential Concern
Monitoring Site
Type and Number of Chemicals Total Number of
COPCs VOCs SVOCs Metals
Total COPCs Total COPCs Total COPCs
Hudson K-8 School 58 20 22 8 11 10 38
Lewis Elementary School 58 20 22 8 11 10 38
Riggins School 58 20 22 7 11 10 37
Shuttlesworth Station 58 19 22 8 11 10 37

North Birmingham Air Toxics Risk Assessment
67
Table 2.6-6 Comparison of Monitoring Sites in Maximum Concentrations and Detection Frequency for COPCs
Chemical Maximum Concentration (µg/m3)
1 Detection Frequency (%)
Name Type CAS # HEAL LEAL RSAL SLOSS HEAL LEAL RSAL SLOSS
1,2-Dichloroethane VOC 107-06-2 0.22666 0.14975 0.13660 0.8621 72 75 72 80
1,3-Butadiene VOC 106-99-0 0.64157 0.60618 0.91978 0.4933 100 98 97 100
Acetonitrile VOC 75-05-8 3.59313 1.44565 9.04160 0.6061 97 92 95 90
Arsenic Metal 7440-38-2 0.00400 0.00465 0.01075 0.0075 100 100 99 97
Benzene VOC 71-43-2 21.88453 20.44686 55.11068 22.7152 100 100 100 100
Benzo(a)anthracene SVOC 56-55-3 0.01610 0.03010 0.03853 0.0137 91 94 100 100
Benzo(a)pyrene SVOC 50-32-8 0.00955 0.01530 0.02148 0.0075 69 68 83 90
Benzo(b)fluoranthene SVOC 205-99-2 0.01930 0.03190 0.04710 0.0153 100 98 100 100
Benzo(k)fluoranthene SVOC 207-08-9 0.00545 0.01060 0.01323 0.0044 75 73 87 93
Beryllium Metal 7440-41-7 0.00008 0.00008 0.00008 0.0001 56 56 54 60
Bromomethane VOC 74-83-9 0.14755 0.10096 0.44654 0.1010 70 70 72 72
Cadmium Metal 7440-43-9 0.00779 0.00668 0.00274 0.0025 100 100 100 100
Carbon Disulfide VOC 75-15-0 0.27092 0.19930 0.46867 0.1837 42 41 58 53
Carbon Tetrachloride VOC 56-23-5 0.89966 0.98774 0.96572 0.9374 100 100 100 100
Chloroform VOC 67-66-3 0.28807 0.30272 0.25389 0.8056 72 67 80 72
Chloromethane VOC 74-87-3 1.76139 1.86670 20.63904 1.7593 100 100 100 100
Chrysene SVOC 218-01-9 0.01660 0.03150 0.04620 0.0163 100 100 100 100
Cobalt Metal 7440-48-4 0.00122 0.00056 0.00067 0.0006 100 100 100 97
Dibenz(a,h)anthracene SVOC 53-70-3 0.00225 0.00349 0.00469 0.0018 57 44 73 76
Dichloromethane VOC 75-09-2 4.82849 3.34173 5.47634 23.1698 100 100 100 100
Ethylbenzene VOC 100-41-4 1.81070 4.47247 3.60186 1.8454 100 100 100 100
Indeno(1,2,3-cd)pyrene SVOC 193-39-5 0.00712 0.00987 0.01573 0.0050 78 74 85 96
Lead Metal 7439-92-1 1.13000 0.83500 0.06730 0.0432 100 100 100 100
m,p-Xylenes VOC
108-38-3,
106-42-3 6.60411 0.83500 7.18636 7.42518 100 100 100 100
Manganese Metal 7439-96-5 0.11700 0.16500 0.05760 0.0607 100 100 100 100

North Birmingham Air Toxics Risk Assessment
68
Chemical Maximum Concentration (µg/m3)
1 Detection Frequency (%)
Name Type CAS # HEAL LEAL RSAL SLOSS HEAL LEAL RSAL SLOSS
Mercury Metal 7439-97-6 0.00028 0.00009 0.00053 0.0001 32 29 34 26
Methyl Isobutyl Ketone VOC 108-10-1 0.51616 0.98317 0.43014 0.6800 90 87 82 83
Naphthalene SVOC 91-20-3 2.02000 1.83000 5.73500 2.0600 100 100 100 100
Nickel Metal 7440-02-0 0.01260 0.01040 0.01210 0.0122 95 94 96 95
o-Xylenes VOC 95-47-6 2.84849 7.51202 4.4508 3.0135 100 100 100 100
p-Dichlorobenzene VOC 106-46-7 0.94395 0.62529 1.27463 0.7936 47 41 23 48
Propylene VOC 115-07-1 4.0617 4.457597 9.85318 2.5472 100 100 100 100
Selenium Metal 7782-49-2 0.00223 0.00224 0.00304 0.0024 90 88 96 90
Styrene VOC 100-42-5 4.43015 3.02443 3.71451 4.3024 93 90 95 93
Tetrachloroethylene VOC 127-18-4 0.83426 0.80034 2.72320 0.7393 48 69 48 53
Toluene VOC 108-88-3 27.43479 105.14158 31.80627 15.5263 100 100 100 100
Total Chromium Metal 7440-47-3 0.01780 0.02610 0.0166 0.0304 29 27 21 26
Trichloroethylene VOC 79-01-6 0.24719 0.27944 -2 - 10 13 - -
1HEAL = Hudson K-8 School site; LEAL = Lewis Elementary School site; RSAL = Riggins School site; and SLOSS = Shuttlesworth Station site
2 Not detected

North Birmingham Air Toxics Risk Assessment
69
Table 3.1-1 Statistical Summary of Concentrations for the Hudson K-8 School Air Monitor (µg/m3)
1
Chemical Number of
Valid Samples Min Max Mean Median
Standard Deviation
95UCL Type of Distribution
1,2-Dichloroethane 60 0.01820 0.22700 0.07370 0.07890 0.04110 0.09680 NDD2
1,3-Butadiene 60 0.02650 0.64200 0.13900 0.08850 0.14100 0.16700 Lognormal
Acetonitrile 60 0.06130 3.59300 0.37600 0.28100 0.55300 0.68800 NDD
Arsenic 63 0.00026 0.00400 0.00151 0.00121 0.00092 0.00177 Lognormal
Benzene 60 0.36100 21.88000 3.44200 1.36600 5.30800 6.42900 NDD
Benzo(a)anthracene 68 0.00003 0.01610 0.00210 0.00063 0.00325 0.00576 Lognormal
Benzo(a)pyrene 68 0.00003 0.00955 0.00108 0.00030 0.00178 0.00202 NDD
Benzo(b)fluoranthene 68 0.00006 0.01930 0.00280 0.00100 0.00404 0.00493 NDD
Benzo(k)fluoranthene 68 0.00002 0.00545 0.00081 0.00027 0.00119 0.00144 NDD
Beryllium 63 0.00001 0.00008 0.00002 0.00001 0.00001 0.00002 NDD
Bromomethane 60 0.01750 0.14800 0.04930 0.05050 0.02610 0.06400 NDD
Cadmium 63 0.00008 0.00779 0.00089 0.00026 0.00155 0.00174 NDD
Carbon Disulfide 60 0.02180 0.27100 0.05950 0.05140 0.04260 0.08350 NDD
Carbon Tetrachloride 60 0.52200 0.90000 0.70000 0.69800 0.09460 0.72000 Lognormal
Chloroform 60 0.02200 0.28800 0.11800 0.11700 0.07170 0.15800 NDD
Chloromethane 60 0.94400 1.76100 1.22300 1.22900 0.16200 1.25800 Lognormal
Chrysene 68 0.00013 0.01660 0.00289 0.00115 0.00386 0.00493 NDD
Cobalt 63 0.00005 0.00122 0.00024 0.00020 0.00021 0.00028 Gamma
Dibenz(a,h)anthracene 68 0.00002 0.00225 0.00027 0.00008 0.00043 0.00049 NDD
Dichloromethane 60 0.28100 4.82800 0.77200 0.50900 0.72600 1.18000 NDD
Ethylbenzene 60 0.10900 1.81100 0.51100 0.41500 0.37500 0.59500 Lognormal
Hexavalent Chromium 63 0.00004 0.00018 0.00011 0.00012 0.00004 0.00012 Lognormal
Indeno(1,2,3-cd)pyrene 68 0.00003 0.00712 0.00096 0.00032 0.00147 0.00173 NDD
m,p-Xylene 60 0.26100 6.90400 1.49100 1.06600 1.33200 1.77900 Lognormal
Manganese 63 0.00229 0.11700 0.03090 0.02170 0.02700 0.03720 Gamma

North Birmingham Air Toxics Risk Assessment
70
Chemical Number of
Valid Samples Min Max Mean Median
Standard Deviation
95UCL Type of Distribution
Mercury 63 0.00001 0.00028 0.00003 0.00003 0.00004 0.00006 NDD
Methyl Isobutyl Ketone 60 0.04510 0.51600 0.19600 0.16200 0.12300 0.22400 Gamma
Naphthalene 68 0.03750 2.02000 0.48400 0.30900 0.47200 0.58700 Gamma
Nickel 63 0.00055 0.01260 0.00226 0.00200 0.00176 0.00258 Gamma
o-Xylene 60 0.10900 2.84800 0.62600 0.45400 0.52500 0.73900 Lognormal
p-Dichlorobenzene 60 0.05710 0.94400 0.19000 0.10500 0.18600 0.29500 NDD
Propylene 60 0.24600 4.06200 0.95300 0.69200 0.76600 1.08800 Lognormal
Selenium 63 0.00003 0.00223 0.00081 0.00080 0.00047 0.00091 Lognormal
Styrene 60 0.04690 4.43000 0.59400 0.22800 0.90000 1.10000 NDD
Tetrachloroethylene 60 0.06100 0.83400 0.15700 0.06780 0.14400 0.23800 NDD
Toluene 60 0.52800 27.43000 3.24400 1.85400 4.37100 3.77900 Lognormal
Trichloroethylene 60 0.05910 0.24700 0.07340 0.05910 0.03690 0.08140 Lognormal
1All statistical parameters were determined using ProUCL vers. 4.1. Software. Samples with non-detects or detected a concentrations lower that their respective detection
limits were assigned 1/2 the detection limit before the ProUCL analysis. Therefore, the minimum concentration value for some chemicals in this table may be the 1/2
detection limit.
2 NDD = No discernable distribution. Data do not fit a given distribution at 5% significant level. In this case, ProUCL uses non-parametric approaches to calculate the
95UCL value.

North Birmingham Air Toxics Risk Assessment
71
Table 3.1-2 Statistical Summary of Concentrations for the Lewis Elementary School Air Monitor (µg/m3)
1
Chemical Number of Valid
Samples Min Max Mean Median
Standard Deviation
95UCL Type of Distribution
1,2-Dichloroethane 61 0.01820 0.15000 0.08180 0.09310 0.03950 0.10400 NDD2
1,3-Butadiene 61 0.00774 0.60600 0.15200 0.10800 0.14000 0.19400 Lognormal
Acetonitrile 61 0.06130 1.44600 0.31000 0.29900 0.23900 0.44300 NDD
Arsenic 66 0.00017 0.00465 0.00146 0.00106 0.00108 0.00178 Lognormal
Benzene 61 0.37400 20.45000 2.89000 1.01900 3.89500 5.06400 NDD
Benzo(a)anthracene 62 0.00002 0.03010 0.00270 0.00037 0.00587 0.00594 NDD
Benzo(a)pyrene 62 0.00003 0.01530 0.00145 0.00016 0.00316 0.00320 NDD
Benzo(b)fluoranthene 62 0.00003 0.03190 0.00331 0.00048 0.00654 0.00694 NDD
Benzo(k)fluoranthene 62 0.00002 0.01060 0.00104 0.00015 0.00214 0.00222 NDD
Beryllium 66 0.00001 0.00008 0.00002 0.00001 0.00001 0.00003 NDD
Bromomethane 61 0.01750 0.10100 0.04850 0.05050 0.02230 0.06090 NDD
Cadmium 66 0.00004 0.00668 0.00072 0.00033 0.00105 0.00092 Lognormal
Carbon Disulfide 61 0.02180 0.19900 0.05920 0.05140 0.04050 0.08180 NDD
Carbon Tetrachloride 61 0.30800 0.98800 0.71500 0.72400 0.11500 0.73900 Lognormal
Chloroform 61 0.02200 0.30300 0.11200 0.11700 0.07240 0.15300 NDD
Chloromethane 61 0.96000 1.86700 1.26400 1.21200 0.23500 1.31300 Gamma
Chrysene 62 0.00011 0.03150 0.00346 0.00069 0.00650 0.00705 NDD
Cobalt 66 0.00004 0.00056 0.00020 0.00017 0.00013 0.00022 Gamma
Dibenz(a,h)anthracene 62 0.00002 0.00349 0.00033 0.00003 0.00071 0.00073 NDD
Dichloromethane 61 0.25400 3.34200 0.74300 0.63900 0.49100 0.83700 Gamma
Ethylbenzene 61 0.10900 4.47200 0.86200 0.49900 0.85500 1.08000 Lognormal
Hexavalent Chromium 66 0.00004 0.00026 0.00011 0.00012 0.00004 0.00012 Lognormal
Indeno(1,2,3-cd)pyrene 62 0.00003 0.00987 0.00111 0.00017 0.00217 0.00230 Lognormal
m,p-Xylene 61 0.24300 19.67000 2.92100 1.45900 3.54700 3.87700 Lognormal
Manganese 66 0.00256 0.16500 0.03420 0.02120 0.03240 0.04610 Lognormal
Mercury 66 0.00001 0.00009 0.00003 0.00003 0.00001 0.00003 Lognormal
Methyl Isobutyl Ketone 61 0.03070 0.98300 0.27000 0.24600 0.19500 0.31900 Gamma

North Birmingham Air Toxics Risk Assessment
72
Chemical Number of Valid
Samples Min Max Mean Median
Standard Deviation
95UCL Type of Distribution
Naphthalene 62 0.02030 1.83000 0.45600 0.27000 0.48800 0.65800 Lognormal
Nickel 66 0.00055 0.01040 0.00257 0.00209 0.00190 0.00296 Gamma
o-Xylene 61 0.09990 7.51200 1.10300 0.61700 1.27600 1.81500 NDD
p-Dichlorobenzene 61 0.05710 0.62500 0.15600 0.10500 0.12200 0.22400 NDD
Propylene 61 0.31300 4.45800 1.21800 0.87300 0.92700 1.42500 Lognormal
Selenium 66 0.00003 0.00224 0.00071 0.00070 0.00043 0.00080 Lognormal
Styrene 61 0.04690 3.02400 0.45500 0.23400 0.58000 0.77900 NDD
Tetrachloroethylene 61 0.06100 0.80000 0.22200 0.17600 0.17000 0.31700 NDD
Toluene 61 0.48200 105.10000 4.41700 1.92200 13.29000 4.27300 Lognormal
Trichloroethylene 61 0.05910 0.27900 0.07860 0.05910 0.04730 0.08870 Lognormal
1All statistical parameters were determined using ProUCL vers. 4.1. Software. Samples with non-detects or detected a concentrations lower that their respective detection
limits were assigned 1/2 the detection limit before the ProUCL analysis. Therefore, the minimum concentration value for some chemicals in this table may be the 1/2
detection limit.
2 NDD = No discernable distribution. Data do not fit a given distribution at 5% significant level. In this case, ProUCL uses non-parametric approaches to calculate the
95UCL value.

North Birmingham Air Toxics Risk Assessment
73
Table 3.1-3 Statistical Summary of Concentrations for the Riggins School Air Monitor (µg/m3)
1
Chemical Number of Valid
Samples Min Max Mean Median
Standard Deviation
95UCL Type of Distribution
1,2-Dichloroethane 65 0.01820 0.13700 0.07480 0.08900 0.03790 0.09530 NDD2
1,3-Butadiene 65 0.00774 0.92000 0.16700 0.11000 0.17600 0.20300 Gamma
Acetonitrile 65 0.06130 9.04200 0.56100 0.28300 1.52200 1.38400 NDD
Arsenic 67 0.00008 0.01080 0.00230 0.00170 0.00207 0.00274 Gamma
Benzene 65 0.35100 55.11000 6.09700 2.76800 9.25800 8.59500 Lognormal
Benzo(a)anthracene 71 0.00006 0.03850 0.00692 0.00315 0.00898 0.00922 Gamma
Benzo(a)pyrene 71 0.00003 0.02150 0.00347 0.00161 0.00506 0.00478 Gamma
Benzo(b)fluoranthene 71 0.00010 0.04710 0.00828 0.00388 0.01070 0.01100 Gamma
Benzo(k)fluoranthene 71 0.00002 0.01320 0.00250 0.00118 0.00328 0.00334 Gamma
Beryllium 67 0.00001 0.00008 0.00002 0.00002 0.00002 0.00003 NDD
Bromomethane 65 0.01750 0.44700 0.05780 0.05240 0.05630 0.08820 NDD
Cadmium 67 0.00005 0.00274 0.00048 0.00032 0.00054 0.00057 Lognormal
Carbon Disulfide 65 0.02180 0.46900 0.09480 0.05450 0.08710 0.14200 NDD
Carbon Tetrachloride 65 0.53000 0.96600 0.69300 0.68700 0.09370 0.71300 Lognormal
Chloroform 65 0.02200 0.25400 0.11200 0.11600 0.05470 0.14200 NDD
Chloromethane 65 0.92600 20.64000 1.55900 1.18700 2.42300 2.06100 Lognormal
Chrysene 71 0.00017 0.04620 0.00882 0.00436 0.01070 0.01140 Gamma
Cobalt 67 0.00004 0.00067 0.00020 0.00017 0.00014 0.00023 Gamma
Dibenz(a,h)anthracene 71 0.00002 0.00469 0.00081 0.00036 0.00114 0.00140 NDD
Dichloromethane 65 0.21100 5.47600 0.83500 0.55400 0.79100 1.26200 NDD
Ethylbenzene 65 0.10500 3.60200 0.45800 0.33900 0.48200 0.51000 Lognormal
Hexavalent Chromium 67 0.00004 0.00017 0.00011 0.00012 0.00004 0.00012 Lognormal
Indeno(1,2,3-cd)pyrene 71 0.00003 0.01570 0.00277 0.00123 0.00383 0.00374 Gamma
m,p-Xylene 65 0.25100 7.18600 1.32900 0.94700 1.30300 1.56400 Gamma
Manganese 67 0.00247 0.05760 0.01670 0.01390 0.01250 0.01950 Gamma
Mercury 67 0.00001 0.00053 0.00004 0.00003 0.00007 0.00008 NDD

North Birmingham Air Toxics Risk Assessment
74
Chemical Number of Valid
Samples Min Max Mean Median
Standard Deviation
95UCL Type of Distribution
Methyl Isobutyl Ketone 65 0.03070 0.43000 0.15500 0.12300 0.09240 0.17600 Gamma
Naphthalene 71 0.03430 5.73500 0.87200 0.58000 0.97100 1.08100 Gamma
Nickel 67 0.00053 0.01210 0.00264 0.00234 0.00175 0.00299 Gamma
o-Xylene 65 0.09660 4.45100 0.57000 0.40200 0.64300 0.65200 Lognormal
p-Dichlorobenzene 65 0.05710 1.27500 0.11800 0.10500 0.15200 0.20000 NDD
Propylene 65 0.21500 9.85300 1.23100 0.92700 1.31900 1.39900 Lognormal
Selenium 67 0.00003 0.00304 0.00099 0.00087 0.00064 0.00112 Lognormal
Styrene 65 0.04690 3.71500 0.62100 0.33900 0.70800 0.82000 Lognormal
Tetrachloroethylene 65 0.06100 2.72300 0.17100 0.06780 0.33400 0.35200 NDD
Toluene 65 0.55200 31.81000 3.07300 2.10700 4.40700 3.54500 Lognormal
1All statistical parameters were determined using ProUCL vers. 4.1. Software. Samples with non-detects or detected a concentrations lower that their respective detection
limits were assigned 1/2 the detection limit before the ProUCL analysis. Therefore, the minimum concentration value for some chemicals in this table may be the 1/2
detection limit.
2 NDD = No discernable distribution. Data do not fit a given distribution at 5% significant level. In this case, ProUCL uses non-parametric approaches to calculate the
95UCL value.

North Birmingham Air Toxics Risk Assessment
75
Table 3.1-4 Statistical Summary of Concentrations for the Shuttlesworth Station Air Monitor (µg/m3)
1
Chemical
Number of
Valid Samples Min Max Mean Median
Standard Deviation
95UCL Type of Distribution
1,2-Dichloroethane 60 0.01820 0.86200 0.09790 0.09710 0.10700 0.15800 NDD2
1,3-Butadiene 60 0.03100 0.49300 0.14900 0.11800 0.10900 0.17400 Gamma
Acetonitrile 60 0.06130 0.60600 0.26200 0.26900 0.12700 0.28900 Lognormal
Arsenic 62 0.00008 0.00745 0.00236 0.00211 0.00163 0.00270 Lognormal
Benzene 60 0.52100 22.72000 4.13400 2.51600 4.83700 5.12500 Gamma
Benzo(a)anthracene 68 0.00006 0.01370 0.00333 0.00235 0.00329 0.00422 Gamma
Benzo(a)pyrene 68 0.00003 0.00753 0.00157 0.00102 0.00171 0.00203 Gamma
Benzo(b)fluoranthene 68 0.00010 0.01530 0.00405 0.00321 0.00373 0.00506 Gamma
Benzo(k)fluoranthene 68 0.00002 0.00438 0.00121 0.00088 0.00115 0.00153 Gamma
Beryllium 62 0.00001 0.00009 0.00002 0.00002 0.00002 0.00003 NDD
Bromomethane 60 0.01750 0.10100 0.04950 0.05050 0.02200 0.06190 NDD
Cadmium 62 0.00002 0.00246 0.00042 0.00024 0.00044 0.00067 NDD
Carbon Disulfide 59 0.02180 0.18400 0.06730 0.05140 0.03780 0.08870 NDD
Carbon Tetrachloride 60 0.47200 0.93700 0.71400 0.73600 0.10400 0.73600 Lognormal
Chloroform 60 0.02200 0.80600 0.13400 0.12500 0.11400 0.19800 NDD
Chloromethane 60 0.92500 1.75900 1.20800 1.15900 0.18300 1.24700 Gamma
Hexavalent Chromium 62 0.00406 0.03040 0.01170 0.01210 0.00494 0.01280 Lognormal
Chrysene 68 0.00026 0.01630 0.00452 0.00374 0.00398 0.00554 Gamma
Cobalt 62 0.00001 0.00059 0.00021 0.00019 0.00013 0.00024 Lognormal
Dibenz (a,h) anthracene 68 0.00002 0.00176 0.00039 0.00026 0.00040 0.00060 NDD
Dichloromethane 60 0.26400 23.17000 1.04000 0.55800 2.93100 2.68900 NDD
Ethylbenzene 60 0.09990 1.84500 0.49500 0.36700 0.35500 0.58300 Lognormal
Hexavalent Chromium 62 0.00004 0.00030 0.00012 0.00012 0.00005 0.00013 NDD
Indeno(1,2,3-cd)pyrene 68 0.00003 0.00498 0.00135 0.00097 0.00131 0.00171 Gamma
m,p-Xylene 60 0.22600 7.42500 1.44600 1.01400 1.29700 1.70900 Gamma
Manganese 62 0.00050 0.06070 0.02280 0.02240 0.01430 0.02590 Lognormal
Mercury 62 0.00001 0.00014 0.00003 0.00003 0.00002 0.00004 NDD

North Birmingham Air Toxics Risk Assessment
76
Chemical
Number of
Valid Samples Min Max Mean Median
Standard Deviation
95UCL Type of Distribution
Methyl Isobutyl Ketone 60 0.03070 0.68000 0.17500 0.15000 0.12500 0.20500 Gamma
Naphthalene 68 0.04650 2.06000 0.69500 0.49900 0.52600 0.82500 Gamma
Nickel 62 0.00057 0.01220 0.00287 0.00197 0.00223 0.00344 Lognormal
o-Xylene 60 0.09550 3.01300 0.60100 0.44300 0.51500 0.70400 Gamma
p-Dichlorobenzene 60 0.05710 0.79400 0.18600 0.10500 0.16300 0.27800 NDD
Propylene 60 0.34400 2.54700 1.01200 0.83100 0.59900 1.14700 Gamma
Selenium 62 0.00003 0.00236 0.00085 0.00081 0.00051 0.00096 Lognormal
Styrene 60 0.04690 4.30200 0.71700 0.30500 0.97000 0.99900 Lognormal
Tetrachloroethylene 60 0.06100 0.73900 0.16600 0.13600 0.14100 0.24600 NDD
Toluene 60 0.52800 15.53000 2.89000 1.99400 2.54600 3.41100 Gamma
1All statistical parameters were determined using ProUCL vers. 4.1. Software. Samples with non-detects or detected a concentrations lower that their respective detection
limits were assigned 1/2 the detection limit before the ProUCL analysis. Therefore, the minimum concentration value for some chemicals in this table may be the 1/2
detection limit.
2 NDD = No discernable distribution. Data do not fit a given distribution at 5% significant level. In this case, ProUCL uses non-parametric approaches to calculate the
95UCL value.

North Birmingham Air Toxics Risk Assessment
77
Table 5.1.1-1 Cancer Risks for the Hudson K-8 School Site Chemicals of Potential Concern
Chemical CAS #
Median
Conc.
(µg/m3)
95UCL Conc.
(µg/m3)
IUR
(1/µg/m3)
EPA
WOE Source
IARC
WOE
95UCL
Risk
%
Risk
Cumulative
% Risk
Benzene 71-43-2 1.366 6.429 7.8E-06 CH IRIS 1 5.E-05 47.27% 47.27%
Naphthalene 91-20-3 0.309 0.587 3.4E-05 C CAL 2.E-05 18.81% 66.08%
Arsenic 7440-38-2 0.00121 0.00177 4.3E-03 A IRIS 1 8.E-06 7.17% 73.26%
1,3-Butadiene 106-99-0 0.0885 0.167 3.0E-05 CH IRIS 1 5.E-06 4.72% 77.98%
Carbon Tetrachloride 56-23-5 0.698 0.72 6.0E-06 LH IRIS 2B 4.E-06 4.07% 82.05%
Benzo (a) pyrene1 50-32-8 0.000302 0.00202 1.8.E-03 B2 CAL 1 4.E-06 3.47% 85.52%
p-Dichlorobenzene 106-46-7 0.105 0.295 1.1E-05 C CAL 2B 3.E-06 3.06% 88.58%
Cadmium 7440-43-9 0.00026 0.00174 1.8E-03 B1 IRIS 1 3.E-06 2.95% 91.54%
1,2-Dichloroethane 107-06-2 0.0789 0.0968 2.6E-05 B2 IRIS 2B 3.E-06 2.37% 93.91%
Ethylbenzene 100-41-4 0.415 0.595 2.5E-06 D CAL 2B 1.E-06 1.40% 95.31%
Hexavalent Chromium2 7440-47-3 0.0121 0.0122 1.2E-04 CH IRIS 1 1.E-06 1.38% 96.69%
Benzo (a) anthracene1 56-55-3 0.0006335 0.00576 1.8E-04 B2 CAL 2B 1.E-06 0.99% 97.68%
Dibenz (a,h) anthracene1 53-70-3 0.00007945 0.00049492 2.0E-03 B2 CAL 2A 1.E-06 0.93% 98.61%
Benzo (b) fluoranthene 205-99-2 0.001 0.00493 1.1E-04 B2 CAL 2B 5.E-07 0.51% 99.12%
Trichloroethylene1 79-01-6 0.0591 0.0814 4.8.E-06 CH IRIS 2A 4.E-07 0.37% 99.49%
Indeno(1,2,3-cd)pyrene 193-39-5 0.000316 0.00173 1.1E-04 B2 CAL 2B 2.E-07 0.18% 99.67%
Benzo (k) fluoranthene 207-08-9 0.0002725 0.00144 1.1E-04 B2 CAL 2B 2.E-07 0.15% 99.82%
Tetrachloroethylene 127-18-4 0.0678 0.238 2.6E-07 LH IRIS 2A 6.E-08 0.06% 99.87%
Beryllium 7440-41-7 0.00001 0.000024525 2.4E-03 LH IRIS 1 6.E-08 0.06% 99.93%
Chrysene 218-01-9 0.00115 0.00493 1.1E-05 B2 CAL 2B 5.E-08 0.05% 99.98%
Dichloromethane1 75-09-2 0.509 1.18 1.7.E-08 LH IRIS 2B 2.E-08 0.02% 100.00%
Total 1.E-04 1Chemicals that are carcinogenic by a mutagenic mode of action and for which data on early life susceptibility are not available. The IURs for these chemicals, except
trichloroethylene, were adjusted for to include ages younger than 16 years using age-specific default adjustment factors (See Section 5.1.1). For trichloroethylene, we used
a recently IRIS-published adjusted IUR (EPA, 2011).
2Estimated from total chromium; See Section 4.3.

North Birmingham Air Toxics Risk Assessment
78
Table 5.1.1-2 Cancer Risks for the Lewis Elementary School Site Chemicals of Potential Concern
Chemical CAS # Median Conc.
(µg/m3)
95UCL Conc.
(µg/m3)
IUR
(1/µg/m3)
EPA WOE Source IARC
WOE
95UCL
Risk % Risk
Cumulative
% Risk
Benzene 71-43-2 1.019 5.064 7.8.E-06 CH IRIS 1 4.E-05 39.09% 39.09%
Naphthalene 91-20-3 0.27 0.658 3.4.E-05 C CAL 2.E-05 22.14% 61.23%
Arsenic 7440-38-2 0.00106 0.00178 4.3.E-03 A IRIS 1 8.E-06 7.57% 68.81%
Benzo (a) pyrene1 50-32-8 0.0001615 0.0032 1.8.E-03 B2 CAL 1 6.E-06 5.77% 74.58%
1,3-Butadiene 106-99-0 0.108 0.194 3.0.E-05 CH IRIS 1 6.E-06 5.76% 80.34%
Carbon Tetrachloride 56-23-5 0.724 0.739 6.0.E-06 LH IRIS 2B 4.E-06 4.39% 84.73%
1,2-Dichloroethane 107-06-2 0.0931 0.104 2.6.E-05 B2 IRIS 2B 3.E-06 2.68% 87.40%
Ethylbenzene 100-41-4 0.499 1.08 2.5.E-06 D CAL 2B 3.E-06 2.67% 90.08%
p-Dichlorobenzene 106-46-7 0.105 0.224 1.1.E-05 C CAL 2B 2.E-06 2.44% 92.51%
Cadmium 7440-43-9 0.00033 0.00092137 1.8.E-03 B1 IRIS 1 2.E-06 1.64% 94.16%
Hexavalent Chromium2 7440-47-3 0.0121 0.0121 1.2.E-04 CH IRIS 1 1.E-06 1.44% 95.59%
Dibenz (a,h) anthracene1 53-70-3 0.000034825 0.00072914 2.0.E-03 B2 CAL 2A 1.E-06 1.43% 97.03%
Benzo (a) anthracene1 56-55-3 0.000372 0.00594 1.8.E-04 B2 CAL 2B 1.E-06 1.07% 98.10%
Benzo (b) fluoranthene 205-99-2 0.000477 0.00694 1.1.E-04 B2 CAL 2B 8.E-07 0.76% 98.85%
Trichloroethylene1 79-01-6 0.0591 0.0887 4.8.E-06 CH IRIS 2A 4.E-07 0.42% 99.28%
Indeno(1,2,3-cd)pyrene 193-39-5 0.000165 0.0023 1.1.E-04 B2 CAL 2B 3.E-07 0.25% 99.53%
Benzo (k) fluoranthene 207-08-9 0.0001515 0.00222 1.1.E-04 B2 CAL 2B 2.E-07 0.24% 99.77%
Tetrachloroethylene 127-18-4 0.176 0.317 2.6.E-07 LH IRIS 2A 8.E-08 0.08% 99.85%
Chrysene 218-01-9 0.000693 0.00705 1.1.E-05 B2 CAL 2B 8.E-08 0.08% 99.93%
Beryllium 7440-41-7 0.00001 0.000025216 2.4.E-03 LH IRIS 1 6.E-08 0.06% 99.99%
Dichloromethane1 75-09-2 0.639 0.837 1.7.E-08 LH IRIS 2B 1.E-08 0.01% 100.00%
Total 1.E-04 1Chemicals that are carcinogenic by a mutagenic mode of action and for which data on early life susceptibility are not available. The IURs for these chemicals, except
trichloroethylene, were adjusted for to include ages younger than 16 years using age-specific default adjustment factors (See Section 5.1.1). For trichloroethylene, we used
a recently IRIS-published adjusted IUR (EPA, 2011).
2Estimated from total chromium; See Section 4.3.

North Birmingham Air Toxics Risk Assessment
79
Table 5.1.1-3 Cancer Risks for the Riggins School Site Chemicals of Potential Concern
Chemical CAS # Median Conc.
(µg/m3)
95UCL Conc.
(µg/m3)
IUR
(1/µg/m3)
EPA
WOE Source
IARC
WOE
95UCL
Risk
%
Risk
Cumulative
% Risk
Benzene 71-43-2 2.768 8.595 7.8.E-06 CH IRIS 1 7.E-05 44.76% 44.76%
Naphthalene 91-20-3 0.58 1.081 3.4.E-05 C CAL 4.E-05 24.54% 69.30%
Arsenic 7440-38-2 0.0017 0.00274 4.3.E-03 A IRIS 1 1.E-05 7.87% 77.16%
Benzo (a) pyrene1 50-32-8 0.00161 0.00478 1.8.E-03 B2 CAL 1 9.E-06 5.82% 82.98%
1,3-Butadiene 106-99-0 0.11 0.203 3.0.E-05 CH IRIS 1 6.E-06 4.07% 87.05%
Carbon Tetrachloride 56-23-5 0.687 0.713 6.0.E-06 LH IRIS 2B 4.E-06 2.86% 89.90%
Dibenz (a,h) anthracene1 53-70-3 0.00036 0.0014 2.0.E-03 B2 CAL 2A 3.E-06 1.86% 91.76%
1,2-Dichloroethane 107-06-2 0.089 0.0953 2.6.E-05 B2 IRIS 2B 2.E-06 1.65% 93.41%
p-Dichlorobenzene 106-46-7 0.105 0.2 1.1.E-05 C CAL 2B 2.E-06 1.47% 94.88%
Benzo (a) anthracene1 56-55-3 0.00315 0.00922 1.8.E-04 B2 CAL 2B 2.E-06 1.12% 96.01%
Hexavalent Chromium2 7440-47-3 0.0121 0.0115 1.2.E-04 CH IRIS 1 1.E-06 0.92% 96.93%
Ethylbenzene 100-41-4 0.339 0.51000 2.5.E-06 D CAL 2B 1.E-06 0.85% 97.78%
Benzo (b) fluoranthene 205-99-2 0.00388 0.011 1.1.E-04 B2 CAL 2B 1.E-06 0.81% 98.59%
Cadmium 7440-43-9 0.00032 0.00056533 1.8.E-03 B1 IRIS 1 1.E-06 0.68% 99.27%
Indeno(1,2,3-cd)pyrene 193-39-5 0.00123 0.00374 1.1.E-04 B2 CAL 2B 4.E-07 0.27% 99.54%
Benzo (k) fluoranthene 207-08-9 0.00118 0.00334 1.1.E-04 B2 CAL 2B 4.E-07 0.25% 99.79%
Chrysene 218-01-9 0.00436 0.0114 1.1.E-05 B2 CAL 2B 1.E-07 0.08% 99.87%
Tetrachloroethylene 127-18-4 0.06780 0.352000 2.6.E-07 LH IRIS 2A 9.E-08 0.06% 99.93%
Beryllium 7440-41-7 0.000015 0.000032505 2.4.E-03 LH IRIS 1 8.E-08 0.05% 99.98%
Dichloromethane1 75-09-2 0.554 1.262 2.1.E-08 LH IRIS 2B 3.E-08 0.02% 100.00%
Total 1.E-04 1Chemicals that are carcinogenic by a mutagenic mode of action and for which data on early life susceptibility are not available. The IURs for these chemicals, except
trichloroethylene, were adjusted for to include ages younger than 16 years using age-specific default adjustment factors (See Section 5.1.1). For trichloroethylene, we used
a recently IRIS-published adjusted IUR (EPA, 2011).
2Estimated from total chromium; See Section 4.3.

North Birmingham Air Toxics Risk Assessment
80
Table 5.1.1-4 Cancer Risks for the Shuttlesworth Station Site Chemicals of Potential Concern
Chemical CAS # Median Conc.
(µg/m3)
95UCL Conc.
(µg/m3)
IUR
(1/µg/m3)
EPA
WOE Source
IARC
WOE
95UCL
Risk
%
Risk
Cumulative
% Risk
Benzene 71-43-2 2.516 5.125 7.8.E-06 CH IRIS 1 4.E-05 37.20% 37.20%
Naphthalene 91-20-3 0.499 0.825 3.4.E-05 C CAL 3.E-05 26.10% 63.31%
Arsenic 7440-38-2 0.00211 0.0027 4.3.E-03 A IRIS 1 1.E-05 10.80% 74.11%
1,3-Butadiene 106-99-0 0.118 0.174 3.0.E-05 CH IRIS 1 5.E-06 4.86% 78.97%
Carbon Tetrachloride 56-23-5 0.736 0.736 6.0.E-06 LH IRIS 2B 4.E-06 4.11% 83.08%
1,2-Dichloroethane 107-06-2 0.0971 0.158 2.6.E-05 B2 IRIS 2B 4.E-06 3.82% 86.90%
Benzo (a) pyrene1 50-32-8 0.00102 0.00203 1.8.E-03 B2 CAL 1 4.E-06 3.44% 90.35%
p-Dichlorobenzene 106-46-7 0.105 0.278 1.1.E-05 C CAL 2B 3.E-06 2.85% 93.19%
Hexavalent Chromium2 7440-47-3 0.0121 0.0128 1.2.E-04 CH IRIS 2.E-06 1.43% 94.62%
Ethylbenzene 100-41-4 0.367 0.583 2.5.E-06 D CAL 2B 1.E-06 1.36% 95.98%
Cadmium 7440-43-9 0.00024 0.0006656 1.8.E-03 B1 IRIS 1 1.E-06 1.11% 97.09%
Dibenz (a,h) anthracene1 53-70-3 0.0002585 0.0005993 2.0.E-03 B2 CAL 2A 1.E-06 1.11% 98.20%
Benzo (a) anthracene1 56-55-3 0.00235 0.00422 1.8.E-04 B2 CAL 2B 8.E-07 0.72% 98.92%
Benzo (b) fluoranthene 205-99-2 0.00321 0.00506 1.1.E-04 B2 CAL 2B 6.E-07 0.52% 99.44%
Indeno(1,2,3-cd)pyrene 193-39-5 0.00097 0.00171 1.1.E-04 B2 CAL 2B 2.E-07 0.18% 99.61%
Benzo (k) fluoranthene 207-08-9 0.000882 0.00153 1.1.E-04 B2 CAL 2B 2.E-07 0.16% 99.77%
Beryllium 7440-41-7 0.00002 3.272E-05 2.4.E-03 LH IRIS 1 8.E-08 0.07% 99.84%
Tetrachloroethylene 127-18-4 0.136 0.246 2.6.E-07 LH IRIS 2A 6.E-08 0.06% 99.90%
Chrysene 218-01-9 0.00374 0.00554 1.1.E-05 B2 CAL 2B 6.E-08 0.06% 99.96%
Dichloromethane1 75-09-2 0.558 2.689 1.7.E-08 LH IRIS 2B 4.E-08 0.04% 100.00%
Total 1.E-04 1Chemicals that are carcinogenic by a mutagenic mode of action and for which data on early life susceptibility are not available. The IURs for these chemicals, except
trichloroethylene, were adjusted for to include ages younger than 16 years using age-specific default adjustment factors (See Section 5.1.1). For trichloroethylene, we used
a recently IRIS-published adjusted IUR (EPA, 2011).
2Estimated from total chromium; See Section 4.3.

North Birmingham Air Toxics Risk Assessment
81
Table 5.1.2-1 Non-cancer Hazard Quotients for the Hudson K-8 School Chemicals of Potential Concern
Chemical CAS # 95UCL Conc.
(µg/m3)
RfC
(µg/m3)
Source Target Organ 95UCL Hazard
Quotient
%
Hazard
Manganese 7439-96-5 0.0372 0.05 IRIS Neurological 0.7 44%
Benzene 71-43-2 6.429 30 IRIS Immunological 0.2 13%
Naphthalene 91-20-3 0.587 3 IRIS Respiratory 0.2 12%
Cadmium 7440-43-9 0.00174 0.01 D-ATSDR Kidney/Respiratory 0.2 10%
Arsenic 7440-38-2 0.00177 0.015 CAL Developmental 0.1 7%
1,3-Butadiene 106-99-0 0.167 2 IRIS Reproductive 0.1 5%
Trichloroethylene 79-01-6 0.0814 2 IRIS Neurological/Ocular 0.04 2%
Nickel 7440-02-0 0.00258 0.09 ATSDR Respiratory 0.03 2%
m,p-Xylene1
108-38-3,
106-42-3 1.779 100 IRIS Neurological 0.02 1%
Chloromethane 74-87-3 1.258 90 IRIS Neurological 0.01 1%
Bromomethane 74-83-9 0.064 5 IRIS Respiratory 0.01 0.8%
Acetonitrile 75-05-8 0.688 60 IRIS Death 0.01 0.7%
o-Xylene1 95-47-6 0.739 100 IRIS Neurological 0.01 0.4%
Carbon Tetrachloride 56-23-5 0.72 100 IRIS Liver 0.01 0.4%
Tetrachloroethylene 127-18-4 0.238 40 IRIS Neurological 0.01 0.4%
Cobalt 7440-48-4 0.000280 0.1 ATSDR Respiratory 0.003 0.2%
Dichloromethane 75-09-2 1.18 600 IRIS Liver 0.002 0.1%
Chloroform 67-66-3 0.158 98 ATSDR Liver 0.002 0.1%
Beryllium 7440-41-7 0.000025 0.02 IRIS Respiratory 0.001 0.07%
Hexavalent Chromium 18540-29-9 0.000122 0.1 IRIS Anemia/damage to Gastrointerstinal 0.001 0.07%
Styrene 100-42-5 1.1 1000 IRIS Neurological 0.001 0.07%
Toluene 108-88-3 3.779 5000 IRIS Neurological/Respiratory 0.001 0.04%
Ethylbenzene 100-41-4 0.595 1000 IRIS Developmental 0.001 0.04%
p-Dichlorobenzene 106-46-7 0.295 800 IRIS Liver 0.0004 0.02%
Propylene 115-07-1 1.088 3000 CAL Neurological 0.0004 0.02%

North Birmingham Air Toxics Risk Assessment
82
Chemical CAS # 95UCL Conc.
(µg/m3)
RfC
(µg/m3)
Source Target Organ 95UCL Hazard
Quotient
%
Hazard
Mercury 7439-97-6 0.000057 0.3 IRIS Neurological 0.0002 0.01%
Carbon Disulfide 75-15-0 0.0835 700 IRIS Neurological 0.0001 0.007%
Methyl Isobutyl
Ketone 108-10-1 0.224 3000 IRIS Developmental 0.0001 0.004%
Selenium 7782-49-2 0.00091 20 CAL Skin/Neurological/Liver/Hematologic 0.00005 0.003%
1,2-Dichloroethane 107-06-2 0.0968 2400 ATSDR Liver 0.00004 0.002%
Hazard Index 2
1Were assigned the RfC value of mixed Xylenes

North Birmingham Air Toxics Risk Assessment
83
Table 5.1.2-2 Non-cancer Hazard Quotients for the Lewis Elementary School Chemicals of Potential Concern
Chemical CAS #
95UCL
Conc.
(µg/m3)
RfC
(µg/m3)
Source Target Organ
95UCL
Hazard
Quotient
%
Hazard
Manganese 7439-96-5 0.0461 0.05 IRIS Neurological 0.9 51%
Naphthalene 91-20-3 0.658 3 IRIS Respiratory 0.2 12%
Benzene 71-43-2 5.064 30 IRIS Immunological 0.2 9%
Arsenic 7440-38-2 0.00178 0.015 CAL Developmental 0.1 7%
1,3-Butadiene 106-99-0 0.194 2 IRIS Reproductive 0.1 5%
Cadmium 7440-43-9 0.000922 0.01 D-ATSDR Kidney/Respiratory 0.1 5%
Trichloroethylene 79-01-6 0.0887 2 IRIS Neurological/Ocular 0.04 2%
m,p-Xylene1 108-38-3, 106-42-3
3.877
100
IRIS
Neurological
0.04
2%
Nickel 7440-02-0 0.00296 0.09 ATSDR Respiratory 0.03 2%
o-Xylene1 95-47-6 1.815 100 IRIS Neurological 0.02 1%
Chloromethane 74-87-3 1.313 90 IRIS Neurological 0.01 1%
Bromomethane 74-83-9 0.0609 5 IRIS Respiratory 0.01 1%
Tetrachloroethylene 127-18-4 0.317 40 IRIS Neurological 0.01 0.4%
Carbon Tetrachloride 56-23-5 0.739 100 IRIS Liver 0.01 0.4%
Acetonitrile 75-05-8 0.443 60 IRIS Death 0.01 0.4%
Cobalt 7440-48-4 0.000225 0.1 ATSDR Respiratory 0.002 0.1%
Chloroform 67-66-3 0.153 98 ATSDR Liver 0.002 0.1%
Dichloromethane 75-09-2 0.837 600 IRIS Liver 0.001 0.1%
Beryllium 7440-41-7 0.000026 0.02 IRIS Respiratory 0.001 0.1%
Hexavalent Chromium 18540-29-9 0.000121 0.1 IRIS Anemia/damage to Gastrointerstinal 0.001 0.07%
Ethylbenzene 100-41-4 1.08 1000 IRIS Developmental 0.001 0.06%
Toluene 108-88-3 4.273 5000 IRIS Neurological/Respiratory 0.001 0.05%
Styrene 100-42-5 0.779 1000 IRIS Neurological 0.001 0.04%
Propylene 115-07-1 1.425 3000 CAL Neurological 0.0005 0.03%
p-Dichlorobenzene 106-46-7 0.224 800 IRIS Liver 0.0003 0.02%
Carbon Disulfide 75-15-0 0.0818 700 IRIS Neurological 0.0001 0.01%

North Birmingham Air Toxics Risk Assessment
84
Chemical CAS #
95UCL
Conc.
(µg/m3)
RfC
(µg/m3)
Source Target Organ
95UCL
Hazard
Quotient
%
Hazard
Methyl Isobutyl Ketone 108-10-1 0.319 3000 IRIS Developmental 0.0001 0.006%
Mercury 7439-97-6 0.0000276 0.3 IRIS Neurological 0.0001 0.005%
1,2-Dichloroethane 107-06-2 0.104 2400 ATSDR Liver 0.00004 0.002%
Selenium 7782-49-2 0.000803 20 CAL
Skin/Neurological/Liver/
Hematologic
0.00004 0.002%
Hazard Index 2
1Were assigned the RfC value of mixed Xylenes

North Birmingham Air Toxics Risk Assessment
85
Table 5.1.2-3 Non-cancer Hazard Quotients for the Riggins School Chemicals of Potential Concern
Chemical CAS # 95UCL Conc.
(µg/m3)
RfC
(µg/m3)
Source Target Organ
95UCL
Hazard
Quotient
%
Hazard
Manganese 7439-96-5 0.0195 0.05 IRIS Neurological 0.4 26%
Naphthalene 91-20-3 1.081 3 IRIS Respiratory 0.4 24%
Benzene 71-43-2 8.595 30 IRIS Immunological 0.3 19%
Arsenic 7440-38-2 0.00274 0.015 CAL Developmental 0.2 12%
1,3-Butadiene 106-99-0 0.203 2 IRIS Reproductive 0.1 7%
Cadmium 7440-43-9 0.000565 0.01 D-ATSDR Kidney/Respiratory 0.1 4%
Nickel 7440-02-0 0.00299 0.09 ATSDR Respiratory 0.03 2%
Acetonitrile 75-05-8 1.384 60 IRIS Death 0.02 2%
Chloromethane 74-87-3 2.061 90 IRIS Neurological 0.02 2%
Bromomethane 74-83-9 0.0882 5 IRIS Respiratory 0.02 1%
m,p-Xylene1
108-38-3,
106-42-3 1.564 100 IRIS Neurological
0.02 1%
Tetrachloroethylene 127-18-4 0.352 40 IRIS Neurological 0.01 1%
Carbon Tetrachloride 56-23-5 0.713 100 IRIS Liver 0.01 0.5%
o-Xylene1 95-47-6 1.815 100 IRIS Neurological 0.007 0.4%
Cobalt 7440-48-4 0.000233 0.1 ATSDR Respiratory 0.002 0.2%
Dichloromethane 75-09-2 1.262 600 IRIS Liver 0.002 0.1%
Beryllium 7440-41-7 0.000033 0.02 IRIS Respiratory 0.002 0.1%
Chloroform 67-66-3 0.142 98 ATSDR Liver 0.001 0.1%
Hexavalent Chromium 18540-29-9 0.000116 0.1 IRIS Anemia/damage to Gastrointerstinal 0.001 0.08%
Styrene 100-42-5 0.82 1000 IRIS Neurological 0.001 0.1%
Toluene 108-88-3 3.545 5000 IRIS Neurological/Respiratory 0.001 0.05%
Ethylbenzene 100-41-4 0.51 1000 IRIS Developmental 0.001 0.03%
Propylene 115-07-1 1.399 3000 CAL Neurological 0.0005 0.0%
Mercury 7439-97-6 0.00008 0.3 IRIS Neurological 0.0003 0.02%
p-Dichlorobenzene 106-46-7 0.2 800 IRIS Liver 0.0003 0.02%

North Birmingham Air Toxics Risk Assessment
86
Chemical CAS # 95UCL Conc.
(µg/m3)
RfC
(µg/m3)
Source Target Organ
95UCL
Hazard
Quotient
%
Hazard
Carbon Disulfide 75-15-0 0.142 700 IRIS Neurological 0.0002 0.01%
Methyl Isobutyl Ketone 108-10-1 0.176 3000 IRIS Developmental 0.0001 0.004%
Selenium 7782-49-2 0.00112 20 CAL Skin/Neurological/Liver/Hematologic 0.0001 0.004%
1,2-Dichloroethane 107-06-2 0.0953 2400 ATSDR Liver 0.00004 0.003%
Hazard Index 2
1Were assigned the RfC value of mixed Xylenes

North Birmingham Air Toxics Risk Assessment
87
Table 5.1.2-4 Non-cancer Hazard Quotients for the Shuttlesworth Station Chemicals of Potential Concern
Chemical CAS # 95UCL Conc.
(µg/m3)
RfC
(µg/m3)
Source Target Organ 95UCL Hazard
Quotient
%
Hazard
Manganese 7439-96-5 0.02590 0.05 IRIS Neurological 0.5 36%
Naphthalene 91-20-3 0.82500 3 IRIS Respiratory 0.3 19%
Arsenic 7440-38-2 0.00270 0.015 CAL Developmental 0.2 13%
Benzene 71-43-2 5.12500 30 IRIS Immunological 0.2 12%
1,3-Butadiene 106-99-0 0.17400 2 IRIS Reproductive 0.1 6%
Cadmium 7440-43-9 0.00067 0.01 D-ATSDR Kidney/Respiratory 0.1 5%
Nickel 7440-02-0 0.00344 0.09 ATSDR Respiratory 0.04 3%
m,p-Xylene1
108-38-3,
106-42-3 1.70900 100 IRIS Neurological 0.02 1%
Chloromethane 74-87-3 1.24700 90 IRIS Neurological 0.01 1%
Bromomethane 74-83-9 0.06190 5 IRIS Respiratory 0.01 1%
Carbon Tetrachloride 56-23-5 0.73600 100 IRIS Liver 0.007 0.5%
o-Xylene1 95-47-6 0.70400 100 IRIS Neurological 0.007 0.5%
Tetrachloroethylene 127-18-4 0.24600 40 IRIS Neurological 0.01 0.4%
Acetonitrile 75-05-8 0.28900 60 IRIS Death 0.005 0.3%
Dichloromethane 75-09-2 2.68900 600 IRIS Liver 0.004 0.3%
Cobalt 7440-48-4 0.00024 0.1 ATSDR Respiratory 0.002 0.2%
Chloroform 67-66-3 0.19800 98 ATSDR Liver 0.002 0.1%
Beryllium 7440-41-7 0.00003 0.02 IRIS Respiratory 0.002 0.1%
Hexavalent Chromium 18540-29-9 0.00013 0.1 IRIS Anemia/damage to Gastrointerstinal 0.001 0.09%
Styrene 100-42-5 0.99900 1000 IRIS Neurological 0.001 0.1%
Toluene 108-88-3 3.41100 5000 IRIS Neurological/Respiratory 0.0007 0.05%
Ethylbenzene 100-41-4 0.58300 1000 IRIS Developmental 0.0006 0.04%
Propylene 115-07-1 1.14700 3000 CAL Neurological 0.0004 0.03%
p-Dichlorobenzene 106-46-7 0.27800 800 IRIS Liver 0.0003 0.02%
Mercury 7439-97-6 0.00004 0.3 IRIS Neurological 0.0001 0.01%
Carbon Disulfide 75-15-0 0.08870 700 IRIS Neurological 0.0001 0.01%
Methyl Isobutyl Ketone 108-10-1 0.20500 3000 IRIS Developmental 0.00007 0.005%
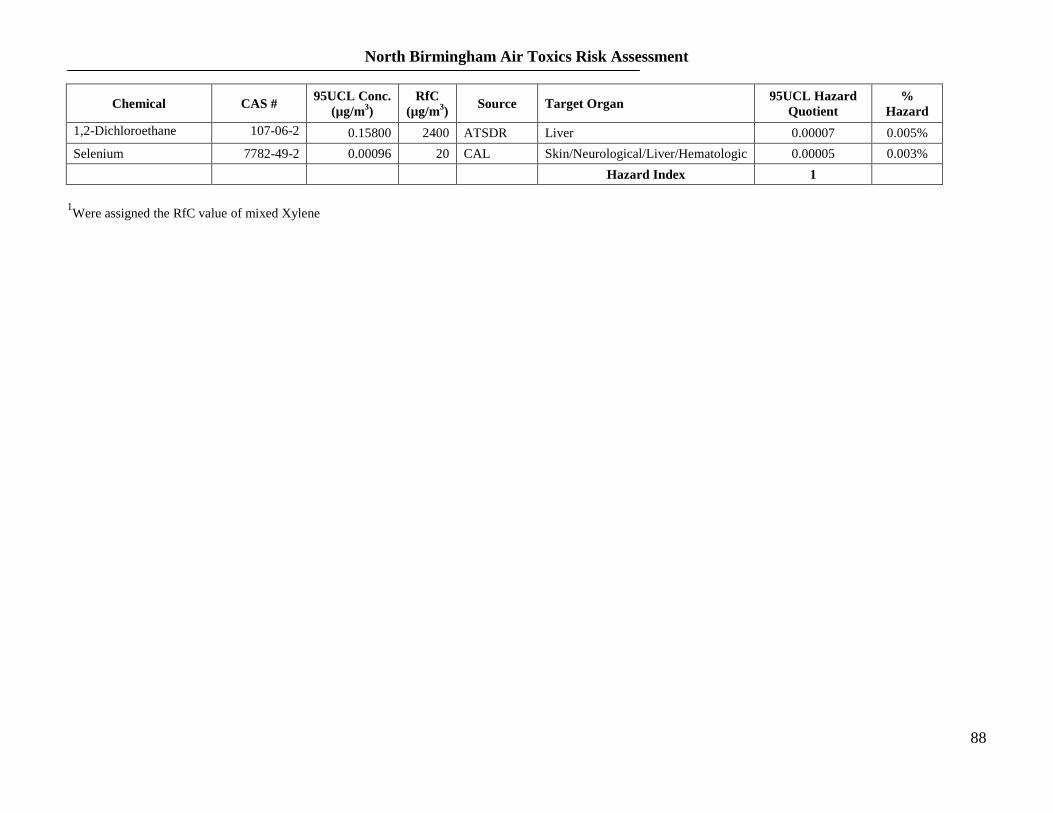
North Birmingham Air Toxics Risk Assessment
88
Chemical CAS # 95UCL Conc.
(µg/m3)
RfC
(µg/m3)
Source Target Organ 95UCL Hazard
Quotient
%
Hazard
1,2-Dichloroethane 107-06-2 0.15800 2400 ATSDR Liver 0.00007 0.005%
Selenium 7782-49-2 0.00096 20 CAL Skin/Neurological/Liver/Hematologic 0.00005 0.003%
Hazard Index 1
1Were assigned the RfC value of mixed Xylene

North Birmingham Air Toxics Risk Assessment
89
Table 5.2-1 Comparison of Maximum Chemical Concentrations to Acute Benchmark Screening Limits for the 4 Monitoring Site1
Chemical Maximum Concentration (µg/m3) EPA OAQPS Acute Toxicity Values (µg/m
3)
Name
CAS #
HEAL LEAL RSAL SLOSS AEGL-
1 (1-h)
AEGL
-1 (8-
h)
AEGL-2
(1-h)
AEGL-2
(8-h)
ERPG
-1 ERPG-2 MRL REL IDLH/10
TEEL
-0
TEEL
-1
1,1,1-Trichloroethane 71-55-6 0.22371 0.130949 0.148682 0.300092372
130000
0
13000
00 3300000 1700000
19000
00 3800000 11000 68000 380000
1,1,2,2-
Tetrachloroethane 79-34-5 0.71396 69000
1,1,2-Trichloroethane 79-00-5 0.22916 55000
1,1-Dichloroethane 75-34-3 0.1538 0.044522 1200000
1,1-Dichloroethene 75-35-4 0.13084 0.043615 0.055509742 20000 79000
1,2,4-Trichlorobenzene 120-82-1 0.97218 1.165131 37000 37000
1,2-Dibromoethane 106-93-4 0.38418 130000 35000 180000 50000 77000
1,2-Dichloroethane 107-06-2 0.22666 0.149755 0.136601 0.862102037
20000
0 810000 20000
1,2-Dichloropropane 78-87-5 0.19409 230 180000
1,3-Butadiene 106-99-0 0.64158 0.606178 0.919775 0.493348965
150000
0
15000
00 12000000 6000000 22000 440000 220 440000
Acetonitrile 75-05-8 3.5931 1.445649 9.041602 0.60613155 22000 22000 540000 140000 84000
Acrylonitrile 107-13-1 0.2561 0.312521 0.881135 1.362937227 10000 10000 130000 19000 22000 77000 220 19000
Arsenic 7440-38-2 0.0040 0.004650 0.010750 0.00745 0.2 500
Benzene 71-43-2 21.885 20.446861 55.110681 22.71518503 170000 29000 2600000 640000
16000
0 480000 29 1300 160000
Benzo (a) anthracene 56-55-3 0.0161 0.030100 0.038525 0.0137 100 300
Benzo (a) pyrene 50-32-8 0.00956 0.015300 0.021475 0.00753 200 600
Benzo (b) fluoranthene 205-99-2 0.0193 0.031900 0.047100 0.0153 200 600
Benzo (k) fluoranthene 207-08-9 0.00545 0.010600 0.013225 0.00438 200 600
Beryllium 7440-41-7 0.00008 0.000080 0.000078 0.00009 25 400
Bromoform 75-25-2 0.8579 880000
Bromomethane 74-83-9 0.1476 0.100957 0.446542 0.100957309 820000 260000 190000 190 3900 97000
Cadmium 7440-43-9 0.00779 0.006680 0.002740 0.00246 0.03 900

North Birmingham Air Toxics Risk Assessment
90
Chemical Maximum Concentration (µg/m3) EPA OAQPS Acute Toxicity Values (µg/m
3)
Carbon Disulfide 75-15-0 0.27092 0.199300 0.468667 0.183730102 40000 21000 500000 160000 3100 500000 6200 160000
Carbon Tetrachloride 56-23-5 0.89966 0.987739 0.965719 0.937408057 280000
12000
0 1200000 510000
13000
0 630000 1900 130000
Chlorobenzene 108-90-7 0.29924 11.393959 46000 46000 690000 690000 460000
Chloroethane 75-00-3 0.108184 0.197897 0.357534 0.039579448 40000 1000000
Chloroform 67-66-3 0.288069 0.302717 0.253892 0.80561773 310000 140000 240000 490 150 240000
Chloromethane 74-87-3 1.761391 1.866703 20.639041 1.759325988 1900000 780000 830000 1000 410000
Chloroprene 126-99-8 0.144845 0.264342106 110000
Chromium 7440-47-3 0.017800 0.026100 0.016600 0.0304 1000 1500
Chrysene 218-01-9 0.016600 0.031500 0.046200 0.0163 200 600
Cobalt 7440-48-4 0.001220 0.000560 0.000673 0.00059
0.0002
6 0.00017 0.00030 2000
Dibenz (a,h) anthracene 53-70-3 0.002250 0.003490 0.004693 0.00176 10000 30000
Dichloromethane 75-09-2 4.828490 3.341732 5.476342 23.1698 690000 1900000 210000
10000
00 2600000 2100 14000 800000
Ethylbenzene 100-41-4 1.810701 4.472475 3.601862 1.84543865 140000
14000
0 4800000 2500000 22000 350000
Hexachloro-1,3-
Butadiene 87-68-3 1.162497 0.437270 11000 32000
Hexavalent Chromium 18540-29-9 0.00018 0.00026 0.00017 0.00030
1500
Indeno(1,2,3-cd)pyrene 193-39-5 0.007120 0.009870 0.015725 0.00498 150 500
Lead 7439-92-1 1.130000 0.835000 0.067300 0.0432 10000
m,x-Xylene
108-38-3,
106-42-3 560000
56000
0 4000000 1700000 8700 22000 390000
Manganese 7439-96-5 0.117000 0.165000 0.057600 0.0607 50000
Mercury 7439-97-6 0.000280 0.000090 0.000525 0.00014 1700 330 2000 0.6
Methyl Isobutyl Ketone 108-10-1 0.516163 0.983168 0.430136 0.68002
31000
0
31000
0
Methyl Methacrylate 80-62-6 0.282539 3.044458 70000 70000 490000 200000 410000
Methyl tert-Butyl Ether 1634-04-4 0.111764 0.068500 0.054079264 180000
18000
0 2100000 1400000 7200
Naphthalene 91-20-3 2.020000 1.830000 5.735000 2.06 130000
Nickel 7440-02-0 0.012600 0.010400 0.012100 0.0122 6 1000

North Birmingham Air Toxics Risk Assessment
91
Chemical Maximum Concentration (µg/m3) EPA OAQPS Acute Toxicity Values (µg/m
3)
o-Xylene 95-47-6 2.8480 7.51200 4.4510 3.01300 560000
56000
0 4000000 1700000 8700 22000 390000
p-Dichlorobenzene 106-46-7 0.943949 0.625291 1.274632 0.793639067 12000 90000
Propylene 115-07-1
Selenium 7782-49-2 0.002230 0.002240 0.003040 0.00236 100
Styrene 100-42-5 4.430153 3.024432 3.714513 4.302360409 85000 85000 550000 550000
21000
0 1100000 21000 300000
Tetrachloroethylene 127-18-4 0.834257 0.800344 2.723205 0.739300859 240000
24000
0 1600000 550000
68000
0 1400000 1400 20000 100000
Toluene 108-88-3
27.43479
2 105.141578 31.806269 15.52628319 750000
75000
0 4500000 2400000
19000
0 1100000 3800 37000 190000
Trichloroethylene 79-01-6 0.247194 0.279437 0.532004 0.225698724 700000
41000
0 2400000 1300000
54000
0 2700000 11000
Vinyl chloride 75-01-4 0.076686 0.040899 0.080520 0.035786577 640000
18000
0 3100000 2100000
13000
00
1300000
0 1300
18000
0
1For all chemicals that were detected at or above respective detection limits at least once.