washington state toxics monitoring program: contaminants ... · washington state toxics monitoring...
TRANSCRIPT
Washington State Toxics Monitoring Program: Contaminants in Fish Tissue from Freshwater Environments in 2006
February 2008
Publication No. 08-03-002
Publication Information This report is available on the Department of Ecology’s website at www.ecy.wa.gov/biblio/0803002.html Data for this project are available on Ecology’s Environmental Information Management (EIM) website at www.ecy.wa.gov/eim/index.htm. Search User Study ID: WSTMP06. Ecology’s Project Tracker Code for this study is 02-500-01-05. For more information contact: Publications Coordinator Environmental Assessment Program P.O. Box 47600 Olympia, WA 98504-7600 E-mail: [email protected] Phone: 360-407-6764
Washington State Department of Ecology - www.ecy.wa.gov/ o Headquarters, Olympia 360-407-6000 o Northwest Regional Office, Bellevue 425-649-7000 o Southwest Regional Office, Olympia 360-407-6300 o Central Regional Office, Yakima 509-575-2490 o Eastern Regional Office, Spokane 509-329-3400
Any use of product or firm names in this publication is for descriptive purposes only and does not imply endorsement by the author or the Department of Ecology. If you need this publication in an alternate format, call Joan LeTourneau at 360-407-6764. Persons with hearing loss can call 711 for Washington Relay Service. Persons with a speech disability can call 877-833-6341. Cover photo: Largemouth bass from Washington State (undisclosed location).
Washington State Toxics Monitoring Program: Contaminants in Fish Tissue from Freshwater Environments in 2006
by
Keith Seiders, Casey Deligeannis, and Patti Sandvik
Toxics Studies Unit Statewide Coordination Section
Environmental Assessment Program Washington State Department of Ecology
Olympia, Washington 98504-7710
Waterbody Numbers:
Ballinger Lake WA-08-9010 Chester Morse Lake WA-08-9060 Eloika Lake WA-55-9040 Long Lake (near Olympia) WA-13-9085 Mason Lake WA-14-9120 Meridian Lake WA-09-9160 Newman Lake WA-57-9020 Offut Lake WA-13-9110 Palmer Lake WA-49-9270 Sammamish Lake WA-08-9270 Sawyer Lake WA-09-9260 Silver Lake (near Everett) WA-08-9300 Summit Lake WA-14-9160 Ward Lake WA-13-9200

This page is purposely left blank
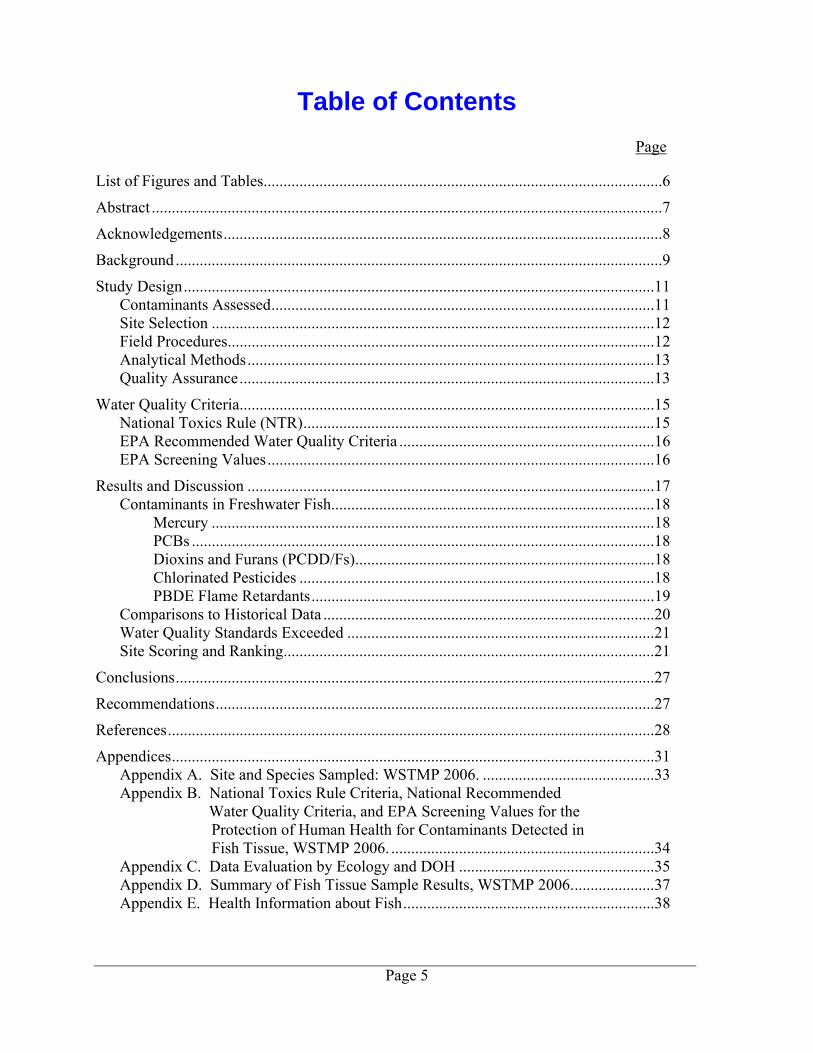
Table of Contents
Page
List of Figures and Tables....................................................................................................6
Abstract ................................................................................................................................7
Acknowledgements ..............................................................................................................8
Background ..........................................................................................................................9
Study Design ......................................................................................................................11 Contaminants Assessed ................................................................................................11 Site Selection ...............................................................................................................12 Field Procedures ...........................................................................................................12 Analytical Methods ......................................................................................................13 Quality Assurance ........................................................................................................13
Water Quality Criteria ........................................................................................................15 National Toxics Rule (NTR) ........................................................................................15 EPA Recommended Water Quality Criteria ................................................................16 EPA Screening Values .................................................................................................16
Results and Discussion ......................................................................................................17 Contaminants in Freshwater Fish.................................................................................18
Mercury ...............................................................................................................18 PCBs ....................................................................................................................18 Dioxins and Furans (PCDD/Fs) ...........................................................................18 Chlorinated Pesticides .........................................................................................18 PBDE Flame Retardants ......................................................................................19
Comparisons to Historical Data ...................................................................................20 Water Quality Standards Exceeded .............................................................................21 Site Scoring and Ranking .............................................................................................21
Conclusions ........................................................................................................................27
Recommendations ..............................................................................................................27
References ..........................................................................................................................28
Appendices .........................................................................................................................31 Appendix A. Site and Species Sampled: WSTMP 2006. ...........................................33 Appendix B. National Toxics Rule Criteria, National Recommended Water Quality Criteria, and EPA Screening Values for the Protection of Human Health for Contaminants Detected in Fish Tissue, WSTMP 2006. ..................................................................34 Appendix C. Data Evaluation by Ecology and DOH .................................................35 Appendix D. Summary of Fish Tissue Sample Results, WSTMP 2006. ....................37 Appendix E. Health Information about Fish ...............................................................38
Page 5
List of Figures and Tables
Page Figures
Figure 1. Sample Sites for the WSTMP, 2006 ..................................................................10
Figure 2. Site Ranking for the 2004-2006 WSTMP Fish Tissue Results. ........................25
Tables Table 1. Analytical Methods for Fish Tissue Samples, WSTMP 2006 ............................13
Table 2. Summary Statistics for Fish Tissue Samples, WSTMP 2006. ............................17
Table 3. Comparison of Historical to Recent Fish Tissue Data from Ward Lake ............20
Table 4. Recommended 303(d) Listings for Fish Tissue Sample Results, WSTMP 2006. ....................................................................................................22
Table 5. Example Calculation of Contaminant Scores for Samples and Sites Using the Meridian Lake Site near Kent, WSTMP 2006 ...................................23
Page 6
Page 7
Abstract The exploratory monitoring component of the Washington State Toxics Monitoring Program (WSTMP) has characterized toxic contaminants in freshwater fish since 2001, primarily from sites never before sampled. Contaminants assessed include persistent, bioaccumulative, and toxic chemicals such as mercury, PCBs, dioxins and furans, chlorinated pesticides, and PBDE flame retardants. Fourteen lakes were sampled in 2006 and yielded 40 samples representing 13 freshwater species of fish. Most sample results were within the lower range of values found in other studies of fish tissue in Washington. Mercury and PBDEs were detected in 100%, and PCBs in 55%, of the 40 samples. Pesticides in the DDT and chlordane groups were detected in 75% and 50% of the samples, respectively. The most frequently detected chlorinated pesticides were 4,4’-DDE, 4,4’-DDD, hexachlorobenzene, trans-nonachlor, cis-chlordane, and dieldrin. Other pesticides or breakdown products were detected in less than 10% of the samples. Only 17 samples were analyzed for dioxins/furans, and all samples had detectable levels. A total of 20 of the 40 fish tissue samples, from 11 of the 14 lakes, had levels of contaminants higher than (exceeding) the National Toxics Rule (NTR) criteria1. Total PCBs and 2,3,7,8-TCDD accounted for 75% of the NTR exceedances. Concentrations of PCBs in 45% of the samples exceeded the NTR criterion, and concentrations of 2,3,7,8-TCDD in 13% of the samples exceeded the criterion. Other exceedances were measured for dieldrin, total chlordane, hexachlorobenzene, and toxaphene. This study recommends that 11 lakes be added to the federal Clean Water Act Section 303(d) List for Washington State. This study also recommends that the Washington State Department of Health, local health jurisdictions, and affected tribes should (1) evaluate the levels of toxic contaminants found during this 2006 study, and (2) determine the need for additional sampling to assess the risks to human health from the consumption of contaminated fish.
1 Washington State’s water quality standards use the NTR criteria for some toxic substances.

Acknowledgements
The authors of this report would like to thank the following people for their contribution to this study:
• Washington State Department of Fish and Wildlife staff for helping with site reconnaissance.
• Dwayne Paige, senior watershed ecologist with Seattle Public Utilities, for providing fish collected from Chester Morse Reservoir.
• Washington State Department of Ecology staff:
o Water Quality Program regional staff for review of the draft report: Mark Peterschmidt, Christine Hempleman, and David Moore.
o Manchester Environmental Laboratory staff for analytical services: Myrna Mandjikov, Debi Case, Dean Momohara, Sarah Sekerak, Dolores Montgomery, John Weakland, Kelly Donegan, Karin Feddersen, Stuart Magoon, Pam Covey, and Leon Weiks.
o Environmental Assessment Program staff for sample collection, processing, and data management: Chad Furl, Randy Coots, Brandee Era-Miller, Paul Anderson, Kristin Kinney, Brenda Nipp, Chad Brown, Carolyn Lee, and Brandi Lubliner.
o Other Environmental Assessment Program staff: Dale Norton for project guidance and for design and review of the report; Brad Hopkins for peer review; and Joan LeTourneau for formatting and editing the final report.
Page 8
Background During the 1980s and 1990s, the Washington State Department of Ecology (Ecology) and other agencies found toxic contaminants in fish, water, and sediment throughout Washington at varied levels of concern (www.ecy.wa.gov/toxics.html). In 2000, renewed concern about toxic contaminants in the environment led Ecology to revitalize a program to address toxic contaminants: the Washington State Toxics Monitoring Program (WSTMP). The goals of the WSTMP are to:
• Conduct exploratory monitoring to characterize toxic contaminants in freshwater fish across Washington where historical data are lacking (the subject of this report).
• Conduct trend monitoring for persistent toxic chemicals. • Improve access to information about monitoring contaminants in Washington:
www.ecy.wa.gov/programs/eap/toxics/index.html. • Establish cooperative efforts with other agencies and develop monitoring efforts to address
topics of concern. Between 2001 and 2006, 197 fish tissue samples from 90 sites were analyzed for various contaminants as part of the WSTMP Exploratory Monitoring component. Four annual reports have been published: Seiders et al., 2007; Seiders et al., 2006; Seiders and Kinney, 2004; and Seiders, 2003. Over 30,000 results are now available in Ecology’s Environmental Information Management database (EIM) at www.ecy.wa.gov/eim/. Ecology and the Washington State Department of Health (DOH) are developing strategies to address persistent, bioaccumulative, and toxic chemicals (PBTs) in our environment. These strategies involve learning more about the sources, uses, risks, and fate of these compounds. Mercury and flame retardants were the first PBTs for which chemical action plans were developed (www.ecy.wa.gov/programs/eap/toxics/PBT_strategy.html). Fish are an important indicator of contaminant levels in the environment. Fish tissue contaminant data collected by various agencies are evaluated by DOH and local health jurisdictions to determine whether fish consumption advisories are needed. While many areas of Washington do not warrant consumption advisories, a number of site-specific and statewide fish consumption advisories have been issued. (www.doh.wa.gov/ehp/oehas/fish/advisoriesmap.htm). Ecology evaluates fish tissue contaminant data to determine whether Washington State water quality standards are being met. Contaminant concentrations in fish tissue that do not meet water quality standards are not necessarily high enough to warrant a fish consumption advisory to eat less fish. DOH evaluates the need for consumption advice based on multiple factors including the benefits of eating fish as part of a healthy diet. This report summarizes results from fish samples collected in 2006 (Figure 1 and Appendix A). These 14 sites yielded 40 samples representing 13 freshwater species.
Page 9

Figure 1. Sample Sites for the WSTMP, 2006.
Page 10
Study Design The study targeted a broad range of contaminants in fish tissue from multiple sites. Site selection involved reviewing existing information on fish contaminants in Washington and choosing sites and species where historical data were lacking or were more than ten years old. The project plan for the WSTMP describes the selection of sites, species, and analytes in more detail (Seiders and Yake, 2002).
Contaminants Assessed Target analytes included the PBTs described below. Lipid content of samples was also determined. A brief description of contaminants is given here. More detailed information about individual analytes is available through internet links in EIM (see page 2 of this report). Mercury Mercury occurs in the earth’s crust and is released to the environment from natural events (e.g., volcanoes, weathering, and forest fires) and human activities (e.g., fossil fuel combustion, mining, and industrial processes). Methylmercury is the toxic form of mercury which persists in the environment as it accumulates in the food web. Eating fish and shellfish contaminated with methylmercury is the primary route for exposure to mercury for most people (ATSDR, 1999; Ecology and DOH, 2003; EPA, 2007). PCBs Polychlorinated biphenyls (PCBs) are synthetic organic compounds historically used as cooling fluids in electrical equipment, and in inks, paints, and plastics. PCBs are stable, have low solubility in water, and have a high affinity for sediments and animal fats. The production of PCBs was banned in the U.S. in 1979 due to their persistence and toxicity (ATSDR, 2000). There are 209 individual PCBs, or congeners. Commercial mixtures of PCB congeners were known in the United States by the trade name Aroclor. PCB Aroclors were analyzed in all 40 WSTMP samples from 2006; individual PCB congeners were analyzed in 17 (about 42%) of these samples. Dioxins and Furans (PCDD/Fs) Dioxins and furans, or polychlorinated dibenzo-p-dioxins and -furans (PCDD/Fs), are unintentional byproducts of combustion processes (e.g., burning household trash, forest fires, waste incineration), chlorine bleaching in paper production, and chemical and pesticide manufacturing. Agent Orange, used as a defoliant in the Vietnam War, contained dioxins (ATSDR, 2006).
Page 11

Seventeen of the 40 samples from 2006 were analyzed for the 17 most toxic congeners. These congeners have different levels of toxicity compared to 2,3,7,8-TCDD, the most toxic congener. The cumulative toxicity of mixtures of congeners in a sample can be expressed as a toxic equivalent (TEQ) to 2,3,7,8-TCDD. Chlorinated Pesticides Pesticides include insecticides, herbicides, fungicides, and related chemicals used to control pests. Chlorinated pesticides were analyzed for in this study because of their widespread occurrence and persistence in the environment. Many of these pesticides are neurotoxins and are suspected or known carcinogens (EPA, 2000). Some were banned from use in the United States during the 1970s and 1980s as their hazards became evident (e.g., DDT, chlordane, and dieldrin). PBDE Flame Retardants Flame retardants, specifically poly-brominated diphenyl ethers (PBDEs), are compounds added to plastic and foam products such as electronic enclosures, wire insulation, adhesives, textile coatings, foam cushions, and carpet padding. Increasing concentrations of PBDEs in humans and wildlife worldwide continue to raise concerns about their health effects. The highest levels of PBDEs in human tissue have been found in the U.S. and Canada (Ecology and DOH, 2006).
Site Selection Sites were selected by examining various factors, such as the type of species present, the presence or absence of historical data, the value of the site for fishing, and the ability to coordinate with other monitoring or watershed planning efforts. Appendix A lists the sample site locations and species of fish sampled. Additional site and sample information, including analytical results, are available in Ecology’s Environmental Information Management (EIM) database at www.ecy.wa.gov/eim/index.htm. Search User Study ID: WSTMP06.
Field Procedures Target fish species were chosen based on recommendations from the U.S. Environmental Protection Agency (EPA, 2000) and previous experience with fish collection efforts. Most fish were collected in late summer or fall by electro-fishing, gill netting, angling, or trapping. Fish kept for analyses were given a unique identifying code, measured for length and weight, individually wrapped in aluminum foil and put in plastic bags, and transported to freezer storage.
Page 12

Fish were later processed at Ecology facilities. Composite samples were made up of skin-on fillets from five to ten fish of the same species from the same site. The sex of each fish was determined. Samples were then sent to laboratories for chemical analyses. Sample collection and processing details are described in a standard operating procedure (SOP) (Sandvik, 2006).
Analytical Methods Table 1 describes analytical methods. Most analyses were performed by Ecology’s Manchester Environmental Laboratory (MEL). Pace Analytical Services of Minneapolis, MN, conducted analyses for PCB congeners and PCDD/Fs. At Ecology’s request, PCDD/Fs results were reported down to the method detection limit. Values were qualified as estimates if they were between the method detection limit and the quantitation limit. Fish tissue was analyzed for total mercury because the analytical costs for methylmercury are prohibitively high. Methylmercury is also the predominant form of mercury found in free-swimming fish accounting for 95-100% of total mercury (Bloom, 1995). Both mercury and methylmercury are used as the basis for various water quality criteria or threshold values for the protection of human health and aquatic life. Table 1. Analytical Methods for Fish Tissue Samples, WSTMP 2006.
Parameter Description Method Reporting Limit
PCB Aroclors GC/ECD EPA 8082 0.5 ug/kg, wet wt PCB Congeners HiRes GC/MS EPA 1668A 0.02 - 0.08 ug/kg, wet wt Chlorinated pesticides GC/ECD EPA 8081 1 0.25 -15 ug/kg, wet wt PBDEs GC/MS SIM EPA 8270 2 0.5 - 1.0 ug/kg, wet wt PCDD/PCDFs HiRes GC/MS EPA 1613B 0.1 - 1.0 ng/kg, wet wt Mercury (total mercury) CVAA EPA 245.6 0.017 mg/kg, wet wt Lipids - percent gravimetric MEL SOP 700009 0.1 percent
1 - MEL SOP 730073, a modification of EPA 8081 and others, was used in sample analyses. 2 - MEL SOP 730096, a modification of EPA 8270, was used in sample analyses. SOP = Standard Operating Procedure. GC = Gas Chromatography. ECD = Electron Capture Detection. HiRes = High Resolution. MS = Mass Spectrometry. SIM = Single Ion Monitoring. CVAA = Cold Vapor Atomic Absorbance.
Quality Assurance Data quality was assessed by reviewing laboratory case narratives, analytical results, and field replicate data. Case narratives were written by the laboratory’s analytical staff. The narratives described conditions of the samples upon receipt, analytical quality control procedures, and data qualifications.
Page 13

Overall, the 2006 data met most quality control criteria defined by MEL and the quality assurance project plan. While no data were rejected based on quality assurance reviews, some results were qualified. Estimates of precision for field and laboratory replicates, and recoveries of Standard Reference Material, appeared typical for samples of fish tissue. Other quality assurance information is available by contacting the authors of this report.
Page 14

Water Quality Criteria Fish tissue results were compared to Washington’s water quality standards to determine how sites should be assessed in Washington’s Statewide Water Quality Assessment (the 303(d) assessment). Washington’s water quality standards for toxic compounds (the National Toxics Rule criteria) are one set of values that can be used in helping to gauge the potential for human health risks from eating contaminated fish. EPA developed more recent criteria and guidance values which are summarized below (EPA Recommended Water Quality Criteria and EPA Screening Values). These Washington State and EPA criteria and guidance values exist because of changing knowledge about the toxic effects of chemicals and subsequent risks to consumers of fish. The various criteria and guidance values are often based on different assumptions used in determining risk, such as daily consumption rates, toxicological data used in calculations, and risk levels. Results of this 2006 study are not compared to these other EPA criteria because Ecology lacks authority to begin corrective actions where these criteria are exceeded. Yet these EPA criteria can be used by state, tribal, and local health jurisdictions in evaluating risks to human health from the consumption of contaminated fish. These EPA criteria and guidance values are compared with Washington’s water quality standards criteria in Appendix B. Appendix C describes how Ecology and DOH evaluate fish tissue data.
National Toxics Rule (NTR) Washington State’s water quality standards for toxic substances (WAC 173-201A-040[5]) define human health-based water quality criteria by referencing 40 CFR 131.36, also known as the National Toxics Rule (NTR). The NTR criteria were issued by EPA to Washington State in 1992. These criteria are designed to minimize the risk of adverse effects occurring to humans from chronic (lifetime) exposure to toxic substances through the ingestion of drinking water and contaminated fish and shellfish obtained from surface waters. The NTR criteria are regulatory values used by Ecology for a number of different purposes, including permitting wastewater discharges and assessing when waterbodies are adversely impacted by contaminants. The NTR criteria values are based on a daily fish consumption rate of 6.5 grams/day and a risk level of 10-6. A risk level is an estimate of the number of cases of adverse health effects (cancer, for example) that could be caused by exposure to a specific contaminant. At a risk level of 10-6, one person in a million would be expected to contract cancer due to long-term exposure to a specific contaminant.
Page 15
The criteria used by Ecology for toxic contaminants in fish tissue are essentially the NTR water column criteria expressed as a tissue concentration (Ecology, 2006). These tissue concentrations are derived by multiplying the NTR water quality criteria for “human health for consumption of organisms only” by the bioconcentration factor (BCF) for the specific contaminant. The BCFs for specific contaminants are found in EPA’s 1980 Ambient Water Quality Criteria documents (EPA, 1980).
EPA Recommended Water Quality Criteria EPA has published National Recommended Water Quality Criteria for some substances such as mercury and pesticides (EPA, 2001, 2002, and 2003). These recommended criteria are updates to previously developed criteria that occur on an ongoing basis. EPA recommends these criteria be used when states and tribes revise their regulatory criteria. These EPA recommended criteria are not regulatory levels. Most of EPA’s Recommended Water Quality Criteria are based on a daily fish consumption rate of 17.5 grams/day and a risk level of 10-6.
EPA Screening Values Screening values (SVs) for carcinogenic and non-carcinogenic effects of substances were developed by EPA to help prioritize areas that may present risks to humans from fish consumption. The EPA SVs are considered guidance only; they are not regulatory thresholds (EPA, 2000). The approach in developing the EPA SVs was similar to the approach used for developing the NTR, yet differs in two key assumptions:
• A cancer risk level of 10-5. • Two consumption rates: 17.5 grams/day for recreational fishers and 142.4 grams/day for
subsistence fishers.
Page 16
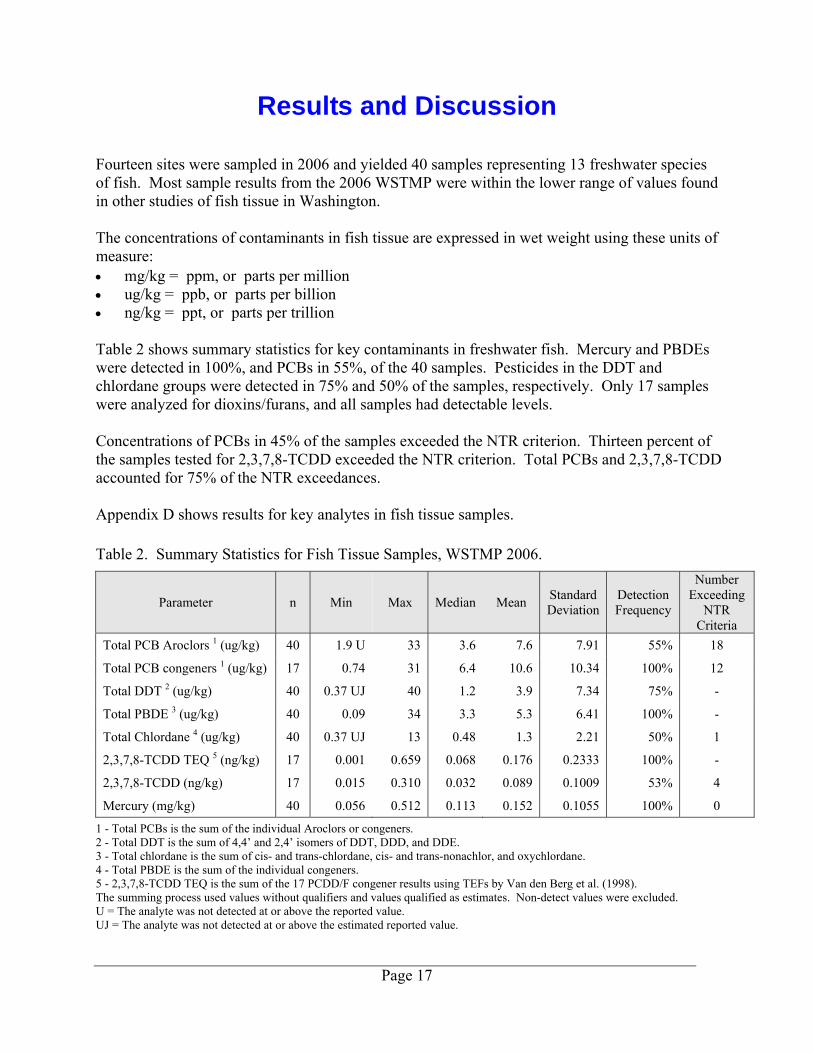
Results and Discussion Fourteen sites were sampled in 2006 and yielded 40 samples representing 13 freshwater species of fish. Most sample results from the 2006 WSTMP were within the lower range of values found in other studies of fish tissue in Washington. The concentrations of contaminants in fish tissue are expressed in wet weight using these units of measure: • mg/kg = ppm, or parts per million • ug/kg = ppb, or parts per billion • ng/kg = ppt, or parts per trillion Table 2 shows summary statistics for key contaminants in freshwater fish. Mercury and PBDEs were detected in 100%, and PCBs in 55%, of the 40 samples. Pesticides in the DDT and chlordane groups were detected in 75% and 50% of the samples, respectively. Only 17 samples were analyzed for dioxins/furans, and all samples had detectable levels. Concentrations of PCBs in 45% of the samples exceeded the NTR criterion. Thirteen percent of the samples tested for 2,3,7,8-TCDD exceeded the NTR criterion. Total PCBs and 2,3,7,8-TCDD accounted for 75% of the NTR exceedances. Appendix D shows results for key analytes in fish tissue samples. Table 2. Summary Statistics for Fish Tissue Samples, WSTMP 2006.
Parameter n Min Max Median Mean Standard Deviation
Detection Frequency
Number Exceeding
NTR Criteria
Total PCB Aroclors 1 (ug/kg) 40 1.9 U 33 3.6 7.6 7.91 55% 18
Total PCB congeners 1 (ug/kg) 17 0.74 31 6.4 10.6 10.34 100% 12
Total DDT 2 (ug/kg) 40 0.37 UJ 40 1.2 3.9 7.34 75% -
Total PBDE 3 (ug/kg) 40 0.09 34 3.3 5.3 6.41 100% -
Total Chlordane 4 (ug/kg) 40 0.37 UJ 13 0.48 1.3 2.21 50% 1
2,3,7,8-TCDD TEQ 5 (ng/kg) 17 0.001 0.659 0.068 0.176 0.2333 100% -
2,3,7,8-TCDD (ng/kg) 17 0.015 0.310 0.032 0.089 0.1009 53% 4
Mercury (mg/kg) 40 0.056 0.512 0.113 0.152 0.1055 100% 0
1 - Total PCBs is the sum of the individual Aroclors or congeners. 2 - Total DDT is the sum of 4,4’ and 2,4’ isomers of DDT, DDD, and DDE. 3 - Total chlordane is the sum of cis- and trans-chlordane, cis- and trans-nonachlor, and oxychlordane. 4 - Total PBDE is the sum of the individual congeners. 5 - 2,3,7,8-TCDD TEQ is the sum of the 17 PCDD/F congener results using TEFs by Van den Berg et al. (1998). The summing process used values without qualifiers and values qualified as estimates. Non-detect values were excluded. U = The analyte was not detected at or above the reported value. UJ = The analyte was not detected at or above the estimated reported value.
Page 17
Contaminants in Freshwater Fish Mercury Mercury was detected in all samples, yet none of the samples exceeded the NTR criterion of 0.825 mg/kg. The range of values was similar to those seen in other mercury monitoring efforts in Washington (Serdar et al., 2001; Fischnaller et al., 2003; Furl et al., 2007; Furl, 2007). Larger piscivorous (fish-eating) fish tended to have higher mercury levels. The highest levels of mercury, greater than EPA’s Recommended Water Quality Criterion for methylmercury of 0.300 mg/kg (EPA, 2001), were found in largemouth bass from Meridian (0.512 mg/kg) and Eloika Lakes (0.325 mg/kg) and northern pikeminnow from Mason Lake (0.450 mg/kg). Fish from these and other sites having mercury levels greater than 0.200 mg/kg, yet less than 0.300 mg/kg, were largemouth bass, peamouth, and pygmy whitefish. PCBs PCBs were detected in 55% of the samples with 45% of the samples exceeding the NTR criterion of 5.3 ug/kg total PCBs. The highest levels of total PCBs were found in kokanee and largemouth bass from Meridian Lake (32.5 ug/kg Aroclors and 31.4 ug/kg congeners), brown trout from Long Lake (26.7 ug/kg Aroclors and 30.5 ug/kg congeners), and rainbow trout from Ballinger Lake (26 ug/kg Aroclors and 30.2 ug/kg congeners). Fish from the remaining sites had total PCB levels below 20 ug/kg. Dioxins and Furans (PCDD/Fs) Dioxins and furans were detected in all samples tested yet only 12% of samples exceeded the NTR criterion for 2,3,7,8-TCDD of 0.07 ng/kg. The highest levels of 2,3,7,8-TCDD were found in Sawyer Lake cutthroat trout (0.31 ng/kg), Ballinger Lake rainbow trout (0.27 ng/kg), Sawyer Lake rainbow trout (0.23 ng/kg), Long Lake brown trout (0.19 ng/kg), and Meridian Lake kokanee (0.17 ng/kg). Corresponding 2,3,7,8-TCDD TEQ values for these samples ranged from 0.044 – 0.659 ng/kg. Chlorinated Pesticides The most frequently detected chlorinated pesticides were 4,4’-DDE, 4,4’-DDD, hexachlorobenzene, trans-nonachlor, cis-chlordane, and dieldrin. Eleven other pesticides or breakdown products were detected at frequencies less than 10%. While DDT compounds were detected in 75% of the samples, none of the samples exceeded NTR criteria for individual DDT compounds. The highest levels of total DDT were found in fish from Palmer Lake: kokanee (40.4 ug/kg), common carp (22.2 ug/kg), and largemouth bass (13 ug/kg). The sample with the next highest total DDT level was Meridian Lake kokanee (10.2 ug/kg). The remaining sites had fish containing less than 10 ug/kg total DDT. DDT
Page 18

compounds found in this 2006 study were at lower levels than found in other studies in Washington. Hexachlorobenzene was detected in 70% of the samples. Two samples exceeded the NTR criterion of 6.7 ug/kg for hexachlorobenzene: kokanee (15 ug/kg) and largemouth bass (9.5 ug/kg) from Meridian Lake. Brown trout from Long Lake and rainbow trout from Sawyer Lake had hexachlorobenzene levels of 6.7 and 6.4 ug/kg, respectively, which are slightly below the NTR criterion. Chlordane was detected in half of the 40 samples, with only one exceeding the NTR criterion of 8.3 ug/kg: Meridian Lake kokanee with total chlordane of 13.0 ug/kg. Meridian Lake largemouth bass had the next highest level with 5.6 ug/kg total chlordane. Dieldrin was found in ten samples with three samples exceeding the NTR criterion of 0.65. Kokanee and largemouth bass from Meridian Lake had levels of 7.3 and 2.3 ug/kg, respectively, and largemouth bass from Ballinger Lake had 1.3 ug/kg dieldrin. Toxaphene in kokanee (15 ug/kg) and largemouth bass (11 ug/kg) from Meridian Lake exceeded the NTR criterion of 9.8 ug/kg. PBDE Flame Retardants PBDEs were detected in all fish tissue samples with most samples having less than 15 ug/kg total PBDEs. Fish from Meridian Lake had the highest levels of total PBDEs: kokanee with 39 ug/kg and largemouth bass with19 ug/kg. The kokanee value ranks in the highest 10% of values (> 31 ug/kg) found during a survey of PBDEs in Washington (Johnson et al., 2006).
Page 19

Comparisons to Historical Data Two sites sampled in 2006 had been studied in the past: Ward Lake in 1992 and 1999 (Serdar et al., 1994; Serdar, 1999) and Sammamish Lake in 1992 (Serdar et al., 1994). A mix of species was collected at each site, and some contaminants were analyzed in common across years and species. The 1992 study included some analyses of contaminants in sediment. At Ward Lake, largemouth bass and kokanee data from the different studies provide limited comparisons due to differences in analytical methods, reporting limits, season of collection, and fish size. The 1992 samples were also prepared differently (skin-off fillets) from the 1999 and 2006 samples (skin-on fillets). Table 3 shows sample characteristics and results for analytes that were commonly detected among the different studies. Table 3. Comparison of Historical to Recent Fish Tissue Data from Ward Lake.
Species Largemouth bass Kokanee
Date Collected 11/12/92 3/31/99 10/31/06 6/5/99 10/31/06
Total Length (mm) 224 344 273 260 399
Total Weight (g) 150 715 300 162 646
Lipids 0.13% 0.1% 0.46% 9.4% 1.5%
Total PCB Aroclors (ug/kg) 99 U 19.1 J 2 U 18.4 J 11.4 J
Total DDT (ug/kg) 4 J na 1.44 na 8.2
Hexachlorobenzene (ug/kg) 10 U na 1.4 J na 5.5 J
Mercury (mg/kg) 0.35 J na 0.184 na 0.096
Sample ID 92438042 99178105 07014254 99238112 07014253
No. fish/composite 5 8 5 5 5
U = The analyte was not detected at or above the reported value. J = The analyte was positively identified. The associated numerical result is an estimate.
For largemouth bass, the level of total DDT seen in 1992 (estimated at 4 ug/kg) is comparable to the level of 1.4 ug/kg seen in 2006. Mercury in the 1992 sample (0.35 ug/kg) was qualified as an estimate and was about twice as high as that seen in the 2006 sample (0.184 ug/kg). The level of total PCBs found in Ward Lake largemouth bass collected in 1999 (19.1 ug/kg) is about nine times the level found in 2006. Fish size likely contributes to this difference. Note that the 1999 fish (mean weight = 715 g) were about 2.4 times heavier than the 2006 fish (mean weight = 300 g). Also, the mean length of fish used in the 1999 sample was about 1.3 times larger than that for the 2006 sample. Lipid content among all three samples appears similar. Comparisons of results for Ward Lake kokanee are confounded by different lipid content, size, and season of collection. Lipid content in the 2006 fish (1.5%) collected in the fall was much lower than lipids in the 1999 fish (9.4%) which were collected in the spring. The fish from 2006
Page 20
were about 1.5 times longer and nearly four times heavier than those collected in 1999. Given these differences, concentrations of total PCBs in Ward Lake kokanee appear similar between the 1999 and 2006 samples which were estimated at 18.4 and 11.4 ug/kg, respectively. Comparison of results from Sammamish Lake was not pursued because of differences in the size of largemouth bass, the only species analyzed in both 1992 and 2006. The mean lengths and weights for the samples were: 177 mm and 86 grams for the 1992 sample; and 381 mm and 1013 grams for the 2006 sample.
Water Quality Standards Exceeded Eleven of the 14 sites where fish were collected had fish tissue that did not meet one or more NTR criteria. Total PCBs and 2,3,7,8-TCDD accounted for 75% of these exceedances. The other exceedances were due to dieldrin, total chlordane, hexachlorobenzene, and toxaphene. Table 4 shows the 20 cases recommended for Category 5 classification, Does Not Meet Criteria, in Ecology’s 303(d) assessment method (Ecology, 2006). A total of seven sites had fish where 2,3,7,8-TCDD TEQs levels exceeded the NTR criterion for 2,3,7,8-TCDD. Ecology recently changed how dioxin/furan data are used for the 303(d) assessment method (Ecology, 2006), and TEQ values are no longer used for Category 5 classification. Therefore, these seven cases are recommended for Category 2 classification, Waters of Concern (Table 4, last column on right). Five sample analyses for toxaphene, heptachlor epoxide, and 2,3,7,8-TCDD could not be compared to NTR criteria because the analyte was not detected at reporting limits that were greater than the respective criteria. These cases are recommended for a Category 3 classification, Lack of Sufficient Data. The remaining results (n=711) that met NTR criteria are recommended for Category 1 classification, Meets Tested Criteria.
Site Scoring and Ranking In order to compare results across many species and sites, a scoring and ranking method was used. The scoring method used results for key contaminants that had high frequencies of detection and/or exceeded their respective benchmark values. The sample and site scores give an overall picture of how far contaminant levels in fish are above benchmark values. This scoring and ranking method has not been applied to results from other fish tissue study results conducted in Washington, so a statewide perspective is limited to sites sampled by the WSTMP from 2004 through 2006.
Page 21
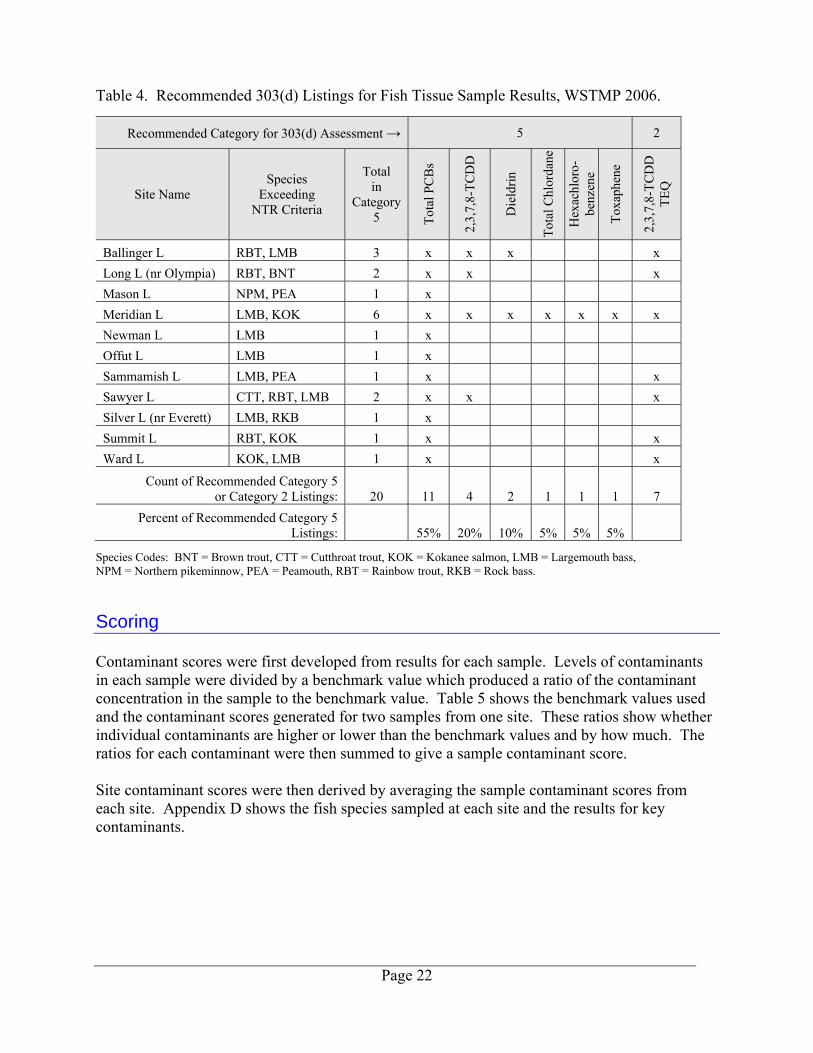
Table 4. Recommended 303(d) Listings for Fish Tissue Sample Results, WSTMP 2006.
Recommended Category for 303(d) Assessment → 5 2
Site Name Species
Exceeding NTR Criteria
Total in
Category 5 To
tal P
CB
s
2,3,
7,8-
TCD
D
Die
ldrin
Tota
l Chl
orda
ne
Hex
achl
oro-
be
nzen
e
Toxa
phen
e
2,3,
7,8-
TCD
D
TEQ
Ballinger L RBT, LMB 3 x x x x Long L (nr Olympia) RBT, BNT 2 x x x Mason L NPM, PEA 1 x Meridian L LMB, KOK 6 x x x x x x x Newman L LMB 1 x Offut L LMB 1 x Sammamish L LMB, PEA 1 x x Sawyer L CTT, RBT, LMB 2 x x x Silver L (nr Everett) LMB, RKB 1 x Summit L RBT, KOK 1 x x Ward L KOK, LMB 1 x x
Count of Recommended Category 5 or Category 2 Listings: 20 11 4 2 1 1 1 7 Percent of Recommended Category 5
Listings: 55% 20% 10% 5% 5% 5% Species Codes: BNT = Brown trout, CTT = Cutthroat trout, KOK = Kokanee salmon, LMB = Largemouth bass, NPM = Northern pikeminnow, PEA = Peamouth, RBT = Rainbow trout, RKB = Rock bass.
Scoring Contaminant scores were first developed from results for each sample. Levels of contaminants in each sample were divided by a benchmark value which produced a ratio of the contaminant concentration in the sample to the benchmark value. Table 5 shows the benchmark values used and the contaminant scores generated for two samples from one site. These ratios show whether individual contaminants are higher or lower than the benchmark values and by how much. The ratios for each contaminant were then summed to give a sample contaminant score. Site contaminant scores were then derived by averaging the sample contaminant scores from each site. Appendix D shows the fish species sampled at each site and the results for key contaminants.
Page 22

Table 5. Example Calculation of Contaminant Scores for Samples and Sites Using the Meridian Lake Site near Kent, WSTMP 2006.
Contaminant Benchmark Value 1
Sample Result Value
Benchmark Exceedance
Factor
KOK LMB KOK LMB
Total PCB Aroclors (ppb) 5.3 32.5 24.7 6.1 4.7
Total DDT (ppb) 2 32 10.2 8.0 0.3 0.3
Total PBDE (ppb) 3 31.0 33.6 19.13 1.1 0.6
Total Chlordane (ppb) 8.3 13.0 5.6 1.6 0.7
2,3,7,8-TCDD TEQ (ppt) 4 0.07 0.659 na 9.4 na
Mercury (ppm) 0.825 0.115 0.512 0.1 0.6
Dieldrin (ppb) 0.65 6.8 2.3 10.5 3.5
Sample Contaminant Score: 29.1 10.4
Site Contaminant Score: 5 19.7 1 – Benchmark values are the NTR criterion value unless noted otherwise. 2 – Benchmark value is the NTR criterion for both 4,4'-DDE and 4,4'-DDT, the compounds which usually contribute the most to total DDT value. 3 – Benchmark value is the 90th percentile from a statewide study of PBDEs (Johnson, et al., 2006). 4 – Benchmark value is the NTR criterion for the single congener 2,3,7,8-TCDD. 5 – The site contaminant score is the mean of the sample contaminant scores from that site. na - Not analyzed, excluded from calculations. Species Codes: KOK - Kokanee, LMB - Largemouth bass
Contaminant scores for individual samples ranged from 1.1 for Newman Lake bluegill, where samples did not exceed any benchmark values, to 19.7 for Meridian Lake kokanee, where benchmark values were exceeded for five of the seven key contaminants. Overall, the 2006 sample contaminant scores were in the lower range of all scores from the 2004 through 2006 samples. The median score for all 2006 samples was 2.2 (includes dioxin/furan results). PCBs, 2,3,7,8-TCDD TEQ, and dieldrin contributed most to these scores. For example, the 2,3,7,8-TCDD TEQ value of ng/kg in Ballinger Lake rainbow trout exceeded the benchmark value of 0.07 ng/kg by a factor of 9.3, accounting for about 58% of that sample’s contaminant score of 15.9.
Page 23

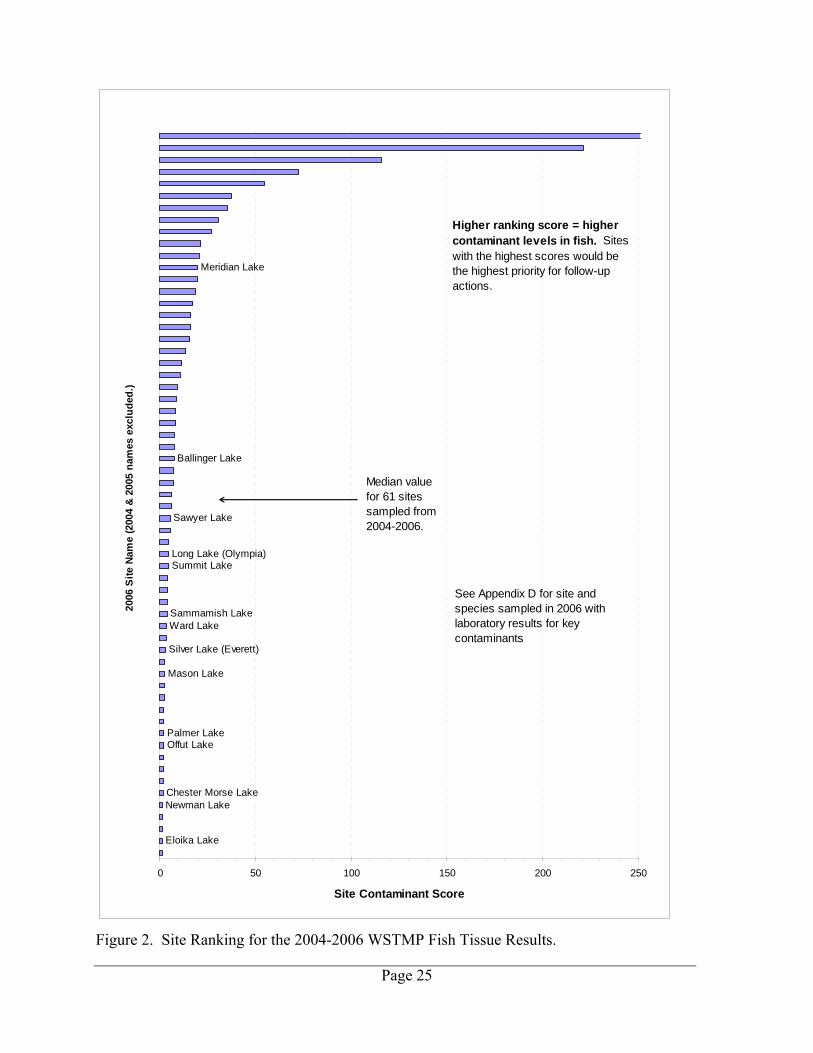
Ranking Site contaminant scores were ranked from high to low to show the relative amount of contamination in fish from sampled sites. Figure 2 shows site contaminant scores for the 2004-2006 results with the focus on the 2006 sites. Site contaminant scores ranged from 1.3 (Eloika Lake) to 19.7 (Meridian Lake): the median score for sites was 3.1. Most sites had at least one sample that exceeded NTR criteria as described earlier and shown in Table 4. The sites with the highest contaminant scores for 2006 include Meridian, Ballinger, Sawyer, and Long Lakes. The species having higher levels of contamination at these sites include kokanee, rainbow trout, brown trout, largemouth bass, and cutthroat trout. Overall, the 2006 site contaminant scores were in the lower half of the ranking for all 2004-2006 sites. The 2004 and 2005 WSTMP site ranking was discussed in a previous report (Seiders et al., 2007). The site ranking presented here was done using PCDD/F data in scoring, although only about half of the samples were analyzed for PCDD/Fs. Sites were also ranked without using PCDD/F data to see how much rankings would change. Excluding the PCDD/F data had a minor effect on the overall ranking.
Page 24
Eloika Lake
Newman LakeChester Morse Lake
Offut LakePalmer Lake
Mason Lake
Silver Lake (Everett)
Ward LakeSammamish Lake
Summit LakeLong Lake (Olympia)
Sawyer Lake
Ballinger Lake
Meridian Lake
0 50 100 150 200 250
E lo ik a L a k e
N e w m a n L a k e
C h e ste r M o rse L a k e
O ffu t L a k e
P a lm e r L a k e
M a so n L a k e
S ilv e r L a k e (E v e re tt)
W a rd L a k e
S a m ma m ish L a k e
S u m m it L a k e
L o n g L a k e (O lym p ia )
S a w ye r L a k e
B a llin g e r L a k e
M e rid ia n L a k e
2006
Site
Nam
e (2
004
& 20
05 n
ames
exc
lude
d.)
Site Contaminant Score
Median value for 61 sites sampled from 2004-2006.
See Appendix D for site and species sampled in 2006 with laboratory results for key contaminants
Higher ranking score = higher contaminant levels in fish. Sites with the highest scores would be the highest priority for follow-up actions.
Figure 2. Site Ranking for the 2004-2006 WSTMP Fish Tissue Results.
Page 25

This page is purposely left blank
Page 26
Conclusions During 2006, PCBs, dioxin/furans, chlorinated pesticides, PBDE flame retardants, and mercury were frequently detected in 40 samples of fish from 14 lakes across Washington State. A total of 27 of the 40 samples, from 11 of the 14 lakes, did not meet National Toxics Rule (NTR) criteria for contaminants in fish tissue. Total PCBs and 2,3,7,8-TCDD accounted for 75% of these exceedances. Other contaminants exceeding NTR criteria were dieldrin, total chlordane, hexachlorobenzene, and toxaphene. The highest levels of contamination were in fish from lakes in or near urbanized areas: Meridian, Ballinger, Sawyer, and Long Lakes.
Recommendations The Washington State Department of Health, local health jurisdictions, and affected tribes should (1) evaluate the levels of toxic contaminants found during this 2006 study, and (2) determine the need for additional sampling to assess the risks to human health from the consumption of contaminated fish. Ecology should review the fish tissue data from the 11 lakes listed in Table 4 for placement of these lakes in Categories 5 and 2 of Washington State’s 303(d) assessment. Other results from this 2006 sampling effort should be reviewed and the corresponding lakes placed in Categories 1 and 3 of the 303(d) assessment. Ecology should determine what actions to take for the most contaminated lakes identified in 2006, particularly Meridian Lake.
Page 27
References ATSDR, 1999. Toxicological Profile for Mercury. Agency for Toxic Substances and Disease Registry, Atlanta, GA: U.S. Department of Health and Human Services, Public Health Service. www.atsdr.cdc.gov/toxprofiles/tp46.html ATSDR, 2000. Toxicological Profile for Polychlorinated Biphenyls (PCBs). Agency for Toxic Substances and Disease Registry, Atlanta, GA: U.S. Department of Health and Human Services, Public Health Service. www.atsdr.cdc.gov/toxprofiles/tp17.html ATSDR, 2006. Dioxins. ToxFAQs™: Chemical Agent Briefing Sheets (CABS). Agency for Toxic Substances and Disease Registry, Atlanta, GA: U.S. Department of Health and Human Services, Public Health Service. www.atsdr.cdc.gov/cabs/dioxins/index.html Bloom, N., 1995. Considerations in the analysis of water and fish for mercury. In National Forum on Mercury in Fish: Proceedings. U.S. Environmental Protection Agency, Office of Water, Washington D.C. EPA Publication 823-R-95-002. Ecology, 2006. Water Quality Program Policy 1-11: Assessment of Water Quality for the Clean Water Act Sections 303(d) and 305(b) Integrated Report. September 6, 2006. Water Quality Program, Washington State Department of Ecology, Olympia, WA. www.ecy.wa.gov/programs/wq/303d/2006/wqp01-11-ch1_final2006.pdf Ecology and DOH, 2003. Washington State Mercury Chemical Action Plan. Washington State Department of Ecology, and Washington State Department of Health, Olympia, WA. Ecology Publication No. 03-03-001. www.ecy.wa.gov/biblio/0303001.html www.ecy.wa.gov/programs/eap/pbt/mercuryplan.html Ecology and DOH, 2006. Washington State Polybrominated Diphenyl Ether (PBDE) Chemical Action Plan: Final Plan. Washington State Department of Ecology, and Washington State Department of Health, Olympia, WA. Ecology Publication No. 05-07-048. www.ecy.wa.gov/biblio/0507048.html EPA, 1980. Ambient Water Quality Criteria Documents. U.S. Environmental Protection Agency, Office of Water, Washington, D.C. Various EPA publication numbers. http://www.epa.gov/waterscience/criteria/library/ambientwqc/index.html EPA, 2000. Guidance for Assessing Chemical Contaminant Data for Use in Fish Advisories - Volume 1: Field Sampling and Analysis, Third Edition. U.S. Environmental Protection Agency, Office of Water, Washington, D.C. Publication No. EPA-823-B-00-007. www.epa.gov/ost/fishadvice/volume1/
Page 28
EPA, 2001. Water Quality Criterion for the Protection of Human Health: Methylmercury. U.S. Environmental Protection Agency, Office of Science and Technology, Washington, D.C. Publication No. EPA-823-R-01-001. EPA, 2002. National Recommended Water Quality Criteria: 2002. U.S. Environmental Protection Agency, Office of Science and Technology, Washington, D.C. Publication No. EPA-823-R-02-047. EPA, 2003. Revised National Recommended Water Quality Criteria for the Protection of Human Health. U.S. Environmental Protection Agency, Washington, D.C. www.epa.gov/waterscience/criteria/humanhealth/15table-fs.htm EPA, 2007. Mercury. U.S. Environmental Protection Agency, Washington, D.C. www.epa.gov/pesticides/ Accessed February 2007. Fischnaller, S., P. Anderson, and D. Norton, 2003. Mercury in Edible Fish Tissue and Sediments from Selected Lakes and Rivers of Washington State. Washington State Department of Ecology, Olympia, WA. Publication No. 03-03-026. www.ecy.wa.gov/biblio/0303026.html Furl, C., 2007. Measuring Mercury Trends in Freshwater Fish in Washington State: 2006 Sampling Results. Washington State Department of Ecology, Olympia, WA. Publication No. 07-03-043. www.ecy.wa.gov/biblio/0703043.html Furl, C., K. Seiders, D. Alkire, and C. Deligeannis, 2007. Measuring Mercury Trends in Freshwater Fish in Washington State: 2005 Sampling Results. Washington State Department of Ecology, Olympia, WA. Publication No. 07-03-007. www.ecy.wa.gov/biblio/0703007.html Johnson, A., K. Seiders, C. Deligeannis, K. Kinney, P. Sandvik, B. Era-Miller, and D. Alkire, 2006. PBDEs Flame Retardants in Washington Rivers and Lakes: Concentrations in Fish and Water, 2005-06. Washington State Department of Ecology, Olympia, WA. Publication No. 06-03-027. www.ecy.wa.gov/biblio/0603027.html McBride, D., 2006. Personal communication. Overview of Health’s and Ecology’s approach to fish tissue evaluation. March 16, 2006. Washington State Department of Health, Olympia, WA. Sandvik, P., 2006. Standard Operating Procedures for Resecting Finfish Whole Body, Body Parts or Tissue Samples, Version 1.0. Washington State Department of Ecology, Olympia, WA. SOP Number EAP007. www.ecy.wa.gov/programs/eap/qa/docs/ECY_EAP_SOP_FishTissueProcessing_v1_0.pdf Seiders, K., 2003. Washington State Toxics Monitoring Program: Toxic Contaminants in Fish Tissue and Surface Water in Freshwater Environments, 2001. Washington State Department of Ecology, Olympia, WA. Publication No. 03-03-012. www.ecy.wa.gov/biblio/0303012.html
Page 29
Page 30
Seiders, K. and B. Yake, 2002. Washington State Toxics Monitoring Program: Exploratory Monitoring of Toxic Contaminants in Edible Fish Tissue and Freshwater Environments of Washington State. Quality Assurance Project Plan. Washington State Department of Ecology, Olympia, WA. Publication No. 02-03-065. www.ecy.wa.gov/biblio/0203065.html Seiders, K., C. Deligeannis, and P. Sandvik, 2007. Washington State Toxics Monitoring Program: Toxic Contaminants in Fish Tissue and Surface Water in Freshwater Environments, 2004-2005. Washington State Department of Ecology, Olympia, WA. Publication No. 07-03-024. www.ecy.wa.gov/biblio/0703024.html Seiders, K., C. Deligeannis, and K. Kinney, 2006. Washington State Toxics Monitoring Program: Toxic Contaminants in Fish Tissue and Surface Water in Freshwater Environments, 2003. Washington State Department of Ecology, Olympia, WA. Publication No. 06-03-019. www.ecy.wa.gov/biblio/0603019.html Seiders, K. and K. Kinney, 2004. Washington State Toxics Monitoring Program: Toxic Contaminants in Fish Tissue and Surface Water in Freshwater Environments, 2002. Washington State Department of Ecology, Olympia, WA. Publication No. 04-03-040. www.ecy.wa.gov/biblio/0403040.html Serdar, D., A. Johnson, and D. Davis, 1994. Survey of Chemical Contaminants in Ten Washington Lakes. Washington State Department of Ecology, Olympia, WA. Publication No. 94-154. www.ecy.wa.gov/biblio/94154.html Serdar, D., 1999. PCB Concentrations in Fish from Ward Lake (Thurston County) and the Lower Elwha River. Washington State Department of Ecology, Olympia, WA. Publication No. 99-338. www.ecy.wa.gov/biblio/99338.html Serdar, D., J. Johnston, K. Mueller, and G. Patrick, 2001. Mercury Concentrations in Edible Muscle of Lake Whatcom Fish. Washington State Department of Ecology, Olympia, WA. Publication No. 01-03-012. www.ecy.wa.gov/biblio/0103012.html Van den Berg, M., L. Birnbaum, A. Bosveld et al., 1998. Toxic equivalency factors (TEFs) for PCBs, PCDDs, PCDFs, for humans and wildlife. Environmental Health Perspectives, 106 (12): 775-792.
Appendices
Page 31
This page is purposely left blank
Page 32

Appendix A. Site and Species Sampled: WSTMP 2006
Sample Site County WRIA Number Species Sampled Longitude Latitude
Ballinger Lake Snohomish 8 LMB, RBT, YP -122.3277 47.7826
Chester Morse Lake King 8 PWF -121.6979 47.3861
Eloika Lake Stevens 55 BC, LMB, YP -117.3799 48.0301
Long Lake Thurston 13 BNT, LMB, RBT, YP -122.7770 47.0218
Mason Lake Mason 14 NPM, PEA, YP -122.9580 47.3364
Meridian Lake King 9 KOK, LMB -122.1513 47.3627
Newman Lake Spokane 57 BC, BG, LMB, YP -117.1005 47.7739
Offut Lake Thurston 13 LMB, RBT, YP -122.8259 46.9174
Palmer Lake Okanogan 49 CCP, KOK, LMB -119.6209 48.9020
Sammamish Lake King 8 LMB, PEA, YP -122.0942 47.6031
Sawyer Lake King 9 CTT, LMB, RBT -122.0366 47.3321
Silver Lake King 8 LMB, RKB, YP -122.2091 47.8925
Summit Lake Thurston 14 KOK, RBT -123.1065 47.0552
Ward Lake Thurston 13 BG, LMB, KOK -122.8739 47.0091
WRIA = Water Resource Inventory Area. Latitude and longitude coordinates datum is NAD 83 HARN. Species Codes: BC = Black crappie, BG = Bluegill, BNT = Brown trout, CCP = Common carp, CTT = Cutthroat trout, KOK = Kokanee salmon, LMB = Largemouth bass, NPM = Northern pikeminnow, PEA = Peamouth, PWF = Pygmy whitefish, RBT = Rainbow trout, RKB = Rock bass, YP = Yellow perch.
Page 33
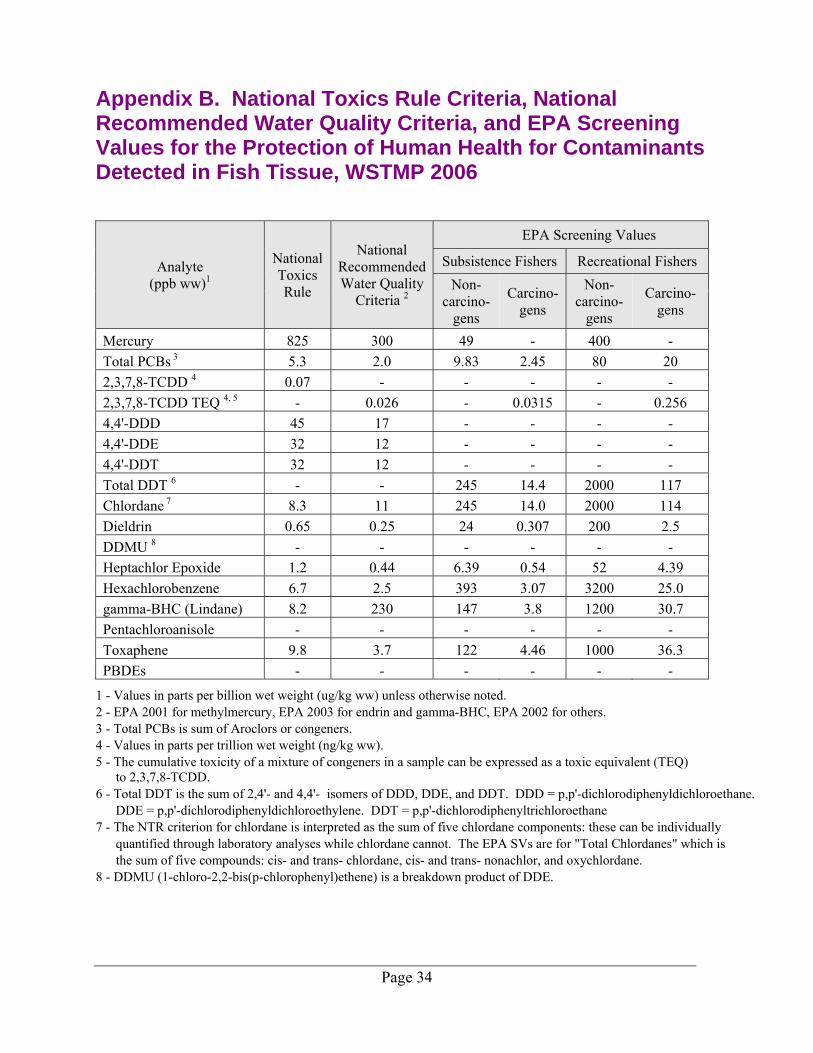
Appendix B. National Toxics Rule Criteria, National Recommended Water Quality Criteria, and EPA Screening Values for the Protection of Human Health for Contaminants Detected in Fish Tissue, WSTMP 2006
Analyte (ppb ww)1
National Toxics Rule
National Recommended Water Quality
Criteria 2
EPA Screening Values
Subsistence Fishers Recreational Fishers Non-
carcino- gens
Carcino- gens
Non- carcino-
gens
Carcino- gens
Mercury 825 300 49 - 400 - Total PCBs 3 5.3 2.0 9.83 2.45 80 20 2,3,7,8-TCDD 4 0.07 - - - - - 2,3,7,8-TCDD TEQ 4, 5 - 0.026 - 0.0315 - 0.256 4,4'-DDD 45 17 - - - - 4,4'-DDE 32 12 - - - - 4,4'-DDT 32 12 - - - - Total DDT 6 - - 245 14.4 2000 117 Chlordane 7 8.3 11 245 14.0 2000 114 Dieldrin 0.65 0.25 24 0.307 200 2.5 DDMU 8 - - - - - - Heptachlor Epoxide 1.2 0.44 6.39 0.54 52 4.39 Hexachlorobenzene 6.7 2.5 393 3.07 3200 25.0 gamma-BHC (Lindane) 8.2 230 147 3.8 1200 30.7 Pentachloroanisole - - - - - - Toxaphene 9.8 3.7 122 4.46 1000 36.3 PBDEs - - - - - -
1 - Values in parts per billion wet weight (ug/kg ww) unless otherwise noted. 2 - EPA 2001 for methylmercury, EPA 2003 for endrin and gamma-BHC, EPA 2002 for others. 3 - Total PCBs is sum of Aroclors or congeners. 4 - Values in parts per trillion wet weight (ng/kg ww). 5 - The cumulative toxicity of a mixture of congeners in a sample can be expressed as a toxic equivalent (TEQ) to 2,3,7,8-TCDD. 6 - Total DDT is the sum of 2,4'- and 4,4'- isomers of DDD, DDE, and DDT. DDD = p,p'-dichlorodiphenyldichloroethane. DDE = p,p'-dichlorodiphenyldichloroethylene. DDT = p,p'-dichlorodiphenyltrichloroethane 7 - The NTR criterion for chlordane is interpreted as the sum of five chlordane components: these can be individually quantified through laboratory analyses while chlordane cannot. The EPA SVs are for "Total Chlordanes" which is the sum of five compounds: cis- and trans- chlordane, cis- and trans- nonachlor, and oxychlordane. 8 - DDMU (1-chloro-2,2-bis(p-chlorophenyl)ethene) is a breakdown product of DDE.
Page 34
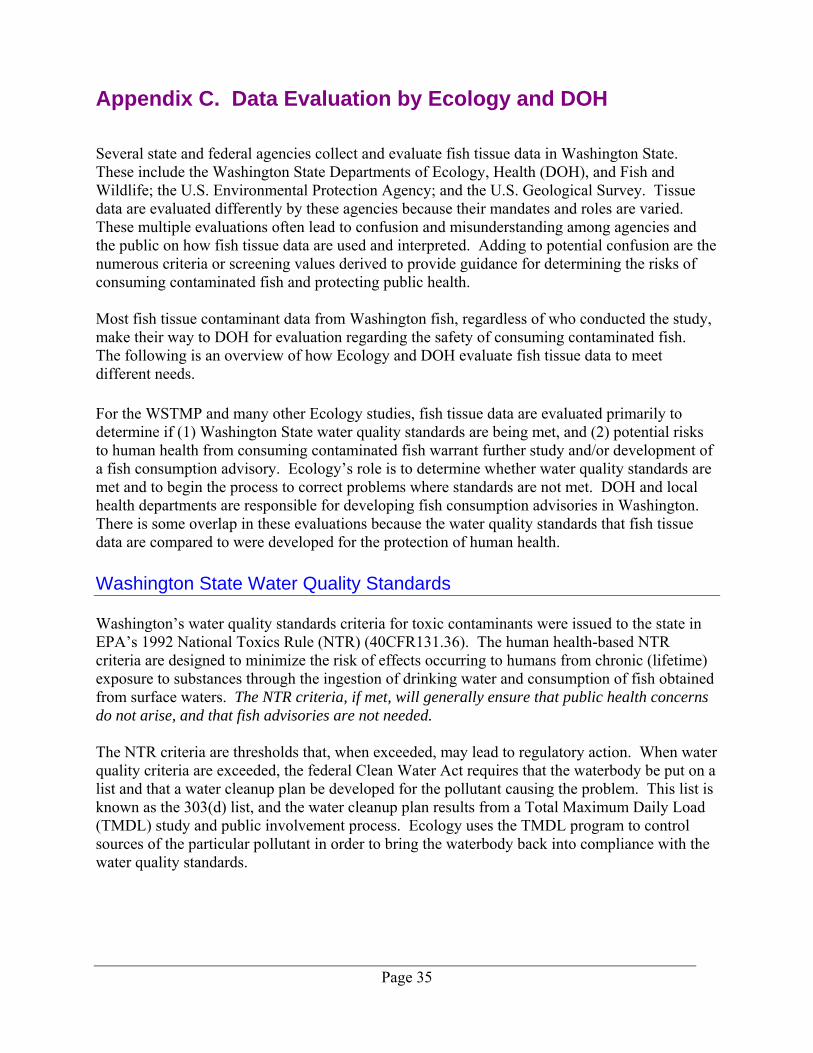
Appendix C. Data Evaluation by Ecology and DOH Several state and federal agencies collect and evaluate fish tissue data in Washington State. These include the Washington State Departments of Ecology, Health (DOH), and Fish and Wildlife; the U.S. Environmental Protection Agency; and the U.S. Geological Survey. Tissue data are evaluated differently by these agencies because their mandates and roles are varied. These multiple evaluations often lead to confusion and misunderstanding among agencies and the public on how fish tissue data are used and interpreted. Adding to potential confusion are the numerous criteria or screening values derived to provide guidance for determining the risks of consuming contaminated fish and protecting public health. Most fish tissue contaminant data from Washington fish, regardless of who conducted the study, make their way to DOH for evaluation regarding the safety of consuming contaminated fish. The following is an overview of how Ecology and DOH evaluate fish tissue data to meet different needs. For the WSTMP and many other Ecology studies, fish tissue data are evaluated primarily to determine if (1) Washington State water quality standards are being met, and (2) potential risks to human health from consuming contaminated fish warrant further study and/or development of a fish consumption advisory. Ecology’s role is to determine whether water quality standards are met and to begin the process to correct problems where standards are not met. DOH and local health departments are responsible for developing fish consumption advisories in Washington. There is some overlap in these evaluations because the water quality standards that fish tissue data are compared to were developed for the protection of human health. Washington State Water Quality Standards Washington’s water quality standards criteria for toxic contaminants were issued to the state in EPA’s 1992 National Toxics Rule (NTR) (40CFR131.36). The human health-based NTR criteria are designed to minimize the risk of effects occurring to humans from chronic (lifetime) exposure to substances through the ingestion of drinking water and consumption of fish obtained from surface waters. The NTR criteria, if met, will generally ensure that public health concerns do not arise, and that fish advisories are not needed. The NTR criteria are thresholds that, when exceeded, may lead to regulatory action. When water quality criteria are exceeded, the federal Clean Water Act requires that the waterbody be put on a list and that a water cleanup plan be developed for the pollutant causing the problem. This list is known as the 303(d) list, and the water cleanup plan results from a Total Maximum Daily Load (TMDL) study and public involvement process. Ecology uses the TMDL program to control sources of the particular pollutant in order to bring the waterbody back into compliance with the water quality standards.
Page 35

Risk Management Decisions While DOH supports Ecology’s use of the NTR criteria for identifying problems and controlling pollutant sources so that water quality will meet standards, DOH does not use the NTR criteria to establish fish consumption advisories (McBride, 2006). DOH uses an approach similar to that in EPA’s Guidance for Assessing Chemical Contaminant Data for use in Fish Advisories Vol. 1-4 for assessing mercury, PCBs, and other contaminants (EPA, 2000). These guidance documents provide a framework from which states can evaluate fish tissue data to develop fish consumption advisories, based on sound science and established procedures in risk assessment, risk management, and risk communication. Neither the NTR criteria, nor the Screening Values found in the EPA guidance documents above, incorporate the varied risk management decisions essential to developing fish consumption advisories. • Risk Assessment involves calculating allowable meal limits based on known fish
contaminant concentrations. These calculations are conducted for both non-cancer and cancer endpoints using the appropriate Reference Dose (RfD) or Cancer Slope Factor (CSF), if available. These initial calculations are the starting point for evaluating contaminant data to determine whether a fish advisory is warranted. Additionally, known or estimated consumption rates help determine the potential magnitude of exposure and highlight the sensitive groups or populations that may exist due to elevated consumption rates.
• Risk Management includes (but is not limited to) consideration of contaminant background
concentrations, reduction in contaminant concentrations through preparation and cooking techniques, known health benefits from fish consumption, contaminant concentrations or health risks associated with replacement foods, and cultural importance of fish. Other considerations are the possible health endpoints associated with a contaminant, the strength or weaknesses of the supporting toxicological or sampling data, and whether effects are transient or irreversible.
• Risk Communication is the outreach component of the fish advisory. The interpretation of
the data from the risk assessment and risk management components drives how and when the fish advisory recommendations are issued to the public, dependent on whether the message is targeted toward a sensitive group or a population or the general public. DOH’s dual objective is (1) how best to provide guidance to the public to increase fish consumption of fish low in contaminants to gain the benefits of eating fish, while (2) steering the public away from fish that have high levels of health-damaging contaminants.
Page 36

Appendix D. Summary of Fish Tissue Sample Results, WSTMP 2006
Site Species Code
MEL Sample ID
WSTMP Study Year
Date Collect
Ballinger L LMB 07014230 2006 11/13/06 12.8 J 2.43 4.2 J 1.87 J 0.063 0.82 283 378
Ballinger L RBT 07014231 2006 11/13/06 26 30.2 J 7.44 12.5 J 0.99 J 0.649 J 0.27 J 0.056 0.68 321 338
Ballinger L YP 07014232 2006 11/13/06 3.4 0.58 1.22 J 0.54 J 0.056 0.23 203 95
Chester Morse L PWF 07014271 2006 12/8/06 2 U 1.5 2.7 J 0.4 UJ 0.245 0.43 210 58
Eloika L BC 07014233 2006 9/26/06 2 U 0.39 UJ 0.11 J 0.39 UJ 0.11 0.98 248 245
Eloika L LMB 07014234 2006 9/26/06 2 U 0.5 0.36 J 0.4 UJ 0.325 0.29 470 1702
Eloika L YP 07014235 2006 9/26/06 2 U 0.4 UJ 0.28 0.4 UJ 0.099 0.17 226 142
Long L (nr Olympia) BNT 07014236 2006 11/8/06 26.7 J 30.5 J 5.15 10.04 J 0.56 J 0.493 J 0.19 J 0.15 2.09 442 822
Long L (nr Olympia) LMB 07014237 2006 11/8/06 1.9 U 0.69 2.45 J 1.2 J 0.15 0.31 233 170
Long L (nr Olympia) RBT 07014238 2006 11/8/06 2.4 UJ 5.8 J 1.1 1.87 J 0.39 UJ 0.003 J 0.032 U 0.1 0.21 307 245
Long L (nr Olympia) YP 07014239 2006 11/8/06 2 U 0.4 UJ 0.29 0.4 UJ 0.1 0.16 223 132
Mason L NPM 07014268 2006 9/19/06 8.3 J 10.1 J 4.9 6.5 J 0.63 J 0.049 J 0.015 U 0.45 0.85 373 476
Mason L PEA 07014269 2006 9/19/06 6.1 J 4 8.41 J 0.42 J 0.232 1.16 283 183
Mason L YP 07014270 2006 9/19/06 2 U 0.4 UJ 2.48 J 0.4 UJ 0.099 0.16 241 176
Meridian L KOK 07014255/4272 2006 10/5/06 32.5 J,m 31.4 J 10.2 J,m 33.6 J,m 13.0 J,m 0.6589 J 0.17 J 0.115 m 5.01 m 322 m 266 m
Meridian L LMB 07014256 2006 10/5/06 24.7 J 8.04 J 19.13 J 5.61 J 0.512 1.8 465 2066
Newman L BC 07014257 2006 9/27/06 2.4 J 0.76 4.4 0.39 UJ 0.076 0.51 252 257
Newman L BG 07014258 2006 9/27/06 2 U 0.39 UJ 0.41 0.39 UJ 0.059 0.19 180 126
Newman L LMB 07014259 2006 9/27/06 3.7 J 6.2 J 1.2 0.46 J 0.39 UJ 0.002 J 0.015 U 0.262 0.26 417 1179
Newman L YP 07014260 2006 9/27/06 2 U 0.39 UJ 1.8 J 0.39 UJ 0.096 0.1 201 82
Offut L LMB 07014261 2006 10/30/06 9.1 J 5.9 J 0.95 6.2 J 0.83 J 0.068 J 0.035 U 0.209 3.04 373 999
Offut L RBT 07014262 2006 10/30/06 2 U 1.3 J 0.4 UJ 0.63 J 0.4 UJ 0.008 J 0.025 U 0.064 0.74 230 122
Offut L YP 07014263 2006 10/30/06 1.9 U 0.39 UJ 3.1 J 0.39 UJ 0.07 0.2 304 371
Palmer L CCP 07014240 2006 10/17/06 1.9 UJ 0.7 J 22.2 0.09 J 0.39 UJ 0.001 J 0.03 U 0.15 2.45 431 1122
Palmer L KOK 07014241 2006 10/17/06 2 U 40.35 J 0.65 J 3.9 UJ 0.087 2.26 354 391
Palmer L LMB 07014242 2006 10/17/06 1.9 U 0.8 J 12.95 0.29 NJ 0.38 UJ 0.0005 J 0.022 U 0.297 0.96 440 1629
Sammamish L LMB 07014264/4265 2006 10/4/06 9.6 J,m 4.8 J 0.985 J,m 4.21 J,m 0.73 J,m 0.0325 J 0.025 J 0.294 m 0.75 m 376 m 977 m
Sammamish L PEA 07014267 2006 10/4/06 16.5 J 15.6 J 5.97 J 4.81 J 2.12 J 0.072 J 0.031 J 0.14 2.77 290 261
Sammamish L YP 07014266 2006 10/4/06 1.9 U 0.38 UJ 1.85 J 0.38 UJ 0.177 0.17 268 234
Sawyer L CTT 07014243/4244 2006 11/7/06 6.9 J,m 6.4 J,m 0.975 J,m 4.87 J,m 0.615 J,m 0.4584 J,m 0.31 J,m 0.155 m 1.42 m 320 m 273 m
Sawyer L LMB 07014245 2006 11/7/06 8.9 J 1.2 3.36 J 2.21 J 0.188 0.85 319 476
Sawyer L RBT 07014246 2006 11/7/06 10.7 J 7.4 J 2.05 6.05 J 1.5 J 0.044 J 0.23 U 0.13 3.21 272 166
Silver L (nr Everett) LMB 07014247 2006 11/14/06 13.9 J 1.9 J 12.8 J 0.71 J 0.076 0.78 240 212
Silver L (nr Everett) RKB 07014248 2006 11/14/06 8.9 J 1.17 J 10.69 J 0.37 UJ 0.058 0.27 187 123
Silver L (nr Everett) YP 07014249 2006 11/14/06 5 J 0.37 UJ 6.43 J 0.37 UJ 0.077 0.26 222 132
Summit L KOK 07014250 2006 11/16/06 9.7 J 1.5 6.46 J 3.5 J 0.077 0.84 322 308
Summit L RBT 07014251 2006 11/16/06 9.4 J 8.5 J 2 3.21 J 1 J 0.177 J 0.037 J 0.091 1.44 330 334
Ward L BG 07014252 2006 10/31/06 2 U 0.54 1.35 J 0.39 UJ 0.12 0.4 192 176
Ward L KOK 07014253 2006 10/31/06 11.4 J 10.9 J 8.2 14.48 J 1.79 J 0.180 J 0.054 J 0.096 1.49 399 646
Ward L LMB 07014254 2006 10/31/06 2 U 2.8 J 1.44 6.19 J 0.55 J 0.088 J 0.024 J 0.184 0.46 273 300
Tota
l PC
B a
rocl
or
(ug/
kg)
Tota
l PC
B c
onge
ners
(u
g/kg
)
Tota
l DD
T (u
g/kg
)
Tota
l PB
DE
(ug/
kg)
Tota
l Chl
orda
ne
(ug/
kg)
2,3,
7,8-
TCD
D T
EQ
(ng/
kg)
Mea
n W
eigh
t (g
)
2,3,
7,8-
TCD
D
(ng/
kg)
Mer
cury
(m
g/kg
)
Lipi
ds
(%)
Mea
n To
tal L
engt
h (m
m)
Qualified codes J = The analyte was positively identified. The associated numerical result is an estimate. NJ = The analyte was tentatively identified and the associated numerical value represents an approximate concentration. U = The analyte was not detected at or above the reported value. UJ = The analyte was not detected at or above the reported estimated result. m = mean value from analyses of field duplicates where two results are available. Where analysis was not done on only one sample, that sample result is given. Where both values were non-detect, the highest value was used. Where one duplicate was qualified as a non-detect (U, UJ), the reported value was used in determining the mean value. Species codes BC = Black crappie, BG = Bluegill, BNT = Brown trout, CCP = Common carp, CTT = Cutthroat trout, KOK = Kokanee salmon, LMB = Largemouth bass, NPM = Northern pikeminnow, PEA = Peamouth, PWF = Pygmy whitefish, RBT = Rainbow trout, RKB = Rock bass, YP = Yellow perch.
Page 37
Page 38
Appendix E. Health Information about Fish Fish is good food. Trying to balance the health benefits of fish with concerns about contaminant levels can be challenging, yet information is available to help consumers make healthy choices. Contaminants are found in most foods, and choosing fish wisely can be an excellent health choice. The key is to make smart choices and choose fish that are low in mercury, PCBs, and other contaminants. The American Heart Association recommends eating fish twice a week because fish are a great source of protein, vitamins, and nutrients. Fish are loaded with omega-3 fatty acids, which provide protection from heart disease and are great “brain food” for adults and children. A valuable source of information about eating fish is the Washington State Department of Health (DOH) website: www.doh.wa.gov/ehp/oehas/fish/default.htm
o Advice for women and children who eat fish. o Waterbody-specific fish consumption advisories in Washington. o How contaminants (mercury, PCBs, PBDEs, DDTs) get into fish. o How you can help reduce contaminants.
www.doh.wa.gov/ehp/oehas/fish/fishchart.htm
o Healthy fish eating guide. o Checklist to reduce contaminant exposure including the proper way to fillet and
prepare fish meals. o Health benefits of fish/recipes.
www.doh.wa.gov/ehp/oehas/fish/advisoriesmap.htm
o Fish and shellfish consumption advisories. The U.S. Environmental Protection Agency (EPA) and the Food and Drug Administration (FDA) also provide information on health benefits of fish: www.epa.gov/waterscience/fish/
o What you need to know about mercury - 10 frequently asked questions. www.cfsan.fda.gov/seafood1.html
o Seafood information and resources.