awb toxics tech report
TRANSCRIPT

Treatment Technology Review and Assessment
Association of Washington Business
Association of Washington Cities Washington State Association of Counties
December 4, 2013
500 108th Avenue NE Suite 1200 Bellevue, WA 98004-5549 (425) 450-6200


Association of Washington Business i Treatment Technology Review and Assessment 213512
Table of Contents Executive Summary .............................................................................................................. ES-1
1.0 Introduction ....................................................................................................................... 1
2.0 Derivation of the Baseline Study Conditions and Rationale for Selection of Effluent Limitations......................................................................................................................... 3
2.1 Summary of Water Quality Criteria ........................................................................... 3 2.2 Background .............................................................................................................. 3 2.3 Assumptions Supporting Selected Ambient Water Quality Criteria and Effluent
Limitations ................................................................................................................ 4
3.0 Wastewater Characterization Description ...................................................................... 9
3.1 Summary of Wastewater Characterization ............................................................... 9 3.2 Existing Wastewater Treatment Facility ................................................................... 9 3.3 Toxic Constituents .................................................................................................. 10
4.0 Treatment Approaches and Costs ................................................................................ 11
4.1 Summary of Treatment Approach and Costs ......................................................... 11 4.2 Constituent Removal – Literature Review .............................................................. 11
4.2.1 Polychlorinated Biphenyls .......................................................................... 11 4.2.2 Mercury ....................................................................................................... 12 4.2.3 Arsenic ........................................................................................................ 14 4.2.1 Polycyclic Aromatic Hydrocarbons ............................................................. 17
4.3 Unit Processes Evaluated ...................................................................................... 18 4.4 Unit Processes Selected ........................................................................................ 21
4.4.1 Baseline Treatment Process ...................................................................... 22 4.4.2 Advanced Treatment – MF/RO Alternative ................................................. 25 4.4.3 Advanced Treatment – MF/GAC Alternative .............................................. 29
4.5 Steady-State Mass Balance ................................................................................... 33 4.6 Adverse Environmental Impacts Associated with Advanced Treatment
Technologies .......................................................................................................... 34 4.7 Costs ...................................................................................................................... 36
4.7.1 Approach .................................................................................................... 36 4.7.2 Unit Cost Values ......................................................................................... 37 4.7.3 Net Present Value of Total Project Costs and Operations and Maintenance
Cost in 2013 Dollars ................................................................................... 38 4.7.4 Unit Cost Assessment ................................................................................ 39
4.8 Pollutant Mass Removal ......................................................................................... 44 4.9 Sensitivity Analysis ................................................................................................. 45
5.0 Summary and Conclusions ........................................................................................... 46
6.0 References ...................................................................................................................... 48
7.0 Appendices ..................................................................................................................... 52
ii Association of Washington Business 213512 Treatment Technology Review and Assessment
List of Tables
Table 1: Summary of Effluent Discharge Toxics Limits ................................................................ 7 Table 2. General Wastewater Treatment Facility Characteristics ................................................. 9 Table 3: Summary of Arsenic Removal Technologies1 ............................................................... 14 Table 4. Contaminants Removal Breakdown by Unit Process ................................................... 21 Table 5. Unit Processes Description for Each Alternative .......................................................... 23 Table 6. Brine Disposal Method Relative Cost Comparison ....................................................... 27 Table 7. Energy Breakdown for Each Alternative (5 mgd design flow) ....................................... 35 Table 8. Economic Evaluation Variables .................................................................................... 37 Table 9. Treatment Technology Total Project Costs in 2013 Dollars for a 5 mgd Facility .......... 38 Table 10. Treatment Technology Total Project Costs in 2013 Dollars for a 0.5 mgd Facility and a 25 mgd Facility ............................................................................................................................ 42 Table 11. Pollutant Mass Removal by Contaminant for a 5 mgd Facility .................................... 44 Table 12. Unit Cost by Contaminant for a 5 mgd Facility Implementing Advanced Treatment using MF/RO ............................................................................................................................... 45
List of Figures
Figure 1. Water Treatment Configuration for Arsenic Removal (WesTech) ................................ 15 Figure 2. WesTech Pressure Filters for Arsenic Removal .......................................................... 16 Figure 3. Baseline Flowsheet – Conventional Secondary Treatment ......................................... 24 Figure 4. Advanced Treatment Flowsheet – Tertiary Microfiltration and Reverse Osmosis ....... 28 Figure 5. Advanced Treatment Flowsheet – Tertiary Microfiltration and Granular Activated Carbon ........................................................................................................................................ 32 Figure 6. Primary Clarifier Inputs/Outputs ................................................................................... 33 Figure 7. Greenhouse Gas Emissions for Each Alternative ........................................................ 36 Figure 8: Capital Cost Curve Comparison for Baseline Treatment, MF/RO, and MF/GAC ........ 43 Figure 9: NPV Cost Curve Comparison for Baseline Treatment, MF/RO, and MF/GAC ............ 43
List of Appendices
Appendix A - Unit Process Sizing Criteria Appendix B - Greenhouse Gas Emissions Calculation Assumptions
Association of Washington Business iii Treatment Technology Review and Assessment 213512
Acronyms Acronym Definition AACE Association for the Advancement of Cost Engineering AOP advanced oxidation processes AWB Association of Washington Businesses BAC biological activated carbon BAP benzo(a)pyrene BOD biochemical oxygen demand BTU British thermal unit CEPT Chemically-enhanced primary treatment cf cubic feet CIP clean in place CRITFC Columbia River Inter-Tribal Fish Commission Ecology Washington Department of Ecology EPA U.S. Environmental Protection Agency FCR fish consumption rate g/day grams per day GAC granular activated carbon gal gallon gfd gallons per square foot per day GHG greenhouse gas gpd gallons per day gpm gallons per minute GWh giga watt hours HDR HDR Engineering, Inc. HHWQC human health water quality criteria HRT hydraulic residence time IPCC Intergovernmental Panel on Climate Change kg kilogram KWh/MG kilowatt-hours per million gallons lb pound MBR membrane bioreactor MCL maximum contaminant level MF microfiltration mgd million gallons per day mg/L milligrams per liter MMBTU million British thermal units MWh/d megawatt-hours per day NF nanofiltration ng/L nanograms per liter NPDES National Pollutant Discharge Elimination System NPV net present value O&M operations and maintenance ODEQ Oregon Department of Environmental Quality PAC powdered activated carbon PAH polycyclic aromatic hydrocarbons PCB polychlorinated biphenyls PE population equivalents PIX potable ion exchange
iv Association of Washington Business 213512 Treatment Technology Review and Assessment
Acronym Definition ppm parts per million RO reverse osmosis SDWA Safe Drinking Water Act sf square feet SGSP salinity gradient solar pond SRT solids retention time Study Partners Association of Washington Businesses/Association of Washington Cities and
Washington State Association of Counties consortium TDS total dissolved solids TMDL total maximum daily load TSS total suspended solids UF ultrafiltration µg/L micrograms per liter USDA U.S. Department of Agriculture UV ultraviolet WAC Washington Administrative Code WAS waste activated sludge WLA waste load allocation WWTP wastewater treatment plant ZLD zero liquid discharge

Association of Washington Business ES-1 Treatment Technology Review and Assessment 213512
Executive Summary This study evaluated treatment technologies potentially capable of meeting the State of Washington Department of Ecology’s (Ecology) revised effluent discharge limits associated with revised human health water quality criteria (HHWQC). HDR Engineering, Inc. (HDR) completed a literature review of potential technologies and an engineering review of their capabilities to evaluate and screen treatment methods for meeting revised effluent limits for four constituents of concern: arsenic, benzo(a)pyrene (BAP), mercury, and polychlorinated biphenyls (PCBs). HDR selected two alternatives to compare against an assumed existing baseline secondary treatment system utilized by dischargers. These two alternatives included enhanced secondary treatment with membrane filtration/reverse osmosis (MF/RO) and enhanced secondary treatment with membrane filtration/granulated activated carbon (MF/GAC). HDR developed capital costs, operating costs, and a net present value (NPV) for each alternative, including the incremental cost to implement improvements for an existing secondary treatment facility.
Currently, there are no known facilities that treat to the HHWQC and anticipated effluent limits that are under consideration. Based on the literary review, research, and bench studies, the following conclusions can be made from this study:
Revised HHWQC based on state of Oregon HHWQC (2001) and U.S. Environmental Protection Agency (EPA) “National Recommended Water Quality Criteria” will result in very low water quality criteria for toxic constituents.
There are limited “proven” technologies available for dischargers to meet required effluent quality limits that would be derived from revised HHWQC.
o Current secondary wastewater treatment facilities provide high degrees of removal for toxic constituents; however, they are not capable of compliance with water quality-based National Pollutant Discharge Elimination System (NPDES) permit effluent limits derived from the revised HHWQC.
o Advanced treatment technologies have been investigated and candidate process trains have been conceptualized for toxics removal.
Advanced wastewater treatment technologies may enhance toxics removal rates; however, they will not be capable of compliance with HHWQC-based effluent limits for PCBs. The lowest levels achieved based on the literature review were between <0.00001 and 0.00004 micrograms per liter (µg/L), as compared to a HHWQC of 0.0000064 µg/L.
Based on very limited performance data for arsenic and mercury from advanced treatment information available in the technical literature, compliance with revised criteria may or may not be possible, depending upon site specific circumstances.
Compliance with a HHWQC for arsenic of 0.018 µg/L appears unlikely. Most treatment technology performance information available in the literature is based on drinking water treatment applications targeting a much higher Safe Drinking Water Act (SDWA) maximum contaminant level (MCL) of 10 µg/L.
Compliance with a HHWQC for mercury of 0.005 µg/L appears to be potentially attainable on an average basis, but perhaps not if effluent limits are structured on a maximum monthly, maximum weekly or maximum daily basis. Some secondary treatment facilities attain average effluent mercury levels of 0.009 to 0.066 µg/L. Some treatment facilities with effluent filters attain average effluent mercury levels of 0.002 to 0.010 µg/L. Additional

ES-2 Association of Washington Business 213512 Treatment Technology Review and Assessment
advanced treatment processes are expected to enhance these removal rates, but little mercury performance data is available for a definitive assessment.
Little information is available to assess the potential for advanced technologies to comply with revised BAP criteria. A municipal wastewater treatment plant study reported both influent and effluent BAP concentrations less than the HHWQC of 0.0013 ug/L (Ecology, 2010).
o Some technologies may be effective at treating identified constituents of concern to meet revised limits while others may not. It is therefore even more challenging to identify a technology that can meet all constituent limits simultaneously.
o A HHWQC that is one order-of-magnitude less stringent could likely be met for mercury and BAP; however, it appears PCB and arsenic limits would not be met.
Advanced treatment processes incur significant capital and operating costs.
o Advanced treatment process to remove additional arsenic, BAP, mercury, and PCBs would combine enhancements to secondary treatment with microfiltration membranes and reverse osmosis or granular activated carbon and increase the estimated capital cost of treatment from $17 to $29 in dollars per gallon per day of capacity (based on a 5.0-million-gallon-per-day (mgd) facility).
o The annual operation and maintenance costs for the advanced treatment process train will be substantially higher (approximately $5 million - $15 million increase for a 5.0 mgd capacity facility) than the current secondary treatment level.
Implementation of additional treatment will result in additional collateral impacts.
o High energy consumption. o Increased greenhouse gas emissions. o Increase in solids production from chemical addition to the primaries. Additionally,
the membrane and GAC facilities will capture more solids that require handling. o Increased physical space requirements at treatment plant sites for advanced
treatment facilities and residuals management including reverse osmosis reject brine processing.
It appears advanced treatment technology alone cannot meet all revised water quality limits and implementation tools are necessary for discharger compliance.
o Implementation flexibility will be necessary to reconcile the difference between the capabilities of treatment processes and the potential for HHWQC driven water quality based effluent limits to be lower than attainable with technology
Table ES-1 indicates that the unit NPV cost for baseline conventional secondary treatment ranges from $13 to $28 per gallon per day of treatment capacity. The unit cost for the advanced treatment alternatives increases the range from the low $20s to upper $70s on a per gallon per-day of treatment capacity. The resulting unit cost for improving from secondary treatment to advanced treatment ranges between $15 and $50 per gallon per day of treatment capacity. Unit costs were also evaluated for both a 0.5 and 25 mgd facility. The range of unit costs for improving a 0.5 mgd from secondary to advanced treatment is $60 to $162 per gallon per day of treatment capacity. The range of unit costs for improving a 25 mgd from secondary to advanced treatment is $10 to $35 per gallon per day of treatment capacity.

Association of Washington Business ES-3 Treatment Technology Review and Assessment 213512
Table ES-1. Treatment Technology Costs in 2013 Dollars for a 5-mgd Facility
Alternative Total Construction Cost, 2013 dollars
($ Million)
O&M Net Present Value, 2013 dollars
($ Million)***
Total Net Present Value, 2013
dollars ($ Million)
NPV Unit Cost, 2013
dollars ($/gpd)
Baseline (Conventional Secondary Treatment)*
59 - 127 5 - 11 65 - 138 13 - 28
Incremental Increase to Advanced Treatment - MF/RO
48 - 104 26 - 56 75 - 160 15 - 32
Advanced Treatment - MF/RO**
108 - 231 31 - 67 139 - 298 28 - 60
Incremental Increase to Advanced Treatment - MF/GAC
71 - 153 45 - 97 117 - 250 23 - 50
Advanced Treatment - MF/GAC
131 - 280 50 - 108 181 - 388 36 - 78
* Assumed existing treatment for dischargers. The additional cost to increase the SRT to upwards of 30-days is about $12 - 20 million additional dollars in total project cost for a 5 mgd design flow.
** Assumes zero liquid discharge for RO brine management, followed by evaporation ponds. Other options are available as listed in Section 4.4.2.
*** Does not include the cost for labor.
mgd=million gallons per day MG=million gallons MF/RO=membrane filtration/reverse osmosis MF/GAC=membrane filtration/granulated activated carbon O&M=operations and maintenance Net Present Value = total financed cost assuming a 5% nominal discount rate over an assumed 25 year equipment life.
Costs presented above are based on a treatment capacity of 5.0 mgd, however, existing treatment facilities range dramatically across Washington in size and flow treated. The key differences in cost between the baseline and the advanced treatment MF/RO are as follows:
Larger aeration basins than the baseline to account for the longer SRT (>8 days versus <8 days).
Additional pumping stations to pass water through the membrane facilities and granulated activated carbon facilities. These are based on peak flows.
Membrane facilities (equipment, tanks chemical feed facilities, pumping, etc.) and replacement membrane equipment.
Granulated activated carbon facilities (equipment, contact tanks, pumping, granulated activated carbon media, etc.)
Additional energy and chemical demand to operate the membrane and granulated activated carbon facilities
Additional energy to feed and backwash the granulated activated carbon facilities.
Zero liquid discharge facilities to further concentrate the brine reject.
o Zero liquid discharge facilities are energy/chemically intensive and they require membrane replacement every few years due to the brine reject water quality.
Membrane and granulated activated carbon media replacement represent a significant maintenance cost.
ES-4 Association of Washington Business 213512 Treatment Technology Review and Assessment
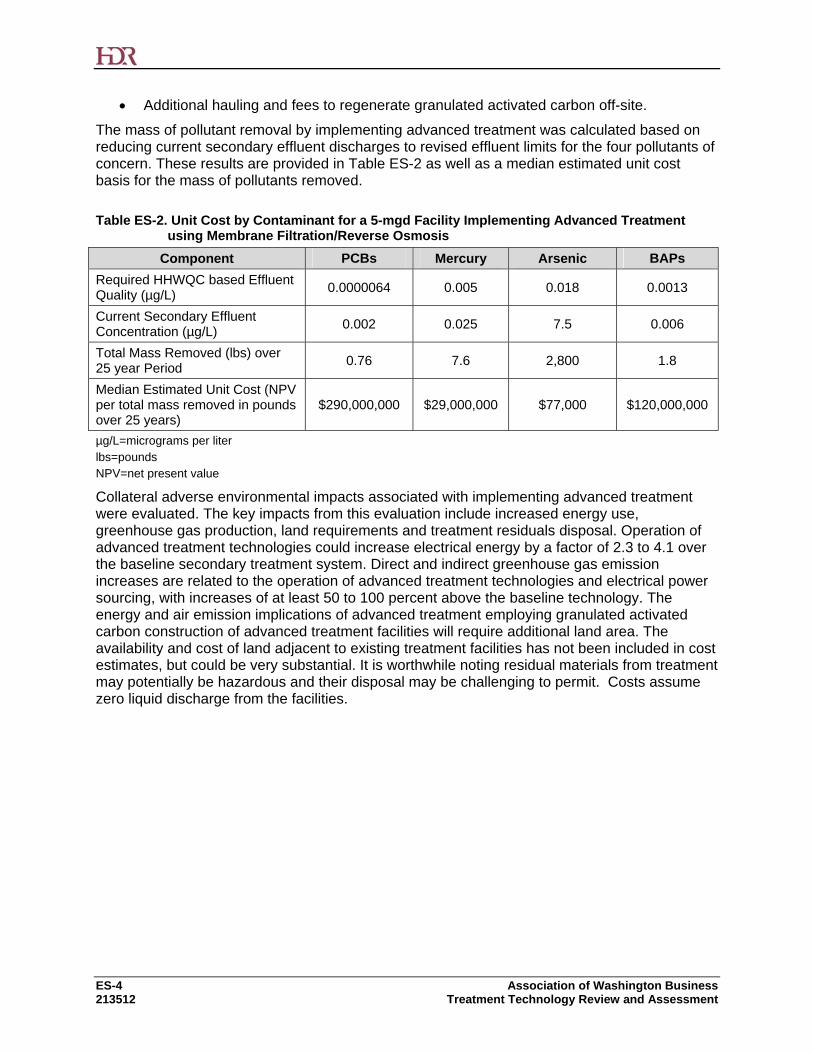
Additional hauling and fees to regenerate granulated activated carbon off-site.
The mass of pollutant removal by implementing advanced treatment was calculated based on reducing current secondary effluent discharges to revised effluent limits for the four pollutants of concern. These results are provided in Table ES-2 as well as a median estimated unit cost basis for the mass of pollutants removed.
Table ES-2. Unit Cost by Contaminant for a 5-mgd Facility Implementing Advanced Treatment using Membrane Filtration/Reverse Osmosis
Component PCBs Mercury Arsenic BAPs
Required HHWQC based Effluent Quality (µg/L)
0.0000064 0.005 0.018 0.0013
Current Secondary Effluent Concentration (µg/L)
0.002 0.025 7.5 0.006
Total Mass Removed (lbs) over 25 year Period
0.76 7.6 2,800 1.8
Median Estimated Unit Cost (NPV per total mass removed in pounds over 25 years)
$290,000,000 $29,000,000 $77,000 $120,000,000
µg/L=micrograms per liter lbs=pounds NPV=net present value
Collateral adverse environmental impacts associated with implementing advanced treatment were evaluated. The key impacts from this evaluation include increased energy use, greenhouse gas production, land requirements and treatment residuals disposal. Operation of advanced treatment technologies could increase electrical energy by a factor of 2.3 to 4.1 over the baseline secondary treatment system. Direct and indirect greenhouse gas emission increases are related to the operation of advanced treatment technologies and electrical power sourcing, with increases of at least 50 to 100 percent above the baseline technology. The energy and air emission implications of advanced treatment employing granulated activated carbon construction of advanced treatment facilities will require additional land area. The availability and cost of land adjacent to existing treatment facilities has not been included in cost estimates, but could be very substantial. It is worthwhile noting residual materials from treatment may potentially be hazardous and their disposal may be challenging to permit. Costs assume zero liquid discharge from the facilities.

Association of Washington Business 1 Treatment Technology Review and Assessment 213512
1.0 Introduction Washington’s Department of Ecology (Ecology) has an obligation to periodically review waterbody “designated uses” and to modify, as appropriate, water quality standards to ensure those uses are protected. Ecology initiated this regulatory process in 2009 for the human health-based water quality criteria (HHWQC) in Washington’s Surface Water Quality Standards (Washington Administrative Code [WAC] 173-201A). HHWQC are also commonly referred to as “toxic pollutant water quality standards.” Numerous factors will influence Ecology’s development of HHWQC. The expectation is that the adopted HHWQC will be more stringent than current adopted criteria. National Pollutant Discharge Elimination System (NPDES) effluent limits for permitted dischargers to surface waters are based on U.S. Environmental Protection Agency (EPA) and state guidance. Effluent limits are determined primarily from reasonable potential analyses and waste load allocations (WLAs) from total maximum daily loads (TMDLs), although the permit writer may use other water quality data. Water quality-based effluent limits are set to be protective of factors, including human health, aquatic uses, and recreational uses. Therefore, HHWQC can serve as a basis for effluent limits. The presumption is that more stringent HHWQC will, in time, drive lower effluent limits. The lower effluent limits will require advanced treatment technologies and will have a consequent financial impact on NPDES permittees. Ecology anticipates that a proposed revision to the water quality standards regulation will be issued in first quarter 2014, with adoption in late 2014.
The Association of Washington Businesses (AWB) is recognized as the state’s chamber of commerce, manufacturing and technology association. AWB members, along with the Association of Washington Cities and Washington State Association of Counties (collectively referred to as Study Partners), hold NPDES permits authorizing wastewater discharges. The prospect of more stringent HHWQC, and the resulting needs for advanced treatment technologies to achieve lower effluent discharge limits, has led this consortium to sponsor a study to assess technology availability and capability, capital and operations and maintenance (O&M) costs, pollutant removal effectiveness, and collateral environmental impacts of candidate technologies.
The “base case” for the study began with the identification of four nearly ubiquitous toxic pollutants present in many industrial and municipal wastewater discharges, and the specification of pollutant concentrations in well-treated secondary effluent. The pollutants are arsenic, benzo(a)pyrene (BAP), mercury and polychlorinated biphenyls (PCBs), which were selected for review based on available monitoring data and abundant presence in the environment. The purpose of this study is to review the potential water quality standards and associated treatment technologies able to meet those standards for four pollutants.
A general wastewater treatment process and wastewater characteristics were used as the common baseline for comparison with all of the potential future treatment technologies considered. An existing secondary treatment process with disinfection at a flow of 5 million gallons per day (mgd) was used to represent existing conditions. Typical effluent biochemical oxygen demand (BOD) and total suspended solids (TSS) were assumed between 10 and 30 milligrams per liter (mg/L) for such a facility and no designed nutrient or toxics removal was assumed for the baseline existing treatment process.
Following a literature review of technologies, two advanced treatment process options for toxics removal were selected for further evaluation based on the characterization of removal effectiveness from the technical literature review and Study Partners’ preferences. The two tertiary treatment options are microfiltration membrane filtration (MF) followed by either reverse osmosis (RO) or granular activated carbon (GAC) as an addition to an existing secondary treatment facility.
2 Association of Washington Business 213512 Treatment Technology Review and Assessment
The advanced treatment technologies are evaluated for their efficacy and cost to achieve the effluent limitations implied by the more stringent HHWQC. Various sensitivities are examined, including for less stringent adopted HHWQC, and for a size range of treatment systems. Collateral environmental impacts associated with the operation of advanced technologies are also qualitatively described.

Association of Washington Business 3 Treatment Technology Review and Assessment 213512
2.0 Derivation of the Baseline Study Conditions and Rationale for Selection of Effluent Limitations
2.1 Summary of Water Quality Criteria Surface water quality standards for toxics in the State of Washington are being updated based on revised human fish consumption rates (FCRs). The revised water quality standards could drive very low effluent limitations for industrial and municipal wastewater dischargers. Four pollutants were selected for study based on available monitoring data and abundant presence in the environment. The four toxic constituents are arsenic, BAP, mercury, and PCBs.
2.2 Background Ecology is in the process of updating the HHWQC in the state water quality standards regulation. Toxics include metals, pesticides, and organic compounds. The human health criteria for toxics are intended to protect people who consume water, fish, and shellfish. FCRs are an important factor in the derivation of water quality criteria for toxics.
The AWB/City/County consortium (hereafter “Study Partners”) has selected four pollutants for which more stringent HHWQC are expected to be promulgated. The Study Partners recognize that Ecology probably will not adopt more stringent arsenic HHWQC so the evaluation here is based on the current arsenic HHWQC imposed by the National Toxics Rule. Available monitoring information indicates these pollutants are ubiquitous in the environment and are expected to be present in many NPDES discharges. The four pollutants include the following:
Arsenic o Elemental metalloid that occurs naturally and enters the environment through erosion
processes. Also widely used in batteries, pesticides, wood preservatives, and semiconductors. Other current uses and legacy sources in fungicides/herbicides, copper smelting, paints/dyes, and personal care products.
Benzo(a)pyrene (BAP) o Benzo(a)pyrene is a polycyclic aromatic hydrocarbon formed by a benzene ring
fused to pyrene as the result of incomplete combustion. Its metabolites are highly carcinogenic. Sources include wood burning, coal tar, automobile exhaust, cigarette smoke, and char-broiled food.
Mercury o Naturally occurring element with wide legacy uses in thermometers, electrical
switches, fluorescent lamps, and dental amalgam. Also enters the environment through erosion processes, combustion (especially coal), and legacy industrial/commercial uses. Methylmercury is an organometallic that is a bioaccumulative toxic. In aquatic systems, an anaerobic methylation process converts inorganic mercury to methylmercury.
Polychlorinated Biphenyls (PCBs) o Persistent organic compounds historically used as a dielectric and coolant in
electrical equipment and banned from production in the U.S. in 1979. Available information indicates continued pollutant loadings to the environment as a byproduct from the use of some pigments, paints, caulking, motor oil, and coal combustion.
4 Association of Washington Business 213512 Treatment Technology Review and Assessment
2.3 Assumptions Supporting Selected Ambient Water Quality Criteria and Effluent Limitations
Clean Water Act regulations require NPDES permittees to demonstrate their discharge will “not cause or contribute to a violation of water quality criteria.” If a “reasonable potential analysis” reveals the possibility of a standards violation, the permitting authority is obliged to develop “water quality-based effluent limits” to ensure standards achievement. In addition, if ambient water quality monitoring or fish tissue assessments reveal toxic pollutant concentrations above HHWQC levels, Ecology is required to identify that impairment (“303(d) listing”) and develop corrective action plans to force reduction in the toxic pollutant discharge or loading of the pollutant into the impaired water body segment. These plans, referred to as total maximum daily loads (TMDLs) or water cleanup plans, establish discharge allocations and are implemented for point discharge sources through NPDES permit effluent limits and other conditions.
The effect of more stringent HHWQC will intuitively result in more NPDES permittees “causing or contributing” to a water quality standards exceedance, and/or more waterbodies being determined to be impaired, thus requiring 303(d) listing, the development of TMDL/water cleanup plans, and more stringent effluent limitations to NPDES permittees whose treated wastewater contains the listed toxic pollutant.
The study design necessarily required certain assumptions to create a “baseline effluent scenario” against which the evaluation of advanced treatment technologies could occur. The Study Partners and HDR Engineering, Inc (HDR) developed the scenario. Details of the baseline effluent scenario are presented in Table 1. The essential assumptions and rationale for selection are presented below:
Ecology has indicated proposed HHWQC revisions will be provided in first quarter 2014. A Study Partners objective was to gain an early view on the treatment technology and cost implications. Ecology typically allows 30 or 45 days for the submission of public comments on proposed regulations. To wait for the proposed HHWQC revisions would not allow sufficient time to complete a timely technology/cost evaluation and then to share the study results in the timeframe allowed for public involvement/public comments.
Coincident with the issuance of the proposed regulation, Ecology has a statutory obligation to provide a Significant Legislative Rule evaluation, one element of which is a “determination whether the probable benefits of the rule are greater than its probable costs, taking into account both the qualitative and quantitative benefits and costs and the specific directives of the statute being implemented” (RCW 34.05.328(1)(d)). A statutory requirement also exists to assess the impact of the proposed regulation to small businesses. The implication is that Ecology will be conducting these economic evaluations in fourth quarter 2013 and early 2014. The Study Partners wanted to have a completed technology/cost study available to share with Ecology for their significant legislative rule/small business evaluations.
The EPA, Indian tribes located in Washington, and various special interest groups have promoted the recently promulgated state of Oregon HHWQC (2011) as the “model” for Washington’s revisions of HHWQC. The Oregon HHWQC are generally based on a increased FCR of 175 grams per day (g/day) and an excess cancer risk of 10-6. While the Study Partners do not concede the wisdom or appropriateness of the Oregon criteria, or the selection of scientific/technical elements used to derive those criteria, the Study Partners nevertheless have selected the Oregon HHWQC as a viable “starting point” upon which this study could be based.

Association of Washington Business 5 Treatment Technology Review and Assessment 213512
The scenario assumes generally that Oregon’s HHWQC for ambient waters will, for some parameters in fact, become effluent limitations for Washington NPDES permittees. The reasoning for this important assumption includes:
o The state of Washington’s NPDES permitting program is bound by the Friends of Pinto Creek vs. EPA decision in the United States Court of Appeals for the Ninth Circuit (October 4, 2007). This decision held that no NPDES permits authorizing new or expanded discharges of a pollutant into a waterbody identified as impaired; i.e., listed on CWA section 303(d), for that pollutant, may be issued until such time as “existing dischargers” into the waterbody are “subject to compliance schedules designed to bring the (waterbody) into compliance with applicable water quality standards.” In essence, any new/expanded discharge of a pollutant causing impairment must achieve the HHWQC at the point of discharge into the waterbody.
o If a waterbody segment is identified as “impaired” (i.e., not achieving a HHWQC), then Ecology will eventually need to produce a TMDL or water cleanup plan. For an existing NPDES permittee with a discharge of the pollutant for which the receiving water is impaired, the logical assumption is that any waste load allocation granted to the discharger will be at or lower than the numeric HHWQC (to facilitate recovery of the waterbody to HHWQC attainment). As a practical matter, this equates to an effluent limit established at the HHWQC.
o Acceptance of Oregon HHWQC as the baseline for technology/cost review also means acceptance of practical implementation tools used by Oregon. The HHWQC for mercury is presented as a fish tissue methyl mercury concentration. For the purposes of NPDES permitting, however, Oregon has developed an implementation management directive which states that any confirmed detection of mercury is considered to represent a “reasonable potential” to cause or contribute to a water quality standards violation of the methyl mercury criteria. The minimum quantification level for total mercury is presented as 0.005 micrograms per liter (µg/L) (5.0 nanograms per liter (ng/L)).
o The assumed effluent limit for arsenic is taken from EPA’s National Recommended Water Quality Criteria (2012) (inorganic, water and organisms, 10-6 excess cancer risk). Oregon’s 2011 criterion is actually based on a less protective excess cancer risk (10-4). This, however, is the result of a state-specific risk management choice and it is unclear if Washington’s Department of Ecology would mimic the Oregon approach.
o The assumption is that no mixing zone is granted such that HHWQC will effectively serve as NPDES permit effluent limits. Prior discussion on the impact of the Pinto Creek decision, 303(d) impairment and TMDL Waste Load Allocations processes, all lend support to this “no mixing zone” condition for the parameters evaluated in this study.
Consistent with Ecology practice in the evaluation of proposed regulations, the HHWQC are assumed to be in effect for a 20-year period. It is assumed that analytical measurement technology and capability will continue to improve over this time frame and this will result in the detection and lower quantification of additional HHWQC in ambient water and NPDES dischargers. This knowledge will trigger the Pinto Creek/303(d)/TMDL issues identified above and tend to pressure NPDES permittees to evaluate and install advanced treatment technologies. The costs and efficacy of treatment for these additional HHWQC is unknown at this time.

6 Association of Washington Business 213512 Treatment Technology Review and Assessment
Other elements of the Study Partners work scope, as presented to HDR, must be noted:
The selection of four toxic pollutants and development of a baseline effluent scenario is not meant to imply that each NPDES permittee wastewater discharge will include those pollutants at the assumed concentrations. Rather, the scenario was intended to represent a composite of many NPDES permittees and to facilitate evaluation of advanced treatment technologies relying on mechanical, biological, physical, chemical processes.
The scalability of advanced treatment technologies to wastewater treatment systems with different flow capacities, and the resulting unit costs for capital and O&M, is evaluated.
Similarly, a sensitivity analysis on the unit costs for capital and O&M was evaluated on the assumption the adopted HHWQC (and effectively, NPDES effluent limits) are one order-of-magnitude less stringent than the Table 1 values.

Association of Washington Business 7 Treatment Technology Review and Assessment 213512
Table 1: Summary of Effluent Discharge Toxics Limits
Constituent
Human Health Criteria based Limits
to be met with no Mixing Zone (µg/L)
Basis for Criteria
Typical Concentration in
Municipal Secondary Effluent
(µg/L)
Typical Concentration in
Industrial Secondary Effluent
(µg/L)
Existing Washington HHC
(water + org.), NTR (µg/L)
PCBs 0.0000064
Oregon Table 40 Criterion (water + organisms) at FCR of 175 grams/day
0.0005 to 0.0025b,c,d,e,f 0.002 to 0.005i 0.0017
Mercury 0.005 DEQ IMDa 0.003 to 0.050h 0.010 to 0.050h 0.140
Arsenic 0.018 EPA National Toxics Rule (water + organisms)k
0.500 to 5.0j 10 to 40j 0.018
Benzo(a)Pyrene 0.0013
Oregon Table 40 Criterion (water + organisms) at FCR of 175 grams/day
0.00028 to 0.006b,g 0.006 to1.9
0.0028
a Oregon Department of Environmental Quality (ODEQ). Internal Management Directive: Implementation of Methylmercury Criterion in NPDES Permits. January 8, 2013. b Control of Toxic Chemicals in Puget Sound, Summary Technical Report for Phase 3: Loadings from POTW Discharge of Treated Wastewater, Washington Department of Ecology, Publication Number 10-10-057, December 2010. c Spokane River PCB Source Assessment 2003-2007, Washington Department of Ecology, Publication No. 11-03-013, April 2011. d Lower Okanogan River Basin DDT and PCBs Total Maximum Daily Load, Submittal Report, Washington Department of Ecology, Publication Number 04-10-043, October 2004. e Palouse River Watershed PCB and Dieldrin Monitoring, 2007-2008, Wastewater Treatment Plants and Abandoned Landfills, Washington Department of Ecology, Publication No. 09-03-004, January 2009 f A Total Maximum Daily Load Evaluation for Chlorinated Pesticides and PCBs in the Walla Walla River, Washington Department of Ecology, Publication No. 04-03-032, October 2004. g Removal of Polycyclic Aromatic Hydrocarbons and Heterocyclic Nitrogenous Compounds by A POTW Receiving Industrial Discharges, Melcer, H., Steel, P. and Bedford, W.K., Water Environment Federation, 66th Annual Conference and Exposition, October 1993. h Data provided by Lincoln Loehr's summary of WDOE Puget Sound Loading data in emails from July 19, 2013. i NCASI memo from Larry Lefleur, NCASI, to Llewellyn Matthews, NWPPA, revised June 17, 2011, summarizing available PCB monitoring data results from various sources. j Professional judgment, discussed in August 6, 2013 team call. k The applicable Washington Human Health Criteria cross-reference the EPA National Toxics Rule, 40 CFR 131.36. The EPA arsenic HHC is 0.018 ug/L for water and organisms.
8 Association of Washington Business 213512 Treatment Technology Review and Assessment
This page left intentionally blank.

Association of Washington Business 9 Treatment Technology Review and Assessment 213512
3.0 Wastewater Characterization Description This section describes the wastewater treatment discharge considered in this technology evaluation. Treated wastewater characteristics are described, including average and peak flow, effluent concentrations, and toxic compounds of concern.
3.1 Summary of Wastewater Characterization A general wastewater treatment process and wastewater characteristics were developed as the common baseline to represent the existing conditions as a starting point for comparison with potential future advanced treatment technologies and improvements. A secondary treatment process with disinfection at a flow of 5 mgd as the current, baseline treatment system for existing dischargers was also developed. Typical effluent biochemical oxygen demand (BOD) and total suspended solids (TSS) were assumed between 10 to 30 mg/L from such a facility and no nutrient or toxics removal was assumed to be accomplished in the existing baseline treatment process.
3.2 Existing Wastewater Treatment Facility The first step in the process is to characterize the existing wastewater treatment plant to be evaluated in this study. The goal is to identify the necessary technology that would need to be added to an existing treatment facility to comply with revised toxic pollutant effluent limits. Rather than evaluating the technologies and costs to upgrade multiple actual operating facilities, the Study Partners specified that a generalized municipal/industrial wastewater treatment facility would be characterized and used as the basis for developing toxic removal approaches. General characteristics of the facility’s discharge are described in Table 2.
Table 2. General Wastewater Treatment Facility Characteristics
Average Annual Wastewater Flow,
mgd
Maximum Month Wastewater Flow,
mgd
Peak Hourly Wastewater Flow,
mgd
Effluent BOD, mg/L
Effluent TSS, mg/L
5.0 6.25 15.0 10 to 30 10 to 30
mgd=million gallons per day mg/L=milligrams per liter BOD=biochemical oxygen demand TSS=total suspended solids
In the development of the advanced treatment technologies presented below, the capacity of major treatment elements are generally sized to accommodate the maximum month average wastewater flow. Hydraulic elements, such as pumps and pipelines, were selected to accommodate the peak hourly wastewater flow.
The general treatment facility incorporates a baseline treatment processes including influent screening, grit removal, primary sedimentation, suspended growth biological treatment (activated sludge), secondary clarification, and disinfection using chlorine. Solids removed during primary treatment and secondary clarification are assumed to be thickened, stabilized, dewatered, and land applied to agricultural land. The biological treatment process is assumed to be activated sludge with a relatively short (less than 10-day) solids retention time. The baseline secondary treatment facility is assumed not to have processes dedicated to removing nutrients or toxics. However, some coincident removal of toxics will occur during conventional treatment.
10 Association of Washington Business 213512 Treatment Technology Review and Assessment
3.3 Toxic Constituents As described in Section 2.3, the expectation of more stringent HHWQC will eventually trigger regulatory demands for NPDES permittees to install advanced treatment technologies. The Study Group and HDR selected four specific toxic pollutants reflecting a range of toxic constituents as the basis for this study to limit the constituents and technologies to be evaluated to a manageable level.
The four toxic pollutants selected were PCBs, mercury, arsenic, and BAP, a polycyclic aromatic hydrocarbon (PAH). Mercury and arsenic are metals, and PCBs and PAHs are organic compounds. Technologies for removing metals and organic compounds are in some cases different. Key information on each of the compounds, including a description of the constituent, the significance of each constituent, proposed HHWQC, basis for the proposed criteria, typical concentration in both municipal and industrial secondary effluent, and current Washington state water quality criteria, are shown in Table 1. It is assumed that compliance with the proposed criteria in the table would need to be achieved at the “end of pipe” and Ecology would not permit a mixing zone for toxic constituents. This represents a “worst–case,” but a plausible assumption about discharge conditions.

Association of Washington Business 11 Treatment Technology Review and Assessment 213512
4.0 Treatment Approaches and Costs 4.1 Summary of Treatment Approach and Costs Two advanced treatment process options for toxics removal for further evaluation based on the characterization of removal effectiveness from the technical literature review and Study Group preferences. The two tertiary treatment options are microfiltration MF followed by either RO or GAC as an addition to an existing secondary treatment facility. Based on the literature review, it is not anticipated that any of the treatment options will be effective in reducing all of the selected pollutants to below the anticipated water quality criteria. A summary of the capital and operations and maintenance costs for tertiary treatment is provided, as well as a comparison of the adverse environmental impacts for each alternative.
4.2 Constituent Removal – Literature Review The evaluation of treatment technologies relevant to the constituents of concern was initiated with a literature review. The literature review included a desktop search using typical web-based search engines, and search engines dedicated to technical and research journal databases. At the same time, HDR’s experience with the performance of existing treatment technologies specifically related to the four constituents of concern, was used in evaluating candidate technologies. A summary of the constituents of concern and relevant treatment technologies is provided in the following literature review section.
4.2.1 Polychlorinated Biphenyls PCBs are persistent organic pollutants that can be difficult to remove in treatment. PCB treatment in wastewater can be achieved using oxidation with peroxide, filtration, biological treatment or a combination of these technologies. There is limited information available about achieving ultra-low effluent PCB concentrations near the 0.0000064 µg/L range under consideration in the proposed rulemaking process. This review provides a summary of treatment technology options and anticipated effluent PCB concentrations.
Research on the effectiveness of ultraviolet (UV) light and peroxide on removing PCBs was tested in bench scale batch reactions (Yu, Macawile, Abella, & Gallardo 2011). The combination of UV and peroxide treatment achieved PCB removal greater than 89 percent, and in several cases exceeding 98 percent removal. The influent PCB concentration for the batch tests ranged from 50 to 100 micrograms per liter (µg/L). The final PCB concentration (for the one congener tested) was <10 µg/L (10,000 ng/L) for all tests and <5 µg/L (5,000 ng/L) for some tests. The lowest PCB concentrations in the effluent occurred at higher UV and peroxide doses.
Pilot testing was performed to determine the effectiveness of conventional activated sludge and a membrane bioreactor to remove PCBs (Bolzonella, Fatone, Pavan, & Cecchi 2010). EPA Method 1668 was used for the PCB analysis (detection limit of 0.01 ng/L per congener). Influent to the pilot system was a combination of municipal and industrial effluent. The detailed analysis was for several individual congeners. Limited testing using the Aroclor method (total PCBs) was used to compare the individual congeners and the total concentration of PCBs. Both conventional activated sludge and membrane bioreactor (MBR) systems removed PCBs. The effluent MBR concentrations ranged from <0.01 ng/L to 0.04 ng/L compared to <0.01 ng/L to 0.88 ng/L for conventional activated sludge. The pilot testing showed that increased solids retention time (SRT) and higher mixed liquor suspended solids concentrations in the MBR system led to increased removal in the liquid stream.
Bench scale studies were completed to test the effectiveness of GAC and biological activated carbon (BAC) for removing PCBs (Ghosh, Weber, Jensen, & Smith 1999). The effluent from the
12 Association of Washington Business 213512 Treatment Technology Review and Assessment
GAC system was 800 ng/L. The biological film in the BAC system was presumed to support higher PCB removal with effluent concentrations of 200 ng/L. High suspended sediment in the GAC influent can affect performance. It is recommended that filtration be installed upstream of a GAC system to reduce solids and improve effectiveness.
Based on limited available data, it appears that existing municipal secondary treatment facilities in Washington state are able to reduce effluent PCBs to the range approximately 0.10 to 1.5 ng/L. It appears that the best performing existing municipal treatment facility in Washington state with a microfiltration membrane is able to reduce effluent PCBs to the range approximately 0.00019 to 0.00063 µg/L. This is based on a very limited data set and laboratory blanks covered a range that overlapped with the effluent results (blanks 0.000058 to 0.00061 µg/L).
Addition of advanced treatment processes would be expected to enhance PCB removal rates, but the technical literature does not appear to provide definitive information for guidance. A range of expected enhanced removal rates might be assumed to vary widely from level of the reference microfiltration facility of 0.19 to 0.63 ng/L.
Summary of PCB Technologies
The literature review revealed there are viable technologies available to reduce PCBs but no research was identified with treatment technologies capable of meeting the anticipated human health criteria based limits for PCB removal. Based on this review, a tertiary process was selected to biologically reduce PCBs and separate the solids using tertiary filtration. Alternately, GAC was investigated as an option to reduce PCBs, although it is not proven that it will meet revised effluent limits.
4.2.2 Mercury Mercury removal from wastewater can be achieved using precipitation, adsorption, filtration, or a combination of these technologies. There is limited information available about achieving ultra-low effluent mercury concentrations near the 5 ng/L range under consideration in the proposed rulemaking process. This review provides a summary of treatment technology options and anticipated effluent mercury concentrations.
Precipitation (and co-precipitation) involves chemical addition to form a particulate and solids separation, using sedimentation or filtration. Precipitation includes the addition of a chemical precipitant and pH adjustment to optimize the precipitation reaction. Chemicals can include metal salts (ferric chloride, ferric sulfate, ferric hydroxide, or alum), pH adjustment, lime softening, or sulfide. A common precipitant for mercury removal is sulfide, with an optimal pH between 7 and 9. The dissolved mercury is precipitated with the sulfide to form an insoluble mercury sulfide that can be removed through clarification or filtration. One disadvantage of precipitation is the generation of a mercury-laden sludge that will require dewatering and disposal. The mercury sludge may be considered a hazardous waste and require additional treatment and disposal at a hazardous waste site. The presence of other compounds, such as other metals, may reduce the effectiveness of mercury precipitation/co-precipitation. For low-level mercury treatment requirements, several treatment steps will likely be required in pursuit of very low effluent targets.
EPA compiled a summary of facilities that are using precipitation/co-precipitation for mercury treatment (EPA 2007). Three of the full-scale facilities were pumping and treating groundwater and the remaining eight facilities were full-scale wastewater treatment plants. One of the pump and treat systems used precipitation, carbon adsorption, and pH adjustment to treat groundwater to effluent concentrations of 300 ng/L.

Association of Washington Business 13 Treatment Technology Review and Assessment 213512
Adsorption treatment can be used to remove inorganic mercury from water. While adsorption can be used as a primary treatment step, it is frequently used for polishing after a preliminary treatment step (EPA 2007). One disadvantage of adsorption treatment is that when the adsorbent is saturated, it either needs to be regenerated or disposed of and replaced with new adsorbent. A common adsorbent is GAC. There are several patented and proprietary adsorbents on the market for mercury removal. Adsorption effectiveness can be affected by water quality characteristics, including high solids and bacterial growth, which can cause media blinding. A constant and low flow rate to the adsorption beds increases effectiveness (EPA 2007). The optimal pH for mercury adsorption on GAC is pH 4 to 5; therefore, pH adjustment may be required.
EPA compiled a summary of facilities that are using adsorption for mercury treatment (EPA 2007). Some of the facilities use precipitation and adsorption as described above. The six summarized facilities included two groundwater treatment and four wastewater treatment facilities. The reported effluent mercury concentrations were all less than 2,000 ng/L (EPA 2007).
Membrane filtration can be used in combination with a preceding treatment step. The upstream treatment is required to precipitate soluble mercury to a particulate form that can be removed through filtration. According to the EPA summary report, ultrafiltration is used to remove high-molecular weigh contaminants and solids (EPA 2007). The treatment effectiveness can depend on the source water quality since many constituents can cause membrane fouling, decreasing the effectiveness of the filters. One case study summarized in the EPA report showed that treatment of waste from a hazardous waste combustor treated with precipitation, sedimentation, and filtration achieved effluent mercury concentrations less than the detection limit of 200 ng/L.
Bench-scale research performed at the Oak Ridge Y-12 Plant in Tennessee evaluated the effectiveness of various adsorbents for removing mercury to below the NPDES limit of 12 ng/L and the potential revised limit of 51 ng/L (Hollerman et al. 1999). Several proprietary adsorbents were tested, including carbon, polyacrylate, polystyrene, and polymer adsorption materials. The adsorbents with thiol-based active sites were the most effective. Some of the adsorbents were able to achieve effluent concentrations less than 51 ng/L but none of the adsorbents achieved effluent concentrations less than 12 ng/L.
Bench-scale and pilot-scale testing performed on refinery wastewater was completed to determine treatment technology effectiveness for meeting very low mercury levels (Urgun-Demirtas, Benda, Gillenwater, Negri, Xiong & Snyder 2012) (Urgun-Demirtas, Negri, Gillenwater, Agwu Nnanna & Yu 2013). The Great Lakes Initiative water quality criterion for mercury is less than 1.3 ng/L for municipal and industrial wastewater plants in the Great Lakes region. This research included an initial bench scale test including membrane filtration, ultrafiltration, nanofiltration, and reverse osmosis to meet the mercury water quality criterion. The nanofiltration and reverse osmosis required increased pressures for filtration and resulted in increased mercury concentrations in the permeate. Based on this information and the cost difference between the filtration technologies, a pilot-scale test was performed. The 0.04 um PVDF GE ZeeWeed 500 series membranes were tested. The 1.3 ng/L water quality criterion was met under all pilot study operating conditions. The mercury in the refinery effluent was predominantly in particulate form which was well-suited for removal using membrane filtration.
Based on available data, it appears that existing municipal treatment facilities are capable of reducing effluent mercury to near the range of the proposed HHWQC on an average basis. Average effluent mercury in the range of 1.2 to 6.6 ng/L for existing facilities with secondary treatment and enhanced treatment with cloth filters and membranes. The Spokane County plant data range is an average of 1.2 ng/L to a maximum day of 3 ng/L. Addition of

14 Association of Washington Business 213512 Treatment Technology Review and Assessment
advanced treatment processes such as GAC or RO would be expected to enhance removal rates. Data from the West Basin treatment facility in California suggests that at a detection limit of 7.99 ng/L mercury is not detected in the effluent from this advanced process train. A range of expected enhanced removal rates from the advanced treatment process trains might be expected to ranged from meeting the proposed standard at 5 ng/L to lower concentrations represented by the Spokane County performance level (membrane filtration) in the range of 1 to 3 ng/L, to perhaps even lower levels with additional treatment. For municipal plants in Washington, this would suggest that effluent mercury values from the two advanced treatment process alternatives might range from 1 to 5 ng/L (0.001 to 0.005 µg/L) and perhaps substantially better, depending upon RO and GAC removals. It is important to note that industrial plants may have higher existing mercury levels and thus the effluent quality that is achievable at an industrial facility would be of lower quality.
Summary of Mercury Technologies
The literature search revealed limited research on mercury removal technologies at the revised effluent limit of 0.005 µg/L. Tertiary filtration with membrane filters or reverse osmosis showed the best ability to achieve effluent criteria less than 0.005 µg/L.
4.2.3 Arsenic A variety of treatment technologies can be applied to capture arsenic (Table 3). Most of the information in the technical literature and from the treatment technology vendors is focused on potable water treatment for compliance with a Safe Drinking Water Act (SDWA) maximum contaminant level (MCL) of 10 µg/L. The most commonly used arsenic removal method for a wastewater application (tertiary treatment) is coagulation/ flocculation plus filtration. This method by itself could remove more than 90 to 95 percent of arsenic. Additional post-treatment through adsorption, ion exchange, or reverse osmosis is required for ultra-low arsenic limits in the 0.018 µg/L range under consideration in the proposed rulemaking process. In each case it is recommended to perform pilot-testing of each selected technology.
Table 3: Summary of Arsenic Removal Technologies1
Technology Advantages Disadvantages
Coagulation/filtration Simple, proven technology
Widely accepted
Moderate operator training
pH sensitive
Potential disposal issues of backwash waste
As+3 and As+5 must be fully oxidized
Lime softening High level arsenic treatment
Simple operation change for existing lime softening facilities
pH sensitive (requires post treatment adjustment)
Requires filtration
Significant sludge operation
Adsorptive media High As+5 selectivity
Effectively treats water with high total dissolved solids (TDS)
Highly pH sensitive
Hazardous chemical use in media regeneration
High concentration SeO4-2, F-, Cl-,
and SO4-2 may limit arsenic removal

Association of Washington Business 15 Treatment Technology Review and Assessment 213512
Table 3: Summary of Arsenic Removal Technologies1
Technology Advantages Disadvantages
Ion exchange Low contact times
Removal of multiple anions, including arsenic, chromium, and uranium
Requires removal of iron, manganese, sulfides, etc. to prevent fouling
Brine waste disposal
Membrane filtration High arsenic removal efficiency
Removal of multiple contaminants
Reject water disposal
Poor production efficiency
Requires pretreatment 1Adapted from WesTech
The removal of arsenic in activated sludge is minimal (less than 20 percent) (Andrianisa et al. 2006), but biological treatment can control arsenic speciation. During aerobic biological process As (III) is oxidized to As (V). Coagulation/flocculation/filtration removal, as well as adsorption removal methods, are more effective in removal of As(V) vs. As (III). A combination of activated sludge and post-activated sludge precipitation with ferric chloride (addition to MLSS and effluent) results in a removal efficiency of greater than 95 percent. This combination could decrease As levels from 200 µg/L to less than 5 µg/L (5,000 ng/L) (Andrianisa et al. 2008) compared to the 0.018 µg/L range under consideration in the proposed rulemaking process.
Data from the West Basin facility (using MF/RO/AOP) suggests effluent performance in the range of 0.1 to 0.2 µg/L, but it could also be lower since a detection limit used there of 0.15 µg/l is an order of magnitude higher than the proposed HHWQC. A range of expected enhanced removal rates might be assumed to equivalent to that achieved at West Basin in 0.1 to 0.2 µg/L range.
Review of Specific Technologies for Arsenic Removal
Coagulation plus Settling or Filtration Coagulation may remove more than 95 percent of arsenic through the creation of particulate metal hydroxides. Ferric sulfite is typically more efficient and applicable to most wastewater sources compared to alum. The applicability and extent of removal should be pilot-tested, since removal efficiency is highly dependent on the water constituents and water characteristics (i.e., pH, temperature, solids).
Filtration can be added after or instead of settling to increase arsenic removal. Example treatment trains with filtration are shown in Figures 1 and 2, respectively.
Figure 1. Water Treatment Configuration for Arsenic Removal (WesTech)
16 Association of Washington Business 213512 Treatment Technology Review and Assessment
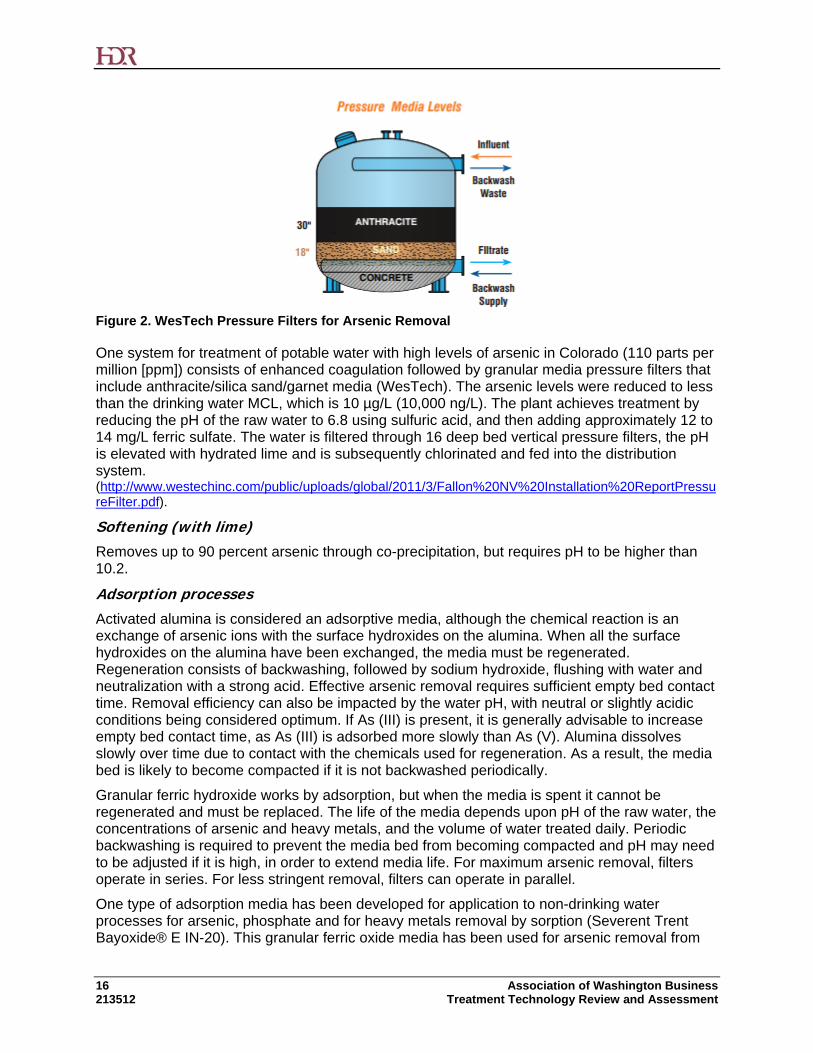
Figure 2. WesTech Pressure Filters for Arsenic Removal
One system for treatment of potable water with high levels of arsenic in Colorado (110 parts per million [ppm]) consists of enhanced coagulation followed by granular media pressure filters that include anthracite/silica sand/garnet media (WesTech). The arsenic levels were reduced to less than the drinking water MCL, which is 10 µg/L (10,000 ng/L). The plant achieves treatment by reducing the pH of the raw water to 6.8 using sulfuric acid, and then adding approximately 12 to 14 mg/L ferric sulfate. The water is filtered through 16 deep bed vertical pressure filters, the pH is elevated with hydrated lime and is subsequently chlorinated and fed into the distribution system. (http://www.westechinc.com/public/uploads/global/2011/3/Fallon%20NV%20Installation%20ReportPressureFilter.pdf).
Softening (with lime) Removes up to 90 percent arsenic through co-precipitation, but requires pH to be higher than 10.2.
Adsorption processes Activated alumina is considered an adsorptive media, although the chemical reaction is an exchange of arsenic ions with the surface hydroxides on the alumina. When all the surface hydroxides on the alumina have been exchanged, the media must be regenerated. Regeneration consists of backwashing, followed by sodium hydroxide, flushing with water and neutralization with a strong acid. Effective arsenic removal requires sufficient empty bed contact time. Removal efficiency can also be impacted by the water pH, with neutral or slightly acidic conditions being considered optimum. If As (III) is present, it is generally advisable to increase empty bed contact time, as As (III) is adsorbed more slowly than As (V). Alumina dissolves slowly over time due to contact with the chemicals used for regeneration. As a result, the media bed is likely to become compacted if it is not backwashed periodically.
Granular ferric hydroxide works by adsorption, but when the media is spent it cannot be regenerated and must be replaced. The life of the media depends upon pH of the raw water, the concentrations of arsenic and heavy metals, and the volume of water treated daily. Periodic backwashing is required to prevent the media bed from becoming compacted and pH may need to be adjusted if it is high, in order to extend media life. For maximum arsenic removal, filters operate in series. For less stringent removal, filters can operate in parallel.
One type of adsorption media has been developed for application to non-drinking water processes for arsenic, phosphate and for heavy metals removal by sorption (Severent Trent Bayoxide® E IN-20). This granular ferric oxide media has been used for arsenic removal from

Association of Washington Business 17 Treatment Technology Review and Assessment 213512
mining and industrial wastewaters, selenium removal from refinery wastes and for phosphate polishing of municipal wastewaters. Valley Vista drinking water treatment with Bayoxide® E IN-20 media achieves removal from 31-39 µg/L (31,000-39,000 ng/L) to below 10 µg/L MCL (http://www.severntrentservices.com/News/Successful_Drinking_Water_Treatment_in_an_Arsenic__Hot_Spot__nwMFT_452.aspx).
Another adsorptive filter media is greensand. Greensand is available in two forms: as glauconite with manganese dioxide bound ionically to the granules and as silica sand with manganese dioxide fused to the granules. Both forms operate in pressure filters and both are effective. Greensand with the silica sand core operates at higher water temperatures and higher differential pressures than does greensand with the glauconite core. Arsenic removal requires a minimum concentration of iron. If a sufficient concentration of iron is not present in the raw water, ferric chloride is added.
WesTech filters with greensand and permanganate addition for drinking water systems can reduce As from 15-25 µg/L to non-detect. Sodium hypochlorite and/or potassium permanganate are added to the raw water prior to the filters. Chemical addition may be done continuously or intermittently, depending on raw water characteristics. These chemicals oxidize the iron in the raw water and also maintain the active properties of the greensand itself. Arsenic removal is via co-precipitation with the iron.
Ion Exchange Siemens offers a potable ion exchange (PIX) arsenic water filtration system. PIX uses ion exchange resin canisters for the removal of organic and inorganic contaminants, in surface and groundwater sources to meet drinking water standards.
Filtronics also uses ion exchange to treat arsenic. The technology allows removal for below the SWDA MCL for potable water of 10 µg/L (10,000 ng/L).
Reverse osmosis Arsenic is effectively removed by RO when it is in oxidative state As(V) to approximately 1,000 ng/L or less (Ning 2002).
Summary of Arsenic Technologies
The current state of the technology for arsenic removal is at the point where all the processes target the SWDA MCL for arsenic in potable water. Current EPA maximum concentration level for drinking water is 10 ug/l; much higher than 0.0018 µg/L target for arsenic in this study. The majority of the methods discussed above are able to remove arsenic to either EPA maximum contaminant level or to the level of detection. The lowest detection limit of one of the EPA approved methods of arsenic measurements is 20 ng/l (0.020 µg/l) (Grosser, 2010), which is comparable to the 0.018 µg/L limit targeted in this study.
4.2.1 Polycyclic Aromatic Hydrocarbons
BAP During Biological Treatment
During wastewater treatment process, BAP tends to partition into sludge organic matter (Melcer et al. 1993). Primary and secondary processing could remove up to 60 percent of incoming PAHs and BAP in particular, mostly due to adsorption to sludge (Kindaichi et al., NA, Wayne et al. 2009). Biodegradation of BAP is expected to be very low since there are more than five benzene rings which are resistant to biological degradation. Biosurfactant addition to biological process could partially improve biodegradation, but only up to removal rates of 50 percent (Sponza et al. 2010). Existing data from municipal treatment facilities in Washington state have

18 Association of Washington Business 213512 Treatment Technology Review and Assessment
influent and effluent concentrations of BAP of approximately 0.30 ng/L indicating that current secondary treatment has limited effectiveness at BAP removal.
Methods to Enhance Biological Treatment of BAP
Ozonation prior to biological treatment could potentially improve biodegradability of BAP (Zeng et al. 2000). In the case of soil remediation, ozonation before biotreatment improved biodegradation by 70 percent (Russo et al. 2012). The overall removal of BAP increased from 23 to 91 percent after exposure of water to 0.5 mg/L ozone for 30 minutes during the simultaneous treatment process and further to 100 percent following exposure to 2.5 mg/L ozone for 60 minutes during the sequential treatment mode (Yerushalmi et al. 2006). In general, to improve biodegradability of BAP, long exposure to ozone might be required (Haapea et al. 2006).
Sonication pre-treatment or electronic beam irradiation before biological treatment might also make PAHs more bioavailable for biological degradation..
Recent studies reported that a MBR is capable of removing PAHs from wastewater (Rodrigue and Reilly 2009; Gonzaleza et al. 2012). None of the studies listed the specific PAHs constituents removed.
Removal of BAP from Drinking Water
Activated Carbon Since BAP has an affinity to particulate matter, it is removed from the drinking water sources by means of adsorption, such as granular activated carbon (EPA). Similarly, Oleszczuk et al. (2012) showed that addition of 5 percent activated carbon could remove 90 percent of PAHs from the wastewater.
Reverse Osmosis Light (1981) (referenced by Williams, 2003) studied dilute solutions of PAHs, aromatic amines, and nitrosamines and found rejections of these compounds in reverse osmosis to be over 99 percent for polyamide membranes. Bhattacharyya et al. (1987) (referenced by Williams, 2003) investigated rejection and flux characteristics of FT30 membranes for separating various pollutants (PAHs, chlorophenols, nitrophenols) and found membrane rejections were high (>98 percent) for the organics under ionized conditions.
Summary of BAP Technologies
Current technologies show that BAP removal may be 90 percent or greater. The lowest detection limit for BAP measurements is 0.006 µg/L, which is also the assumed secondary effluent BAP concentration assumed for this study. If this assumption is accurate, it appears technologies may exist to remove BAP to a level below the proposed criteria applied as an effluent limit of 0.0013 µg/L; however, detection limits exceed this value and it is impossible to know this for certain. A municipal wastewater treatment plant study reported both influent and effluent BAP concentrations less than the HHWQC of 0.0013 ug/L (Ecology, 2010).
4.3 Unit Processes Evaluated Based on the results of the literature review, a wide range of technologies were evaluated for toxic constituent removal. A listing of the technologies is as follows:
Chemically enhanced primary treatment (CEPT): this physical and chemical technology is based on the addition of a metal salt to precipitate particles prior to primary treatment, followed by sedimentation of particles in the primary clarifiers. This technology has been
Association of Washington Business 19 Treatment Technology Review and Assessment 213512
shown to effectively remove arsenic but there is little data supporting the claims. As a result, the chemical facilities are listed as optional.
Activated sludge treatment (with a short SRT of approximately 8 days or less): this biological technology is commonly referred to as secondary treatment. It relies on converting dissolved organics into solids using biomass. Having a short SRT is effective at removing degradable organics referred to as BOD compounds for meeting existing discharge limits. Dissolved constituents with a high affinity to adsorb to biomass (e.g., metals, high molecular weight organics, and others) will be better removed compared to smaller molecular weight organics and recalcitrant compounds which will have minimal removal at a short SRT.
Enhanced activated sludge treatment (with a long SRT of approximately 8 days or more): this technology builds on secondary treatment by providing a longer SRT, which enhances sorption and biodegradation. The improved performance is based on having more biomass coupled with a more diverse biomass community, especially nitrifiers, which have been shown to assist in removal of some of the more recalcitrant constituents not removed with a shorter SRT (e.g., lower molecular weight PAHs). There is little or no data available on the effectiveness of this treatment for removing BAP.
Additional benefits associated with having a longer SRT are as follows:
o Lower BOD/TSS discharge load to receiving water
o Improved water quality and benefit to downstream users
o Lower effluent nutrient concentrations which reduce algal growth potential in receiving waters
o Reduced receiving water dissolved oxygen demand due to ammonia removal
o Reduced ammonia discharge, which is toxic to aquatic species
o Improved water quality for habitat, especially as it relates to biodiversity and eutrophication
o Secondary clarifier effluent more conditioned for filtration and disinfection
o Greater process stability from the anaerobic/anoxic zones serving as biological selectors
Coagulation/Flocculation and Filtration: this two-stage chemical and physical process relies on the addition of a metal salt to precipitate particles in the first stage, followed by the physical removal of particles in filtration. This technology lends itself to constituents prone to precipitation (e.g., arsenic).
Lime Softening: this chemical process relies on increasing the pH as a means to either volatilize dissolved constituents or inactivate pathogens. Given that none of the constituents being studied are expected to volatilize, this technology was not carried forward.
Adsorptive Media: this physical and chemical process adsorbs constituents to a combination of media and/or biomass/chemicals on the media. There are several types of media, with the most proven and common being GAC. GAC can also serve as a coarse roughing filter.
Ion Exchange: this chemical technology exchanges targeted constituents with a resin. This technology is common with water softeners where the hard divalent cations are

20 Association of Washington Business 213512 Treatment Technology Review and Assessment
exchanged for monovalent cations to soften the water. Recently, resins that target arsenic and mercury removal include activated alumina and granular ferric hydroxides have been developed. The resin needs to be cleaned and regenerated, which produces a waste slurry that requires subsequent treatment and disposal. As a result, ion exchange was not considered for further.
Membrane Filtration: This physical treatment relies on the removal of particles larger than the membranes pore size. There are several different membrane pore sizes as categorized below.
o Microfiltration (MF): nominal pore size range of typically between 0.1 to 1 micron. This pore size targets particles, both inert and biological, and bacteria. If placed in series with coagulation/flocculation upstream, dissolved constituents precipitated out of solution and bacteria can be removed by the MF membrane.
o Ultrafiltration (UF): nominal pore size range of typically between 0.01 to 0.1 micron. This pore size targets those solids removed with MF (particles and bacteria) plus viruses and some colloidal material. If placed in series with coagulation/flocculation upstream, dissolved constituents precipitated out of solution can be removed by the UF membrane.
o Nanofiltration (NF): nominal pore size range of typically between 0.001 to 0.010 micron. This pore size targets those removed with UF (particles, bacteria, viruses) plus colloidal material. If placed in series with coagulation/flocculation upstream, dissolved constituents precipitated out of solution can be removed by the NF membrane.
MBR (with a long SRT): this technology builds on secondary treatment whereby the membrane (microfiltration) replaces the secondary clarifier for solids separation. As a result, the footprint is smaller, the mixed liquor suspended solids concentration can be increased to about 5,000 – 10,000 mg/L, and the physical space required for the facility reduced when compared to conventional activated sludge. As with the activated sludge option operated at a longer SRT, the sorption and biodegradation of organic compounds are enhanced in the MBR process. The improved performance is based on having more biomass coupled with a more diverse biomass community, especially nitrifiers which have been shown to assist in removal of persistent dissolved compounds (e.g., some PAHs). There is little or no data available on effectiveness at removing BAP. Although a proven technology, MBRs were not carried further in this technology review since they are less likely to be selected as a retrofit for an existing activated sludge (with a short SRT) secondary treatment facility. The MBR was considered to represent a treatment process approach more likely to be selected for a new, greenfield treatment facility. Retrofits to existing secondary treatment facilities can accomplish similar process enhancement by extending the SRT in the activated sludge process followed by the addition of tertiary membrane filtration units.
RO: This physical treatment method relies on the use of sufficient pressure to osmotically displace water across the membrane surface while simultaneously rejecting most salts. RO is very effective at removing material smaller than the size ranges for the membrane filtration list above, as well as salts and other organic compounds. As a result, it is expected to be more effective than filtration and MBR methods described above at removing dissolved constituents. Although effective, RO produces a brine reject water that must be managed and disposed.

Association of Washington Business 21 Treatment Technology Review and Assessment 213512
Advanced Oxidation Processes (AOPs): this broad term considers all chemical and physical technologies that create strong hydroxyl-radicals. Examples of AOPs include Fenton’s oxidation, ozonation, ultraviolet/hydrogen peroxide (UV-H2O2), and others. The radicals produced are rapid and highly reactive at breaking down recalcitrant compounds. Although effective at removing many complex compounds such as those evaluated in this study, AOPs does not typically have as many installations as membranes and activated carbon technologies. As a result, AOPs were not carried forward.
Based on the technical literature review discussed above, a summary of estimated contaminant removal rated by unit treatment process is presented in Table 4.
Table 4. Contaminants Removal Breakdown by Unit Process
Unit Process Arsenic BAP Mercury Polychlorinated
Biphenyls
Activated Sludge Short SRT
No removal Partial Removal by partitioning
80% removal; effluent <0.88 ng/L
Activated Sludge Long SRT
No removal Partial removal by partitioning and/or partially biodegradation; MBR could potentially remove most of BAP
>90% removal with a membrane bioreactor, <0.04 ng/L (includes membrane filtration)
Membrane Filtration (MF)
More than 90 % removal (rejection of bound arsenic)
No removal <1.3 ng/L >90% removal with a membrane bioreactor, <0.04 ng/L (includes membrane filtration)
Reverse Osmosis (RO)
More than 90% removal (rejection of bound arsenic and removal of soluble arsenic)
More than 98% removal
Granular Activated Carbon (GAC)
No removal, removal only when carbon is impregnated with iron
90 % removal <300 ng/L (precipitation and carbon adsorption) <51 ng/L (GAC)
<800 ng/L Likely requires upstream filtration
Disinfection -- -- -- --
4.4 Unit Processes Selected The key conclusion from the literature review was that there is limited, to no evidence, that existing treatment technologies are capable of simultaneously meeting all four of the revised discharge limits for the toxics under consideration. Advanced treatment using RO or GAC is expected to provide the best overall removal of the constituents of concern. It is unclear whether these advanced technologies are able to meet revised effluent limits, however these processes may achieve the best effluent quality of the technologies reviewed. This limitation in the findings is based on a lack of an extensive dataset on treatment removal effectiveness in the technical literature for the constituents of interest at the low levels relevant to the proposed criteria, which

22 Association of Washington Business 213512 Treatment Technology Review and Assessment
approach the limits of reliable removal performance for the technologies. As Table 4 highlights, certain unit processes are capable of removing a portion, or all, of the removal requirements for each technology. The removal performance for each constituent will vary from facility to facility and require a site-specific, detailed evaluation because the proposed criteria are such low concentrations. In some cases, a facility may only have elevated concentrations of a single constituent of concern identified in this study. In other cases, a discharger may have elevated concentrations of the four constituents identified in this study, as well as others not identified in this study but subject to revised water quality criteria. This effort is intended to describe a planning level concept of what treatment processes are required to comply with discharge limits for all four constituents. Based on the literature review of unit processes above, two different treatment trains were developed for the analysis that are compared against a baseline of secondary treatment as follows:
Baseline: represents conventional secondary treatment that is most commonly employed nationwide at wastewater treatment plants. A distinguishing feature for this treatment is the short solids residence time (SRT) (<8 days) is intended for removal of BOD with minimal removal for the toxic constituents of concern.
Advanced Treatment – MF/RO: builds on baseline with the implementation of a longer SRT (>8 days) and the addition of MF and RO. The longer SRT not only removes BOD, but it also has the capacity to remove nutrients and a portion of the constituents of concern. This alternative requires a RO brine management strategy which will be discussed in sub-sections below.
Advanced Treatment – MF/GAC: this alternative provides a different approach to advanced treatment with MF/RO by using GAC and avoiding the RO reject brine water management concern. Similar to the MF/RO process, this alternative has the longer SRT (>8 days) with the capacity to remove BOD, nutrients, and a portion of the toxic constituents of concern. As a result, the decision was made to develop costs for both advanced treatment options.
A description of each alternative is provided in Table 5. The process flowsheets for each alternative are presented in Figure 3 to Figure 5.
4.4.1 Baseline Treatment Process A flowsheet of the baseline treatment process is provided in Figure 3. The baseline treatment process assumes the current method of treatment commonly employed by dischargers. For this process, water enters the headworks and undergoes primary treatment, followed by conventional activated sludge (short SRT) and disinfection. The solids wasted in the activated sludge process are thickened, followed by mixing with primary solids prior to entering the anaerobic digestion process for solids stabilization. The digested biosolids are dewatered to produce a cake and hauled off-site. Since the exact process for each interested facility in Washington is unique, this baseline treatment process was used to establish the baseline capital and O&M costs. The baseline costs will be compared against the advanced treatment alternatives to illustrate the magnitude of the increased costs and environmental impacts.

Association of Washington Business 23 Treatment Technology Review and Assessment 213512
Table 5. Unit Processes Description for Each Alternative
Unit Process Baseline Advanced Treatment –
MF/RO Advanced Treatment -
GAC
Influent Flow 5 mgd 5 mgd 5 mgd
Chemically Enhanced Primary Treatment (CEPT); Optional
-- Metal salt addition (alum) upstream of primaries
Metal salt addition (alum) upstream of primaries
Activated Sludge Hydraulic Residence Time (HRT): 6 hrs
Short Solids Residence Time (SRT): <8 days
Hydraulic Residence Time (HRT): 12 hrs (Requires more tankage than the Baseline)
Long Solids Residence Time (SRT): >8 days (Requires more tankage than the Baseline)
Hydraulic Residence Time (HRT): 12 hrs (Requires more tankage than the Baseline)
Long Solids Residence Time (SRT): >8 days (Requires more tankage than the Baseline)
Secondary Clarifiers Hydraulically Limited Solids Loading Limited (Larger clarifiers than Baseline)
Solids Loading Limited (Larger clarifiers than Baseline)
Microfiltration (MF) -- Membrane Filtration to Remove Particles and Bacteria
Membrane Filtration to Remove Particles and Bacteria
Reverse Osmosis (RO) -- Treat 50% of the Flow by RO to Remove Metals and Dissolved Constituents. Sending a portion of flow through the RO and blending it with the balance of plant flows ensures a stable non-corrosive, non-toxic discharge.
--
Reverse Osmosis Brine Reject Mgmt
-- Several Options (All Energy or Land Intensive)
--
Granular Activated Carbon (GAC)
-- -- Removes Dissolved Constituents
Disinfection Not shown to remove any of the constituents
Not shown to remove any of the constituents
Not shown to remove any of the constituents

24 Association of Washington Business 213512 Treatment Technology Review and Assessment
Figure 3. Baseline Flowsheet – Conventional Secondary Treatment
WAS
Primary Clarifiers
HeadworksAeration Basins
(Short SRT <2 days)
Secondary Clarifiers
RAS
Primary Sludge
Influent
GBT
Discharge
CCT
Centrate
Centrifuge
Anaerobic Digester
Sodium Hypochlorite NaHSO3
Natural Gas to Cogeneration

Association of Washington Business 25 Treatment Technology Review and Assessment 213512
4.4.2 Advanced Treatment – MF/RO Alternative A flowsheet of the advanced treatment – MF/RO alternative is provided in Figure 4. This alternative builds on the baseline secondary treatment facility, whereby the SRT is increased in the activated sludge process, and MF and RO are added prior to disinfection. The solids treatment train does not change with respect to the baseline. Additionally, a brine management strategy must be considered.
The RO process concentrates contaminants into a smaller volume reject stream. Disposing of the RO reject stream can be a problem because of the potentially large volume of water involved and the concentration of contaminants contained in the brine. For reference, a 5 mgd process wastewater flow might result in 1 mgd of brine reject requiring further management. The primary treatment/handling options for RO reject are as follows:
Zero liquid discharge Surface water discharge Ocean discharge Haul and discharge to coastal location for ocean discharge Sewer discharge Deep well injection Evaporate in a pond Solar pond concentrator
Many of the RO brine reject management options above result in returning the dissolved solids to a “water of the state” such as surface water, groundwater, or marine waters. Past rulings in Washington State have indicated that once pollutants are removed from during treatment they are not to be re-introduced to a water of the state. As a result, technologies with this means for disposal were not considered viable options for management of RO reject water in Washington.
Zero Liquid Discharge
Zero liquid discharge (ZLD) is a treatment process that produces a little or no liquid brine discharge but rather a dried residual salt material. This process improves the water recovery of the RO system by reducing the volume of brine that must be treated and disposed of in some manner. ZLD options include intermediate treatment, thermal-based technologies, pressure driven membrane technologies, electric potential driven membrane technologies, and other alternative technologies.
Summary
There are many techniques which can be used to manage reject brine water associated with RO treatment. The appropriate alternative is primarily governed by geographic and local constraints. A comparison of the various brine management methods and potential costs are provided in Table 6.
Of the listed options, ZLD was considered for this analysis as the most viable approach to RO reject water management. An evaporation pond was used following ZLD. The strength in this combination is ZLD reduces the brine reject volume to treat, which in turn reduces the required evaporation pond footprint. The disadvantage is that evaporation ponds require a substantial amount of physical space which may not be available at existing treatment plant sites. It is also important to recognize that the greenhouse gas (GHG) emissions vary widely for the eight brine management options listed above based on energy and chemical intensity.

26 Association of Washington Business 213512 Treatment Technology Review and Assessment
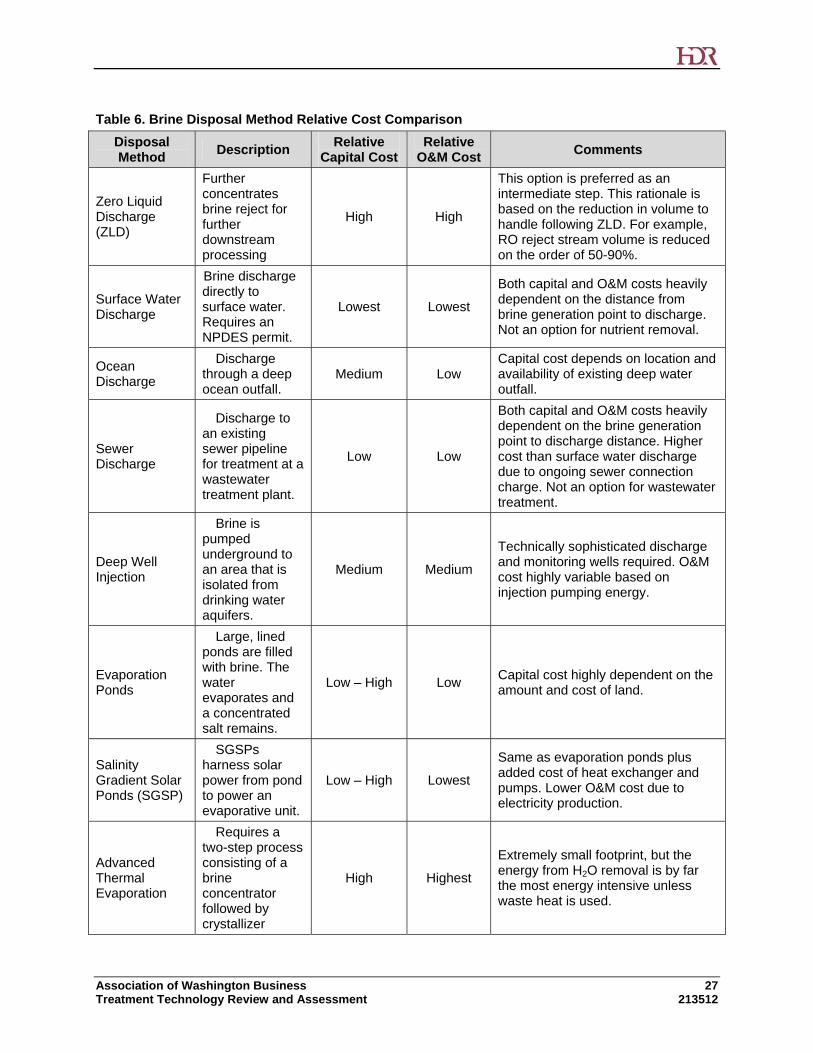
Association of Washington Business 27 Treatment Technology Review and Assessment 213512
Table 6. Brine Disposal Method Relative Cost Comparison
Disposal Method
Description Relative
Capital Cost Relative
O&M Cost Comments
Zero Liquid Discharge (ZLD)
Further concentrates brine reject for further downstream processing
High High
This option is preferred as an intermediate step. This rationale is based on the reduction in volume to handle following ZLD. For example, RO reject stream volume is reduced on the order of 50-90%.
Surface Water Discharge
Brine discharge directly to surface water. Requires an NPDES permit.
Lowest Lowest
Both capital and O&M costs heavily dependent on the distance from brine generation point to discharge. Not an option for nutrient removal.
Ocean Discharge
Discharge through a deep ocean outfall.
Medium Low Capital cost depends on location and availability of existing deep water outfall.
Sewer Discharge
Discharge to an existing sewer pipeline for treatment at a wastewater treatment plant.
Low Low
Both capital and O&M costs heavily dependent on the brine generation point to discharge distance. Higher cost than surface water discharge due to ongoing sewer connection charge. Not an option for wastewater treatment.
Deep Well Injection
Brine is pumped underground to an area that is isolated from drinking water aquifers.
Medium Medium
Technically sophisticated discharge and monitoring wells required. O&M cost highly variable based on injection pumping energy.
Evaporation Ponds
Large, lined ponds are filled with brine. The water evaporates and a concentrated salt remains.
Low – High Low Capital cost highly dependent on the amount and cost of land.
Salinity Gradient Solar Ponds (SGSP)
SGSPs harness solar power from pond to power an evaporative unit.
Low – High Lowest
Same as evaporation ponds plus added cost of heat exchanger and pumps. Lower O&M cost due to electricity production.
Advanced Thermal Evaporation
Requires a two-step process consisting of a brine concentrator followed by crystallizer
High Highest
Extremely small footprint, but the energy from H2O removal is by far the most energy intensive unless waste heat is used.
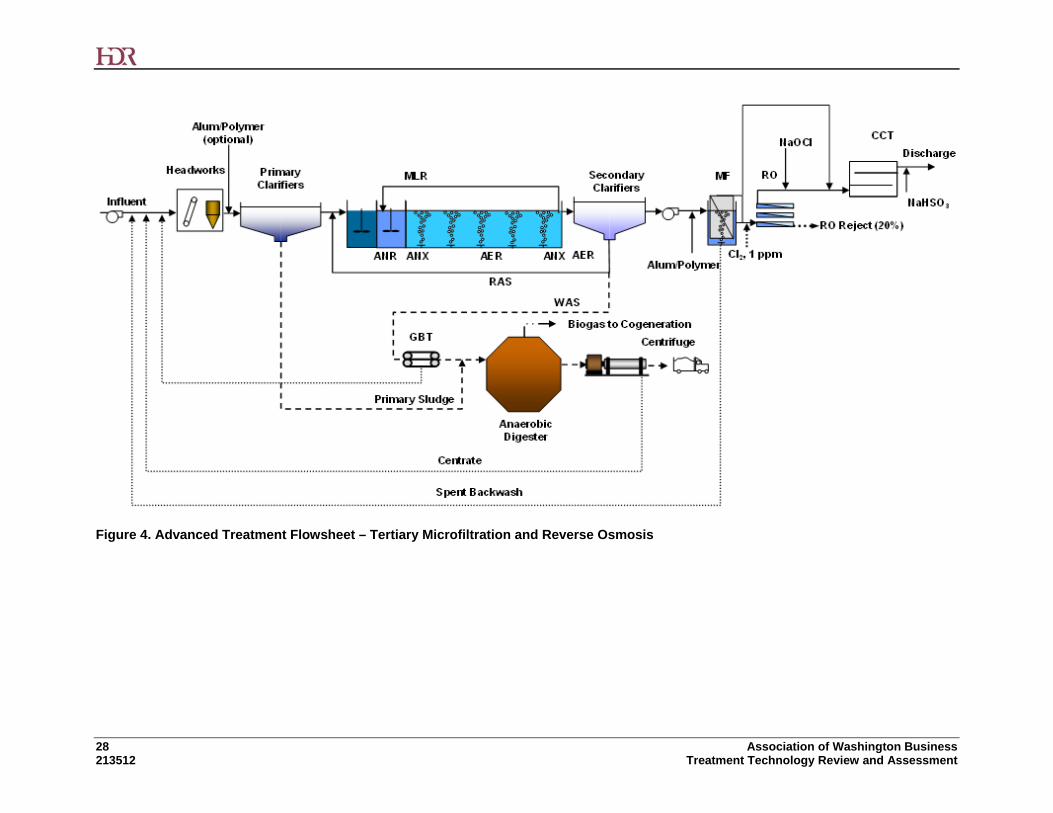
28 Association of Washington Business 213512 Treatment Technology Review and Assessment
Figure 4. Advanced Treatment Flowsheet – Tertiary Microfiltration and Reverse Osmosis

Association of Washington Business 29 Treatment Technology Review and Assessment 213512
4.4.3 Advanced Treatment – MF/GAC Alternative A flowsheet of the advanced treatment – MF/GAC alternative is provided in Figure 5. Following the MF technology, a GAC contactor and media are required.
This alternative was developed as an option that does not require a brine management technology (e.g., ZLD) for comparison to the MF/RO advanced treatment alternative. However, this treatment alternative does require that the GAC be regenerated. A baseline secondary treatment facility can be retrofitted for MF/GAC. If an existing treatment facility has an extended aeration lagoon, the secondary effluent can be fed to the MF/GAC. The longer SRT in the extended aeration lagoon provides all the benefits associated with the long SRT in an activated sludge plant as previously stated:
Lower BOD/TSS discharge load
Higher removal of recalcitrant constituents and heavy metals
Improved water quality and benefit to downstream users
Less downstream algal growth
Reduced receiving water dissolved oxygen demand due to ammonia removal
Reduced ammonia discharge loads, which is toxic to several aquatic species
Improved water quality for habitat, especially as it relates to biodiversity and eutrophication
Secondary clarifier effluent more conditioned for filtration and disinfection
Greater process stability from the anaerobic/anoxic zones serving as a selector
If an existing treatment facility employs a high rate activated sludge process (short SRT) similar to the baseline, it is recommended that the activated sludge process SRT be increased prior to the MF/GAC unit processes. The longer SRT upstream of the MF is preferred to enhance the membrane flux rate, reduce membrane biofouling, increase membrane life, and reduce the chemicals needed for membrane cleaning.
The key technical and operational challenges associated with the tertiary add-on membrane filtration units are as follows:
The membrane filtration technology is a proven and reliable technology. With over 30 years of experience, it has made the transition in recent years from an emerging technology to a proven and reliable technology.
Membrane durability dependent on feed water quality. The water quality is individual facility specific.
Membranes are sensitive to particles, so upstream screening is critical. The newer generations of membranes have technical specifications that require a particular screen size.
Membrane area requirements based on peak flows as water must pass through the membrane pores. Additionally, membranes struggle with variable hydraulic loading. Flow equalization upstream can greatly reduce the required membrane surface area and provide uniform membrane loading.

30 Association of Washington Business 213512 Treatment Technology Review and Assessment
Membrane tanks can exacerbate any foam related issues from the upstream biological process. Foam entrapment in the membrane tank from the upstream process can reduce membrane filtration capacity and in turn result in a plant-wide foam problem.
Reliable access to the membrane modules is key to operation and maintenance. Once PLC is functionary properly, overall maintenance requirements for sustained operation of the system are relatively modest.
The membranes go through frequent membrane relaxing or back pulse and a periodic deep chemical clean in place (CIP) process.
Sizing of membrane filtration facilities governed by hydraulic flux. Municipal wastewaters have flux values that range from about 20 to 40 gallons per square foot per day (gfd) under average annual conditions. The flux associated with industrial applications is wastewater specific.
Following the MF is the activated carbon facilities. There are two kinds of activated carbon used in treating water: powdered activated carbon (PAC) and GAC. PAC is finely-ground, loose carbon that is added to water, mixed for a short period of time, and removed. GAC is larger than PAC, is generally used in beds or tanks that permit higher adsorption and easier process control than PAC allows, and is replaced periodically. PAC is not selective, and therefore, will adsorb all active organic substances making it an impractical solution for a wastewater treatment plant. As a result, GAC was considered for this analysis. The type of GAC (e.g., bituminous and subbituminous coal, wood, walnut shells, lignite or peat), gradation, and adsorption capacity are determined by the size of the largest molecule/ contaminant that is being filtered (AWWA, 1990).
As water flows through the carbon bed, contaminants are captured by the surfaces of the pores until the carbon is no longer able to adsorb new molecules. The concentration of the contaminant in the treated effluent starts to increase. Once the contaminant concentration in the treated water reaches an unacceptable level (called the breakthrough concentration), the carbon is considered "spent" and must be replaced by virgin or reactivated GAC.
The capacity of spent GAC can be restored by thermal reactivation. Some systems have the ability to regenerate GAC on-site, but in general, small systems haul away the spent GAC for off-site regeneration (EPA 1993). For this study, off-site regeneration was assumed.
The basic facilities and their potential unit processes included in this chapter are as follows:
GAC supply and delivery
Influent pumping
o Low head feed pumping
o High head feed pumping (assumed for this study as we have low limits so require high beds)
Contactors and backwash facilities
o Custom gravity GAC contactor
o Pre-engineered pressure GAC contactor (Used for this study)
o Backwash pumping
GAC transport facilities
o Slurry pumps
o Eductors (Used for this study)
Association of Washington Business 31 Treatment Technology Review and Assessment 213512
Storage facilities
o Steel tanks
o Concrete tanks (Used for this study; larger plants would typically select concrete tanks)
Spent carbon regeneration
o On-site GAC regeneration
o Off-Site GAC regeneration
Following the MF is the GAC facility. The GAC contactor provides about a 12-min hydraulic residence time for average annual conditions. The GAC media must be regenerated about twice per year in a furnace. The constituents sorbed to the GAC media are removed during the regeneration process. A typical design has full redundancy and additional storage tankage for spent and virgin GAC. Facilities that use GAC need to decide whether they will regenerate GAC on-site or off-site. Due to challenges associated with receiving air emission permits for new furnaces, it was assumed that off-site regeneration would be evaluated.
The key technical and operational challenges associated with the tertiary add-on GAC units are as follows:
Nearest vendor to acquire virgin GAC – How frequently can they deliver virgin GAC and what are the hauling costs?
Contactor selection is typically based on unit cost and flow variation. The concrete contactor is typically more cost effective at higher flows so it was used for this evaluation. The pre-engineered pressure contactor can handle a wider range of flows than a concrete contactor. Additionally, a pressure system requires little maintenance as they are essentially automated
Periodical contactor backwashing is critical for maintaining the desired hydraulics and control biological growth
Eductors are preferred over slurry pumps because they have fewer mechanical components. Additionally, the pump with eductors is not in contact with the carbon, which reduces wear.
Off-site GAC regeneration seems more likely due to the challenges with obtaining an air emissions permit.

32 Association of Washington Business 213512 Treatment Technology Review and Assessment
Figure 5. Advanced Treatment Flowsheet – Tertiary Microfiltration and Granular Activated Carbon

Association of Washington Business 33 Treatment Technology Review and Assessment 213512
4.5 Steady-State Mass Balance HDR used its steady-state mass balance program to calculate the flows and loads within the candidate advanced treatment processes as a means to size facilities. The design of wastewater treatment facilities are generally governed by steady-state mass balances. For a steady-state mass balance, the conservation of mass is calculated throughout the entire wastewater treatment facility for defined inputs. Dynamic mass balance programs exist for designing wastewater facilities, but for a planning level study such as this, a steady state mass balance program is adequate. A dynamic program is generally used for detailed design and is site-specific with associated requirements for more detailed wastewater characterization.
The set of model equations used to perform a steady-state mass balance are referred to as the model. The model equations provide a mathematical description of various wastewater treatment processes, such as an activated sludge process, that can be used to predict unit performance. The program relies on equations for each unit process to determine the flow, load, and concentration entering and leaving each unit process.
An example of how the model calculates the flow, load, and concentration for primary clarifiers is provided below. The steady-state mass balance equation for primary clarifiers has a single input and two outputs as shown in the simplified Figure 6. The primary clarifier feed can exit the primary clarifiers as either effluent or sludge. Solids not removed across the primaries leave as primary effluent, whereas solids captured leave as primary sludge. Scum is not accounted for.
Figure 6. Primary Clarifier Inputs/Outputs
The mass balance calculation requires the following input:
Solids removal percentage across the primaries (based on average industry accepted performance)
Primary solids thickness (i.e., percent solids) (based on average industry accepted performance)
The steady-state mass balance program provides a reasonable first estimate for the process performance, and an accurate measure of the flows and mass balances at various points throughout the plant. The mass balance results were used for sizing the facility needs for each alternative. A listing of the unit process sizing criterion for each unit process is provided in Appendix A. By listing the unit process sizing criteria, a third-party user could redo the analysis and end up with comparable results. The key sizing criteria that differ between the baseline and treatment alternatives are as follows:
Aeration basin mixed liquor is greater for the advanced treatment alternatives which in turn requires a larger volume
The secondary clarifiers are sized based on hydraulic loading for the baseline versus solids loading for the advanced treatment alternatives
Primary Influent Primary Effluent
Primary Sludge

34 Association of Washington Business 213512 Treatment Technology Review and Assessment
The MF/GAC and MF/RO sizing is only required for the respective advanced treatment alternatives.
4.6 Adverse Environmental Impacts Associated with Advanced Treatment Technologies
The transition from the baseline (conventional secondary treatment) to either advanced treatment alternatives has some environmental impacts that merit consideration, including the following:
Land area for additional system components (which for constrained facility sites, may necessitate land acquisition and encroachment into neighboring properties with associated issues and challenges, etc.).
Increased energy use and atmospheric emissions of greenhouse gases and criteria air contaminants associated with power generation to meet new pumping requirements across the membrane filter systems (MF and RO) and GAC.
Increased chemical demand associated with membrane filters (MF and RO).
Energy and atmospheric emissions associated with granulated charcoal regeneration.
RO brine reject disposal. The zero liquid discharge systems are energy intensive energy and increase atmospheric emissions as a consequence of the electrical power generation required for removing water content from brine reject.
Increase in sludge generation while transitioning from the baseline to the advanced treatment alternatives. There will be additional sludge captured with the chemical addition to the primaries and membrane filters (MF and RO). Additionally, the GAC units will capture more solids.
Benefits to receiving water quality by transitioning from a short SRT (<2 days) in the baseline to a long SRT (>8 days) for the advanced treatment alternatives (as previously stated):
o Lower BOD/TSS discharge load
o Higher removal of recalcitrant constituents and heavy metals
o Improved water quality and benefit to downstream users
o Reduced nutrient loadings to receiving waters and lower algal growth potential
o Reduced receiving water dissolved oxygen demand due to ammonia removal
o Reduced ammonia discharge loads, which is toxic to aquatic species
o Improved water quality for habitat, especially as it relates to biodiversity and eutrophication
o Secondary clarifier effluent better conditioned for subsequent filtration and disinfection
o Greater process stability from the anaerobic/anoxic zones serving as a biological selectors
HDR calculated GHG emissions for the baseline and advanced treatment alternatives. The use of GHG emissions is a tool to normalize the role of energy, chemicals, biosolids hauling, and fugitive emissions (e.g., methane) in a single unit. The mass balance results were used to quantify energy demand and the corresponding GHG emissions for each alterative. Energy

Association of Washington Business 35 Treatment Technology Review and Assessment 213512
demand was estimated from preliminary process calculations. A listing of the energy demand for each process stream, the daily energy demand, and the unit energy demand is provided in Table 7. The advanced treatment options range from 2.3 to 4.1 times greater than the baseline. This large increase in energy demand is attributed to the energy required to pass water through the membrane barriers and/or the granular activated carbon. Additionally, there is energy required to handle the constituents removed as either regenerating the GAC or handling the RO brine reject water. This additional energy required to treat the removed constituents is presented in Table 7.
Table 7. Energy Breakdown for Each Alternative (5 mgd design flow)
Parameter Units Baseline Advanced
Treatment – MF/GAC
Advanced Treatment –
MF/RO
Daily Liquid Stream Energy Demand MWh/d 11.6 23.8 40.8
Daily Solids Stream Energy Demand MWh/d -1.6 -1.1 -1.1
Daily Energy Demand MWh/d 10.0 22.7 39.7
Unit Energy Demand kWh/MG Treated
2,000 4,500 7,900
MWh/d = megawatt hours per day kWh/MG = kilowatt hours per million gallons
Details on the assumptions used to convert between energy demand, chemical demand and production, as well as biologically-mediated gases (i.e., CH4 and N2O) and GHG emissions are provided in Appendix B.
A plot of the GHG emissions for each alternative is shown in Figure 7. The GHG emissions increase from the baseline to the two advanced treatment alternatives. The GHG emissions increase about 50 percent with respect to baseline when MF/GAC is used and the GHG emissions increase over 100 percent with respect to baseline with the MF/RO advanced treatment alternative.
The MF/GAC energy demand would be larger if GAC regeneration was performed on-site. The GHG emissions do not include the energy or air emissions that result from off-site GAC regeneration. Only the hauling associated with moving spent GAC is included. The energy associated with operating the furnace would exceed the GHG emissions from hauling spent GAC.
The zero liquid discharge in the MF/RO alternative alone is comparable to the Baseline. This contribution to increased GHG emissions by zero liquid discharge brine system highlights the importance of the challenges associated with managing brine reject.
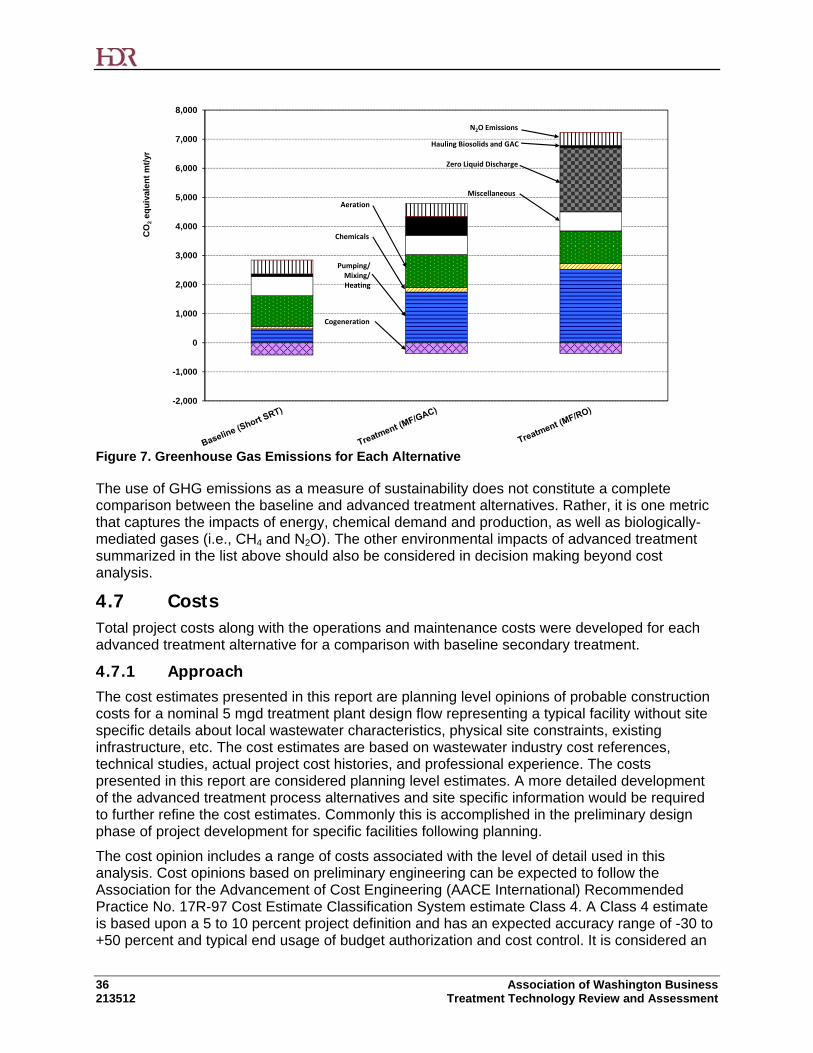
36 Association of Washington Business 213512 Treatment Technology Review and Assessment
Figure 7. Greenhouse Gas Emissions for Each Alternative
The use of GHG emissions as a measure of sustainability does not constitute a complete comparison between the baseline and advanced treatment alternatives. Rather, it is one metric that captures the impacts of energy, chemical demand and production, as well as biologically-mediated gases (i.e., CH4 and N2O). The other environmental impacts of advanced treatment summarized in the list above should also be considered in decision making beyond cost analysis.
4.7 Costs Total project costs along with the operations and maintenance costs were developed for each advanced treatment alternative for a comparison with baseline secondary treatment.
4.7.1 Approach The cost estimates presented in this report are planning level opinions of probable construction costs for a nominal 5 mgd treatment plant design flow representing a typical facility without site specific details about local wastewater characteristics, physical site constraints, existing infrastructure, etc. The cost estimates are based on wastewater industry cost references, technical studies, actual project cost histories, and professional experience. The costs presented in this report are considered planning level estimates. A more detailed development of the advanced treatment process alternatives and site specific information would be required to further refine the cost estimates. Commonly this is accomplished in the preliminary design phase of project development for specific facilities following planning.
The cost opinion includes a range of costs associated with the level of detail used in this analysis. Cost opinions based on preliminary engineering can be expected to follow the Association for the Advancement of Cost Engineering (AACE International) Recommended Practice No. 17R-97 Cost Estimate Classification System estimate Class 4. A Class 4 estimate is based upon a 5 to 10 percent project definition and has an expected accuracy range of -30 to +50 percent and typical end usage of budget authorization and cost control. It is considered an
-2,000
-1,000
0
1,000
2,000
3,000
4,000
5,000
6,000
7,000
8,000
CO
2eq
uiv
alen
t m
t/yr
N2O Emissions
Hauling Biosolids and GAC
Zero Liquid Discharge
Aeration
Chemicals
Pumping/Mixing/Heating
Miscellaneous
Cogeneration
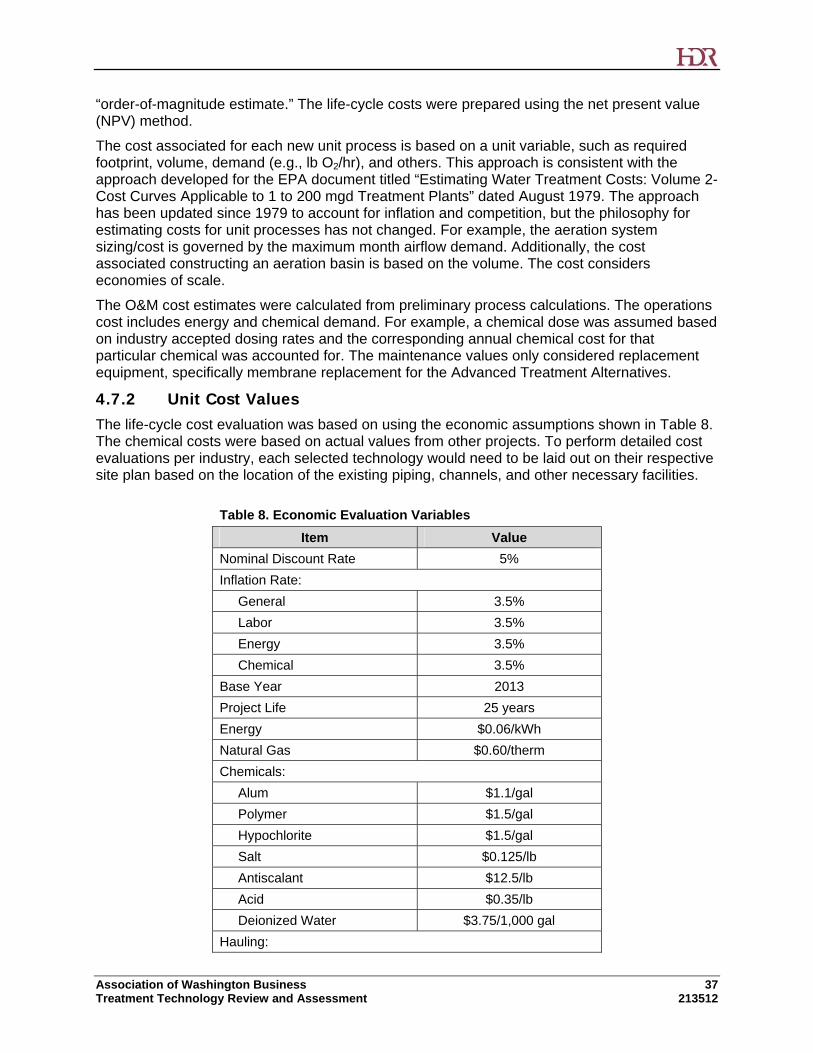
Association of Washington Business 37 Treatment Technology Review and Assessment 213512
“order-of-magnitude estimate.” The life-cycle costs were prepared using the net present value (NPV) method.
The cost associated for each new unit process is based on a unit variable, such as required footprint, volume, demand (e.g., lb O2/hr), and others. This approach is consistent with the approach developed for the EPA document titled “Estimating Water Treatment Costs: Volume 2-Cost Curves Applicable to 1 to 200 mgd Treatment Plants” dated August 1979. The approach has been updated since 1979 to account for inflation and competition, but the philosophy for estimating costs for unit processes has not changed. For example, the aeration system sizing/cost is governed by the maximum month airflow demand. Additionally, the cost associated constructing an aeration basin is based on the volume. The cost considers economies of scale.
The O&M cost estimates were calculated from preliminary process calculations. The operations cost includes energy and chemical demand. For example, a chemical dose was assumed based on industry accepted dosing rates and the corresponding annual chemical cost for that particular chemical was accounted for. The maintenance values only considered replacement equipment, specifically membrane replacement for the Advanced Treatment Alternatives.
4.7.2 Unit Cost Values The life-cycle cost evaluation was based on using the economic assumptions shown in Table 8. The chemical costs were based on actual values from other projects. To perform detailed cost evaluations per industry, each selected technology would need to be laid out on their respective site plan based on the location of the existing piping, channels, and other necessary facilities.
Table 8. Economic Evaluation Variables
Item Value
Nominal Discount Rate 5%
Inflation Rate:
General 3.5%
Labor 3.5%
Energy 3.5%
Chemical 3.5%
Base Year 2013
Project Life 25 years
Energy $0.06/kWh
Natural Gas $0.60/therm
Chemicals:
Alum $1.1/gal
Polymer $1.5/gal
Hypochlorite $1.5/gal
Salt $0.125/lb
Antiscalant $12.5/lb
Acid $0.35/lb
Deionized Water $3.75/1,000 gal
Hauling:

38 Association of Washington Business 213512 Treatment Technology Review and Assessment
Table 8. Economic Evaluation Variables
Item Value
Biosolids Hauling Distance 100 miles (one way)
Biosolids Truck Volume 6,000 gal/truck
Biosolids Truck Hauling $250/truck trip
GAC Regeneration Hauling Distance
250 miles (round trip)
GAC Regeneration Truck Volume
$20,000 lb GAC/truck
GAC Regeneration Truck Hauling
Included in cost of Virgin GAC
kWh= kilowatt hours; lbs=pounds; GAC=granulated activated carbon; gal=gallon
4.7.3 Net Present Value of Total Project Costs and Operations and Maintenance Cost in 2013 Dollars
An estimate of the net present value for the baseline treatment process and the incremental cost to implement the advanced treatment alternatives is shown in Table 9. The cost for the existing baseline treatment process was estimated based on new construction for the entire conventional secondary treatment process (Figure 3). The incremental cost to expand from existing baseline secondary treatment to advanced treatment was calculated by taking the difference between the baseline and the advanced treatment alternatives. These values serve as a benchmark for understanding the prospective cost for constructing advanced treatment at the planning level of process development.
Table 9. Treatment Technology Total Project Costs in 2013 Dollars for a 5 mgd Facility
Alternative Total Construction
Cost, 2013 dollars ($ Million)
O&M Net Present Value, 2013
dollars ($ Million)*
Total Net Present Value, 2013
dollars ($ Million)
NPV Unit Cost, 2013
dollars ($/gpd)
Baseline (Conventional Secondary Treatment)*
59 - 127 5 - 11 65 – 138 13 - 28
Advanced Treatment – MF/RO**
108 - 231 31 - 67 139 - 298 28 - 60
Advanced Treatment – MF/GAC
131 - 280 50 - 108 181 - 388 36 - 78
Incremental Increase to Advanced Treatment MF/RO
48 - 104 26 - 56 75 - 160 15 - 32
Incremental Increase to Advanced Treatment MF/GAC
71 - 153 45 - 97 117 - 250 23 - 50
* The additional cost to increase the SRT to upwards of 30-days is about $12 - 20 million additional dollars in total project cost for a 5 mgd design flow ** Assumes zero liquid discharge for RO brine management, followed by evaporation ponds. Other options are available as listed in Section 4.4.2. O&M=operations and maintenance; MF/RO=membrane filtration/reverse osmosis; MF/GAC=membrane filtration/granulated activated carbon; gpd=gallons per day
Association of Washington Business 39 Treatment Technology Review and Assessment 213512
4.7.4 Unit Cost Assessment Costs presented above are based on a treatment capacity of 5.0 mgd, however, existing treatment facilities range dramatically across Washington in size and flow treated. Table 9 indicates that the unit capital cost for baseline conventional secondary treatment for 5.0 mgd ranges between $13 to 28 per gallon per day of treatment capacity. The unit cost for the advanced treatment alternatives increases the range from the low $20s to upper $70s on a per-gallon per-day of capacity. The increase in cost for the advanced treatment alternatives is discussed in the sub-sections below.
Advanced Treatment MF/RO
The advanced treatment MF/RO alternative has a total present worth unit cost range of $28 to $60 million in per gallon per day of capacity. This translates to an incremental cost increase with respect to the baseline of $15 to $32 million dollars in per gallon per day treatment capacity. The key differences in cost between the baseline and the advanced treatment MF/RO are as follows:
Larger aeration basins than the baseline to account for the longer SRT (<8 days versus >8 days).
Additional pumping stations to pass water through the membrane facilities (MF and RO). These are based on peak flows.
Membrane facilities (MF and RO; equipment, tanks chemical feed facilities, pumping, etc.) and replacement membrane equipment.
Additional energy and chemical demand to operate the membrane facilities (MF and RO) and GAC.
Zero liquid discharge facilities to further concentrate the brine reject.
Zero liquid discharge facilities are energy/chemically intensive and they require membrane replacement every few years due to the brine reject water quality.
An evaporation pond to handle the brine reject that has undergone further concentration by zero liquid discharge.
The advanced treatment MF/RO assumes that 100 percent of the flow is treated by MF, followed by 50 percent of the flow treated with RO. Sending a portion of flow through the RO and blending it with the balance of plant flows ensures a stable water to discharge. The RO brine reject (about 1.0 mgd) undergoes ZLD pre-treatment that further concentrates the brine reject to about 0.1-0.5 mgd. The recovery for both RO and ZLD processes is highly dependent on water quality (e.g., silicate levels).
ZLD technologies are effective at concentrating brine reject, but it comes at a substantial cost ($17.5 per gallon per day of ZLD treatment capacity of brine reject). The zero liquid discharge estimate was similar in approach to the demonstration study by Burbano and Brandhuber (2012) for La Junta, Colorado. The ability to further concentrate brine reject was critical from a management standpoint. Although 8 different options were presented for managing brine reject in Section 4.4.2, none of them is an attractive approach for handling brine reject. ZLD provides a viable pre-treatment step that requires subsequent downstream treatment. Evaporation ponds following ZLD were used for this study. Without ZLD, the footprint would be 3-5 times greater.
Roughly 30 acres of evaporation ponds, or more, may be required to handle the ZLD concentrate, depending upon concentrator effectiveness, local climate conditions, residuals

40 Association of Washington Business 213512 Treatment Technology Review and Assessment
accumulation, residual removal, etc. Precipitation throughout Washington is highly variable which can greatly influence evaporation pond footprint. The approach for costing the evaporation pond was in accordance with Mickley et al. (2006) and the cost was about $2.6 million.
Recent discussions with an industry installing evaporation ponds revealed that they will use mechanical evaporators to enhance evaporation rates. The use of mechanical evaporators was not included in this study, but merits consideration if a facility is performing a preliminary design that involves evaporation ponds. The mechanical evaporators have both a capital costs and annual energy costs.
Advanced Treatment MF/GAC
The advanced treatment MF/GAC alternative has a total present worth unit cost range of $36 to $78 million in per gallon per day capacity. This translates to an incremental cost increase with respect to the baseline of $23 to $50 million dollars on a per gallon per day of treatment capacity basis. The key differences in cost between the baseline and the advanced treatment MF/GAC are as follows:
Larger aeration basins than the baseline to account for the longer SRT (<8 days versus >8 days).
Additional pumping stations to pass water through the MF membrane and GAC facilities. These are based on peak flows.
GAC facilities (equipment, contact tanks, pumping, GAC media, etc.)
Additional energy to feed and backwash the GAC facilities.
GAC media replacement was the largest contributor of any of the costs.
Additional hauling and fees to regenerate GAC off-site.
The advanced treatment MF/GAC assumes that 100 percent of the flow is treated by MF, followed by 100 percent of the flow treated with GAC. The GAC technology is an established technology. The costing approach was in accordance with EPA guidelines developed in 1998.
The critical issue while costing the GAC technology is whether a GAC vendor/regeneration facility is located within the region. On-site regeneration is an established technology with a furnace.
However, there are several concerns as listed in Section 4.4.3:
Ability to obtain an air emissions permit
Additional equipment to operate and maintain
Energy and air emissions to operate a furnace on-site
Operational planning to ensure that furnace is operating 90-95 percent of the time. Otherwise, operations is constantly starting/stopping the furnace which is energy intensive and deleterious to equipment
If not operated properly, the facility has the potential to create hazardous/toxic waste to be disposed
If located within a couple hundred miles, off-site regeneration is preferred. For this study, off-site regeneration was assumed with a 250-mile (one-way) distance to the nearest vendor that can provide virgin GAC and a regeneration facility.
Association of Washington Business 41 Treatment Technology Review and Assessment 213512
Incremental Treatment Cost
The difference in costs between the baseline and the advanced treatment alternatives is listed in Table 10. The incremental cost to retrofit the baseline facility to the advanced treatment was calculated by taking the difference between the two alternatives. These values should serve as a planning level benchmark for understanding the potential cost for retrofitting a particular facility. The incremental cost is unique to a particular facility. Several reasons for the wide range in cost in retrofitting a baseline facility to advanced treatment are summarized as follows:
Physical plant site constraints. A particular treatment technology may or may not fit within the constrained particular plant site. A more expensive technology solution that is more compact may be required. Alternately, land acquisition may be necessary to enlarge a plant site to allow the addition of advanced treatment facilities. An example of the former is stacking treatment processes vertically to account for footprint constraints. This is an additional financial burden that would not be captured in the incremental costs presented in Table 10.
Yard piping. Site specific conditions may prevent the most efficient layout and piping arrangement for an individual facility. This could lead to additional piping and pumping to convey the wastewater through the plant. This is an additional financial burden that would not be captured in the incremental costs presented in Table 10.
Pumping stations. Each facility has unique hydraulic challenges that might require additional pumping stations not captured in this planning level analysis. This is an additional financial burden that would not be captured in the incremental costs presented in Table 10.
A cursory unit cost assessment was completed to evaluate how costs would compare for facilities with lower (0.5 mgd) and higher capacity (25 mgd), as presented in Table 10. Capital costs were also evaluated for a 0.5 mgd and 25 mgd facility using non-linear scaling equations with scaling exponents. The unit capital cost for baseline conventional secondary treatment for 0.5 mgd and 25 mgd is approximately $44 and $10 per gallon per day of treatment capacity, respectively. The incremental unit costs to implement an advanced treatment retrofit for 0.5 mgd would range between $30 to $96 per gallon per day of treatment capacity and would be site and discharger specific. The incremental unit costs to implement an advanced treatment retrofit for 25 mgd would range between $10 to 35 per gallon per day of treatment capacity and would be site and discharger specific. The larger flow, 25 mgd, is not as expensive on a per gallon per day of treatment capacity. This discrepancy for the 0.5 and 25 mgd cost per gallon per day of treatment capacity is attributed to economies of scale. Cost curve comparisons (potential total construction cost and total net present value) for the baseline and the two tertiary treatment options (MF/RO and MF/GAC) are shown in Figure 8 and Figure 9 between the flows of 0.5 and 25 mgd. It is important to note that while the economies of scale suggest lower incremental costs for the larger size facilities, some aspects of the advanced treatment processes may become infeasible at larger capacities due to factors such as physical space limitations and the large size requirements for components such as RO reject brine management.

42 Association of Washington Business 213512 Treatment Technology Review and Assessment
Table 10. Treatment Technology Total Project Costs in 2013 Dollars for a 0.5 mgd Facility and a 25 mgd Facility
Alternative Total Construction Cost, 2013 dollars
($ Million)
O&M Net Present Value, 2013
dollars ($ Million)*
Total Net Present Value, 2013
dollars ($ Million)
NPV Unit Cost, 2013
dollars ($/gpd)
0.5 mgd:
Baseline (Conventional Secondary Treatment)
15 - 32 0.5 - 1.1 15 - 33 31 - 66
Advanced Treatment – MF/RO**
27 - 58 3.2 - 6.8 30 - 65 60 - 130
Advanced Treatment – MF/GAC
33 - 70 5 - 10.8 38 - 81 76 - 162
Incremental Increase to Advanced Treatment MF/RO
12 - 26 2.7 - 5.7 15 - 32 30 - 64
Incremental Increase to Advanced Treatment MF/GAC
18 - 38 4.6 - 9.8 22 - 48 45 - 96
25 mgd:
Baseline (Conventional Secondary Treatment)
156 - 335 25 - 54 182 - 389 7 - 16
Advanced Treatment – MF/RO**
283 - 606 157 - 336 440 - 942 18 - 38
Advanced Treatment – MF/GAC
343 - 735 252 - 541 595 - 1276 24 - 51
Incremental Increase to Advanced Treatment MF/RO
127 - 272 131 - 281 258 - 553 10 - 22
Incremental Increase to Advanced Treatment MF/GAC
187 - 401 226.9 - 486 414 - 887 17 - 35
* Does not include the cost for labor. ** Assumes zero liquid discharge for RO brine management, followed by evaporation ponds. Other options are available as listed in Section 4.4.2. MF/RO=membrane filtration/reverse osmosis MF/GAC=membrane filtration/granulated activated carbon O&M=operations and maintenance gpd=gallons per day
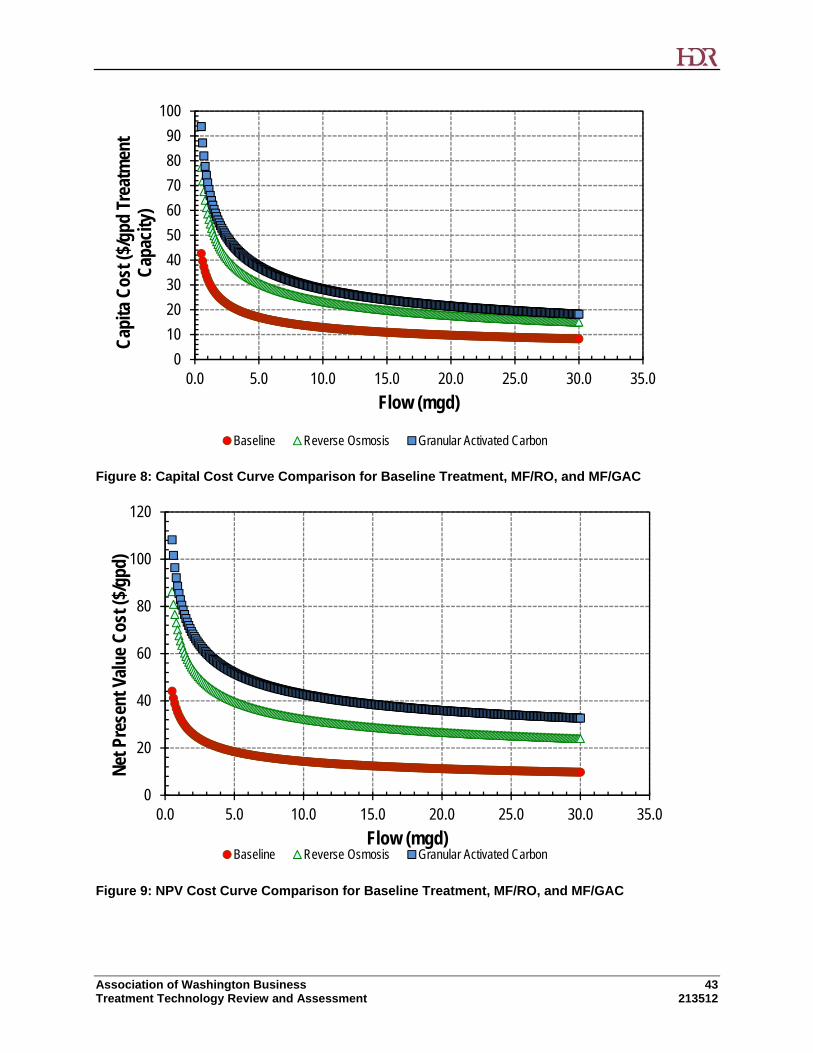
Association of Washington Business 43 Treatment Technology Review and Assessment 213512
Figure 8: Capital Cost Curve Comparison for Baseline Treatment, MF/RO, and MF/GAC
Figure 9: NPV Cost Curve Comparison for Baseline Treatment, MF/RO, and MF/GAC
0
10
20
30
40
50
60
70
80
90
100
0.0 5.0 10.0 15.0 20.0 25.0 30.0 35.0
Cap
ita C
ost (
$/gp
d Tr
eatm
ent
Cap
acity
)
Flow (mgd)
Baseline Reverse Osmosis Granular Activated Carbon
0
20
40
60
80
100
120
0.0 5.0 10.0 15.0 20.0 25.0 30.0 35.0
Net
Pre
sent
Val
ue C
ost (
$/gp
d)
Flow (mgd)Baseline Reverse Osmosis Granular Activated Carbon

44 Association of Washington Business 213512 Treatment Technology Review and Assessment
4.8 Pollutant Mass Removal An estimate of the projected load removal for the four constituents of concern was developed and is presented in Table 11. The current secondary effluent and advanced treatment effluent data is based on the only available data to HDR and is from municipal treatment plant facilities. Data is not available for advanced treatment facilities such as MF/RO or MF/GAC. Due to this lack of data, advanced treatment using MF/RO or MF/GAC was assumed to remove an additional zero to 90 percent of the constituents presented resulting in the range presented in Table 11. It is critical to note these estimates are based on limited data and are presented here simply for calculating mass removals. Current secondary effluent for industrial facilities would likely be greater than the data presented here and as a result, the projected effluent quality for industrial facilities would likely be higher as well. Based on the limited actual data from municipal treatment facilities, Table 11 indicates that mercury and BAP effluent limits may potentially be met using advanced treatment at facilities with similar existing secondary effluent quality.
Table 11. Pollutant Mass Removal by Contaminant for a 5 mgd Facility
Component PCBs Mercury Arsenic BAP
Required HHWQC based Effluent Quality (µg/L)
0.0000064 0.005 0.018 0.0013
Current Secondary Effluent Concentration (µg/L)*
0.0015 0.025 7.5 0.00031
Projected Effluent Quality (µg/L) from Advanced Treatment (MF/RO or MF/GAC)*
0.000041 – 0.00041
0.00012 – 0.0012
0.38 – 3.8 0.000029 -
0.00029
Mass Removed (mg/d)** 21 - 28 451 - 471 71,000 – 135,000
0.4 – 5.0
Mass Removed (lb/d)** 0.000045 – 0.000061
0.00099 – 0.0010
0.16 – 0.30 0.0000010 – 0.0000012
* Based on or estimated for actual treatment plant data from municipal facilities. Data sets are limited and current secondary effluent for industrial facilities would likely be greater than the data presented here. ** 1 lb = 454,000 mg HHWQC=human health-based water quality criteria
MF/RO=membrane filtration/reverse osmosis MF/GAC=membrane filtration/granulated activated carbon µg/L=micrograms per liter mg/d=milligrams per day lb/d=pounds per day
Unit costs were developed based on required mass removal from a 5 mgd facility for each of the four constituents of concern to reduce discharges from current secondary effluent quality to the assumed required effluent quality (HHWQC). It important to note that this study concludes it is unclear if existing technology can meet the required effluent quality, however, the information presented in Table 12 assumes HHWQC would be met for developing unit costs. The unit costs are expressed as dollars in NPV (over a 25 year period) per pound of constituent removed over the same 25 year period using advanced treatment with MF/RO. The current secondary effluent quality data presented are based on typical secondary effluent quality expected for a municipal/industrial discharger. Table 12 suggests unit costs are most significant in meeting the PCB, mercury, and PAH required effluent quality.
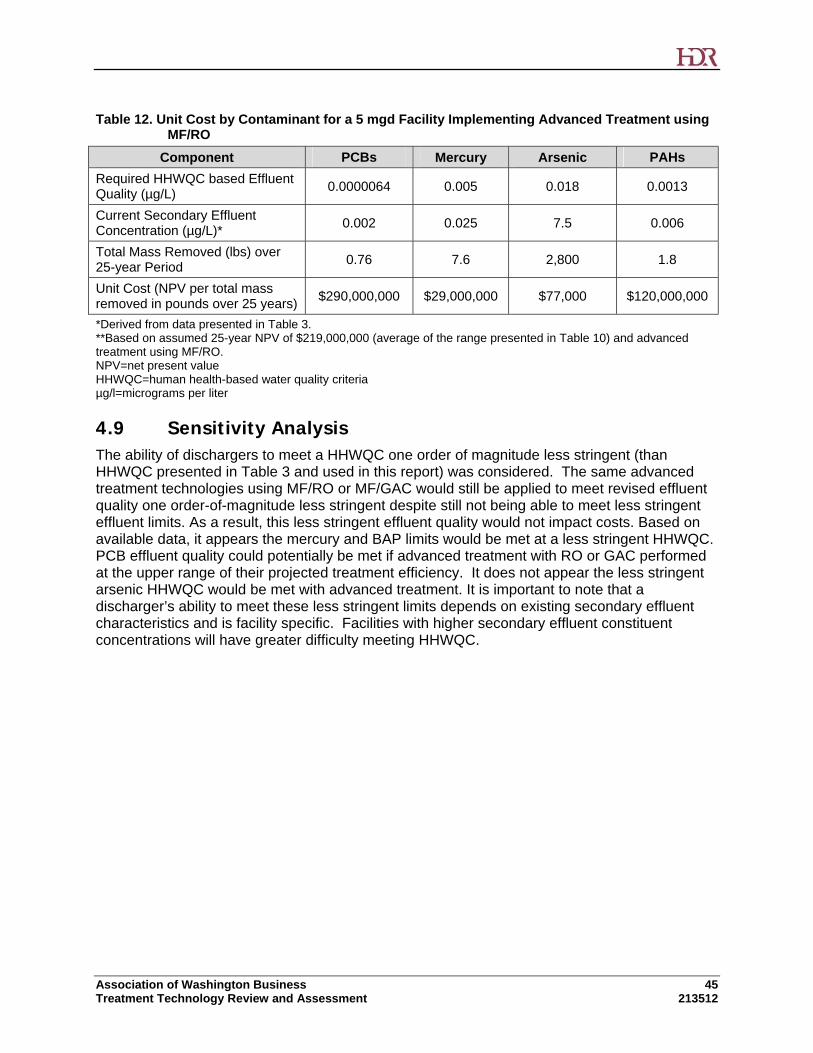
Association of Washington Business 45 Treatment Technology Review and Assessment 213512
Table 12. Unit Cost by Contaminant for a 5 mgd Facility Implementing Advanced Treatment using MF/RO
Component PCBs Mercury Arsenic PAHs
Required HHWQC based Effluent Quality (µg/L)
0.0000064 0.005 0.018 0.0013
Current Secondary Effluent Concentration (µg/L)*
0.002 0.025 7.5 0.006
Total Mass Removed (lbs) over 25-year Period
0.76 7.6 2,800 1.8
Unit Cost (NPV per total mass removed in pounds over 25 years)
$290,000,000 $29,000,000 $77,000 $120,000,000
*Derived from data presented in Table 3. **Based on assumed 25-year NPV of $219,000,000 (average of the range presented in Table 10) and advanced treatment using MF/RO. NPV=net present value HHWQC=human health-based water quality criteria
µg/l=micrograms per liter
4.9 Sensitivity Analysis The ability of dischargers to meet a HHWQC one order of magnitude less stringent (than HHWQC presented in Table 3 and used in this report) was considered. The same advanced treatment technologies using MF/RO or MF/GAC would still be applied to meet revised effluent quality one order-of-magnitude less stringent despite still not being able to meet less stringent effluent limits. As a result, this less stringent effluent quality would not impact costs. Based on available data, it appears the mercury and BAP limits would be met at a less stringent HHWQC. PCB effluent quality could potentially be met if advanced treatment with RO or GAC performed at the upper range of their projected treatment efficiency. It does not appear the less stringent arsenic HHWQC would be met with advanced treatment. It is important to note that a discharger’s ability to meet these less stringent limits depends on existing secondary effluent characteristics and is facility specific. Facilities with higher secondary effluent constituent concentrations will have greater difficulty meeting HHWQC.

46 Association of Washington Business 213512 Treatment Technology Review and Assessment
5.0 Summary and Conclusions This study evaluated treatment technologies potentially capable of meeting revised effluent discharge limits associated with revised HHWQC. HDR completed a literature review of potential technologies and engineering review of their capabilities to evaluate and screen treatment methods for meeting revised effluent limits for four constituents of concern: arsenic, BAP, mercury, and PCBs. HDR selected two alternatives to compare against a baseline, including enhanced secondary treatment, enhanced secondary treatment with MF/RO, and enhanced secondary treatment with MF/GAC. HDR developed capital costs, operating costs, and a NPV for each alternative, including the incremental cost to implement from an existing secondary treatment facility.
The following conclusions can be made from this study.
Revised HHWQC based on state of Oregon HHWQC (2001) and EPA “National Recommended Water Quality Criteria” will result in very low water quality criteria for toxic constituents.
There are limited “proven” technologies available for dischargers to meet required effluent quality limits that would be derived from revised HHWQC.
o Current secondary wastewater treatment facilities provide high degrees of removal for toxic constituents; however, they will not be capable of compliance with water quality-based NPDES permit effluent limits derived from revised HHWQC.
o Advanced treatment technologies have been investigated and candidate process trains have been conceptualized for toxics removal.
Advanced wastewater treatment technologies may enhance toxics removal rates, however they will not be capable of compliance with HHWQC based effluent limits for PCBs. The lowest levels achieved based on the literature review were between <0.00001 and 0.00004 µg/L, as compared to a HHWQC of 0.0000064 µg/L.
Based on very limited performance data for arsenic and mercury from advanced treatment information available in the technical literature, compliance with revised criteria may or may not be possible, depending upon site specific circumstances.
Compliance with a HHWQC for arsenic of 0.018 µg/L appears unlikely. Most treatment technology performance information available in the literature is based on drinking water treatment applications targeting a much higher SDWA MCL of 10 µg/L.
Compliance with a HHWQC for mercury of 0.005 µg/L appears to be potentially attainable on an average basis but perhaps not if effluent limits are structured on a maximum monthly, weekly or daily basis. Some secondary treatment facilities attain average effluent mercury levels of 0.009 to 0.066 µg/L. Some treatment facilities with effluent filters attain average effluent mercury levels of 0.002 to 0.010 µg/L. Additional advanced treatment processes are expected to enhance these removal rates, but little mercury performance data is available for a definitive assessment.
Little information is available to assess the potential for advanced technologies to comply with revised benzo(a)pyrene criteria. A municipal wastewater treatment plant study reported both influent and effluent BAP concentrations less than the HHWQC of 0.0013 ug/L (Ecology, 2010).

Association of Washington Business 47 Treatment Technology Review and Assessment 213512
o Some technologies may be effective at treating identified constituents of concern to meet revised limits while others may not. It is therefore even more challenging to identify a technology that can meet all constituent limits simultaneously.
o A HHWQC that is one order-of-magnitude less stringent could likely be met for mercury and PAHs however it appears PCB and arsenic limits would not be met.
Advanced treatment processes incur significant capital and operating costs.
o Advanced treatment process to remove additional arsenic, benzo(a)pyrene, mercury, and PCBs would combine enhancements to secondary treatment with microfiltration membranes, reverse osmosis, and granular activated carbon and increase the estimated capital cost of treatment from $17 to $29 in dollars per gallon per day of capacity (based on a 5.0 mgd facility).
o The annual operation and maintenance costs for the advanced treatment process train will be substantially higher (approximately $5 million - $15 million increase for a 5.0 mgd capacity facility) than the current secondary treatment level.
Implementation of additional treatment will result in additional collateral impacts.
o High energy consumption.
o Increased greenhouse gas emissions.
o Increase in solids production from chemical addition to the primaries. Additionally, the membrane and GAC facilities will capture more solids that require handling.
o Increased physical space requirements at treatment plant sites for advanced treatment facilities and residuals management including reverse osmosis reject brine processing.
It appears advanced treatment technology alone cannot meet all revised water quality limits and implementation tools are necessary for discharger compliance.
o Implementation flexibility will be necessary to reconcile the difference between the capabilities of treatment processes and the potential for HHWQC driven water quality based effluent limits to be lower than attainable with technology
48 Association of Washington Business 213512 Treatment Technology Review and Assessment
6.0 References Ahn, J.-H., Kim, S, Park, H., Rahm, B., Pagilla, K., Chandran, K. 2010. N2O emissions from
activated sludge processes, 2008-2009: Results of a national surveying program in the United States. Environ. Sci. Technol., 44(12):4505-4511.
Andrianisa, H.,A., Ito, A., Sasaki, A., Aizawa, J., and Umita, T. 2008. Biotransformation of arsenic species by activated sludge and removal of bio-oxidised arsenate from wastewater by coagulation with ferric chloride. Water Research, 42(19), pp. 4809-4817
Andrianisa, H.,A., Ito, A., Sasaki, A., Ikeda, M., Aizawa, J., and Umita, T. 2006. Behaviour of arsenic species in batch activated sludge process: biotransformation and removal. Water Science and Technology, 54(8), pp. 121-128.
Burbano, A and Brandhuber, P. (2012) Demonstration of membrane zero liquid discharge for drinking water systems. Water Environment Research Federation (WERF) Report WERF5T10.
California Air Resources Board, ICLEI, California Climate Action Registry, The Climate Registry. 2008. Local Government Operations Protocol. For the quantification and reporting of greenhouse gas emissions inventories, Version 1.1.
Chung, B., Cho, J., Song, C., and Park, B. Degradation of naturally contaminated polycyclic aromatic hydrocarbons in municipal sewage sludge by electron beam irradiation. Bulletin of Environmental Contamination and Toxicology, 81(1), pp. 7-11.
CRITFC (Columbia River Inter-Tribal Fish Commission). 1994. A fish consumption survey of the Umatilla, Nez Perce, Yakama and Warm Springs Tribes of the Columbia River Basin. Columbia River Inter-Tribal Fish Commission Report reference #94-03, Portland, Oregon.
Eckenfelder, W.W., Industrial Water Pollution Control, 2nd ed. (New York: McGraw-Hill, 1989).
Ecology. 2010. (Lubliner, B., M. Redding, and D. Ragsdale). Pharmaceuticals and Personal Care Products in Municipal Wastewater and Their Removal by Nutrient Treatment Technologies. Washington State Department of Ecology, Olympia, WA. Publication Number 10-03-004.
González, D., Ruiz, L.M., Garralón, G., Plaza, F., Arévalo, J., Parada, J., Péreza, J., Morenoa, B., and Ángel Gómez, M. 2012. Wastewater polycyclic aromatic hydrocarbons removal by membrane bioreactor. Desalination and Water Treatment, 42, pp. 94–99
Grosser, J. 2010. The Challenge: Measure Arsenic in Drinking Water. White paper.
Haapeaa, P., and Tuhkanen, T. 2006. Integrated treatment of PAH contaminated soil by soil washing, ozonation and biological treatment . Journal of Hazardous Materials,136(21), pp. 244–250
Intergovernmental Panel on Climate Change. 2006. 2006 IPCC Guidelines for National Greenhouse Gas Inventories. Prepared by the National Greenhouse Gas Inventories Programme, Eggleston, S., Buendia, L., Miwa, K., Ngara, T., Tanabe, K. (eds.) Published: IGES, Japan.
LaGrega, M.D., Buckingham P.L. and Evans J.C., Hazardous Waste Management, 1st ed. (New York: McGraw-Hill, 1994).

Association of Washington Business 49 Treatment Technology Review and Assessment 213512
Melcer, H., Steel, P., and Bedford, W.K. 1993. Removal of polycyclic aromatic hydrocarbons and hetercyclic nitrogenous compounds by a POTW receiving industrial discharges. Proceeding of WEFTEC 1993.
Mickley and Associates. 2006. Membrane Concentrate Disposal: Practices and Regulations. U.S. Department of the Interior, Bureau of Reclamation, Contract No. 98-FC-81-0054.
National Council for Air and Stream Improvement, Inc. (NCASI). 1998. Technical and economic feasibility assessment of metals reduction in pulp and paper mill wastewaters. Technical Bulletin No. 756. Research Triangle Park, NC: National Council for Air and Stream Improvement, Inc., 1998.
National Council for Air and Stream Improvement, Inc. (NCASI). 2004. Investigation of advanced techniques to remove low-level mercury from pulp and paper mill effluents. Technical Bulletin No. 870. Research Triangle Park, NC: National Council for Air and Stream Improvement, Inc.
National Council for Air and Stream Improvement, Inc. (NCASI). 2000. Memorandum: Information on PCB Water Quality Criteria, Analytical Methods, and Measurement Results for Point Sources and Ambient Waters. Technical Bulletin No. 807. Research Triangle Park, NC: National Council for Air and Stream Improvement, Inc.
National Council for Air and Stream Improvement, Inc. (NCASI). 2000. Bench scale testing of processes to reduce metals concentrations in pulp and paper mill wastewaters. Technical Bulletin No. 807. Research Triangle Park, NC: National Council for Air and Stream Improvement, Inc.
Ning, R. 2002. Arsenic removal by reverse osmosis. Desalination, 143 (3), pp. 237–241
Oleszczuk, P., Hale, S. E., Lehmann, J., and Cornelissen, G. 2012. Activated carbon and biochar amendments decrease pore-water concentrations of polycyclic aromatic hydrocarbons (PAHs) in sewage sludge. Bioresource Technology, 111, pp. 84–91
Oregon Department of Environmental Quality. 2011. Table 40: Human Health Water Quality Criteria for Toxic Pollutants, Effective October 17, 2011. Available on-line at: http://www.deq.state.or.us/wq/standards/toxics.htm
Owen, W.F. 1982. Energy in Wastewater Treatment. Prentice-Hall, Englewood Cliffs, New Jersey.
Parker, W., Monteith, H., and Pileggi, V. 2009. Estimation of Biodegradation and Liquid-Solid Partitioning Coefficients for Complex PAHs in Wastewater Treatment. Proceedings of the Water Environment Federation 2009, pp. 2537-2554.
Rodrigue, P., and Rielly, A. 2009. Effectiveness of a membrane bioreactor on weak domestic wastewater containing polychlorinated biphenyls. Proceedings of the Water Environment Federation, Microconstituents and Industrial Water Quality 2009, pp. 174-184(11)
Russo, L., Rizzo, L., and Belgiorno, V. 2012. Ozone oxidation and aerobic biodegradation with spent mushroom compost for detoxification and benzo(a)pyrene removal from contaminated soil. Chemosphere, 87(6), pp. 595-601
SimaPro 6. 2008. Life Cycle Analysis Software. The Netherlands.
Sponza, D., and Oztekin, R. 2010. Effect of sonication assisted by titanium dioxide and ferrous ions on polyaromatic hydrocarbons (PAHs) and toxicity removals from a petrochemical industry wastewater in Turkey. Journal of Chemical Technology & Biotechnology, 85(7), pp. 913-925
50 Association of Washington Business 213512 Treatment Technology Review and Assessment
U.S. Environmental Protection Agency (EPA). 2003. Arsenic Treatment Technology Handbook for Small Systems, EPA 816R03014.
U.S. Environmental Protection Agency. 2000. Methodology for Deriving Ambient Water Quality Criteria for the Protection of Human Health. EPA‐ 822‐B‐00‐004, October 2000.
U.S. Environmental Protection Agency. 2007. The Emissions & Generation Resource Integrated Database – eGrid WebVersion1.0. United States Environmental Protection Agency, Washington, D.C.
U.S. Department of Agriculture (USDA). 1998. Continuing survey of food intakes by individuals: 1994-96, 1998. U.S. Department of Agriculture, Agricultural Research Service.
Water Environment Federation. 2009. Design of Municipal Wastewater Treatment Plants, WEF Manual of Practice 8, Fourth Edition, ASCE Manuals and Reports on Engineering Practice No. 76, Volume 1. Alexandria, VA.
Water Environment Research Foundation (WERF). 2012. Demonstration of Membrane Zero Liquid Discharge for Drinking Water Systems, A Literature Review. WERF5T10.
Water Environment Research Foundation (WERF). 2011. Striking the Balance Between Nutrient Removal in Wastewater Treatment and Sustainability. NUTR1R06n.
WesTech brochure. Victorville case study. Vendor Brochure.
Williams, M. 2003. A Review of Wastewater Treatment by Reverse Osmosis. White paper
Yerushalmi, L., Nefil, S., Hausler, R., and Guiot, S. 2006. Removal of pyrene and benzo(a)pyrene from contaminated water by sequential and simultaneous ozonation and biotreatment. Water Environment Research, 78 ( 11).
Zeng, Y., Hong, A., and Wavrek, D. 2000. Integrated chemical-biological treatment of benzo[a]pyrene. Environmental Science and Technology, 34 (5), pp 854–862

Association of Washington Business 51 Treatment Technology Review and Assessment 213512
This page left intentionally blank.

52 Association of Washington Business 213512 Treatment Technology Review and Assessment
7.0 Appendices
Appendix A - Unit Process Sizing Criteria Appendix B - Greenhouse Gas Emissions Calculation Assumptions

Association of Washington Business 53 Treatment Technology Review and Assessment 213512
This page left intentionally blank.

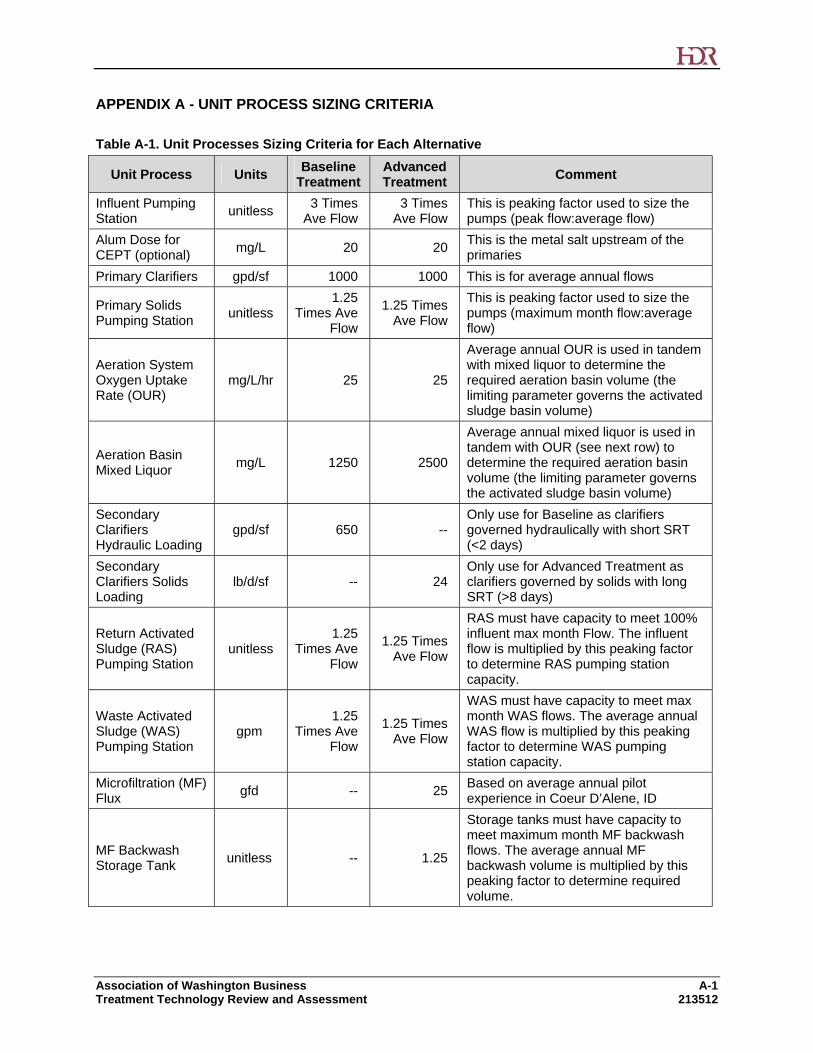
Association of Washington Business A-1 Treatment Technology Review and Assessment 213512
APPENDIX A - UNIT PROCESS SIZING CRITERIA
Table A-1. Unit Processes Sizing Criteria for Each Alternative
Unit Process Units Baseline
Treatment Advanced Treatment
Comment
Influent Pumping Station
unitless 3 Times
Ave Flow 3 Times
Ave Flow This is peaking factor used to size the pumps (peak flow:average flow)
Alum Dose for CEPT (optional)
mg/L 20 20 This is the metal salt upstream of the primaries
Primary Clarifiers gpd/sf 1000 1000 This is for average annual flows
Primary Solids Pumping Station
unitless 1.25
Times Ave Flow
1.25 Times Ave Flow
This is peaking factor used to size the pumps (maximum month flow:average flow)
Aeration System Oxygen Uptake Rate (OUR)
mg/L/hr 25 25
Average annual OUR is used in tandem with mixed liquor to determine the required aeration basin volume (the limiting parameter governs the activated sludge basin volume)
Aeration Basin Mixed Liquor
mg/L 1250 2500
Average annual mixed liquor is used in tandem with OUR (see next row) to determine the required aeration basin volume (the limiting parameter governs the activated sludge basin volume)
Secondary Clarifiers Hydraulic Loading
gpd/sf 650 -- Only use for Baseline as clarifiers governed hydraulically with short SRT (<2 days)
Secondary Clarifiers Solids Loading
lb/d/sf -- 24 Only use for Advanced Treatment as clarifiers governed by solids with long SRT (>8 days)
Return Activated Sludge (RAS) Pumping Station
unitless 1.25
Times Ave Flow
1.25 Times Ave Flow
RAS must have capacity to meet 100% influent max month Flow. The influent flow is multiplied by this peaking factor to determine RAS pumping station capacity.
Waste Activated Sludge (WAS) Pumping Station
gpm 1.25
Times Ave Flow
1.25 Times Ave Flow
WAS must have capacity to meet max month WAS flows. The average annual WAS flow is multiplied by this peaking factor to determine WAS pumping station capacity.
Microfiltration (MF) Flux
gfd -- 25 Based on average annual pilot experience in Coeur D’Alene, ID
MF Backwash Storage Tank
unitless -- 1.25
Storage tanks must have capacity to meet maximum month MF backwash flows. The average annual MF backwash volume is multiplied by this peaking factor to determine required volume.
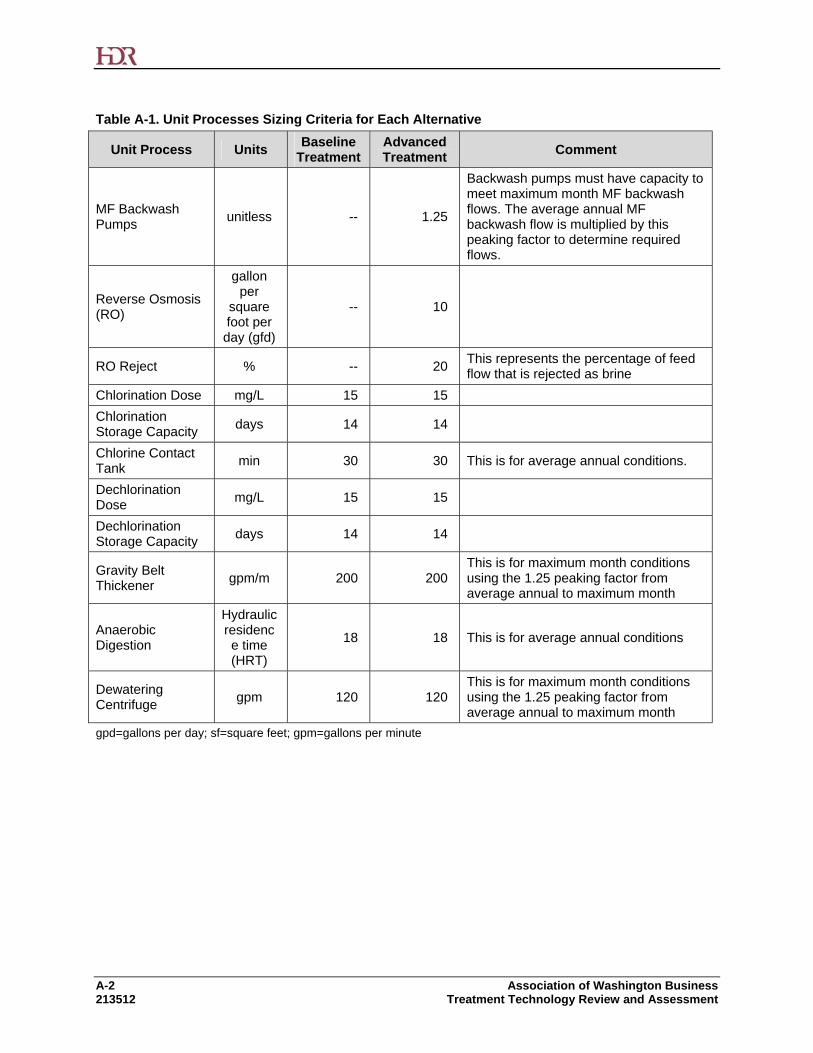
A-2 Association of Washington Business 213512 Treatment Technology Review and Assessment
Table A-1. Unit Processes Sizing Criteria for Each Alternative
Unit Process Units Baseline
Treatment Advanced Treatment
Comment
MF Backwash Pumps
unitless -- 1.25
Backwash pumps must have capacity to meet maximum month MF backwash flows. The average annual MF backwash flow is multiplied by this peaking factor to determine required flows.
Reverse Osmosis (RO)
gallon per
square foot per day (gfd)
-- 10
RO Reject % -- 20 This represents the percentage of feed flow that is rejected as brine
Chlorination Dose mg/L 15 15
Chlorination Storage Capacity
days 14 14
Chlorine Contact Tank
min 30 30 This is for average annual conditions.
Dechlorination Dose
mg/L 15 15
Dechlorination Storage Capacity
days 14 14
Gravity Belt Thickener
gpm/m 200 200 This is for maximum month conditions using the 1.25 peaking factor from average annual to maximum month
Anaerobic Digestion
Hydraulic residence time (HRT)
18 18 This is for average annual conditions
Dewatering Centrifuge
gpm 120 120 This is for maximum month conditions using the 1.25 peaking factor from average annual to maximum month
gpd=gallons per day; sf=square feet; gpm=gallons per minute
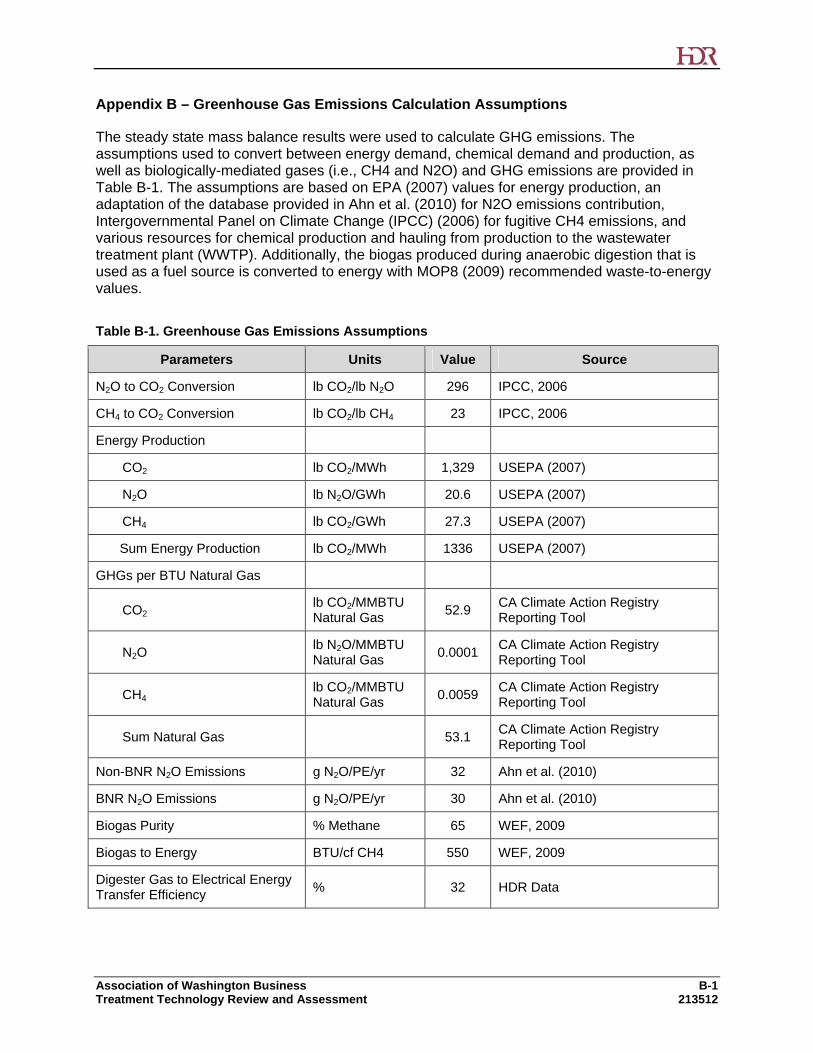
Association of Washington Business B-1 Treatment Technology Review and Assessment 213512
Appendix B – Greenhouse Gas Emissions Calculation Assumptions
The steady state mass balance results were used to calculate GHG emissions. The assumptions used to convert between energy demand, chemical demand and production, as well as biologically-mediated gases (i.e., CH4 and N2O) and GHG emissions are provided in Table B-1. The assumptions are based on EPA (2007) values for energy production, an adaptation of the database provided in Ahn et al. (2010) for N2O emissions contribution, Intergovernmental Panel on Climate Change (IPCC) (2006) for fugitive CH4 emissions, and various resources for chemical production and hauling from production to the wastewater treatment plant (WWTP). Additionally, the biogas produced during anaerobic digestion that is used as a fuel source is converted to energy with MOP8 (2009) recommended waste-to-energy values.
Table B-1. Greenhouse Gas Emissions Assumptions
Parameters Units Value Source
N2O to CO2 Conversion lb CO2/lb N2O 296 IPCC, 2006
CH4 to CO2 Conversion lb CO2/lb CH4 23 IPCC, 2006
Energy Production
CO2 lb CO2/MWh 1,329 USEPA (2007)
N2O lb N2O/GWh 20.6 USEPA (2007)
CH4 lb CO2/GWh 27.3 USEPA (2007)
Sum Energy Production lb CO2/MWh 1336 USEPA (2007)
GHGs per BTU Natural Gas
CO2 lb CO2/MMBTU Natural Gas
52.9 CA Climate Action Registry Reporting Tool
N2O lb N2O/MMBTU Natural Gas
0.0001 CA Climate Action Registry Reporting Tool
CH4 lb CO2/MMBTU Natural Gas
0.0059 CA Climate Action Registry Reporting Tool
Sum Natural Gas 53.1 CA Climate Action Registry Reporting Tool
Non-BNR N2O Emissions g N2O/PE/yr 32 Ahn et al. (2010)
BNR N2O Emissions g N2O/PE/yr 30 Ahn et al. (2010)
Biogas Purity % Methane 65 WEF, 2009
Biogas to Energy BTU/cf CH4 550 WEF, 2009
Digester Gas to Electrical Energy Transfer Efficiency
% 32 HDR Data

B-2 Association of Washington Business 213512 Treatment Technology Review and Assessment
Table B-1. Greenhouse Gas Emissions Assumptions
Parameters Units Value Source
Chemical Production
Alum lb CO2/lb Alum 0.28 SimaPro 6.0 - BUWAL250, Eco-indicator 95
Polymer lb CO2/lb Polymer
1.18 Owen (1982)
Sodium Hypochlorite lb CO2/lb Sodium Hypochlorite
1.07 Owen (1982)
Building Energy Efficiency kBTU/sf/yr 60 Calif. Commercial End-Use Survey (2006)
Hauling Distance -
Local miles 100 -
Hauling Emissions
Fuel Efficiency miles per gallon 8
CO2 kg CO2/gal diesel 10.2 CA Climate Action Registry Reporting Tool
N2O kg N2O/gal diesel 0.0001 CA Climate Action Registry Reporting Tool
CH4 kg CH4/gal diesel 0.003 CA Climate Action Registry Reporting Tool
Sum Hauling Fuel kg CO2/gal diesel 10.2 CA Climate Action Registry Reporting Tool
GWh = Giga Watt Hours MWh = Mega Watt Hours MMBTU = Million British Thermal Units BTU = British Thermal Unit PE = Population Equivalents kBTU/sf/yr = 1,000 British Thermal Units per Square Foot per Year cf = cubic feet lb = pound kg = kilogram gal = gallon