nmdc result updated
TRANSCRIPT

8/3/2019 NMDC Result Updated
http://slidepdf.com/reader/full/nmdc-result-updated 1/12
Please refer to important disclosures at the end of this report 1
Particulars (` cr) 3QFY12 2QFY11 % chg (yoy) 2QFY12 % chg (qoq)
Net sales 2,822 2,622 7.6 3,062 (7.8)
EBITDA 2,261 2,017 12.1 2,435 (7.2)
% margin 80.1 76.9 320bp 79.5 59bp
PAT 1,859 1,519 22.4 1,963 (5.3)
Source: Company, Angel Research
For 3QFY2012, NMDC’s profitability came in ahead of our estimates on account
of higher than expected realizations. We maintain Buy rating on the stock.
Realization up 7.6% yoy and 9.0% qoq: NMDC’s net sales increased by 7.6% yoy
to ` 2,822cr (slightly above our estimate of ` 2,745). Blended realization surprised
us positively (+6.1% yoy and +9.0% qoq to 4,394/tonne). However, iron ore
sales volumes were below our estimate (grew by only 1.4% yoy to 6.4mn tonnes).
Iron ore sales volumes were affected due to breakdown of slurry pipeline in
Bailadila mines and lower availability of railway rakes.
EBITDA/tonne increased by 10.5% yoy: During the quarter, EBITDA increased by
12.1% yoy to ` 2,261cr, in-line with the increase in sales. EBITDA/tonne increased
by 10.5% yoy and 9.9% qoq to ` 3,532 due to higher average realization. Other
income rose by 78.3% yoy to ` 525cr. Hence, PAT grew by 22.4% yoy to ` 1,859cr
(above our estimate of ` 1,757).
Outlook and valuation: Over the past five years, NMDC has traded at an average
EV/EBITDA of 13.7x, compared to its current valuation of 4.4x FY2013E
EV/EBITDA. Strong balance sheet, presence in sellers market (iron ore), relative
immunity to iron ore price declines, low cost of production, high-grade mines,
long mine life and compelling valuations make NMDC an attractive bet at these
levels. Valuing the stock at 6.0x FY2013E EV/EBITDA, we derive a fair price of
`227 and maintain our Buy rating on the stock.
Key financials
Y/E March (` cr) FY2010 FY2011 FY2012E FY2013E
Net sales 6,239 11,369 11,732 13,163
% chg (17.5) 82.2 3.2 12.2
Net profit 3,451 6,499 7,497 8,380
% chg (21.1) 88.3 15.3 11.8
FDEPS (`) 8.7 16.4 18.9 21.1
OPM (%) 70.9 76.1 79.4 78.9
P/E (x) 21.2 11.3 9.8 8.7
P/BV (x) 5.1 3.8 2.9 2.3
RoE (%) 26.6 38.8 33.9 29.8
RoCE (%) 33.4 50.6 41.4 36.2
EV/Sales (x) 9.7 4.9 4.3 3.5
EV/EBITDA (x) 13.6 6.5 5.5 4.4
Source: Company, Angel Research
BUYCMP ` 185
Target Price ` 227
Investment Period 12 months
Stock Info
Sector
Bloomberg Code
Shareholding Pattern (%)
Promoters 90.0
MF / Banks / Indian Fls 8.4
FII / NRIs / OCBs 0.8
Indian Public / Others 0.9
Abs. (%) 3m 1yr 3yr
Sensex (2.7) (11.6) 92.3
NMDC (20.5) (30.5) 11.6
Face Value ( ` )
BSE Sensex
Nifty
Reuters Code
73,169
0.8
305/136
60921
Mining
Avg. Daily Volume
Market Cap ( ` cr)
Beta
52 Week High / Low
1
17,432
5,270
NMDC.BO
NMDC@IN
Bhavesh Chauhan
Tel: 022- 39357600 Ext: 6821
NMDC
Performance Highlights
3QFY2012 Result Update | Mining
February 2, 2011

8/3/2019 NMDC Result Updated
http://slidepdf.com/reader/full/nmdc-result-updated 2/12
NMDC | 3QFY2012 Result Update
February 2, 2011 2
Exhibit 1: 3QFY2012 performance
Y/E March (` cr) 3QFY12 3QFY11 yoy % 2QFY12 qoq %
Net Sales 2,822 2,622 7.6 3,062 (7.8)
Raw Material (33) (28) 18.4 63 (152.9)% of net sales (1.2) (1.1) 2.1
Consumption of stores & spares 60 51 16.8 52 14.3
% of net sales 2.1 1.9 1.7
Staff Cost 139 109 27.3 134 3.3
% of net sales 4.9 4.2 4.4
Other Expenditure 396 473 (16.3) 377 5.0
% of net sales 14.0 18.1 12.3
Total Expenditure 561 605 (7.3) 627 (10.5)
% of net sales 19.9 23.1 20.5
Operating Profit 2,261 2,017 12.1 2,435 (7.2)
OPM% 80.1 76.9 79.5
Other Operating Income - - -
EBITDA 2,261 2,017 12.1 2,435 (7.2)
EBITDA margin (%) 80.1 76.9 79.5
Interest - - -
Depreciation 34 29 17.3 32 6.4
Other Income 525 295 78.3 503 4.5
Exceptional Items - - -
Profit before Tax 2,752 2,282 20.6 2,906 (5.3)
% of net sales 97.5 87.0 94.9
Tax 893 763 17.0 943 (5.3)
% of PBT 32.4 33.4 32.4
PAT 1,859 1,519 22.4 1,963 (5.3)
Source: Company, Angel Research
Exhibit 2: 3QFY2012 – Actual vs. Angel estimates
(` cr) Actual Estimates Variation (%)
Net sales 2,822 2,745 2.8
EBITDA 2,261 2,127 6.3
EBITDA margin (%) 80.1 77.5 261bp
PAT 1,859 1,757 5.8
Source: Company, Angel Research

8/3/2019 NMDC Result Updated
http://slidepdf.com/reader/full/nmdc-result-updated 3/12
NMDC | 3QFY2012 Result Update
February 2, 2011 3
Result highlights
Realization rises 6.1% yoy and 9.0% qoq
NMDC’s net sales increased by 7.6% yoy to ` 2,822cr (slightly above our estimate
of ` 2,745). Blended realization surprised us positively (+6.1% yoy and +9.0% qoq
to 4,394/tonne). However, iron ore sales volumes were below our estimate (grew
by only 1.4% yoy to 6.4mn tonnes). Iron ore sales volumes were affected due to
breakdown of slurry pipeline in Bailadila mines and lower availability of railway
rakes.
Exhibit 3: Sales volumes up 1.4% yoy
Source: Company, Angel Research
Exhibit 4: Realization increased by 6.1% yoy
Source: Company, Angel Research
Exhibit 5: Net sales grew by 7.6% yoy
Source: Company, Angel Research
EBITDA/tonne increased by 10.5% yoy
During the quarter, EBITDA increased by 12.1% yoy to ` 2,261cr, in-line with the
increase in sales. EBITDA margin expanded by 320bp yoy to 80.1%. EBITDA/tonne
increased by 10.5% yoy and 9.9% qoq to ` 3,532 due to higher average
realization. Royalty and cess expenses/tonne stood flat yoy but increased 35.1%
qoq to ` 410.
-20
-10
0
10
20
30
40
50
60
0
1
2
3
4
5
6
7
8
9
3QFY10 1QFY11 3QFY11 1QFY12 3QFY12
( % )
( m n t o n n e s )
Sales volume % yoy (RHS)
-60
-40
-20
0
20
40
60
80
100
120
0
500
1,000
1,500
2,000
2,500
3,000
3,500
4,000
4,500
5,000
3QFY10 1QFY11 3QFY11 1QFY12 3QFY12
( % )
( ` / t o n n e )
Average revenue % yoy (RHS)
0
20
40
60
80
100
120
0
500
1,000
1,500
2,000
2,500
3,000
3,500
4,000
1QFY11 2QFY11 3QFY11 4QFY11 1QFY12 2QFY12 3QFY12
(
% ) ( `
c r )
Net sales (LHS) yoy change (RHS)

8/3/2019 NMDC Result Updated
http://slidepdf.com/reader/full/nmdc-result-updated 4/12
NMDC | 3QFY2012 Result Update
February 2, 2011 4
Exhibit 6: EBITDA/tonne grew by 10.2% yoy
Source: Company, Angel Research
Exhibit 7: EBITDA margin stood at 80.1%
Source: Company, Angel Research
Other income boosts PAT growth
Other income increased by 78.3% yoy to ` 525cr on account of higher yields as
well as higher cash balances on a yoy basis. Hence, PAT grew by 22.4% yoy to
` 1,859cr (above our estimate of ` 1,757).
Exhibit 8: Net margin stood at 65.9%
Source: Company, Angel Research
(80.0)
(60.0)
(40.0)
(20.0)
0.0
20.0
40.0
60.0
80.0
100.0
120.0
0
500
1,000
1,500
2,000
2,500
3,000
3,500
4,000
3QFY10 1QFY11 3QFY11 1QFY12 3QFY12
( % )
( ` / t o n n e )
EBITDA/tonne % yoy (RHS)
0.0
10.0
20.0
30.0
40.0
50.0
60.0
70.0
80.0
90.0
100.0
0
500
1,000
1,500
2,000
2,500
3,000
3QFY10 1QFY11 3QFY11 1QFY12 3QFY12
( % )
( `
c r )
EBITDA (LHS) EBITDA margin (RHS)
0.0
10.0
20.0
30.0
40.0
50.0
60.0
70.0
0
500
1,000
1,500
2,000
2,500
3QFY10 4QFY10 1QFY11 2QFY11 3QFY11 4QFY11 1QFY12 2QFY12 3QFY12
( % ) ( `
c r )
Net profit (LHS) Net profit margin (RHS)

8/3/2019 NMDC Result Updated
http://slidepdf.com/reader/full/nmdc-result-updated 5/12
NMDC | 3QFY2012 Result Update
February 2, 2011 5
Investment rationale
Targets production to 40mn tonnes by FY2014–15E
NMDC aims to ramp up the company’s production capacity to 40mn tonnes by
FY2014–15E through increased exploration of its existing mines and development
of new mines, i.e., Deposit 11B and Deposit 13 in Bailadila and Kumaraswany,
respectively, in Karnataka. We expect NMDC’s sales volumes to grow at a CAGR
of 10.2% during FY2011-13.
Strong balance sheet could pave way for overseas acquisitions
During September 2011, NMDC purchased a 50% stake in Australia-based
Legacy Iron Ore (Legacy) as a cornerstone investor for ` 92cr. Also, the company is
currently prospecting various mining assets, including an iron ore mine and a
phosphate mine in Australia, an iron ore mine in Brazil and a coking coal asset inRussia. With a strong balance sheet having net cash of ` 20,725cr (September 30,
2011), we do not rule out the company acquiring more mining assets overseas.
However, given that NMDC is a government-owned company, we do not foresee a
big-ticket acquisition.
Seeking to diversify into steel making
Management intends to diversify its operations by moving downstream through
establishing steel plants and pellet plants. Accordingly, on December 10, 2010,
the company had signed a joint venture (JV) with OJSC Severstal (a vertically
integrated steel maker from Russia) to build an integrated 3mn tonne steel plant inKarnataka. This JV will have captive coking coal mine in Russia, while it will have
an iron ore mining subsidiary in India. Over 90% of the land acquisition is
complete, which gives comfort as land acquisition has been a major bottleneck to
greenfield projects in recent times.
Exhibit 9: Chhattisgarh steel project status
Capacity 3mn tonnes per year
Capex ` 15,525cr
Land Total land required: 1,934 acres. Total land acquired: 1,783 acres.
Balance land is under allotment process.Date ofcompletion
42 months from “Zero date” i.e., receipt of all statutory clearance/approvals and placement of orders.Targeted period – FY2015
Source: Company, Angel Research

8/3/2019 NMDC Result Updated
http://slidepdf.com/reader/full/nmdc-result-updated 6/12
NMDC | 3QFY2012 Result Update
February 2, 2011 6
Outlook and valuation
Over the past five years, NMDC has traded at an average EV/EBITDA of 13.7x,
compared to its current valuation of 4.4x FY2013 EV/EBITDA. Strong balance
sheet, presence in sellers market (iron ore), relative immunity to iron ore price
declines, low cost of production, high-grade mines, long mine life and compelling
valuations make NMDC an attractive bet at these levels. Valuing the stock at 6.0x
FY2013E EV/EBITDA, we derive a fair price of `227 and maintain our Buy rating
on the stock.
Exhibit 10: Key assumptions
FY2012E FY2013E
Sales volume (mn tonnes) 28 32
Average realization (US$/tonne) 85 83
Source: Angel Research
Exhibit 11: EPS – Angel forecast vs. consensus
Year (`) Angel forecast Bloomberg consensus Variation (%)
FY2012E 18.9 19.8 (4.5)
FY2013E 21.1 19.1 10.7
Source: Bloomberg, Angel Research
Exhibit 12: EV/EBITDA band
Source: Bloomberg, Angel Research
0
50,000
100,000
150,000
200,000
250,000
May-06 Apr-07 Mar-08 Feb-09 Jan-10 Dec-10 Nov-11
( ` c r )
5x 8x 11x 17x 14x
8/3/2019 NMDC Result Updated
http://slidepdf.com/reader/full/nmdc-result-updated 7/12
NMDC | 3QFY2012 Result Update
February 2, 2011 7
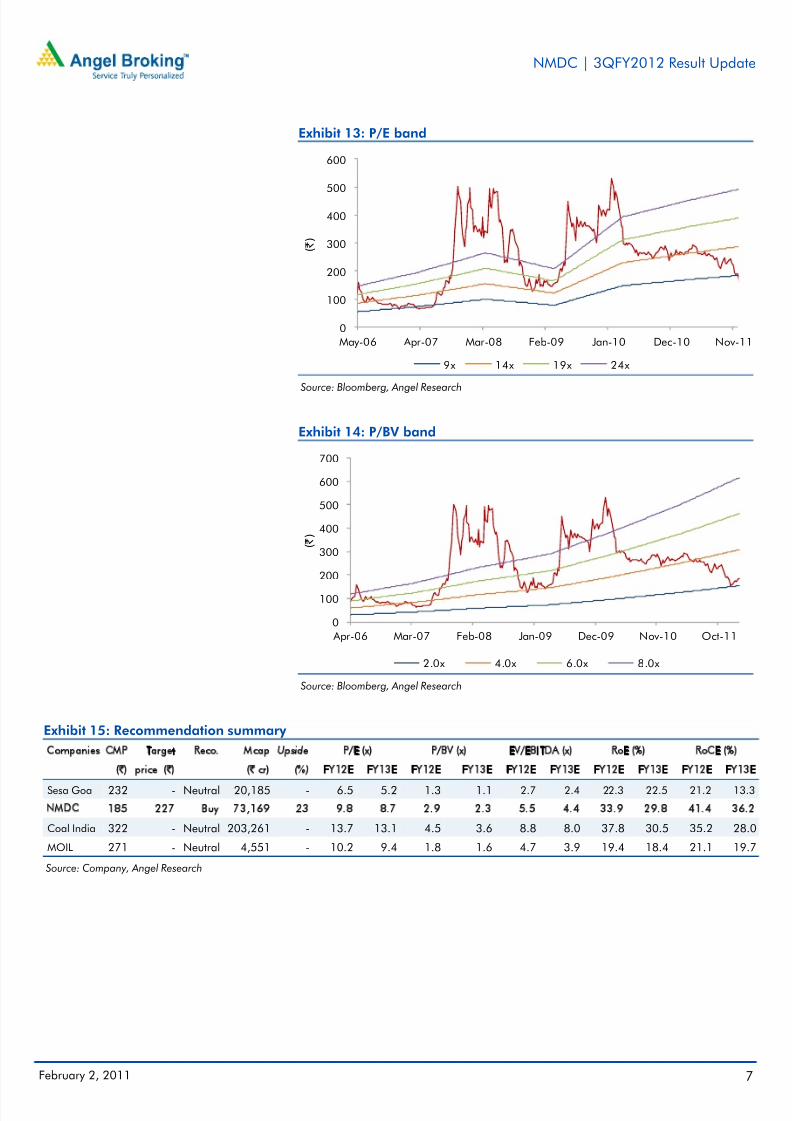
Exhibit 13: P/E band
Source: Bloomberg, Angel Research
Exhibit 14: P/BV band
Source: Bloomberg, Angel Research
Exhibit 15: Recommendation summary
Companies CMP Target Reco. Mcap Upside P/E (x) P/BV (x) EV/EBITDA (x) RoE (%) RoCE (%)
(`) price (`) (` cr) (%) FY12E FY13E FY12E FY13E FY12E FY13E FY12E FY13E FY12E FY13E
Sesa Goa 232 - Neutral 20,185 - 6.5 5.2 1.3 1.1 2.7 2.4 22.3 22.5 21.2 13.3
NMDC 185 227 Buy 73,169 23 9.8 8.7 2.9 2.3 5.5 4.4 33.9 29.8 41.4 36.2
Coal India 322 - Neutral 203,261 - 13.7 13.1 4.5 3.6 8.8 8.0 37.8 30.5 35.2 28.0
MOIL 271 - Neutral 4,551 - 10.2 9.4 1.8 1.6 4.7 3.9 19.4 18.4 21.1 19.7
Source: Company, Angel Research
0
100
200
300
400
500
600
May-06 Apr-07 Mar-08 Feb-09 Jan-10 Dec-10 Nov-11
( ` )
9x 14x 19x 24x
0
100
200
300
400
500
600
700
Apr-06 Mar-07 Feb-08 Jan-09 Dec-09 Nov-10 Oct-11
( ` )
2.0x 4.0x 6.0x 8.0x
8/3/2019 NMDC Result Updated
http://slidepdf.com/reader/full/nmdc-result-updated 8/12
NMDC | 3QFY2012 Result Update
February 2, 2011 8
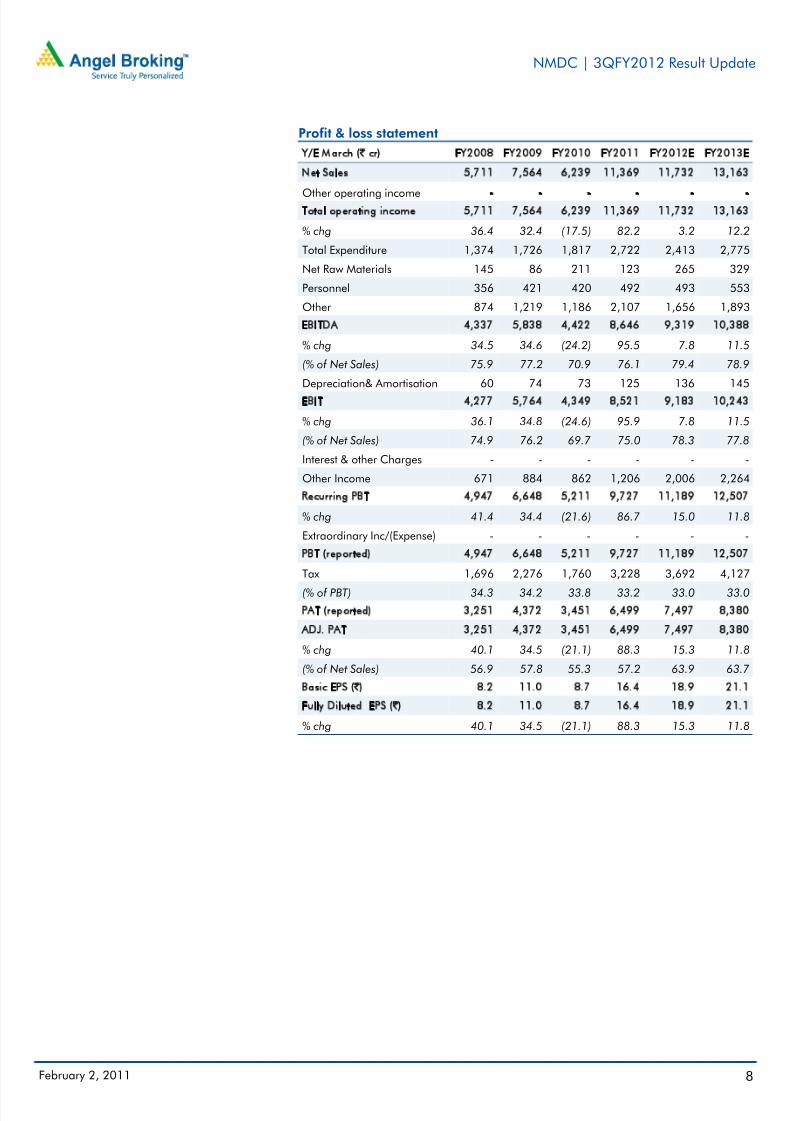
Profit & loss statement
Y/E March (` cr) FY2008 FY2009 FY2010 FY2011 FY2012E FY2013E
Net Sales 5,711 7,564 6,239 11,369 11,732 13,163
Other operating income - - - - - -Total operating income 5,711 7,564 6,239 11,369 11,732 13,163
% chg 36.4 32.4 (17.5) 82.2 3.2 12.2
Total Expenditure 1,374 1,726 1,817 2,722 2,413 2,775
Net Raw Materials 145 86 211 123 265 329
Personnel 356 421 420 492 493 553
Other 874 1,219 1,186 2,107 1,656 1,893
EBITDA 4,337 5,838 4,422 8,646 9,319 10,388
% chg 34.5 34.6 (24.2) 95.5 7.8 11.5
(% of Net Sales) 75.9 77.2 70.9 76.1 79.4 78.9
Depreciation& Amortisation 60 74 73 125 136 145
EBIT 4,277 5,764 4,349 8,521 9,183 10,243
% chg 36.1 34.8 (24.6) 95.9 7.8 11.5
(% of Net Sales) 74.9 76.2 69.7 75.0 78.3 77.8
Interest & other Charges - - - - - -
Other Income 671 884 862 1,206 2,006 2,264
Recurring PBT 4,947 6,648 5,211 9,727 11,189 12,507
% chg 41.4 34.4 (21.6) 86.7 15.0 11.8
Extraordinary Inc/(Expense) - - - - - -
PBT (reported) 4,947 6,648 5,211 9,727 11,189 12,507
Tax 1,696 2,276 1,760 3,228 3,692 4,127
(% of PBT) 34.3 34.2 33.8 33.2 33.0 33.0
PAT (reported) 3,251 4,372 3,451 6,499 7,497 8,380
ADJ. PAT 3,251 4,372 3,451 6,499 7,497 8,380
% chg 40.1 34.5 (21.1) 88.3 15.3 11.8
(% of Net Sales) 56.9 57.8 55.3 57.2 63.9 63.7
Basic EPS (`) 8.2 11.0 8.7 16.4 18.9 21.1
Fully Diluted EPS (̀ ) 8.2 11.0 8.7 16.4 18.9 21.1
% chg 40.1 34.5 (21.1) 88.3 15.3 11.8

8/3/2019 NMDC Result Updated
http://slidepdf.com/reader/full/nmdc-result-updated 9/12
NMDC | 3QFY2012 Result Update
February 2, 2011 9
Balance sheet
Y/E March (` cr) FY2008 FY2009 FY2010 FY2011 FY2012E FY2013E
SOURCES OF FUNDS
Equity Share Capital 132 396 396 396 396 396Reserves& Surplus 8,157 11,240 13,876 18,818 24,561 30,979
Shareholders’ Funds 8,290 11,637 14,272 19,215 24,957 31,376
Total Loans - - - - - -
Deferred Tax Liability 6 58 85 103 103 103
Total Liabilities 8,296 11,695 14,357 19,317 25,060 31,479
APPLICATION OF FUNDS
Gross Block 1,421 1,669 1,771 2,273 3,273 4,273
Less: Acc. Depreciation 853 923 984 1,174 1,310 1,454
Net Block 568 747 787 1,099 1,963 2,818
Capital Work-in-Progress 112 248 556 677 745 819
Goodwill - - - - - -
Investments 83 72 76 136 136 136
Current Assets 8,283 11,771 14,264 19,172 23,937 29,480
Cash 7,199 9,740 12,855 17,228 22,025 27,451
Loans & Advances 244 403 519 1,043 1,043 1,043
Other 840 1,628 890 901 869 985
Current liabilities 775 1,165 1,348 1,781 1,735 1,789
Net Current Assets 7,508 10,606 12,916 17,391 22,202 27,691
Mis. Exp. not written off 25 22 22 14 14 14
Total Assets 8,296 11,695 14,357 19,317 25,060 31,479

8/3/2019 NMDC Result Updated
http://slidepdf.com/reader/full/nmdc-result-updated 10/12
NMDC | 3QFY2012 Result Update
February 2, 2011 10
Cash flow statement
Y/E March (` cr) FY2008 FY2009 FY2010 FY2011 FY2012E FY2013E
Profit before tax 4,947 6,648 5,207 9,727 11,189 12,507
Depreciation 60 74 73 122 136 145Change in Working Capital (661) (785) 926 (525) (14) (63)
Others (105) (866) (832) (1,143) - -
Direct taxes paid (1,765) (2,292) (1,770) (3,319) (3,692) (4,127)
Cash Flow from Operations 2,476 2,778 3,604 4,861 7,619 8,462
Inc./ (Dec.) in Fixed Assets (123) (389) (422) (517) (1,068) (1,074)
Other income 640 880 828 1,022 - -
Cash Flow from Investing 517 491 407 506 (1,068) (1,074)
Issue of Equity - - - - - -
Inc./(Dec.) in loans - - - - - -
Dividend Paid (Incl. Tax) (643) (728) (895) (853) (1,754) (1,961)
Others - - - (142) - -
Cash Flow from Financing (643) (728) (895) (994) (1,754) (1,961)
Inc./(Dec.) in Cash 2,350 2,541 3,115 4,373 4,797 5,427
Opening Cash balances 4,849 7,199 9,740 12,855 17,228 22,025
Closing Cash balances 7,199 9,740 12,855 17,228 22,025 27,451

8/3/2019 NMDC Result Updated
http://slidepdf.com/reader/full/nmdc-result-updated 11/12
NMDC | 3QFY2012 Result Update
February 2, 2011 11
Key ratios
Y/E March FY2008 FY2009 FY2010 FY2011 FY2012E FY2013E
Valuation Ratio (x)
P/E (on FDEPS) 22.5 16.7 21.2 11.3 9.8 8.7P/CEPS 22.1 16.5 20.8 11.0 9.6 8.6
P/BV 8.8 6.3 5.1 3.8 2.9 2.3
Dividend yield (%) 2.7 1.2 1.1 1.7 2.0 2.3
EV/Sales 11.5 8.4 9.7 4.9 4.3 3.5
EV/EBITDA 15.2 10.9 13.6 6.5 5.5 4.4
EV / Total Assets 7.9 5.4 4.2 2.9 2.0 1.4
Per Share Data (`)EPS (Basic) 8.2 11.0 8.7 16.4 18.9 21.1
EPS (fully diluted) 8.2 11.0 8.7 16.4 18.9 21.1
Cash EPS 8.4 11.2 8.9 16.7 19.3 21.5
DPS 4.9 2.2 2.0 3.2 3.8 4.2
Book Value 20.9 29.4 36.0 48.5 62.9 79.1
Dupont Analysis
EBIT margin 74.9 76.2 69.7 75.0 78.3 77.8
Tax retention ratio (%) 65.7 65.8 66.2 66.8 67.0 67.0
Asset turnover (x) 6.0 5.2 3.8 6.7 4.8 3.9
ROIC (Post-tax) 293.1 261.7 174.0 336.9 253.6 202.1
Cost of Debt (Post Tax) - - - - - -
Returns (%)
ROCE (Pre-tax) 60.6 57.7 33.4 50.6 41.4 36.2
Angel ROIC (Pre-tax) 505.3 454.4 347.9 795.9 535.3 391.9
ROE 46.1 43.9 26.6 38.8 33.9 29.8
Turnover ratios (x)
Asset Turnover (Gross Block) 4.2 4.9 3.6 5.6 4.2 3.5
Inventory / Sales (days) 44 64 60 56 56 56
Receivables (days) 31 50 25 16 16 16
Payables (days) 61 81 105 54 54 54
WC cycle (ex-cash) (days) 23 33 34 11 16 15
Solvency ratios (x)
Net debt to equity (0.9) (0.8) (0.9) (0.9) (0.9) (0.9)
Net debt to EBITDA (1.7) (1.7) (2.9) (2.0) (2.4) (2.7)Interest Coverage (EBIT / Interest) - - - - - -

8/3/2019 NMDC Result Updated
http://slidepdf.com/reader/full/nmdc-result-updated 12/12
NMDC | 3QFY2012 Result Update
February 2 2011 12
Research Team Tel: 022 - 39357800 E-mail: [email protected] Website: www.angelbroking.com
DISCLAIMER
This document is solely for the personal information of the recipient, and must not be singularly used as the basis of any investment
decision. Nothing in this document should be construed as investment or financial advice. Each recipient of this document should make
such investigations as they deem necessary to arrive at an independent evaluation of an investment in the securities of the companies
referred to in this document (including the merits and risks involved), and should consult their own advisors to determine the merits and
risks of such an investment.
Angel Broking Limited, its affiliates, directors, its proprietary trading and investment businesses may, from time to time, make
investment decisions that are inconsistent with or contradictory to the recommendations expressed herein. The views contained in this
document are those of the analyst, and the company may or may not subscribe to all the views expressed within.
Reports based on technical and derivative analysis center on studying charts of a stock's price movement, outstanding positions and
trading volume, as opposed to focusing on a company's fundamentals and, as such, may not match with a report on a company's
fundamentals.
The information in this document has been printed on the basis of publicly available information, internal data and other reliablesources believed to be true, but we do not represent that it is accurate or complete and it should not be relied on as such, as thisdocument is for general guidance only. Angel Broking Limited or any of its affiliates/ group companies shall not be in any way responsible for any loss or damage that may arise to any person from any inadvertent error in the information contained in this report .
Angel Broking Limited has not independently verified all the information contained within this document. Accordingly, we cannot testify,nor make any representation or warranty, express or implied, to the accuracy, contents or data contained within this document. While Angel Broking Limited endeavours to update on a reasonable basis the information discussed in this material, there may be regulatory,compliance, or other reasons that prevent us from doing so.
This document is being supplied to you solely for your information, and its contents, information or data may not be reproduced,
redistributed or passed on, directly or indirectly.
Angel Broking Limited and its affiliates may seek to provide or have engaged in providing corporate finance, investment banking or
other advisory services in a merger or specific transaction to the companies referred to in this report, as on the date of this report or in
the past.
Neither Angel Broking Limited, nor its directors, employees or affiliates shall be liable for any loss or damage that may arise from or in
connection with the use of this information.
Note: Please refer to the important `Stock Holding Disclosure' report on the Angel website (Research Section). Also, please refer to thelatest update on respective stocks for the disclosure status in respect of those stocks. Angel Broking Limited and its affiliates may haveinvestment positions in the stocks recommended in this report.
Disclosure of Interest Statement NMDC
1. Analyst ownership of the stock No
2. Angel and its Group companies ownership of the stock No
3. Angel and its Group companies' Directors ownership of the stock No
4. Broking relationship with company covered No
Ratings (Returns): Buy (> 15%) Accumulate (5% to 15%) Neutral (-5 to 5%)Reduce (-5% to 15%) Sell (< -15%)
Note: We have not considered any Exposure below`
1 lakh for Angel, its Group companies and Directors