britannia result updated
TRANSCRIPT

8/3/2019 Britannia Result Updated
http://slidepdf.com/reader/full/britannia-result-updated 1/11
Please refer to important disclosures at the end of this report 1
(` cr) 2QFY12 2QFY11 % yoy Angel est. % Diff.
Revenue 1,294 1,095 18.2 1,291 0.3
EBITDA 62 52 20.4 66 (6.0)
OPM (%) 4.8 4.7 9bp 5.1 (32bp)
PAT 38 32 18.8 42 (10.4)
Source: Company, Angel Research
Britannia reported a strong set of numbers for 2QFY2012. The company
registered top-line growth of 18.2% yoy, driven by volumes, price hikes and an
improved product mix. Earnings growth during the quarter stood strong at 18.8%yoy. Operating margin during the quarter marginally expanded, despite higher
staff costs and ad spends. We maintain our Neutral view on the stock.
Key highlights for the quarter: Britannia registered robust top-line growth of
18.2% yoy in 2QFY2012. The company continued its impressive top-line growth
because of new product launches, price hikes and improved product mix.
Britannia has been posting ~20% top-line growth consecutively for the past seven
quarters. During the quarter, Britannia’s operating margin expanded marginally
by 9bp yoy, despite higher staff costs and ad spends, as the company managed
its raw-material costs efficiently. Earnings for the quarter grew by 18.8% yoy.
Outlook and valuation: We expect Britannia to post a ~17% revenue CAGR (largely volume growth) over FY2011–13E and model in margin expansion of
184bp, despite sustained higher ad spends, aided by a benign input cost
environment and higher operating leverage. Further, in terms of earnings, we
expect Britannia to post a robust ~36% CAGR. At the CMP, the stock is trading at
21.5x FY2013 EPS (in-line with its historical valuations); hence, we recommend
Neutral on the stock with a fair value `495, based on 22x FY2013E EPS.
Key financials
Y/E March (` cr) FY2010 FY2011 FY2012E FY2013E
Net sales 3,403 4,246 5,014 5,858
% chg 8.3 24.8 18.1 16.8
Net profit (Adj.) 116.5 145.3 184.1 268.9
% chg (35.4) 24.7 26.7 46.0
EBITDA margin (%) 4.8 5.3 5.8 7.1
EPS (`) 9.8 12.2 15.4 22.5
P/E (x) 49.7 39.9 31.5 21.5
P/BV (x) 14.6 12.8 11.1 9.0
RoE (%) 26.7 34.3 37.8 46.0
RoCE (%) 14.8 20.9 25.3 43.0
EV/Sales (x) 1.7 1.3 1.1 1.0EV/EBITDA (x) 34.7 25.1 19.6 13.7
Source: Company, Angel Research
NEUTRALCMP ` 485
Target Price -
Investment Period -
Stock Info
Sector
Bloomberg Code
Shareholding Pattern (%)
Promoters 51.0
MF / Banks / Indian Fls 20.1
FII / NRIs / OCBs 11.3
Indian Public / Others 17.6
Abs. (%) 3m 1yr 3yr
Sensex 0.8 (16.5) 74.7
Britannia 3.6 11.8 108.1
2
17,193
5,169
BRIT.BO
BRIT@IN
5,792
0.4
498/324
19,665
FMCG
Avg. Daily Volume
Market Cap ( ` cr)
Beta
52 Week High / Low
Face Value ( ` )
BSE Sensex
Nifty
Reuters Code
Sreekanth P.V.S
022 – 3935 7800 Ext: 6841
Britannia
Performance Highlights
2QFY2012 Result Update | FMCG
November 11, 2011

8/3/2019 Britannia Result Updated
http://slidepdf.com/reader/full/britannia-result-updated 2/11
Britannia | 2QFY2012 Result Update
November 11, 2011 2
Exhibit 1: Quarterly performance
Y/E March (` cr) 2QFY12 2QFY11 % yoy 1HFY2012 1HFY2011 % chg
Net Sales 1,294 1,095 18.2 2,400 2,008 19.5
Consumption of RM 841 721 16.6 1,567 1,318 18.9(% of Sales) 65.0 65.8 65.3 65.6
Staff Costs 48 31 57.5 79 56 39.5
(% of Sales) 3.7 2.8 3.3 2.8
Advertising 101 7730.3 183 146 25.6
(% of Sales) 7.8 7.1 7.6 7.3
Other Expenses 135 123 9.7 260 231 12.2
(% of Sales) 10.5 11.3 10.8 11.5
Conversion and other charges 107 91 200 164 21.5
(% of Sales) 8.3 8.3 8.3 8.2
Total Expenditure 1,232 1,044 18.0 2,288 1,916 19.4
Operating Profit 62 52 20.4 113 92 22.2
OPM 4.8 4.7 4.7 4.6
Interest 10 10 (0.2) 19 19 (0.6)
Depreciation 12 10 11.7 23 20 11.5
Other Income 11 12 (11.5) 38 35 7.7
PBT (excl. Extr. Items) 52 44 18.0 109 88 23.8
Extr. Income/(Expense) - - - -
PBT (incl. Extr. Items) 52 44 18.0 109 88 23.8
(% of Sales) 4.0 4.0 4.5 4.4
Provision for Taxation 14 12 16.0 30 24 25.7
(% of PBT) 27.1 27.6 27.1 26.7
Reported PAT 38 32 18.8 80 65 23.1
PATM 2.9 2.9 3.3 3.2
Equity shares (cr) 12 12 12 12
EPS (`) 3.2 2.7 18.8 6.7 5.4 23.1
Adjusted PAT 38 32 18.8 80 65 23.1
Source: Company, Angel research
Seventh consecutive quarter of ~20% top-line growth
Britannia posted robust top-line growth of 18.2% yoy to ` 1,294cr ( ` 1,095cr),
in-line with our estimate. We believe top-line growth was led by ~15% volume
growth in its core brands. Moreover, a combination of price hikes and change in
product mix aided the company’s top-line growth.

8/3/2019 Britannia Result Updated
http://slidepdf.com/reader/full/britannia-result-updated 3/11
Britannia | 2QFY2012 Result Update
November 11, 2011 3
Exhibit 2: Seventh consecutive quarter of ~20% top-line growth
Source: Company, Angel research
Strong earnings growth aided by top-line growth
In terms of earnings, Britannia reported robust growth of 18.8% yoy to ` 38cr.
Growth came in below our estimates due to a spike in depreciation.
Other income for the quarter came in lower by 11.5% yoy to ` 11cr.
Exhibit 3: Bottom-line growth strong at ~19% yoy
Source: Company, Angel Research
0%
5%
10%
15%
20%
25%
30%
-
200
400
600
800
1,000
1,200
1,400
2 Q 1 0
3 Q 1 0
4 Q 1 0
1 Q 1 1
2 Q 1 1
3 Q 1 1
4 Q 1 1
1 Q 1 2
2 Q 1 2
( y o y
% )
( ` c r )
Top-line (LHS) YoY growth (RHS)
-100%
-50%
0%
50%
100%
150%
200%
250%
-
10
20
30
40
50
60
70
2 Q 1 0
3 Q 1 0
4 Q 1 0
1 Q 1 1
2 Q 1 1
3 Q 1 1
4 Q 1 1
1 Q 1 2
2 Q 1 2
( y o y
% ) ( `
c r )
PAT (LHS) YoY growth (RHS)

8/3/2019 Britannia Result Updated
http://slidepdf.com/reader/full/britannia-result-updated 4/11

8/3/2019 Britannia Result Updated
http://slidepdf.com/reader/full/britannia-result-updated 5/11
Britannia | 2QFY2012 Result Update
November 11, 2011 5
Increased demand for premium products will lead to higher realization: We
expect Britannia to register a ~16% CAGR in its top line, aided by improving
sales mix (Britannia has recently introduced premium products in the health
and wellness space). Further, we have modeled in the 5–6% increase in thecompany’s realization on the back of recent price hikes and further price hikes
cannot be ruled out. We expect consumers’ uptrading to value-added biscuits
(positioned in the health and wellness space) from plain glucose variants of
biscuits to support value growth.
Outlook and valuation
Post 2QFY2012 results, we maintain our revenue and earnings estimates. We
expect Britannia to report a CAGR of ~17% in its revenue (largely volume growth)
over FY2011–13E and model in margin expansion of 180bp, despite sustained
higher ad spends, aided by a benign input cost environment and higher operatingleverage. Moreover, in terms of earnings, we expect Britannia to register a robust
~36% CAGR. At the CMP, the stock is trading at 21.5x FY2013 EPS (in-line with its
historical valuations); hence, we recommend Neutral on the stock with a fair value
`495, based on 22x FY2013E EPS.
Key risks to our investment argument
1) Higher-than-anticipated raw-material price inflation
2) High competitive intensity leading to much higher ad spends

8/3/2019 Britannia Result Updated
http://slidepdf.com/reader/full/britannia-result-updated 6/11
Britannia | 2QFY2012 Result Update
November 11, 2011 6
Exhibit 5: Peer valuation
Company Reco Mcap CMP TP Upside P/E (x) EV/Sales (x) RoE (%) CAGR
(` cr) (`) (`) (%) FY12E FY13E FY12E FY13E FY12E FY13E Sales EPS
Asian Paints Neutral 29,340 3,059 - - 29.8 24.2 3.1 2.6 39.6 38.3 17.3 19.8
Britannia Neutral 5,792 485 - - 31.5 21.5 1.1 1.0 37.8 46.0 17.3 36.0
Colgate Neutral 14,206 1,045 - - 32.4 27.7 5.4 4.6 111.7 108.0 14.9 12.9
Dabur Buy 17,155 99 115 17 24.5 21.4 3.4 2.9 44.9 41.6 20.5 18.8
GSKCHL Neutral 11,184 2,659 - - 32.2 27.1 3.7 3.2 32.6 31.8 20.1 23.9
GCPL Accumulate 13,285 411 - 11 24.8 19.1 3.3 2.6 36.6 29.4 22.9 20.2
HUL Neutral 86,428 396 - - 33.9 29.8 3.8 3.3 87.5 85.3 12.7 17.1
ITC Neutral 164,705 213 - - 28.5 24.1 6.4 5.3 32.7 31.5 17.6 17.4
Marico Neutral 9,053 147 - - 29.4 23.3 2.6 2.2 30.2 28.8 17.2 28.0
Nestle Neutral 43,349 4,496 - - 44.5 37.4 5.9 5.1 91.1 72.9 16.1 18.9
Source: Company, Angel Research
Exhibit 6: Angel vs. ConsensusTop-line (` cr) FY2012E FY2013E EPS (`) FY2012E FY2013E
Angel estimates 5,014 5,858 Angel estimates 15.41 22.51
Consensus 5,112 6,008 Consensus 17.70 23.50
Diff (%) (1.9) (2.5) Diff (%) (12.9) (4.2)
Source: Angel research, Bloomberg
Exhibit 7: Return of Britannia vs. Sensex
Source: Company, Angel research
Exhibit 8: One-year forward P/E band
Source: Company, Angel research
Exhibit 9: One-year forward P/E
Source: Company, Angel research
Exhibit 10: One-year forward Premium vs. Sensex
Source: Company, Angel research
60%
70%
80%
90%
100%110%
120%
130%
N o v - 1
0
D e c - 1
0
J a n - 1
1
F e
b - 1
1
M a r -
1 1
A p r -
1 1
M a y - 1
1
J u n - 1
1
J u l - 1 1
A u g - 1
1
S e p - 1
1
O c
t - 1 1
N o v - 1
1
Sensex Britannia
-
100
200
300
400
500
600
A p r -
0 5
D e c - 0
5
A u g - 0
6
A p r -
0 7
D e c - 0
7
A u g - 0
8
A p r -
0 9
D e c - 0
9
A u g - 1
0
A p r -
1 1
S h a r e
P r i c e
( ` )
15x 20x 25x 30x
-
5.0
10.0
15.0
20.0
25.0
30.0
35.0
40.0
O c
t - 0 6
F e
b - 0
7
J u n - 0
7
O c
t - 0 7
F e
b - 0
8
J u n - 0
8
O c
t - 0 8
F e
b - 0
9
J u n - 0
9
O c
t - 0 9
F e
b - 1
0
J u n - 1
0
O c
t - 1 0
F e
b - 1
1
J u n - 1
1
O c
t - 1 1
-40%-20%
0%20%40%60%80%
100%120%140%160%180%
A p r -
0 6
A u g - 0
6
D e c - 0
6
A p r -
0 7
A u g - 0
7
D e c - 0
7
A p r -
0 8
A u g - 0
8
D e c - 0
8
A p r -
0 9
A u g - 0
9
D e c - 0
9
A p r -
1 0
A u g - 1
0
D e c - 1
0
A p r -
1 1
A u g - 1
1

8/3/2019 Britannia Result Updated
http://slidepdf.com/reader/full/britannia-result-updated 7/11
Britannia | 2QFY2012 Result Update
November 11, 2011 7
Profit and loss statement
Y/E March (` cr) FY2008 FY2009 FY2010 FY2011 FY2012E FY2013E
Gross sales 2,618 3,143 3,427 4,246 5,014 5,858
Less: Excise duty 33 31 23 32 50 59Net Sales 2,585 3,112 3,403 4,214 4,964 5,799
Total operating income 2,585 3,112 3,403 4,214 4,964 5,799
% chg 17.5 20.4 9.4 23.8 17.8 16.8
Total Expenditure 2,353 2,849 3,241 3,990 4,677 5,387
Cost of Materials 1,555 1,910 2,164 2,764 3,223 3,694
Advertising Exp (Incl. Promotion) 180 211 269 304 347 406
Personnel 91 96 106 120 154 174
Others 527 632 703 801 953 1,113
EBITDA 232 263 162 224 287 412
% chg 79.9 13.4 (38.2) 38.0 28.0 43.8
(% of Net Sales) 9.0 8.4 4.8 5.3 5.8 7.1
Depreciation& Amortisation 29 33 38 45 52 60
EBIT 203 229 125 179 234 352
% chg 95.7 13.1 (45.6) 43.8 30.7 50.2
(% of Net Sales) 7.8 7.4 3.7 4.3 4.7 6.1
Interest & other Charges 10 16 8 40 42 42
Other Income 50 40 51 59 60 58
(% of PBT) 20.6 15.8 30.4 29.7 23.6 15.7
Share in profit of Associates - - - - - -
Recurring PBT 243 253 167 198 252 368
% chg 92.8 4.1 (33.9) 18.4 27.3 46.0
Prior Period & Extra Exp./(Inc.) 10.85 20.63 46.64 - - -
PBT (reported) 232 233 121 198 252 368
Tax 41 52 4 53 68 99
(% of PBT) 17.0 20.6 2.5 26.7 27.0 27.0
PAT (reported) 202 201 163 145 184 269
Add: Share of earn. of asso. - - - - - -
Less: Minority interest (MI) - - - - - -
PAT after MI (reported) 202 201 163 145 184 269
ADJ. PAT 191 180 117 145 184 269
% chg 77.4 (5.6) (35.4) 24.7 26.7 46.0(% of Net Sales) 7.4 5.8 3.4 3.4 3.7 4.6
Basic EPS (`) 16.0 15.1 9.8 12.2 15.4 22.5
Fully Diluted EPS (̀ ) 16.0 15.1 9.8 12.2 15.4 22.5
% chg 77.4 (5.6) (35.4) 24.7 26.7 46.0

8/3/2019 Britannia Result Updated
http://slidepdf.com/reader/full/britannia-result-updated 8/11
Britannia | 2QFY2012 Result Update
November 11, 2011 8
Balance sheet
Y/E March (` cr) FY2008 FY2009 FY2010 FY2011 FY2012E FY2013E
SOURCES OF FUNDS
Equity Share Capital 24 24 24 24 24 24Preference Capital - - - - - -
Reserves& Surplus 732 801 372 427 500 620
Shareholders’ Funds 756 825 396 451 524 644
Minority Interest - - - - - -
Total Loans 106 25 430 431 431 25
Deferred Tax Liability (2) 10 (7) 6 6 6
Total Liabilities 860 860 819 889 961 676
APPLICATION OF FUNDS
Gross Block 453 512 548 594 758 872
Less: Acc. Depreciation 212 234 266 290 342 402
Net Block 241 278 282 304 416 470
Capital Work-in-Progress 10 6 10 12 16 18
Goodwill - - - - - -
Investments 381 423 491 545 485 125
Current Assets 552 539 529 625 799 946
Cash 44 41 23 29 33 60
Loans & Advances 161 195 198 228 266 302
Other 13 14 6 14 25 35
Current liabilities 348 413 492 597 754 883
Net Current Assets 205 126 37 29 45 63
Misc. Exp. not written off 23 27 - - - -
Total Assets 860 860 819 889 961 676

8/3/2019 Britannia Result Updated
http://slidepdf.com/reader/full/britannia-result-updated 9/11
Britannia | 2QFY2012 Result Update
November 11, 2011 9
Cash flow statement
Y/E March (` cr) FY2008 FY2009 FY2010 FY2011 FY2012E FY2013E
Profit before tax 232 233 121 198 252 368
Depreciation 29 33 38 45 52 60Change in Working Capital (140) 0.5 100 7 60 32
Interest / Dividend (Net) (11) (5) (25) 13 3 15
Direct taxes paid 41 52 73 53 68 99
Payment of VRS/ other comp. 2 (3) 33 - - -
Profit on sale of invest/FA (Net) 7 7 12 20 - -
Others (21) 26 2 - (89) (56)
Cash Flow from Operations 43 224 183 190 210 320
(Inc.)/ Dec. in Fixed Assets (55) (55) (40) (47) (169) (117)
(Inc.)/ Dec. in Investments (61) (42) (68) (54) 60 360
Cash Flow from Investing (116) (97) (108) (102) (109) 243
Issue of Equity - - - - - -
Inc./(Dec.) in loans 101 (81) (2) 2 - (406)
Dividend Paid (Incl. Tax) 42 50 112 70 90 112
Interest/Dividend paid (Net) (8) (1) (21) 15 7 19
Cash Flow from Financing 67 (130) (93) (83) (97) (537)
Inc./(Dec.) in Cash (5) (3) (17) 5 4 27
Opening Cash balances 49 44 41 23 29 33
Closing Cash balances 44 41 23 29 33 60
8/3/2019 Britannia Result Updated
http://slidepdf.com/reader/full/britannia-result-updated 10/11
Britannia | 2QFY2012 Result Update
November 11, 2011 10
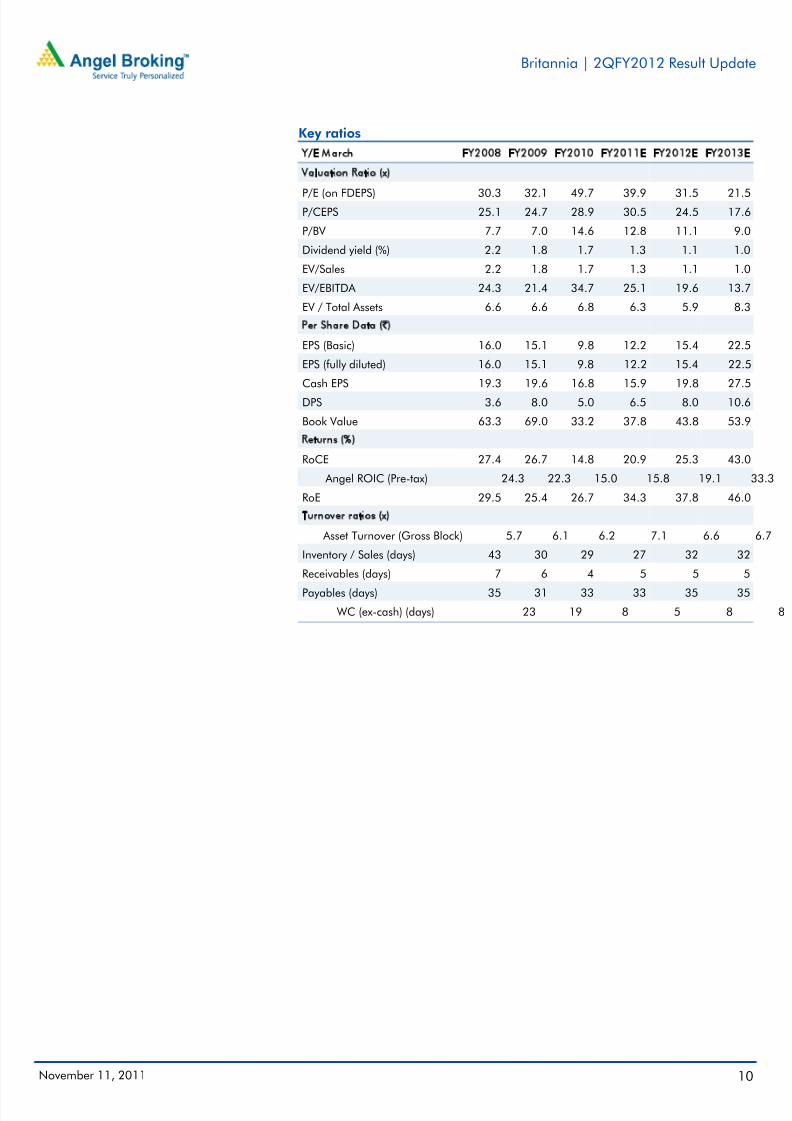
Key ratios
Y/E March FY2008 FY2009 FY2010 FY2011E FY2012E FY2013E
Valuation Ratio (x)
P/E (on FDEPS) 30.3 32.1 49.7 39.9 31.5 21.5P/CEPS 25.1 24.7 28.9 30.5 24.5 17.6
P/BV 7.7 7.0 14.6 12.8 11.1 9.0
Dividend yield (%) 2.2 1.8 1.7 1.3 1.1 1.0
EV/Sales 2.2 1.8 1.7 1.3 1.1 1.0
EV/EBITDA 24.3 21.4 34.7 25.1 19.6 13.7
EV / Total Assets 6.6 6.6 6.8 6.3 5.9 8.3
Per Share Data (`)EPS (Basic) 16.0 15.1 9.8 12.2 15.4 22.5
EPS (fully diluted) 16.0 15.1 9.8 12.2 15.4 22.5
Cash EPS 19.3 19.6 16.8 15.9 19.8 27.5
DPS 3.6 8.0 5.0 6.5 8.0 10.6
Book Value 63.3 69.0 33.2 37.8 43.8 53.9
Returns (%)
RoCE 27.4 26.7 14.8 20.9 25.3 43.0
Angel ROIC (Pre-tax) 24.3 22.3 15.0 15.8 19.1 33.3
RoE 29.5 25.4 26.7 34.3 37.8 46.0
Turnover ratios (x)
Asset Turnover (Gross Block) 5.7 6.1 6.2 7.1 6.6 6.7
Inventory / Sales (days) 43 30 29 27 32 32
Receivables (days) 7 6 4 5 5 5
Payables (days) 35 31 33 33 35 35
WC (ex-cash) (days) 23 19 8 5 8 8

8/3/2019 Britannia Result Updated
http://slidepdf.com/reader/full/britannia-result-updated 11/11
Britannia | 2QFY2012 Result Update
November 11, 2011 11
Research Team Tel: 022 - 39357800 E-mail: [email protected] Website: www.angelbroking.com
DISCLAIMER
This document is solely for the personal information of the recipient, and must not be singularly used as the basis of any investmentdecision. Nothing in this document should be construed as investment or financial advice. Each recipient of this document should make
such investigations as they deem necessary to arrive at an independent evaluation of an investment in the securities of the companies
referred to in this document (including the merits and risks involved), and should consult their own advisors to determine the merits and
risks of such an investment.
Angel Broking Limited, its affiliates, directors, its proprietary trading and investment businesses may, from time to time, make
investment decisions that are inconsistent with or contradictory to the recommendations expressed herein. The views contained in this
document are those of the analyst, and the company may or may not subscribe to all the views expressed within.
Reports based on technical and derivative analysis center on studying charts of a stock's price movement, outstanding positions and
trading volume, as opposed to focusing on a company's fundamentals and, as such, may not match with a report on a company's
fundamentals.
The information in this document has been printed on the basis of publicly available information, internal data and other reliablesources believed to be true, but we do not represent that it is accurate or complete and it should not be relied on as such, as thisdocument is for general guidance only. Angel Broking Limited or any of its affiliates/ group companies shall not be in any way responsible for any loss or damage that may arise to any person from any inadvertent error in the information contained in this report .
Angel Broking Limited has not independently verified all the information contained within this document. Accordingly, we cannot testify,nor make any representation or warranty, express or implied, to the accuracy, contents or data contained within this document. While Angel Broking Limited endeavours to update on a reasonable basis the information discussed in this material, there may be regulatory,compliance, or other reasons that prevent us from doing so.
This document is being supplied to you solely for your information, and its contents, information or data may not be reproduced,
redistributed or passed on, directly or indirectly.
Angel Broking Limited and its affiliates may seek to provide or have engaged in providing corporate finance, investment banking or
other advisory services in a merger or specific transaction to the companies referred to in this report, as on the date of this report or in
the past.
Neither Angel Broking Limited, nor its directors, employees or affiliates shall be liable for any loss or damage that may arise from or in
connection with the use of this information.
Note: Please refer to the important `Stock Holding Disclosure' report on the Angel website (Research Section). Also, please refer to thelatest update on respective stocks for the disclosure status in respect of those stocks. Angel Broking Limited and its affiliates may haveinvestment positions in the stocks recommended in this report.
Disclosure of Interest Statement Britannia
1. Analyst ownership of the stock No
2. Angel and its Group companies ownership of the stock No
3. Angel and its Group companies' Directors ownership of the stock No
4. Broking relationship with company covered No
Ratings (Returns): Buy (> 15%) Accumulate (5% to 15%) Neutral (-5 to 5%)Reduce (-5% to 15%) Sell (< -15%)
Note: We have not considered any Exposure below ` 1 lakh for Angel, its Group companies and Directors