ng premium subsidy for the indigents: an initial look€¢ to look at the initial effect of the...
TRANSCRIPT

An Initial Look at the NG Premium Subsidy for the
Indigents Initial Results
Ida Marie Pantig and Valerie Gilbert Ulep
PIDS
Draft PPT June 28, 2013

Background Objectives Analysis, Discussion of Results Medical Cost Ratio Estimation and Projection Findings and Conclusion

Background: Universal Health Care
Three Thrusts:
Financial Risk Protection Improved Access to Quality Hospitals and Health Care Facilities
Attainment of Health-related MDGs

NG allots Php35 billion for premium payment for the Indigents
32,427 42,769 50,442 80,171
11%
28% 25%
44%
0%
10%
20%
30%
40%
50%
0
20,000
40,000
60,000
80,000
100,000
2011 2012 2013 2014
Mill
ions
NG Premium Subsidy in the DOH Budget
DOH Budget NG Premium Subsidy as share in DOH budget
Source: General Appropriations Act

PhilHealth developed new benefit packages with focus on the indigents: • No Balance Billing • PCB1 and PCB2 • All Case Rates

Health insurance coverage is expected to expand:
- 2,000 4,000 6,000 8,000
10,000 12,000 14,000 16,000
2000
2001
2002
2003
2004
2005
2006
2007
2008
2009
2010
2011
2012
2013
2014
Thou
sand
s
Sponsored Members
For Sponsored members alone, there was an increase of 5 million members from 2013-2014.
Source: PhilHealth Stats and Charts; GAA

The 5 million increase is just for NHTS… 0.
35
0.62
1.26
1.76
6.26
2.49
4.95
2.72
3.26
5.38
6.05
4.66
3.69
4.45
4.91
4.61
5.16
14.7
2000 2001 2002 2003 2004 2005 2006 2007 2008 2009 2010 2011 2012 2013 2014
Sponsored Program LGU/Regular NHTS
Health insurance coverage expansion = higher medical care utilization
Source: PhilHealth Stats and Charts; GAA

PhilHealth’s premium collection and benefit payment
05,000
10,00015,00020,00025,00030,00035,00040,00045,000
2006 2007 2008 2009 2010 2011 2012 2013
Premium Collection and Benefit Payout (2006=100)
Premium CollectionBenefit Payout
Source: PhilHealth Stats and Charts

• Are we spending the PhP35 billion allocation to the poor? Are they provided with medical care?
• Are we covering the “true poor?” • Is PhilHealth financially fit to deliver health services to all its
members?

Objectives of the Study
• To look at the initial effect of the national government premium subsidy for the indigents on PhilHealth’s service delivery and finances
Specifical Objectives: • To review and analyze various indicators of PhilHealth on service delivery
for the Indigents and the Sponsored Members • To assess the financial health of PhilHealth through medical cost ratio
estimates • To provide a snapshot of possible scenarios with changes in premium
collection and benefit payout and its impact on PhilHealth’s financial health
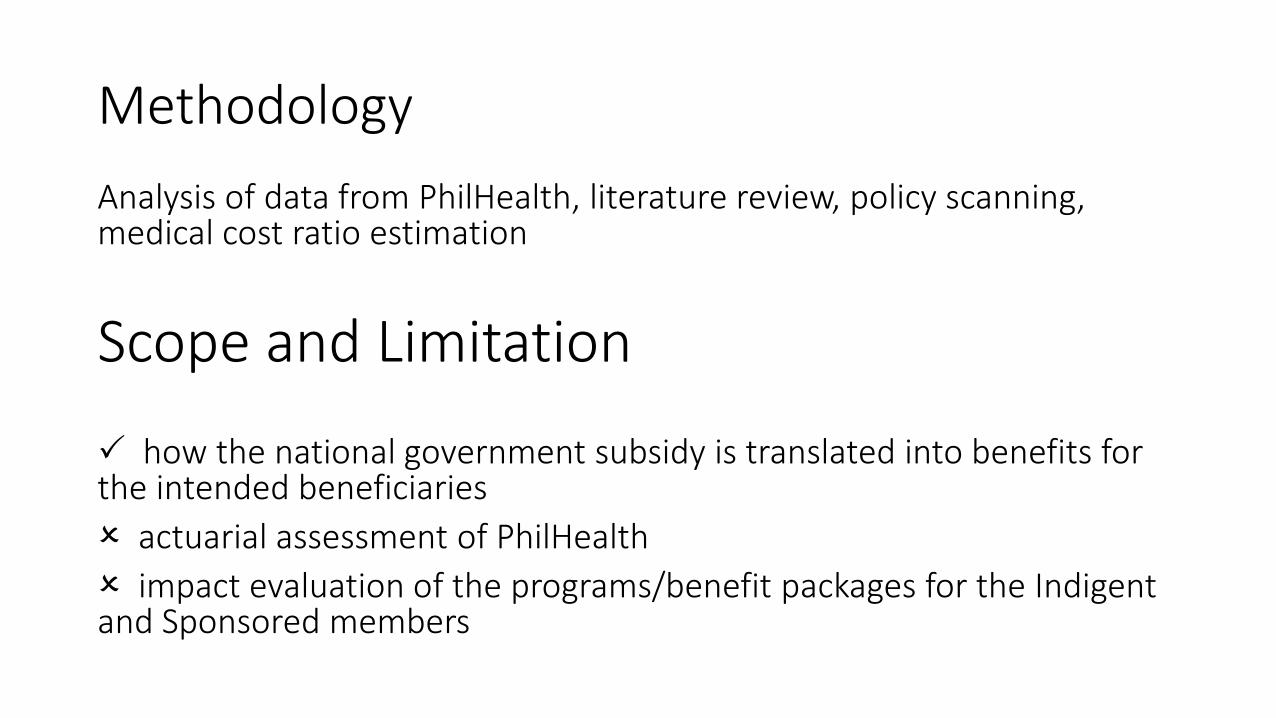
Methodology Analysis of data from PhilHealth, literature review, policy scanning, medical cost ratio estimation
Scope and Limitation how the national government subsidy is translated into benefits for the intended beneficiaries actuarial assessment of PhilHealth impact evaluation of the programs/benefit packages for the Indigent and Sponsored members

Membership Structure: Who are eligible?
RA 7875 (1995) RA 10606 (2013) Indigent Identified by the LHIO NHTS-PR as official list of poor HH
Sponsored Marginalized and less privileged families
Not identified as poor in NHTS, but is incapable of paying for own premium; marginalized under the care of DSWD
Formal Employees in both government and private
Informal Workers not covered by formal contracts
Individually-Paying Those who work for themselves Individuals who render services or sell goods as means of livelihood
Overseas Worker Documented/undocumented Filipinos engaged in remunerated activities in another country (RA 9241)
Lifetime SSS and GSIS retirees and pensioners A former member who has reached the age of retirement

Membership Structure: Source of premium?
RA 7875 (1995) RA 10606 (2010)
Indigent Partial subsidy from LGU with counterpart from the national government (NG)
Full NG subsidy for all indigent members
Sponsored Subsidized by another individual/organization
Subsidy from sponsoring individual/LGU/organization/ government office
Formal
Premium payment by member Informal Individually-Paying Overseas Worker Lifetime Non-paying

PhilHealth membership
0
5,000
10,000
15,000
20,000
25,000
30,000
35,000
2006 2007 2008 2009 2010 2011 2012 2013
Thou
sand
s
Total Members: 31.27 million Total Dependents (actual): 45.63 million Total Members and Dependents: 76.9 million (79% of projected total population in 2013)
31%
17%
33%
0%
10%
20%
30%
40%
50%
60%
70%
80%
90%
100%
2006 2007 2008 2009 2010 2011 2012 2013
Lifetime
Overseas WorkerProgramPrivate
Government
Individually Paying
Sponsored / Indigent
Source: PhilHealth Stats and Charts

12%
58%
-13%
16% 13%
16% 17%
6% 3% 3%
1% 2%
12% 13% 9% 7%
11% 10% 11% 10% 8%
14% 15% 17%
2010 2011 2012 2013
Sponsored / IndigentIndividually PayingGovernmentPrivateOverseas Worker ProgramLifetime
Membership: Annual Growth Rate In 2013, Lifetime Members
are growing the fastest in terms of membership, at 17%, followed by the Sponsored Members at 16%.
Lifetime Members do not pay premium;
Sponsored Members are entitled to NBB, PCB, etc.
Source: PhilHealth Stats and Charts

Financial support for members is still low
55% 62%
62% 30% 0
200,000
400,000
600,000
800,000
1,000,000
1,200,000
1,400,000
1,600,000
1,800,000
2012 2013
Sponsored Program: Claims and NBB
Number of SP Claims Case Rates NBB
53% 54%
2012 2013
Support Value for All Members
Source: PhilHealth Stats and Charts

Premium Collection: Largest share from the Private Sector, with Indigents coming in next
0
10,000
20,000
30,000
40,000
50,000
60,000
2006 2007 2008 2009 2010 2011 2012 2013
Current Prices
Sponsored / Indigent Individually Paying / IPP
Government Private
Overseas Worker Program
0
10,000
20,000
30,000
40,000
50,000
60,000
2006 2007 2008 2009 2010 2011 2012 2013
Constant Prices (2006=100)
Sponsored / Indigent Individually Paying / IPP
Government Private
Overseas Worker Program
Source: PhilHealth Stats and Charts

Benefit Payout is growing faster than PC, again with Private sector and Indigents getting the most
Source: PhilHealth Stats and Charts
05,000
10,00015,00020,00025,00030,00035,00040,00045,000
2006 2007 2008 2009 2010 2011 2012 2013
Constant price (2006=100)
Sponsored / Indigent Individually Paying / IPP
Government Private
Overseas Worker Program Non Paying / Lifetime
0
10,000
20,000
30,000
40,000
50,000
60,000
2006 2007 2008 2009 2010 2011 2012 2013
Current Prices
Sponsored / Indigent Individually Paying / IPP
Government Private
Overseas Worker Program Non Paying / Lifetime

Who pays? Who benefits?
2000 2001 2002 2003 2004 2005 2006 2007 2008 2009 2010 2011 2012 2013
Premium Collection
Sponsored / Indigent Individually Paying / IPP
Government Private
Overseas Worker Program Non Paying / Lifetime
2000 2001 2002 2003 2004 2005 2005 2006 2007 2008 2009 2010 2011 2012
Benefit Payout
Sponsored / Indigent Individually Paying / IPP
Government Private
Overseas Worker Program Non Paying / Lifetime
- Sponsored Members - Individually-Paying - Lifetime Members
Source: PhilHealth Stats and Charts

0%
20%
40%
60%
80%
100%
2006 2007 2008 2009 2010 2011 2012 2013
PC vs. BP for Paying Members
Premium Collection Benefit Payment
0%5%
10%15%20%25%30%35%
2006 2007 2008 2009 2010 2011 2012 2013
PC vs. BP for Sponsored and Indigent Members
Premium Collection Benefit Payment
If we look closely, is social health insurance really working? In 2009 and 2012, the poor were paying for the benefits of the Paying Members.
Source: PhilHealth Stats and Charts

Medical Cost Ratio (MCR) estimation
• MCR is an indicator measuring the share of premium revenue spent on medical care and services by the insurance company.
• MCR = Benefit Payment/ Premium Contribution
Ex. An MCR of 85% means 85% of all premium collection is spent on benefits.

Medical cost ratio estimates show that:
0%
100%
200%
2006 2007 2008 2009 2010 2011 2012 2013
MCR by Type of Membership
Sponsored/Indigent Paying All
• Overall, PhilHealth is “financially fit,” with MCR = 100%.
• As for the Paying members, the MCR for 2013 is at 97% (PC is enough to cover for own BP).
• The humps observed above the line from 2010 for the S/I members are good indicators.
What happens next?
Source: Author’s calculation using data from PhilHealth Stats and Charts

MCR in different scenarios (2014-2016):
• Scenario 1: 2014 increase in Premium Collection with Php35 billion from national government
• Scenario 2: No Balance Billing coverage expands to 60%, 80% to 100% from 30%
• Scenario 3: Case Rate covers 100% of all claims, with No Balance Billing coverage expanding to 60%, 80% to 100%
• Scenario 4: Case Rate covers 100% at NBB, while other benefit packages increase 30% for Sponsored Members
• Scenario 5: Benefit expansion for paying members by 50%; full NBB for all Case Rate claims
• Scenario 6: 100% Support Value extended to ALL members

1: 2014 increase in Premium Collection with Php35 billion from national government
• “status quo” • The inflow of huge premium
from the national government drives the MCR down for all members
• Utilization by the Sponsored Members is low
0
1
2
2006
2007
2008
2009
2010
2011
2012
2013
2014
2015
2016
Sponsored Paying All
Source: Author’s calculation using data from PhilHealth Stats and Charts

2: No Balance Billing coverage expands to 60%, 80% to 100% from 30%
• MCR increases for Sponsored and Indigent members, driving the total MCR up.
• The premium contribution from the national government is sufficient to cover for NBB
0
1
2
2006
2007
2008
2009
2010
2011
2012
2013
2014
2015
2016
Sponsored Paying All
Source: Author’s calculation using data from PhilHealth Stats and Charts

3: Case Rate covers 100% of all claims, with No Balance Billing coverage expanding to 60%, 80% to 100%
• The expanded benefit packages for the Sponsored and Indigent members are still covered by the national government premium subsidy
0
1
2
2006
2007
2008
2009
2010
2011
2012
2013
2014
2015
2016
Sponsored Paying All
Source: Author’s calculation using data from PhilHealth Stats and Charts

4: Case Rate covers 100% at NBB, while other benefit packages increase 30% for Sponsored Members
• The 30% expansion in benefit delivery for the Sponsored and Indigent Members will take a toll on PhilHealth’s finances, as the benefit payout will be more than the premiums collected.
0
1
2
2006
2007
2008
2009
2010
2011
2012
2013
2014
2015
2016
Sponsored Paying All
Source: Author’s calculation using data from PhilHealth Stats and Charts

5: Benefit expansion for paying members by 50% and full NBB for Sponsored and Indigent members
• The cost of delivering expanded benefit package for the paying members cannot be covered by their premium contribution
• NG subsidy is still able to pay for the benefit packages of the Sponsored/Indigent members
0
1
2
3
2006
2007
2008
2009
2010
2011
2012
2013
2014
2015
2016
Sponsored Paying All
Source: Author’s calculation using data from PhilHealth Stats and Charts

6: 100% Support Value extended to ALL members
• Full support to hospital members cannot be afforded by PhilHealth at 100% support value, given the current rate of premium contribution
0
1
2
3
4
5
6
2006
2007
2008
2009
2010
2011
2012
2013
2014
2015
2016
Sponsored Paying All
Source: Author’s calculation using data from PhilHealth Stats and Charts

Findings and Conclusion
• Government efforts to enrol Filipinos into PhilHealth is recognized. Utilization, should still be increased among the poor; NBB and SV should be expanded to achieve UHC.
• The growing number of Lifetime Members and their share in total Benefit Payments is noted.
• Cross-subsidy was observed in earlier years, where the poor are covering for the benefits of the Paying members.

Findings and Conclusion
• The different scenarios show that: 1. Expanding to full NBB is sustainable, if other benefit packages are kept at
status quo. 2. Setting NBB at 100% and expanding other benefit packages for the
Indigents and the Sponsored Members will put a strain on PhilHealth’s finances.
3. As for the paying members, PC will be enough to cover their BP (MCR>95%)
4. An expansion in the benefit packages for the Paying Members will not be sustainable, as they will need to use up funds from the PC of the poor.