neighborhood development strategy workshop · pdf fileneighborhood development strategy...
TRANSCRIPT

NEIGHBORHOOD DEVELOPMENT STRATEGY WORKSHOP
Prepared by Corporate FACTS

Meeting AgendaThursday, August 1, 2013
2
Welcome Allen Carlson 1:00 – 1:05 pm
Purpose of Meeting Joe Musolf 1:05 – 1:10 pm
Icebreaker/Introductions Michelle Bush 1:10 – 1:45 pm
Disposition Strategy Roxanne Young 1:45 - 2:15 pm
Group Exercise Michelle Bush/Lisa Archey 2:15 - 3:00 pm
Group Report 3:00 – 3:30 pm
Partnership Model 3:30-3:45 pm
Wrap-up & Next Steps 3:45 – 4:00 pm
Evaluation
Corporate F.A.C.T.S.

Generate ideas on how the City can partner with
neighborhood stakeholders to achieve revitalization
objectives
Determine how HRA can utilize its resources (land,
technical assistance & funding) to help achieve
objectives
Learn how to structure programs & products that
work for the City, affordable housing developers,
financial institutions & neighborhoods
Gain feedback on HRA’s proposed investment
strategy & the equitable & strategic disposal of City
owned property
Expected Outcomes
3Corporate F.A.C.T.S.

Introductions
4Corporate F.A.C.T.S.
Name
Organization

5Corporate F.A.C.T.S.
Disposition
Strategy
Analysis and Disposition Strategy
Corporate FACTS

HRA Property AnalysisThe following people contributed to the creation of this property analysis and disposition
strategy
Corporate F.A.C.T.S. 7

What Are We Trying To Achieve?
• Stimulate market to “preserve, grow &
sustain” neighborhoods
• Use inventory as a catalyst for
neighborhood transformation
• Create programs that leverage investment
in weak and/or borderline markets
• Meet our legal obligations and reduce
holding costs
• Standardize the HRA’s disposition policy
with clearly understood procedures and
application process
Corporate FACTS 8

Properties Acquired
Acquired per Funding Source
169 NSP
60 CDBG
221 HRA
85 ISP
535 Total properties purchased
Corporate FACTS
9

What does the HRA own?
240
175
70
35
15
Property Classification
Disposition Analysis Inventory
Large Redevelopment Sites (hold)
NSP/ISP Buildings UnderConstruction (sale 2013)
Commercial Buildings and ParkingLots (hold)
Parking Ramps and HomelessShelter (hold)
535 Total Parcels
10
HRA Staff focused analysis on the 240 parcels classified as “Disposition Analysis Inventory”
Corporate FACTS

Parcel Disposition Strategies
240 parcels
11Corporate FACTS
Disposition Strategies
Cluster Area Properties
Non-Cluster Properties
with Obligations
Properties to Sell
SplinterParcel

Parcel Disposition Strategies
12
70
60
56
54
Disposition Strategy
Cluster Area Properties
Non-Cluster Propertieswith Obligations
Properties to Sell
Splinter Parcels
240 Total Disposition
Analysis Inventory
Corporate FACTS
Cluster Area Investment Strategy
(70 Parcels)
Corporate FACTS 13

Cluster Area Investment Strategy
• Target investments in “cluster areas” of 10-15
blocks
• Disposition Strategy: Work with stakeholders to
address all HRA owned property within a cluster area
during a 2-3 year period
Corporate FACTS 14
Rental housing
Homeowner occupied housing
Rehabilitation of existing
HRA owned property
New construction on infill lots
Address properties through a diversity of product types including:

Clustering Properties: Why this approach?
• Focus development subsidies to
achieve neighborhood transformation
• Provide equal access to opportunity
through predictable and clear process
for city subsidy and property
• Best practice for community
development nationally
• Criteria for leveraging federal, state and
other gap investment
15
455 and 459 Banfil,
West Seventh Neighborhood
Corporate FACTS

Cluster Areas
16Corporate FACTS
Dayton’s Bluff Frogtown Payne Phalen
Railroad Island West Seventh

Cluster Area Investment Strategy
HRA will utilize a developer driven
model to implement the Cluster Area
Investment Strategy.
• Developer driven model will:
– Leverage funds to produce more
units
– Incent private lending in weak
and borderline markets
– Reduce HRA investment and risk
– Establish a clear, accessible and
predictable funding process
17Corporate FACTS

Developer Driven Model
HRA may provide the following resources to affordable housing
developers and partners in cluster areas:
18Corporate FACTS
Development Subsidies
Land Donations
Support to groups seeking outside sources

Target Area Inventory70 parcels are located in the 5 Target areas
Target Parcels* Federally
Funded*
City
Funded
Dayton’s Bluff 15 12 3
Frogtown 15 12 3
Payne Phalen 10 6 4
Rail Road Island 15 11 4
West Seventh 15 3 12
TOTAL 70 44 26
*Federally funded parcels have a timeframe and national objective to meet
19Corporate FACTS
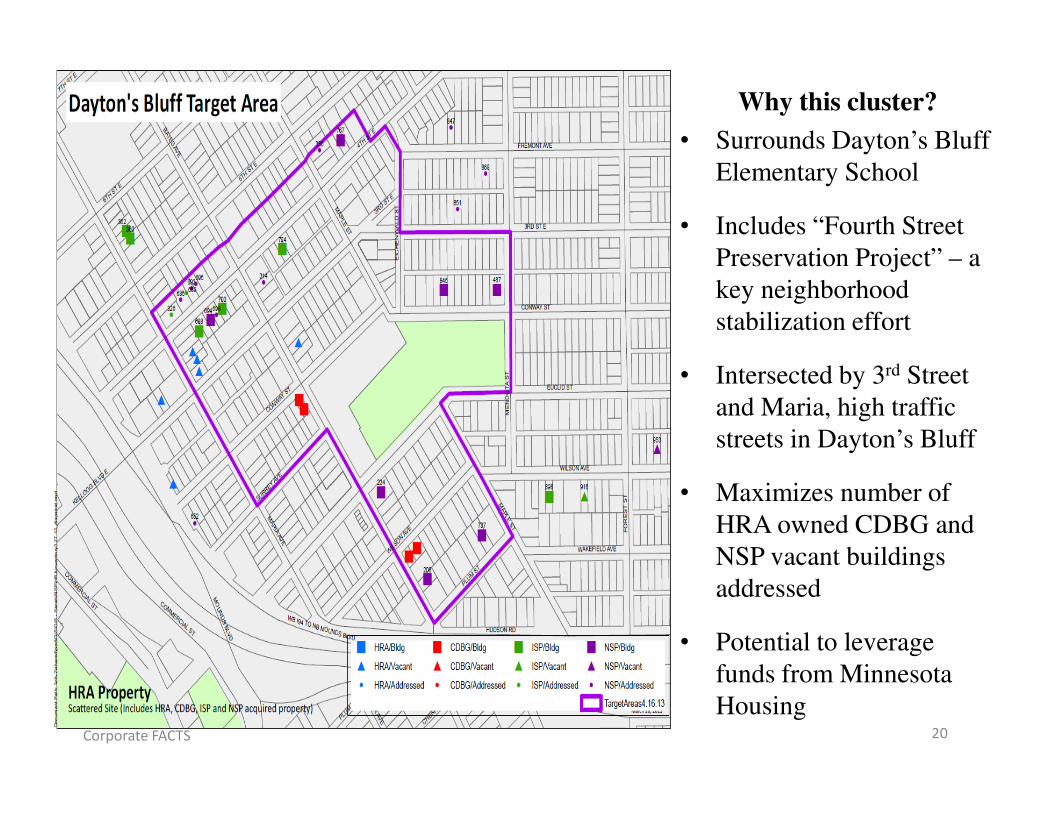
Why this cluster?
• Surrounds Dayton’s Bluff
Elementary School
• Includes “Fourth Street
Preservation Project” – a
key neighborhood
stabilization effort
• Intersected by 3rd Street
and Maria, high traffic
streets in Dayton’s Bluff
• Maximizes number of
HRA owned CDBG and
NSP vacant buildings
addressed
• Potential to leverage
funds from Minnesota
Housing20Corporate FACTS
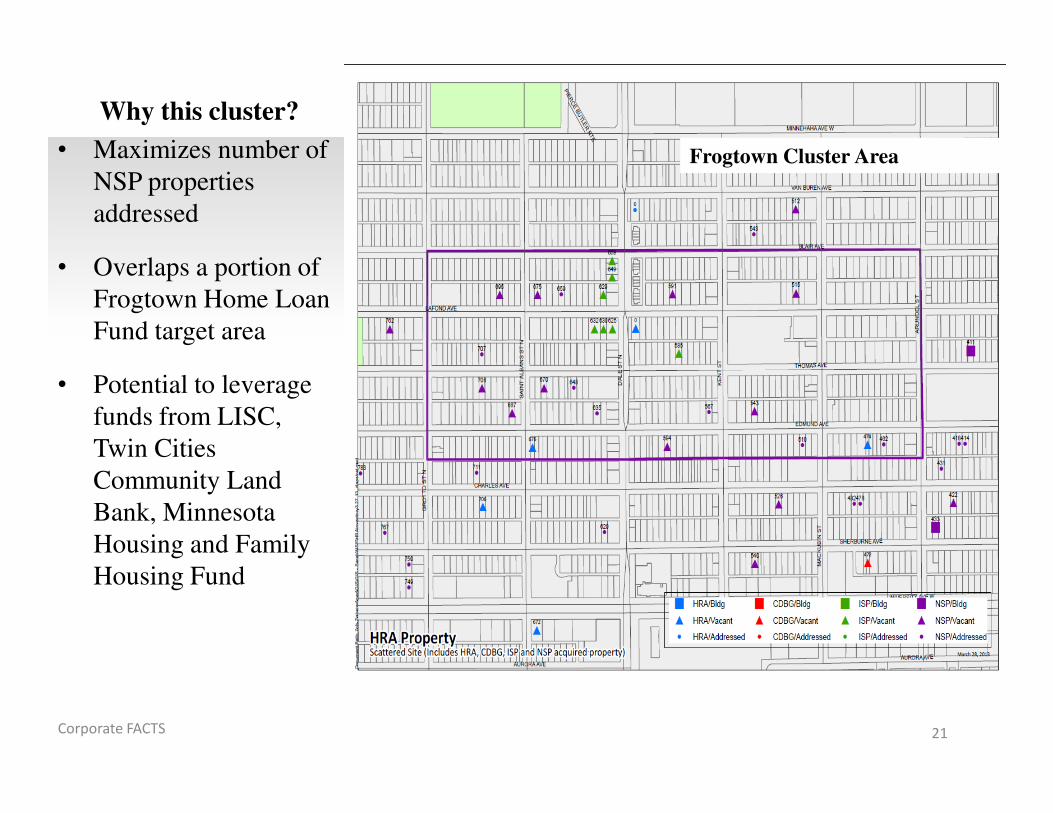
Why this cluster?
• Maximizes number of
NSP properties
addressed
• Overlaps a portion of
Frogtown Home Loan
Fund target area
• Potential to leverage
funds from LISC,
Twin Cities
Community Land
Bank, Minnesota
Housing and Family
Housing Fund
21Corporate FACTS
Frogtown Cluster Area

Why this cluster?
• Surrounds Payne Maryland
project
• Payne, Maryland and Arcade
are highly travelled streets
• Builds on investments
already made in NSP 3 target
area
• Maximizes ISP and NSP
buildings addressed
• Opportunity to leverage
rehab of non-HRA owned
buildings through ESNDC’s
“Community of Choice”
initiative
22Corporate FACTS

Why this cluster?
• Focus along Minnehaha
Avenue, gateway to the
Rivoli Bluff development
project
• Maximizes number of HRA
owned property addressed
• Initial focus to begin Rivoli
Bluff development
• Support neighborhood
vision for community
gardens or pocket parks
with splinter parcels
• Additional new construction
in 2015-6
23Corporate FACTS

Why this cluster?
• Target area maximizes
concentration of HRA
owned buildings
addressed
• Homes are clustered
by high frequency bus
line
• Initiative with strong
support from Little
Bohemia
Neighborhood
Association and Fort
Road Federation
24Corporate FACTS

Square Foot Construction Cost
and Sales Assumptions
Single Family
Rehab and Sale
Duplex
Rehab and
Sale
New
Construction
Construction $110 SF $150 SF $125 SF
Soft Costs 25% HC 25% HC 25% HC
Sales Price $95 SF $110 SF $100 SF
SF- Square Foot HC-Hard Costs
*Rental assumptions based on actual proposals received but not yet approved and closed
25Corporate FACTS

Total Cluster Area Cost Projections
Units
Estimated
costs
Program
Income
Subsidy
NeededDayton’s Bluff
20 $3,832,475 $2,152,355 $1,012,500Frogtown
15 $3,509,988 $2,542,355 $967,633Payne Phalen
10 $1,754,775 $1,098,895 $655,880Rail Road
Island28 $5,566,650 $4,012,420 $1,554,230
West Seventh 15 $3,445,406 $2,408,820 $1,036,586
Total 87* $17,859,294 $12,054,845 $5,136,829
*87 units impacting total of 70 HRA owned properties; Dayton’s Bluff neighborhood has
several rental projects projected, which reduces program income and increases unit count.
26Corporate FACTS
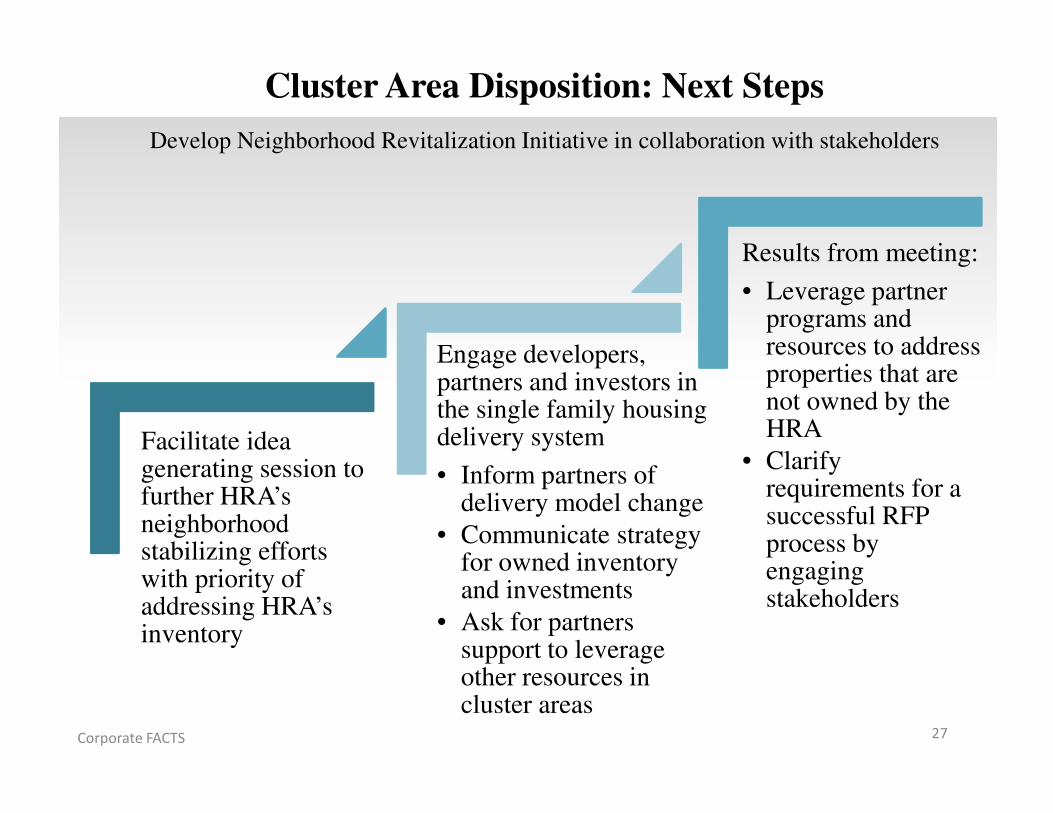
Cluster Area Disposition: Next Steps
Develop Neighborhood Revitalization Initiative in collaboration with stakeholders
27Corporate FACTS
Facilitate idea generating session to further HRA’s neighborhood stabilizing efforts with priority of addressing HRA’s inventory
Engage developers, partners and investors in the single family housing delivery system
• Inform partners of delivery model change
• Communicate strategy for owned inventory and investments
• Ask for partners support to leverage other resources in cluster areas
Results from meeting:
• Leverage partner programs and resources to address properties that are not owned by the HRA
• Clarify requirements for a successful RFP process by engaging stakeholders

Non-Clustered
Parcels with Obligations
(60 Parcels)
Corporate FACTS 28
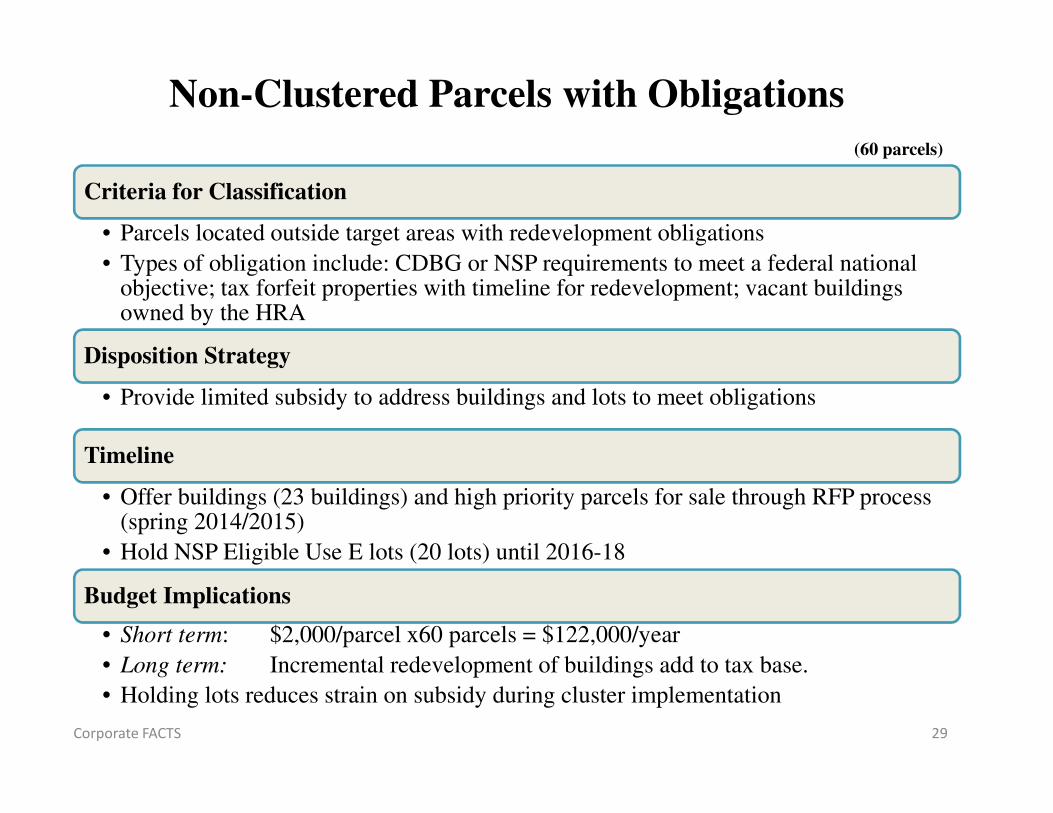
Non-Clustered Parcels with Obligations
Criteria for Classification
• Parcels located outside target areas with redevelopment obligations
• Types of obligation include: CDBG or NSP requirements to meet a federal national objective; tax forfeit properties with timeline for redevelopment; vacant buildings owned by the HRA
Disposition Strategy
• Provide limited subsidy to address buildings and lots to meet obligations
Timeline
• Offer buildings (23 buildings) and high priority parcels for sale through RFP process (spring 2014/2015)
• Hold NSP Eligible Use E lots (20 lots) until 2016-18
Budget Implications
• Short term: $2,000/parcel x60 parcels = $122,000/year
• Long term: Incremental redevelopment of buildings add to tax base.
• Holding lots reduces strain on subsidy during cluster implementation
29Corporate FACTS
(60 parcels)

Total Parcels with Obligations Cost Projections
Units
Estimated
costs
Program
Income Subsidy NeededCDBG Projects
21 $5,031,250 $3,220,000 $1,811,250Multi-Family
Rehab 13 $2,946,375 $1,728,540 $1,217,835Single Family
Rehab16 $3,899,775 $2,694,390 $1,205,385
NSP Required New
Construction 20 $5,000,000 $3,200,000 $1,800,000
Total 70* $16,877,400 $10,842,930 $6,034,470
*70 units impacting total of 50 HRA owned properties; difference due to rental projects
projected and CDBG obligated large redevelopment sites.
30Corporate FACTS
Splinter Parcel Strategy
(54 Parcels)
Corporate FACTS 31

Splinter Parcel Strategy
32Corporate FACTS
Criteria for Classification
• Substandard lot size or undevelopable due to topography or soil
Disposition Strategy
• Sell to adjacent residential property owners for nominal fee
• Utilize unsellable parcels as community gardens or pocket parks
Timeline
• Phase lot sales in groups of 10 per month
• Completion by Spring 2014
Budget Implications
• Short Term: $500/parcel x 54 parcels = $27,000
• Long Term: Savings of $100,000 annually in holding costs
• Exempt properties are returned to tax base
(54 Parcels)

Buildable Lots for Sale
(56 Parcels)
Corporate FACTS 33

Buildable Lots for Sale
Criteria for Classification
• Buildable vacant residential lots located outside of target areas
Disposition Strategy
• Sell for appraised value with no additional subsidy
• Create program in partnership with stakeholders to facilitate sale
Timeline
• Pilot sale of 5 parcels in Summer 2013
• Clarify procedures for sale in partnership with stakeholders in Q4 2013
• Full implementation in 2014
Budget Implications
• Short Term: $4,000/parcel x 56 parcels = $224,000
• Long Term: Savings of $112,000 annually in holding costs
• Exempt properties returned to tax base34Corporate FACTS
(56 Parcels)

35
Summary: Scattered Residential Lots Disposition
Corporate FACTS

Disposition Timeline
36Corporate FACTS

Strategy:
What do you like about the strategy & how do you think it will benefit
the neighborhood?
What would you change about the strategy to make it better?
What barriers/obstacles need to be addressed & what suggestions do you
have to resolve?
Developer-driven model:
Are the following factors challenges to affordable housing developers;
how can we address them? Are there any others?
• Predevelopment financing & planning
• Construction financing
• Leveraging funding
• Home sales
Equitable Disposition of City-Owned Parcels:
• How can the City dispose of properties in ways that are sensitive to
community needs & desires while adhering to rules & regulations that
govern funding sources used to purchase property?
QUESTIONS
37Corporate F.A.C.T.S.
Corporate F.A.C.T.S. 38
Group Report

What are the elements of an
ideal partnership
model?
Corporate FACTS 3939Corporate F.A.C.T.S.
Partnership Model
Identify 3 concrete steps neighborhood partners
can take to move toward the model?

Naming Our Partnership Initiative
HRA has named initiatives in the past. Such as:
– Houses to Homes
– Invest Saint Paul
– Neighborhood Stabilization Program
HRA wishes input from the partners in naming this initiative
– Index cards on table
– Request each person to come up with a name by the end of the meeting
– Deposit card in the box
Corporate F.A.C.T.S. 40

41Corporate F.A.C.T.S.

Evaluation
42Corporate F.A.C.T.S.