national healthcare cxo summit - 2015: roi of efficient facility design
TRANSCRIPT

VOLUME 5:RETURN ON INVESTMENTOFFACILITY DESIGN
18 MAY 2015 | DECISION PROCESS = CLINICAL AND FINANCIAL RESULTS

2
NATIONAL HEALTHCARE CXO SUMMIT MASTERCLASS | ROI OF FACILITY DESIGN | 18 MAY 2015
Introductions
TEG Efficient Design+Productive Care Clinical Procedural Platform• Overview• Platform Design Elements
TEG Efficient Design+Productive Care Decision Management Timeline
Clinical Procedural Platform Concept Benefits and ROI Impact• Clinical Volumes Comparison• Staffing Comparison• Patient Satisfaction Comparison• Financial Results Comparison
Questions from Attendees
Presentation Outline
Return on Investment ofFacility Design
1.0 2.0 3.0 4.0 5.0 6.0 7.0 8.0 9.0

3
NATIONAL HEALTHCARE CXO SUMMIT MASTERCLASS | ROI OF FACILITY DESIGN | 18 MAY 2015
Introductions
R. Wayne EstopinalAIA, ACHA, LEED APPresidentTEG Architects
W. F. “Bud” Barrow, IIAHA Region 7 Policy Board Chair, AHA Board MemberPresident/CEOOur Lady of Lourdes Regional Medical Center

4
NATIONAL HEALTHCARE CXO SUMMIT MASTERCLASS | ROI OF FACILITY DESIGN | 18 MAY 2015
Our Lady of Lourdes Regional Medical Center (OLOL) Lafayette, Louisiana
Process = Results
Replacement Facility Metrics
• Total Acute SF 430,400
• Number of Beds 186
• SF/Bed 2,314
• Percent Circulation 10.2%
• Site Acreage 46

5
NATIONAL HEALTHCARE CXO SUMMIT MASTERCLASS | ROI OF FACILITY DESIGN | 18 MAY 2015
Clinical Procedural Platform
• Overview
• Platform Design Elements
6
NATIONAL HEALTHCARE CXO SUMMIT MASTERCLASS | ROI OF FACILITY DESIGN | 18 MAY 2015
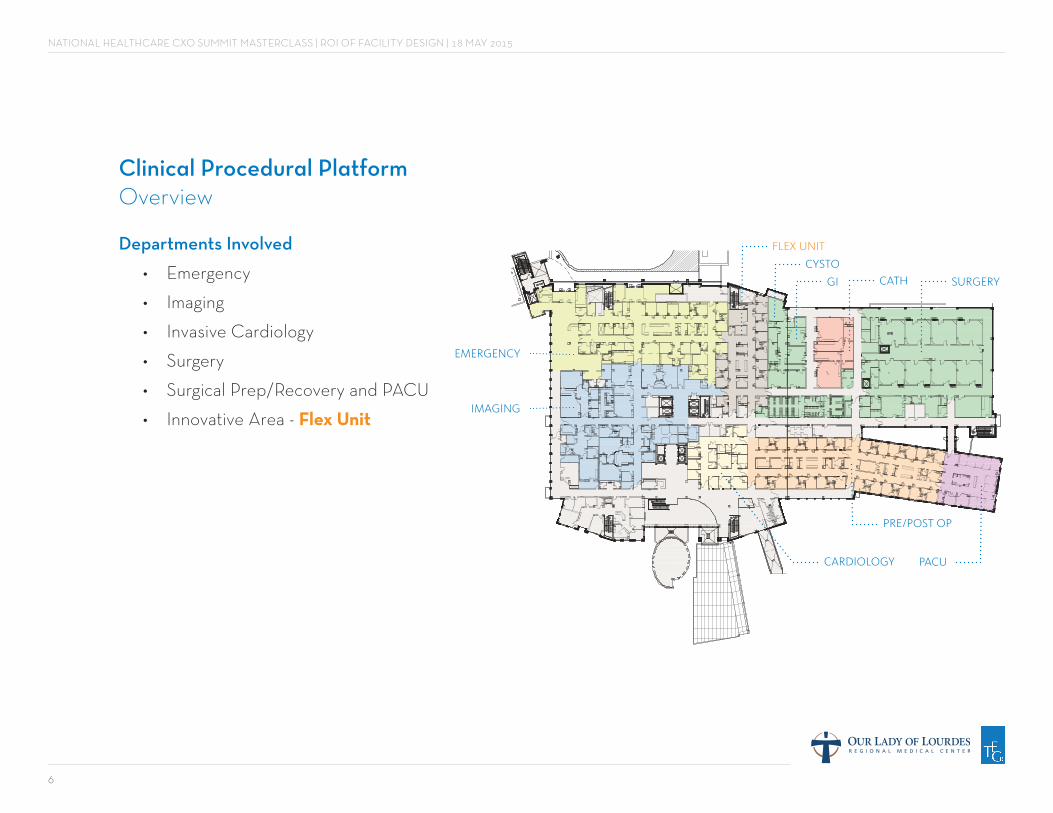
Clinical Procedural PlatformOverview
Departments Involved
• Emergency
• Imaging
• Invasive Cardiology
• Surgery
• Surgical Prep/Recovery and PACU
• Innovative Area - Flex Unit
DECONDECONDECON
EMERGENCY
IMAGING
FLEX UNIT
CYSTO
GI CATH SURGERY
CARDIOLOGY
PRE/POST OP
PACU

7
NATIONAL HEALTHCARE CXO SUMMIT MASTERCLASS | ROI OF FACILITY DESIGN | 18 MAY 2015
Clinical Procedural PlatformDesign Elements
Circulation• Corridors Clear and Direct
• Staff Functions Without Circuitous Routes
• Reduces Travel Distances

8
NATIONAL HEALTHCARE CXO SUMMIT MASTERCLASS | ROI OF FACILITY DESIGN | 18 MAY 2015
Departmental Adjacencies• Department Locations with Direct
Access to Other Departments
• Clinical Frequencies Determines Adjacencies
Clinical Procedural PlatformDesign Elements

9
NATIONAL HEALTHCARE CXO SUMMIT MASTERCLASS | ROI OF FACILITY DESIGN | 18 MAY 2015
Visibility• Staff Stations Allow Viewing of
Multiple Patient Care Areas
• Reduces Need for Staffing Observation Stations
Photo by: Will Crocker
Clinical Procedural PlatformDesign Elements

10
NATIONAL HEALTHCARE CXO SUMMIT MASTERCLASS | ROI OF FACILITY DESIGN | 18 MAY 2015
Expandability• Horizontal Expansion via
Exterior Walls
• Eliminates Major Disruption or Demolition of Clinical Spaces
Clinical Procedural PlatformDesign Elements

11
NATIONAL HEALTHCARE CXO SUMMIT MASTERCLASS | ROI OF FACILITY DESIGN | 18 MAY 2015
• Circulation
• Departmental Adjacencies
• Visibility
• Expandability
Clinical Procedural PlatformSummary

12
NATIONAL HEALTHCARE CXO SUMMIT MASTERCLASS | ROI OF FACILITY DESIGN | 18 MAY 2015
Decision Management Timeline
1.0 2.0 3.0 4.0 5.0 6.0 7.0 8.0 9.0

13
NATIONAL HEALTHCARE CXO SUMMIT MASTERCLASS | ROI OF FACILITY DESIGN | 18 MAY 2015
Project Decision Management Timeline Overview
Objective: Continuation of services to insure maximum value is provided to the Hospital.
8.0 CONSTRUCTION
9.0 POST CONSTRUCTION
1.0 INVESTIGATE/CONFIRM/VISION/INFORMObjective: Explore new ideas and Confirm prior decisions; Inform/Educate Hospital participants. Guiding Principles Draft One.
2.0 PROGRAMObjective: Define facility square footages driven by projected clinical utilization data./Service Lines/Programs and Departments
3.0 CONCEPTUALObjective: Create departmental level images to optimize clinical efficiency and illustrate adjacencies./Resolve Guiding Principles
4.0 SCHEMATIC DESIGNObjective: Design spatially accurate images to define the project./Initial Facility Aesthetics
5.0 DESIGN DEVELOPMENTObjective: Detail each space via clinical collaboration and multi-disciplinary input.
Objective: Deliver the facility by collaboration with Construction Team.
7.0 BIDDING/NEGOTIATIONSObjective: Price the CD Package via selected construction delivery process.
6.0 CONSTRUCTION DOCUMENTSObjective: Document the Replacement Hospital via construction level detailing and coordination.

14
NATIONAL HEALTHCARE CXO SUMMIT MASTERCLASS | ROI OF FACILITY DESIGN | 18 MAY 2015
OLOL Collaboration Metrics• 170 Meetings between OLOL & TEG
• 105 OLOL Staff Involved
• 28 Design Team Members
• 104,051 Design Team Hours
OLOL Nurses Station
1.0 2.0 3.0 4.0 5.0 6.0 7.0 8.0 9.0
Project Decision Management Timeline Overview

15
NATIONAL HEALTHCARE CXO SUMMIT MASTERCLASS | ROI OF FACILITY DESIGN | 18 MAY 2015
Project Decision Management Timeline Overview
A. Hospital .01 Leadership Team .02 Project Committee .03 Buildings/Equipment Committee .04 Board of Directors .05 Departmental Leaders .06 Physician Leaders
B. Design Team .01 Architects .02 Civil Engineering .03 Structural Engineering .04 Mechanical/Electrical Engineering .05 Code/Egress Consultant .06 Landscape Architect .07 Interior Design
Sample list of Participants
1.0 2.0 3.0 4.0 5.0 6.0 7.0 8.0 9.0
C. Construction Team .01 Construction Manager .02 Prime Sub Contractors
D. Consultants .01 Health Care Delivery Strategist .02 Program Manager .03 Equipment Planner .04 Construction Cost Estimator .05 Transition/Move Consultants .06 Security Consultant .07 Information Technology Consultant .08 Legal Counsel/Construction Specialist .09 Financial Consultant .10 Vertical Transportation Consultant .11 Traffic Consultant
OLOL Lobby Interior
16
NATIONAL HEALTHCARE CXO SUMMIT MASTERCLASS | ROI OF FACILITY DESIGN | 18 MAY 2015
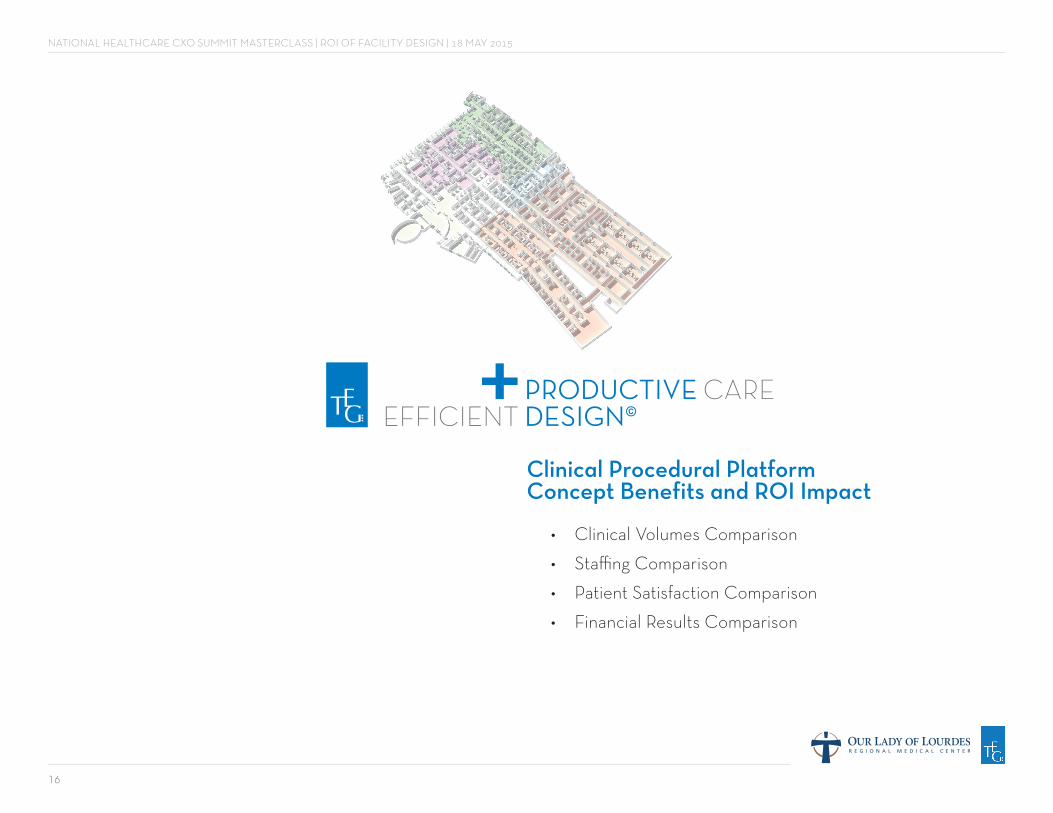
Clinical Procedural Platform Concept Benefits and ROI Impact
• Clinical Volumes Comparison
• Staffing Comparison
• Patient Satisfaction Comparison
• Financial Results Comparison

17
NATIONAL HEALTHCARE CXO SUMMIT MASTERCLASS | ROI OF FACILITY DESIGN | 18 MAY 2015
Clinical Volume ComparisonFY 2011 vs. FY 2014
FY 2011: 29,096
FY 2014: 36,081
FY 2011: 6,549
FY 2014: 6,757
FY 2011: 52,246
FY 2014: 75,175
24%Increase
3.17%Increase*
43.88%Increase
* Surgical Volumes are reduced due to joint venture with adjoining surgical hospital on campus
Emergency Department Visits
Surgical Department Procedures
Imaging Department Procedures

18
NATIONAL HEALTHCARE CXO SUMMIT MASTERCLASS | ROI OF FACILITY DESIGN | 18 MAY 2015
Staffing to Clinical Volume Comparison
Emergency Department
Old Campus
43.1 FTEUtilization: 675 Visits/FTE
New Campus
49.4 FTEUtilization: 730 Visits/FTE
Surgical Department
Old Campus
45.9 FTEUtilization: 143 Procedures/FTE
New Campus
52.2 FTE*Utilization: 130 Procedures/FTE
Imaging Department
Old Campus
25.8 FTEUtilization: 2,025 Procedures/FTE
New Campus
34.2 FTEUtilization: 2,199 Procedures/FTE
14.61%Staffing Increase
13.72%Staffing Increase*
32.55%Staffing Increase
*Actual staffing increases were minimal given the percentage of procedure increases documented.
Surgery procedures did not increase significantly due to the surgical hospital joint venture with physicians.

19
NATIONAL HEALTHCARE CXO SUMMIT MASTERCLASS | ROI OF FACILITY DESIGN | 18 MAY 2015
Goals
• Not Reduce Staffing
• Create Facility that Attracts Greater Market Share
• Improves Outcomes and Access to Care
• Department Size Based on Need
• Staff Productivity Improved
• Financial Results Improved
Staffing to Clinical Volume Comparison
3.17%*Procedure Increase
13.72%Staffing Increase
24%Visit Increase
14.61%Staffing Increase
43.88%Procedure Increase
32.55%Staffing Increase
*Actual staffing increases were minimal given the percentage of procedure increases documented.
Surgery procedures did not increase significantly due to the surgical hospital joint venture with physicians.

20
NATIONAL HEALTHCARE CXO SUMMIT MASTERCLASS | ROI OF FACILITY DESIGN | 18 MAY 2015
Patient Satisfaction Comparison
Press Ganey Guardian of Excellence AwardOLOL named a Guardian of Excellence Award winner by Press Ganey Associates, Inc in 2013 and 2014
86thPercentile of Scoring Population
Press Ganey Mean Scores: Old Campus VS. New Campus Comparison
60thPercentile of Scoring Population
86.7
Old Campus
Press Ganey Mean Score
89.7
New Campus
Press Ganey Mean Score
43.3%Increase in Percentile
OLOL Patient RoomPhoto by: Will Crocker

21
NATIONAL HEALTHCARE CXO SUMMIT MASTERCLASS | ROI OF FACILITY DESIGN | 18 MAY 2015
OLOL Overall Facility Performance
FY 2011: $155,818,000
FY 2014: $192,540,000
23.57%Increase
Net Patient Service Revenue 2011 vs. 2014
OLOL Hybrid OR

22
NATIONAL HEALTHCARE CXO SUMMIT MASTERCLASS | ROI OF FACILITY DESIGN | 18 MAY 2015
Financial ResultsEmergency Department
$2,160,314Increase
FY 2011: $(71,912)
FY 2014: $2,088,402
Net Profit
8%Decrease
FY 2014: $3,310,259
FY 2011: $3,605,999
Total Salaries/Wages/Benefits
DECON
Total GrossRevenue
89%Increase
NetRevenue
71%Increase
EMERGENCY

23
NATIONAL HEALTHCARE CXO SUMMIT MASTERCLASS | ROI OF FACILITY DESIGN | 18 MAY 2015
NetRevenue
49%Increase
Total Gross Revenue
58%Increase
$1,495,340Increase
FY 2011: $(1,288,514)
FY 2014: $206,826
Net Profit
6%Decrease
FY 2014: $3,314,931
FY 2011: $3,532,222
Total Salaries/Wages/Benefits
SURGICAL
Financial ResultsSurgical Department

24
NATIONAL HEALTHCARE CXO SUMMIT MASTERCLASS | ROI OF FACILITY DESIGN | 18 MAY 2015
$2,634,602Increase
FY 2011: $3,674,925
FY 2014: $6,309,527
Net Profit
17%Increase
FY 2014: $2,439,680
FY 2011: $2,085,806
Total Salaries/Wages/Benefits
Total GrossRevenue
73%Increase
NetRevenue
43%Increase
IMAGING
Financial ResultsImaging Department

25
NATIONAL HEALTHCARE CXO SUMMIT MASTERCLASS | ROI OF FACILITY DESIGN | 18 MAY 2015
Series
Volume III
Masterplanning
Aligned Planning Strategies & Collaborative Visioning
Volume II
ED Examples
Emergency Departments:Highly Efficient Facility Design
Volume I
ED Efficiency
Emergency Departments:Facility Metrics with Time & Motion Considerations
2012 | VOLUME. 03 | A PrOcEss OF highLy EFFiciEnt FAciLity dEsign
EFFICIENT DESIGNPRODUCTIVE CARE
ALIGNED PLANNING STRATEGIES AND COLLABORATIVE VISIONING
2011 | VOLUME. 02 | A CASE STUDY OF HIGHLY EFFICIENT FACILITY DESIGN
EFFICIENT DESIGNPRODUCTIVE CARE
DESIGNING EMERGENCY DEPARTMENTS THAT IMPROVE STAFF PRODUCTIVITY
1
Efficient Design Productive CareDesigning Emergency Departments that Improve Staff Productivity
A case study of facility metrics with time and motion considerations.
2010
+
VOLUME 5:RETURN ON INVESTMENTOFFACILITY DESIGN
2015 | VOLUME .05 | DECISION PROCESS = CLINICAL AND FINANCIAL RESULTS
Volume IV
Nursing Units
High Performance Nursing Units & Patient Room Innovation
Volume V
ROI of Facility Design
Decision process =Clinical and Financial results
TEG Architectswww.teg123.com
Questions?