national cardiac arrest audit report - icnarc ncaa report_jan 2013.pdf · national cardiac arrest...
TRANSCRIPT

National Cardiac Arrest AuditReport
St Elsewhere Hospital
01 April 2012 to 30 September 2012(n = 122)
Date of report: 14/01/2013
Supported by Resuscitation Council (UK) andIntensive Care National Audit & Research Centre (ICNARC)

© 2013. Resuscitation Council (UK) & ICNARC. All rights reserved.
Resuscitation Council (UK) & ICNARC disclaims any proprietary interest in any trademarksor trade-names other than its own

Content1. NCAA and your NCAA Report ...............................................................................................1
2. How to use your NCAA Report..............................................................................................2
3. About the data in this Report.................................................................................................4
4. Data completeness.................................................................................................................8
5. Activity ..................................................................................................................................12
Pre-hospital and In-hospital.................................................................................................12
Activity (in-hospital) .............................................................................................................13
Patient characteristics ............................................................................................................13
2222 calls ...............................................................................................................................16
Location of arrest....................................................................................................................18
Status at team arrival..............................................................................................................20
Presenting/first documented rhythm .......................................................................................21
Outcome.................................................................................................................................22
6. Stratified analyses................................................................................................................35
By Age....................................................................................................................................36
By day of week/hour of day of 2222 call .................................................................................38
By location of arrest................................................................................................................40
By presenting/first documented rhythm...................................................................................42
7. Comparative analyses..........................................................................................................45
8. Comments on your NCAA Report .......................................................................................48
St Elsewhere Hospital (01/04/2012 - 30/09/2012) / Doc. Version 3.1

NCAA and your NCAA Report1.
About the National Cardiac Arrest Audit (NCAA)
The National Cardiac Arrest Audit (NCAA) is the national, clinical audit for in-hospital cardiac arrest. Thepurpose of NCAA is to promote local performance management through the provision of timely, validatedcomparative data to participating hospitals. NCAA is a joint initiative between the Resuscitation Council(UK) and ICNARC (Intensive Care National Audit & Research Centre).
NCAA monitors and reports on the incidence of, and outcome from, in-hospital cardiac arrests and aimsto identify and foster improvements, where necessary, in the prevention, care delivery and outcome fromcardiac arrest.
Your hospital collects and enters data according to the NCAA data collection scope and comprehensivedataset specification. The NCAA dataset was developed to ensure that all hospitals collect the samestandardised data, so that accurate comparisons can be made.
The National Confidential Enquiry into Patient Outcome and Death (NCEPOD) Report on in-hospital
structured information on patients who have a cardiac arrest. The National Cardiac Arrest Audit collectssuch data and hospitals are encouraged to participate...".
About your NCAA Report
The NCAA Report provides you with: an overview of the completeness of the data your hospital hasreported; analyses of activity; stratified analyses of activity (drawing comparisons between your hospitaland national data); and basic, anonymised comparative analyses (non-risk adjusted).
A multivariable statistical model allowing comparisons of outcomes between participating hospitals isbeing developed and tested. The timeline for this has been dependant on NCAA achieving a significantsample size.
Cumulative reports on validated data are produced and disseminated quarterly based on the financialyear:
St Elsewhere Hospital (01/04/2012 - 30/09/2012) / Doc. Version 3.1 1

How to use your NCAA Report2.
The NCAA Report marks the beginning of your local performance management/quality improvementprocess. We encourage you to disseminate the information in this Report to relevant staff in yourdepartment, as well as to colleagues in your hospital, Trust, etc. in order to promote wider discussion.
St Elsewhere Hospital (01/04/2012 - 30/09/2012) / Doc. Version 3.1 2
Resuscitation Team and staff in your departmentResuscitation Committee and ChairNon-Executive Director in your Trust responsible for Resuscitation PolicyTrust/Board/Regional levelOther staff involved with the NCAA data collection and validation processPatient groups at your hospital/TrustRegional Resuscitation Officer RepresentativeOther clinical staff/teams that feed into the patient journey e.g. nursing, outreach, general ward,ICU/HDU/CCU, surgical staff, Allied Health Professionals, etc.Any other relevant departments/teams within your hospital/Trust e.g. audit, management, etc.Managers at your hospital/Trust responsible for service development and business planning
WHO to share your NCAA Report with:
HOW to share/disseminate your NCAA Report:
WHAT to reflect upon in your NCAA Report:
Raise at relevant meetings (monthly/quarterly/yearly), such as:Resuscitation Team or Staff meetings;oResuscitation Committee meetings;oManagement meetings;oService development and Business planning meetings; andoRegional Resuscitation Officer meetings.o
Provide a presentation/hold a seminar at relevant meetings (monthly/quarterly/yearly)Save NCAA Report electronically on your shared drive for colleagues to accessEmail NCAA Report to colleaguesInclude key points in any local newsletters or intranetDisplay key results on your staff notice board or performance boards in common areas
Review the suggested questions at the end of each section, as a basis for your discussion.Identify and discuss areas of concern and areas for improvement.Identify any areas of interest (for further analysis)Agree targets for improvement for the next quarter and year (and put action plan in place)Identify team visits to review in greater detailDiscuss areas of success, and identify reasonCollate any questions/feedback for the NCAA Team

Look out for the following boxes in each section, where we have provided some usefulquestions to prompt local discussion and/or further local investigation:
Suggested questions for local useHave you shared and discussed results with relevant staff?Have you made this NCAA Report accessible to all relevant staff?Have you made the results of your NCAA Report a standing meeting agenda item?Have you highlighted areas for improvement for the next quarter and forthcomingyear, and drawn up an action plan to achieve this?Have you shared local successes in the delivery of care?
Please note: When sharing or presenting NCAA results/data,you must acknowledge the scope of data collection, the period it relates to
and how many team visit records it is based upon (sample size).
St Elsewhere Hospital (01/04/2012 - 30/09/2012) / Doc. Version 3.1 3

Please note:
* Total includes elective, non-elective (emergency) and day casesTotal includes arrests and fire
Where data are not plotted in relation to 2222 calls, note that hospitals are required to collectdenominator data either for number of 2222 OR number of 2222 calls solely for cardiac
St Elsewhere Hospital (01/04/2012 - 30/09/2012) / Doc. Version 3.1 4
Number ofindividuals
PeriodTotal number ofadmissions toyour hospital*
Total numberof 2222calls
Total number of2222 calls solely
for cardiacarrests
Number ofteam visits
entered
122 11301/04/2012 -30/09/2012
62,141 - 251
About the data in this Report3.
Scope of data collection
NCAA data are collected for all individuals (excluding neonates) receiving chest compressions and/ordefibrillation and attended by the hospital-based Resuscitation Team (or equivalent) in response to a
Data collection/validation method
Your data have been validated both at the point of entry on to the NCAA secure, web-based data entrysystem and centrally at ICNARC. Data are checked for completeness and illogicalities.
Numbers this Report is based on
Reported numbers of admissions to your hospital, 2222 calls, team visits and individuals covered by thisReport are presented below.

The following graphs present the reported number of team visits against the reported denominator data(Total number of admissions to your hospital, Total number of 2222 calls OR Total number of 2222 callssolely for cardiac arrest), for your hospital, for the period that this Report covers.
10
20
30
0
R
epor
ted
num
ber
of te
am v
isits
Team visits
Average over period
1
2
3
4
5
0
R
epor
ted
num
ber
of te
am v
isits
per
1000
hos
pita
l adm
issi
ons*
Rate
95% CI
Average over period
-1
1
0 R
epor
ted
num
ber
of te
am v
isits
per
Rate
95% CI
Average over period
20
40
60
80
0
Rep
orte
d nu
mbe
rof
team
vis
its p
eron
e hu
ndre
d 22
22 c
alls
sole
ly fo
r ca
rdia
c ar
rest
s
Apr 20
12
May 20
12
Jun 2
012
Jul 2
012
Aug 20
12
Sep 20
12
Month of 2222 call
Rate
95% CI
Average over period
© NCAA 2013
Please note:
* Total includes elective, non-elective (emergency) and day casesTotal includes arrests and fire
St Elsewhere Hospital (01/04/2012 - 30/09/2012) / Doc. Version 3.1 5

The following graph presents the reported number of team visits per 1,000 hospital admissions foradult, acute hospitals in NCAA (for the period that this Report covers).
0
2
4
6
8T
ea
m v
isits
pe
r 1
00
0 h
osp
ital a
dm
issi
on
s
Your hospital Other hospitals
© NCAA 2013
Note that interpretation of these data is subject to:
the inclusion of all adult, acute hospitals with at least five team visits (for the period that thisReport covers) and at least three months data in the given financial year; andan assumption that all hospitals are capturing the numerator and denominator data accurately.
Graphical presentation
Data for your hospital are plotted in red, and data for other NCAA participating hospitals are plotted inblue.
These data are presented with 95% confidence intervals. The vertical line through each data point (see image to the left) represents the 95% confidence interval (CI) around the value plotted.
Values plotted for your hospital data and other NCAA data are estimates of the true underlying ratesbecause they are based on a sample of data. The range of values most likely to contain the true rate isdisplayed as a 95% CI.
The CI gives an idea of how accurately the value has been estimated. A narrow CI indicates a moreaccurate value.
St Elsewhere Hospital (01/04/2012 - 30/09/2012) / Doc. Version 3.1 6

Suggested questions for local useHave you ensured that data are being captured on all team visits, and according tothe current NCAA scope of data collection?Is the reported number and rate of team visits as you expected for your hospital?How might NCAA data collection /entry be improved locally?How might you share advice for capturing team visit data with other NCAAparticipating hospitals in your Trust/region that may be experiencing issues with datacollection?
St Elsewhere Hospital (01/04/2012 - 30/09/2012) / Doc. Version 3.1 7

Data completeness4.
This section provides you with an overview of the completeness of NCAA data for reported team visits.The following graphs illustrate how complete your data are for each field in the NCAA dataset.
Completeness graphs are grouped and presented under the following categories:
patient characteristics;hospital admission;2222 calls;visit/arrest details;post-arrest location; andoutcome.
On each graph, a red bar indicates where data are incomplete (less than 100%) for a given field and ablue bar indicates where data are complete (100%).
On each bar for each field, the number of complete team visits, relative to the number required to becomplete, is presented. For example, 10/13 means 10 out of 13 team visits had complete data for thisfield.
Patient characteristics
119/122
122/122
122/122
122/122
NHS Number*
Date of birth
Sex
Ethnicity^
0 20 40 60 80 100
Completeness (%)© NCAA 2013
* n = 0 team visit records where individual was recorded as a "Non-UK patient" (theseare considered as complete data)
^ n = 0 team visit records where individual had ethnicity recorded as "Not stated" (theseare considered as incomplete data)
St Elsewhere Hospital (01/04/2012 - 30/09/2012) / Doc. Version 3.1 8

Hospital admission
122/122
122/122
Date of admission to/attendance at/visit to your hospital
Reason for admission to/attendance at/visit to your hospital
0 20 40 60 80 100
Completeness (%)© NCAA 2013
2222 calls
122/122
122/122
Date of 2222 call
Time of 2222 call
0 20 40 60 80 100
Completeness (%)© NCAA 2013
St Elsewhere Hospital (01/04/2012 - 30/09/2012) / Doc. Version 3.1 9

Visit / arrest details
122/122
122/122
116/122
122/122
Location of arrest
Status at team arrival
Presenting/first documented rhythm*
Reason resuscitation stoppedat end of team visit
0 20 40 60 80 100
Completeness (%)© NCAA 2013
* n = 6 team visit records where individual had presenting/first documented rhythmrecorded as "Unknown" (these are considered as incomplete data)n = 0 team visit records where individual had presenting/first documented rhythmrecorded as "Never determined" (these are considered as complete data)
Post-arrest location
61/61
61/61
Transient post-arrest location
Post-arrest location
0 20 40 60 80 100
Completeness (%)© NCAA 2013
St Elsewhere Hospital (01/04/2012 - 30/09/2012) / Doc. Version 3.1 10

Outcome
54/54
29/29
28/28
93/93
93/93
Status at discharge from your hospital*
Date of discharge from your hospital
CPC at discharge from your hospital^
Date of death
Time of death
0 20 40 60 80 100
Completeness (%)© NCAA 2013
* n = 0 team visit records where individual is recorded as "patient still in your hospital"(excluded from the denominator)
^ n = 1 team visit records where individual is recorded as sedated (excluded from thedenominator)
Suggested questions for local useIs your hospital fully collecting every (appropriate) field in the NCAA dataset?How could your hospital:
improve the quality of data collection?oincrease the speed of data collection/entry?oreduce the number of subsequent validation queries?oincrease the speed of processing validation queries?o
For definitions of any of the dataset fields in this section, refer to the current NCAA Data CollectionManual.
St Elsewhere Hospital (01/04/2012 - 30/09/2012) / Doc. Version 3.1 11

Activity5.
Pre-hospital and In-hospital
The graph below presents reported team visits where the location of arrest is and
A arrest is defined as prior to arrival at your hospital, and meets the current scope of NCAAdata collection :
individual is an adult or child over 28 days;individual received chest compressions and/or defibrillation;2222 call made; andindividual attended by hospital-based resuscitation team (or equivalent) in response to the 2222call.
122
0
10
20
30
40
50
60
70
80
90
100
% te
am v
isits
Pre-hospital In-hospital Missing
Location of arrest© NCAA 2013
St Elsewhere Hospital (01/04/2012 - 30/09/2012) / Doc. Version 3.1 12

Activity (in-hospital)
This section provides you with an overview of NCAA data for reported team visits where the location ofarrest is in-hospital (i.e. excludes team visits where the location of arrest is pre-hospital).
Activity graphs are grouped and presented under the following headings:
patient characteristics;2222 calls;location of arrest;status at team arrival;presenting/first documented rhythm; andoutcome.
For each graph, team visits for each category are presented as a percentage on the y axis (vertical) andas a number on the top of each bar.
Patient characteristics
Sex
50
72
0
10
20
30
40
50
60
70
80
90
100
% te
am v
isits
Female Male Missing
Sex© NCAA 2013
St Elsewhere Hospital (01/04/2012 - 30/09/2012) / Doc. Version 3.1 13

Age
1
28 3136
26
0
10
20
30
40
50
60
70
80
90
100%
team
vis
its
0-15 16-64 65-74 75-84 85+ Missing
Age (years)© NCAA 2013
Age by sex
5
16 16 13
1
2315
2013
0
10
20
30
40
50
60
70
80
90
100
% te
am v
isits
0-15 16-64 65-74 75-84 85+ Missing
Age (years)
Female Male
© NCAA 2013
Please note: n = 0 estimated age
St Elsewhere Hospital (01/04/2012 - 30/09/2012) / Doc. Version 3.1 14

Reason for admission to/attendance at/visit to your hospital
4
87
11 151 2 2
0102030405060708090
100
% te
am v
isits
Patien
t - tra
uma
Patien
t - med
ical
Patien
t - ele
ctive
/sche
duled
surge
ry
Patien
t - em
ergen
cy/ur
gent
surge
ry
Patien
t - ob
stetric
Outpati
ent
Staff
Visitor
Missing
Reason for admission to/attendance at/visit to your hospital© NCAA 2013
Suggested questions for local useAre there any trends in these data on patient characteristics for your hospital?How might patient characteristics be affecting the care you deliver?How does seasonal variation affect patient characteristics?How could these data on patient characteristics be used for planning ResuscitationTeam responses?How could these data on patient characteristics be used for wider service planning atyour hospital?
St Elsewhere Hospital (01/04/2012 - 30/09/2012) / Doc. Version 3.1 15

2222 calls
Day of week of 2222 call
1520 20
1217
2216
0
10
20
30
40
50
60
70
80
90
100
% te
am v
isits
Monda
y
Tuesd
ay
Wedne
sday
Thursd
ayFrid
ay
Saturda
y
Sunda
y
Day of week of 2222 call© NCAA 2013
Hour of day of 2222 call
6 5 6 4 49 12
3 2 3 3 6 4 3 2 28 6 3
93 5
104
0
10
20
30
40
50
60
70
80
90
100
% te
am v
isits
08:0009
:0010
:0011
:0012
:0013
:0014
:0015
:0016
:0017
:0018
:0019
:0020
:0021
:0022
:0023
:0000
:0001
:0002
:0003
:0004
:0005
:0006
:0007
:00
Missing
Hour of day of 2222 call© NCAA 2013
St Elsewhere Hospital (01/04/2012 - 30/09/2012) / Doc. Version 3.1 16

Day of week/hour of day of 2222 call
50
34
13
25
0
10
20
30
40
50
60
70
80
90
100%
team
vis
its
Weekd
ay 08
:00-19
:59
Weekd
ay 20
:00-07
:59
Weeke
nd 08
:00-19
:59
Weeke
nd 20
:00-07
:59
Missing
Day of week/hour of day of 2222 call© NCAA 2013
Number of days from admission to 2222 call
12
24
49
29
8
0
10
20
30
40
50
60
70
80
90
100
% te
am v
isits
0 1 2-7 8-30 >30 Missing
Number of days from admission to 2222 call© NCAA 2013
St Elsewhere Hospital (01/04/2012 - 30/09/2012) / Doc. Version 3.1 17

Location of arrest
Location of arrest
72 1 2 4 2 1
15
87
10
10
20
30
40
50
60
70
80
90
100
% te
am v
isits
Emergen
cy de
pt
Emergen
cy ad
mission
s unit
Theatr
e & re
cove
ry
Imag
ing de
pt
Cardiac
cathe
ter la
borat
ory
Specia
list tre
atmen
t area
ICU or
ICU/H
DUHDU
PICU
PHDU
Corona
ry ca
re un
it
Other in
termed
iate c
are ar
ea
Obstet
rics a
rea Ward
Other in
terna
l loca
tion
Clinic
Non-cl
inica
l area
Missing
Location of arrest© NCAA 2013
St Elsewhere Hospital (01/04/2012 - 30/09/2012) / Doc. Version 3.1 18

Ward arrests by reason for admission to/attendance at/visit to your hospital
3
62
8 131
0102030405060708090
100
% te
am v
isits
Patien
t - tra
uma
Patien
t - med
ical
Patien
t - ele
ctive
/sche
duled
surge
ry
Patien
t - em
ergen
cy/ur
gent
surge
ry
Patien
t - ob
stetric
Outpati
ent
Staff
Visitor
Missing
Reason for admission to/attendance at/visit to your hospital© NCAA 2013
Please note: The above graph only includes team visits where location of arrest is ward
St Elsewhere Hospital (01/04/2012 - 30/09/2012) / Doc. Version 3.1 19

Status at team arrival
Status at team arrival
1
97
14 10
0102030405060708090
100
% te
am v
isits
Dead -
resu
scita
tion s
toppe
dRes
uscit
ation
ongo
ing
ROSC achie
ved b
efore
team ar
rival
Deterio
rating
(not
yet a
rreste
d)
Missing
Status at team arrival© NCAA 2013
St Elsewhere Hospital (01/04/2012 - 30/09/2012) / Doc. Version 3.1 20

Presenting/first documented rhythm
Presenting/first documented rhythm
169
31
57
1 2 60
102030405060708090
100
% te
am v
isits
Shock
able
- VF
Shock
able
- VT
Shock
able
- unk
nown r
hythm
Non-sh
ocka
ble - a
systo
le
Non-sh
ocka
ble - P
EA
Non-sh
ocka
ble - b
radyc
ardia
Non-sh
ocka
ble - u
nkno
wn rhy
thm
Never
deter
mined
Unkno
wn
Missing
Presenting/first documented rhythm© NCAA 2013
Suggested questions for local useWhat patterns are present in your activity data?How could activity data be used for planning Resuscitation Team responses?How could activity data be used for wider service planning at your hospital?
St Elsewhere Hospital (01/04/2012 - 30/09/2012) / Doc. Version 3.1 21

Outcome
Staged outcome flow
Number of individuals (in this report)113
Reason resuscitation stopped
Dead60 (53.1%)
Alive53 (46.9%)
Missing 0 (0.0%)
Post-arrest location
Dead6 (11.3%)
Alive47 (88.7%)
Missing 0 (0.0%)
Status at discharge from your hospital
Dead23 (48.9%)
Survival to hospital discharge24 (51.1%)
Patient still in your hospital0 (0.0%)
Missing 0 (0.0%)
Please note: The percentages shown at each stage in this flow represent individuals thatsurvived the previous stage and Alive/Dead percentages are for each stage notan overall figure
St Elsewhere Hospital (01/04/2012 - 30/09/2012) / Doc. Version 3.1 22

Reason resuscitation stopped at end of team visit
61
10
48
2 10
10
20
30
40
50
60
70
80
90
100%
team
vis
its
Alive - R
OSC>20 m
in
Dead -
ROSC<20
min
Dead -
no R
OSC
Dead -
DNAR
Dead -
futilit
y
Missing
Reason resuscitation stopped at end of team visit© NCAA 2013
St Elsewhere Hospital (01/04/2012 - 30/09/2012) / Doc. Version 3.1 23

Reason resuscitation stopped at end of team visitby presenting/first documented rhythm
16
9
31
57
1
8
0
10
20
30
40
50
60
70
80
90
100
% te
am v
isits
Shock
able
- VF
Shock
able
- VT
Non-sh
ocka
ble - a
systo
le
Non-sh
ocka
ble - P
EA
Non-sh
ocka
ble - b
radyc
ardia
Other o
r miss
ing
Presenting/first documented rhythm
Alive - ROSC>20 min Dead - ROSC<20 min
Dead - no ROSC Dead - DNAR
Dead - futility Missing
Reason resuscitation stopped at end of team visit
© NCAA 2013
St Elsewhere Hospital (01/04/2012 - 30/09/2012) / Doc. Version 3.1 24

Reason resuscitation stopped at end of team visit:Shockable - VF
14
1 1
0102030405060708090
100
% te
am v
isits
Alive - R
OSC>20 m
in
Dead -
ROSC<2
0 min
Dead -
no R
OSC
Dead -
DNAR
Dead -
futilit
y
Missing
Reason resuscitation stopped at end of team visitShockable - VF
© NCAA 2013
Reason resuscitation stopped at end of team visit:Shockable - VT
7
2
0102030405060708090
100
% te
am v
isits
Alive - R
OSC>20 m
in
Dead -
ROSC<2
0 min
Dead -
no R
OSC
Dead -
DNAR
Dead -
futilit
y
Missing
Reason resuscitation stopped at end of team visitShockable - VT
© NCAA 2013
St Elsewhere Hospital (01/04/2012 - 30/09/2012) / Doc. Version 3.1 25

Reason resuscitation stopped at end of team visit:Non-shockable - asystole
8
3
20
0102030405060708090
100
% te
am v
isits
Alive - R
OSC>20 m
in
Dead -
ROSC<2
0 min
Dead -
no R
OSC
Dead -
DNAR
Dead -
futilit
y
Missing
Reason resuscitation stopped at end of team visitNon-shockable - asystole
© NCAA 2013
Reason resuscitation stopped at end of team visit:Non-shockable - PEA
25
5
25
1 10
102030405060708090
100
% te
am v
isits
Alive - R
OSC>20 m
in
Dead -
ROSC<2
0 min
Dead -
no R
OSC
Dead -
DNAR
Dead -
futilit
y
Missing
Reason resuscitation stopped at end of team visitNon-shockable - PEA
© NCAA 2013
St Elsewhere Hospital (01/04/2012 - 30/09/2012) / Doc. Version 3.1 26

Reason resuscitation stopped at end of team visit:Non-shockable - bradycardia
1
0102030405060708090
100
% te
am v
isits
Alive - R
OSC>20 m
in
Dead -
ROSC<2
0 min
Dead -
no R
OSC
Dead -
DNAR
Dead -
futilit
y
Missing
Reason resuscitation stopped at end of team visitNon-shockable -bradycardia
© NCAA 2013
St Elsewhere Hospital (01/04/2012 - 30/09/2012) / Doc. Version 3.1 27

Reason resuscitation stopped at end of team visitby day of week/hour of day of 2222 call
50
34
13
25
0
10
20
30
40
50
60
70
80
90
100
% te
am v
isits
Weekd
ay 08
:00-19
:59
Weekd
ay 20
:00-07
:59
Weeke
nd 08
:00-19
:59
Weeke
nd 20
:00-07
:59
Missing
Day of week/hour of day of 2222 call
Alive - ROSC>20 min Dead - ROSC<20 min
Dead - no ROSC Dead - DNAR
Dead - futility Missing
Reason resuscitation stopped at end of team visit
© NCAA 2013
St Elsewhere Hospital (01/04/2012 - 30/09/2012) / Doc. Version 3.1 28

Post-arrest location
1
19
1
16 16
71
0
10
20
30
40
50
60
70
80
90
100%
team
vis
its
Emergen
cy ad
mission
s unit
ICU or
ICU/H
DUHDU
PICU
PHDUCCU
Other in
termed
iate c
are ar
ea
Obstet
rics a
rea Ward
Other in
terna
l loca
tion
Mortua
ry
Other h
ospit
al
Not in
hosp
ital
Missing
Post-arrest location© NCAA 2013
Overall outcome flow
Number of individuals (in this report)113
Overall outcome at discharge from your hospital
Dead89 (78.8%)
Alive24 (21.2%)
Patient still in your hospital0 (0.0%)
Missing 0 (0.0%)
St Elsewhere Hospital (01/04/2012 - 30/09/2012) / Doc. Version 3.1 29

CPC at discharge from your hospital: Adults
18
3 2
89
0
10
20
30
40
50
60
70
80
90
100%
indi
vidu
als
(adu
lts)
1 2 3 4 5 Missing
CPC at discharge from your hospital© NCAA 2013
Please note: CPC 5 (adult) is dead (brain death: apnea, areflexia or EEG silence)n = 0 individuals sedated on discharge from your hospital (excluded)
CPC at discharge from your hospital: Adult survivors
18
32
0
10
20
30
40
50
60
70
80
90
100
% in
divi
dual
s (a
dult
surv
ivor
s)
1 2 3 4 Missing
CPC at discharge from your hospital© NCAA 2013
Please note: n = 0 individuals sedated on discharge from your hospital (excluded)
St Elsewhere Hospital (01/04/2012 - 30/09/2012) / Doc. Version 3.1 30

CPC at discharge from your hospital:Paediatrics (aged less than 16)
0
10
20
30
40
50
60
70
80
90
100
% in
divi
dual
s (p
aedi
atric
s)
1 2 3 4 5 6 Missing
CPC at discharge from your hospital© NCAA 2013
Please note: CPC 6 (paediatric) is dead (brain death: apnea, areflexia or EEG silence)n = 1 individuals sedated on discharge from your hospital (excluded)
CPC at discharge from your hospital:Paediatric survivors (aged less than 16)
0
10
20
30
40
50
60
70
80
90
100
% in
divi
dual
s (p
aedi
atric
sur
vivo
rs)
1 2 3 4 5 Missing
CPC at discharge from your hospital© NCAA 2013
Please note: n = 1 individuals sedated on discharge from your hospital (excluded)
St Elsewhere Hospital (01/04/2012 - 30/09/2012) / Doc. Version 3.1 31
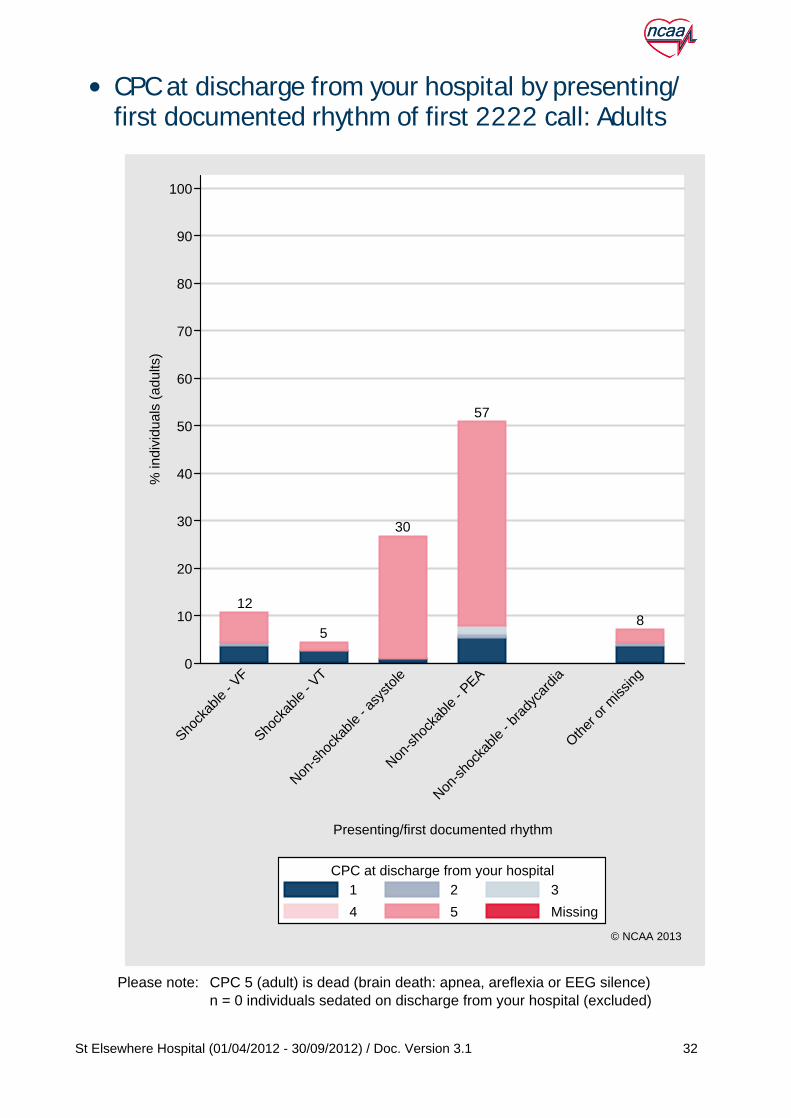
CPC at discharge from your hospital by presenting/first documented rhythm of first 2222 call: Adults
12
5
30
57
8
0
10
20
30
40
50
60
70
80
90
100
% in
divi
dual
s (a
dults
)
Shock
able
- VF
Shock
able
- VT
Non-sh
ocka
ble - a
systo
le
Non-sh
ocka
ble - P
EA
Non-sh
ocka
ble - b
radyc
ardia
Other o
r miss
ing
Presenting/first documented rhythm
1 2 3
4 5 Missing
CPC at discharge from your hospital
© NCAA 2013
Please note: CPC 5 (adult) is dead (brain death: apnea, areflexia or EEG silence)n = 0 individuals sedated on discharge from your hospital (excluded)
St Elsewhere Hospital (01/04/2012 - 30/09/2012) / Doc. Version 3.1 32

CPC at discharge from your hospital by day ofweek/hour of day of first 2222 call: Adults
46
29
13
24
0
10
20
30
40
50
60
70
80
90
100
% in
divi
dual
s (a
dults
)
Weekd
ay 08
:00-19
:59
Weekd
ay 20
:00-07
:59
Weeke
nd 08
:00-19
:59
Weeke
nd 20
:00-07
:59
Missing
Day of week/hour of day of 2222 call
1 2 3
4 5 Missing
CPC at discharge from your hospital
© NCAA 2013
Please note: CPC 5 (adult) is dead (brain death: apnea, areflexia or EEG silence)n = 0 individuals sedated on discharge from your hospital (excluded)
St Elsewhere Hospital (01/04/2012 - 30/09/2012) / Doc. Version 3.1 33

Suggested questions for local useAre there any unexpected patterns in patient outcome?Are there any unexpected mortalities or unexpected survivors?Is there a need to identify and review any specific team visits?How could these data be used for planning Resuscitation Team responses?How could these data be used for wider service planning at your hospital?
St Elsewhere Hospital (01/04/2012 - 30/09/2012) / Doc. Version 3.1 34

Stratified analyses6.
This section provides you with a stratified overview of your NCAA data, for reported team visits (wherethe location of arrest is in-hospital i.e. excludes team visits where the location of arrest is pre-hospital),compared with all NCAA data (for the period that this Report covers).
Stratified analyses provide you with grouped comparisons on specific outcome variables. The outcomesincluded are:
percentage of team visits;
favourable neurological outcome (CPC 1 or 2 for adults, and CPC 1, 2 or 3 for paediatrics) at
Stratified graphs are grouped and presented under the following headings:
age;day of week/hour of day of 2222 call;location of arrest; andpresenting/first documented rhythm.
Graphical presentation
Data for your hospital are plotted on each graph in red, and all NCAA data (for the period that this Reportcovers) are plotted in blue.
For each graph, the number of team visits/individuals in each category for your hospital, is presentedabove the x axis (horizontal), for the period that this Report covers. Where there are fewer than fiveteam visits/individuals in a category for your hospital, data are not plotted.
The vertical line through each data point (see image to the left) represents a 95%confidence interval (CI) around the value plotted.
Values plotted for your hospital data and NCAA data are estimates of the trueunderlying rates because they are based on a sample of data.
The range of values most likely to contain the true rate is displayed as a 95% CI. TheCI gives an idea of how accurately the value has been estimated. A narrow CIindicates a more accurate value.
St Elsewhere Hospital (01/04/2012 - 30/09/2012) / Doc. Version 3.1 35

By Age
1 28 31 36 260
10
20
30
40
50
60
70
80
90
100
Aliv
e -
RO
SC
>20
min
utes
(%
)
0-15 16-64 65-74 75-84 85+
Age (years)
Your hospital NCAA
© NCAA 2013
St Elsewhere Hospital (01/04/2012 - 30/09/2012) / Doc. Version 3.1 36

Survival to hospital discharge
1 22 31 35 240
10
20
30
40
50
60
70
80
90
100S
urvi
val t
o ho
spita
l dis
char
ge (
%)
0-15 16-64 65-74 75-84 85+
Age (years)
Your hospital NCAA
© NCAA 2013
Favourable neurological outcome
0 22 31 35 240
10
20
30
40
50
60
70
80
90
100
Fav
oura
ble
neur
olog
ical
out
com
e (%
)
0-15 16-64 65-74 75-84 85+
Age (years)
Your hospital NCAA
© NCAA 2013
Please note: n = 1 individuals sedated on discharge from your hospital (excluded)n = 0 individuals alive, not sedated and missing CPC at discharge fromyour hospital (excluded)
St Elsewhere Hospital (01/04/2012 - 30/09/2012) / Doc. Version 3.1 37

By day of week/hour of day of 2222 call
50 34 13 250
10
20
30
40
50
60
70
80
90
100
Aliv
e -
RO
SC
>20
min
utes
(%
)
Weekday08:00-19:59
Weekday20:00-07:59
Weekend08:00-19:59
Weekend20:00-07:59
Day of week/hour of day of 2222 call
Your hospital NCAA
© NCAA 2013
St Elsewhere Hospital (01/04/2012 - 30/09/2012) / Doc. Version 3.1 38

Survival to hospital discharge
46 30 13 240
10
20
30
40
50
60
70
80
90
100S
urvi
val t
o ho
spita
l dis
char
ge (
%)
Weekday08:00-19:59
Weekday20:00-07:59
Weekend08:00-19:59
Weekend20:00-07:59
Day of week/hour of day of 2222 call
Your hospital NCAA
© NCAA 2013
Favourable neurological outcome
46 29 13 240
10
20
30
40
50
60
70
80
90
100
Fav
oura
ble
neur
olog
ical
out
com
e (%
)
Weekday08:00-19:59
Weekday20:00-07:59
Weekend08:00-19:59
Weekend20:00-07:59
Day of week/hour of day of 2222 call
Your hospital NCAA
© NCAA 2013
Please note: n = 1 individuals sedated on discharge from your hospital (excluded)n = 0 individuals alive, not sedated and missing CPC at discharge fromyour hospital (excluded)
St Elsewhere Hospital (01/04/2012 - 30/09/2012) / Doc. Version 3.1 39
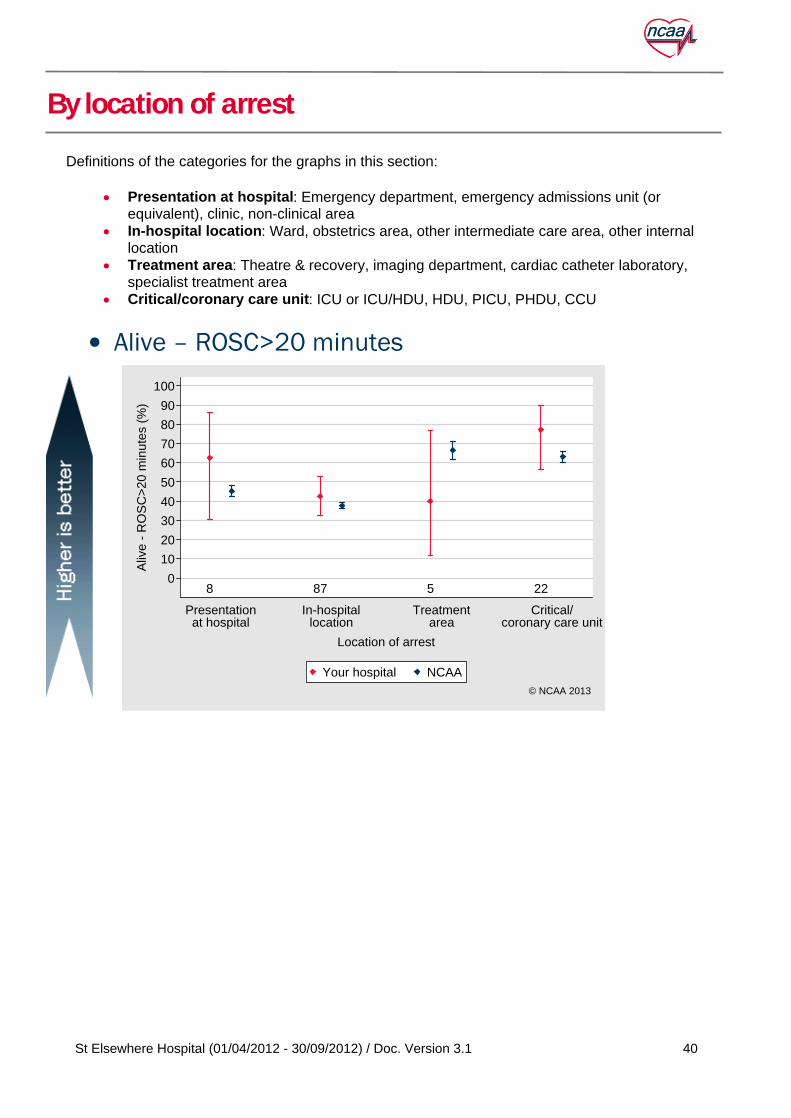
By location of arrest
Definitions of the categories for the graphs in this section:
Presentation at hospital: Emergency department, emergency admissions unit (orequivalent), clinic, non-clinical areaIn-hospital location: Ward, obstetrics area, other intermediate care area, other internallocationTreatment area: Theatre & recovery, imaging department, cardiac catheter laboratory,specialist treatment areaCritical/coronary care unit: ICU or ICU/HDU, HDU, PICU, PHDU, CCU
8 87 5 220
10
20
30
40
50
60
70
80
90
100
Aliv
e -
RO
SC
>20
min
utes
(%
)
Presentationat hospital
In-hospitallocation
Treatmentarea
Critical/coronary care unit
Location of arrest
Your hospital NCAA
© NCAA 2013
St Elsewhere Hospital (01/04/2012 - 30/09/2012) / Doc. Version 3.1 40

Survival to hospital discharge
8 84 5 160
10
20
30
40
50
60
70
80
90
100S
urvi
val t
o ho
spita
l dis
char
ge (
%)
Presentationat hospital
In-hospitallocation
Treatmentarea
Critical/coronary care unit
Location of arrest
Your hospital NCAA
© NCAA 2013
Favourable neurological outcome
8 84 5 150
10
20
30
40
50
60
70
80
90
100
Fav
oura
ble
neur
olog
ical
out
com
e (%
)
Presentationat hospital
In-hospitallocation
Treatmentarea
Critical/coronary care unit
Location of arrest
Your hospital NCAA
© NCAA 2013
Please note: n = 1 individuals sedated on discharge from your hospital (excluded)n = 0 individuals alive, not sedated and missing CPC at discharge fromyour hospital (excluded)
St Elsewhere Hospital (01/04/2012 - 30/09/2012) / Doc. Version 3.1 41

By presenting/first documented rhythm
16 9 31 570
10
20
30
40
50
60
70
80
90
100
Aliv
e -
RO
SC
>20
min
utes
(%
)
Shockable- VF
Shockable- VT
Non-shockable- asystole
Non-shockable- PEA
Presenting/first documented rhythm
Your hospital NCAA
© NCAA 2013
St Elsewhere Hospital (01/04/2012 - 30/09/2012) / Doc. Version 3.1 42

Survival to hospital discharge
12 5 30 570
10
20
30
40
50
60
70
80
90
100S
urvi
val t
o ho
spita
l dis
char
ge (
%)
Shockable- VF
Shockable- VT
Non-shockable- asystole
Non-shockable- PEA
Presenting/first documented rhythm
Your hospital NCAA
© NCAA 2013
Favourable neurological outcome
12 5 30 570
10
20
30
40
50
60
70
80
90
100
Fav
oura
ble
neur
olog
ical
out
com
e (%
)
Shockable- VF
Shockable- VT
Non-shockable- asystole
Non-shockable- PEA
Presenting/first documented rhythm
Your hospital NCAA
© NCAA 2013
Please note: n = 0 individuals sedated on discharge from your hospital (excluded)n = 0 individuals alive, not sedated and missing CPC at discharge fromyour hospital (excluded)
St Elsewhere Hospital (01/04/2012 - 30/09/2012) / Doc. Version 3.1 43

Suggested questions for local useHow does your hospital compare with all NCAA data in terms of age; day ofweek/hour of day of 2222 call; location of arrest; presenting/first documented rhythm,each outcome?How could these stratified data be used for planning Resuscitation Team responses?How could these stratified data be used for wider service planning at your hospital?
St Elsewhere Hospital (01/04/2012 - 30/09/2012) / Doc. Version 3.1 44
Comparative analyses7.
This section provides you with initial comparative analyses on resuscitation outcomes for your hospital.These are not risk adjusted. A multivariable risk model, required to make fair comparisons, is underdevelopment.
NCAA data for your hospital are compared with each participating hospital, for the period that this Reportcovers.
The outcomes included in this section are survival to hospital discharge (reported as a percentage ofindividuals), by:
shockable presenting/first documented rhythm; andnon-shockable presenting/first documented rhythm.
Graphical presentation
Data for your hospital are plotted on each graph in red, and data for other NCAA participating hospitals(for the period that this Report covers) are plotted in blue.
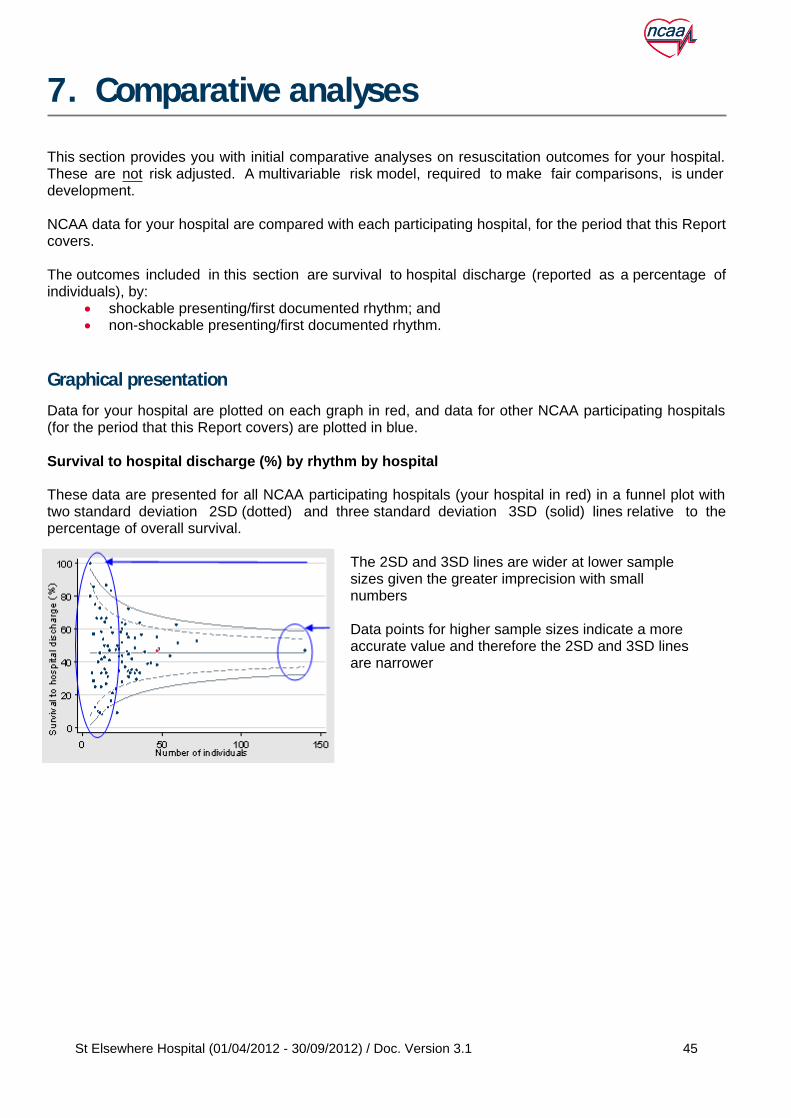
Survival to hospital discharge (%) by rhythm by hospital
These data are presented for all NCAA participating hospitals (your hospital in red) in a funnel plot withtwo standard deviation 2SD (dotted) and three standard deviation 3SD (solid) lines relative to thepercentage of overall survival.
The 2SD and 3SD lines are wider at lower samplesizes given the greater imprecision with smallnumbers
Data points for higher sample sizes indicate a moreaccurate value and therefore the 2SD and 3SD linesare narrower
St Elsewhere Hospital (01/04/2012 - 30/09/2012) / Doc. Version 3.1 45

Survival to hospital discharge by shockablepresenting/first documented rhythm
0
20
40
60
80
100S
urvi
val t
o ho
spita
l dis
char
geby
sho
ckab
le p
rese
ntin
g/fir
stdo
cum
ente
d rh
ythm
(%
)
0 10 20 30 40Number of individuals
Your hospital Other hospitals
© NCAA 2013
Survival to hospital discharge by non-shockablepresenting/first documented rhythm
0
20
40
60
80
100
Sur
viva
l to
hosp
ital d
isch
arge
by n
on-s
hock
able
pre
sent
ing/
first
docu
men
ted
rhyt
hm (
%)
0 50 100 150Number of individuals
Your hospital Other hospitals
© NCAA 2013
Please note: Outcomes on these graphs are not risk adjusted
St Elsewhere Hospital (01/04/2012 - 30/09/2012) / Doc. Version 3.1 46

Note that interpretation of these data is subject to:
the inclusion of all hospitals with data recorded for at least five individuals;an assumption that all hospitals are capturing data for presenting/first documented rhythm andoutcome at hospital discharge accurately
Clearly, presenting rhythm is not the only determinant of survival and, were other risk factors (e.g. age,etc.) not similar across hospitals, survival rates could vary even within shockable/non-shockable rhythms.It is for this reason that a multivariable statistical risk model is being developed
Suggested questions for local useHow do your outcomes compare with the other NCAA participating hospitals?What other factors (e.g. age, etc.) might be causing the variation seen?How might your hospital improve survival rates following cardiac arrests that fall underthe NCAA scope?Have quality improvement interventions at your hospital been successful?How could these comparative data be used for planning Resuscitation Teamresponses?How might you use these data to engage Clinicians, Managers, and Trust BoardMembers?
St Elsewhere Hospital (01/04/2012 - 30/09/2012) / Doc. Version 3.1 47

Comments on your NCAA Report8.
If you have any questions or comments about your NCAA Report, then please email the NCAA Team([email protected]).
St Elsewhere Hospital (01/04/2012 - 30/09/2012) / Doc. Version 3.1 48