nanometer focusing properties of fresnel zone plates ... · pdf filenanometer focusing...
TRANSCRIPT

Nanometer focusing properties of Fresnel zone plates described by dynamical diffraction theory
F. Pfeiffer and C. DavidPaul Scherrer Institut, CH-5232 Villigen, Switzerland
J. F. van der VeenPaul Scherrer Institut, CH-5232 Villigen, and ETH-Zürich, Switzerland
C. BergemannCavendish Laboratory, University of Cambridge, J. J. Thomson Avenue, Cambridge CB3 0HE, United Kingdom
�Received 10 February 2006; published 26 June 2006�
The x-ray focusing properties of linear Fresnel zone plates have been derived by solving the Helmholtzequation for the field propagating through the zones. We consider the imaging of a point object into the firstdiffraction order of a volume zone plate having its zones parallel to the optical axis. For plane wave illumi-nation, the focal spot size is limited by the same material-dependent but wavelength-independent value thataffects waveguide focusing. In marked contrast, for the one-to-one imaging condition, corresponding to specu-lar reflection of the x rays from the zone boundaries, the image is found to have a minimal spot size approxi-mately equal to the outermost zone width. Unlike x-ray waveguides, zone plates therefore do not appear topossess a fundamental limit to the smallest spot size to which they can focus.
DOI: 10.1103/PhysRevB.73.245331 PACS number�s�: 41.50.�h, 07.85.Qe, 61.10.�i
I. INTRODUCTION
At synchrotron radiation facilities worldwide, there are anincreasing number of research activities requiring hard x-raybeams of small spot size. While x-ray absorption, fluores-cence, and diffraction measurements at a third-generationsource can be typically performed using beams of microme-ter size, for specific applications one has already achievedapproximately 50 nm with refractive lenses,1,2 30–100 nmwith reflecting Kirkpatrick-Baez mirrors,3 typically25–40 nm with waveguides,4,5 down to 100 nm with Fresnelzone plates �FZPs�,6,7 and 30 nm with multilayer Lauelenses.8 For FZPs serving as an objective lens in a full-fieldsoft x-ray microscope, Chao et al. have recently achieved aresolution below 15 nm.9 The question arises: What is thetheoretical resolution limit for each of these devices? Ideallyone would like to resolve down to, e.g., 1 nm, and one haseven discussed the possibility of focusing the extremely bril-liant beam of a future fourth-generation source �an energy-recoverable LINAC or an x-ray free electron laser� to a spotof just a few atoms wide.10 This would make x-ray micros-copy, either in the full-field or the scanning mode, a truecompetitor of high-resolution electron microscopy, with theadvantages of a larger depth of field and a greater elementspecificity.
Previously we have analyzed the focusing properties oftapered x-ray waveguides, and we concluded that there is afundamental limit of 7–10 nm to the smallest achievablespot size, its exact value depending on the electron densityand the geometry of the confining material.11 The focusinglimit arises from a smearing of the confined wave functionfor very small waveguide apertures over a length scale ofWc=� /2�c, with �c the critical angle for total reflection fromthe confining walls. Here, �c has the physical meaning of anumerical aperture �NA� of the focusing device. We conjec-tured that the same focusing limit also applies to other x-rayoptics such as refractive lenses and Fresnel zone plates
�FZPs�. A recent theoretical analysis of refractive lenses,however, revealed that although this is true for a single lens,a series of such lenses, whose aperture is adiabaticallymatched to the converging beam size, can focus well belowthe theoretical limit for waveguides, corresponding to amuch larger NA than is given by �c.
12 As FZPs can be re-garded as a set of coupled waveguides of varying width, theymay exhibit a similar delocalization of the wave function inthe outer zones, if the latter become as small as �Wc. Towhat extent this sets a limit to the focus size or the spatialresolution achievable with FZPs has not yet been investi-gated.
Here we report on the focusing properties of linear zoneplates in the high-resolution limit by numerically solving theparabolic wave equation.13 We consider incident plane wavesas well as cylindrical waves emerging from an on-axis linesource oriented parallel to the FZP zones at finite distance,then propagate the waves through the volume zone plate, andfinally propagate them through the free image space. Previ-ous authors derived the focusing properties of volume-FZPsby use of a dynamical coupled-wave theory, assuming thezone width to be essentially constant over a small area of theFZP.14,15 The coupled wave theory predicts the amplitudeand phase of the wavefield as a function of zone number, andone may reconstruct the image by applying the Huygens-Fresnel principle to the secondary waves emitted from theFZP exit. The coupled wave theory shows that the diffractionefficiency of the FZP in a given order generally is stronglydependent on the zone height and the local Bragg condition,i.e., on the local tilt angle of the zones with respect to the in–and outgoing rays. Moreover, a decreasing local diffractionefficiency for the outer zones results in a restricted NA andtherefore in a lower resolution �larger spot size�. Coupledwave theory has been used for optimizing the diffractionefficiency of zone plates intended as objective lenses in full-field x-ray microscopes.15,16 The adverse effects of zoneroughness and fuzziness on the focusing size have been in-
PHYSICAL REVIEW B 73, 245331 �2006�
1098-0121/2006/73�24�/245331�10� ©2006 The American Physical Society245331-1
vestigated by numerical solution of the wave equation.17
We present a method of propagating wave functionsthrough linear FZPs which is based on finding the eigenstatesand energy eigenvalues for the wave functions within theentire array of potential wells that form the zone plate. Theassumption of a locally constant zone width as in coupledwave theory is not made, but for ease of computation theplanes of the zones are assumed to be lying parallel to theoptical axis. The focusing limits are explored for incidentwavefronts emerging from on-axis line sources at variousdistances.
II. THEORY OF THE PROPAGATION OF X RAYSTHROUGH ZONE PLATES
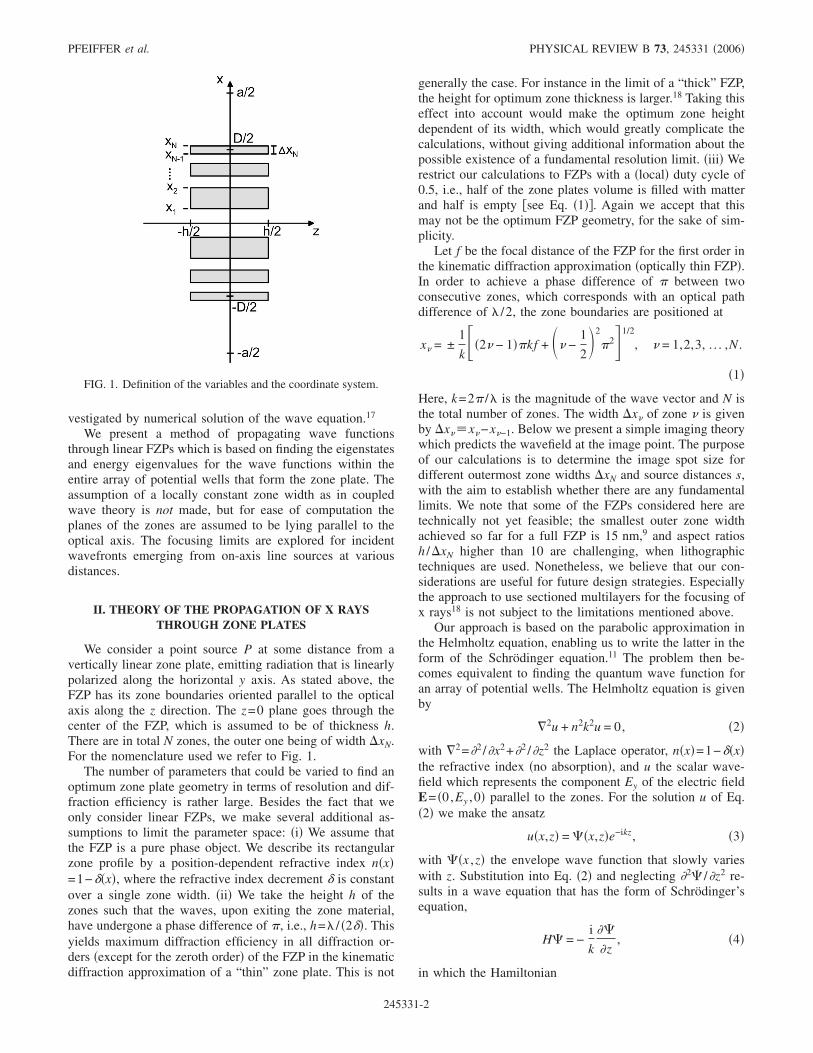
We consider a point source P at some distance from avertically linear zone plate, emitting radiation that is linearlypolarized along the horizontal y axis. As stated above, theFZP has its zone boundaries oriented parallel to the opticalaxis along the z direction. The z=0 plane goes through thecenter of the FZP, which is assumed to be of thickness h.There are in total N zones, the outer one being of width �xN.For the nomenclature used we refer to Fig. 1.
The number of parameters that could be varied to find anoptimum zone plate geometry in terms of resolution and dif-fraction efficiency is rather large. Besides the fact that weonly consider linear FZPs, we make several additional as-sumptions to limit the parameter space: �i� We assume thatthe FZP is a pure phase object. We describe its rectangularzone profile by a position-dependent refractive index n�x�=1−��x�, where the refractive index decrement � is constantover a single zone width. �ii� We take the height h of thezones such that the waves, upon exiting the zone material,have undergone a phase difference of �, i.e., h=� / �2��. Thisyields maximum diffraction efficiency in all diffraction or-ders �except for the zeroth order� of the FZP in the kinematicdiffraction approximation of a “thin” zone plate. This is not
generally the case. For instance in the limit of a “thick” FZP,the height for optimum zone thickness is larger.18 Taking thiseffect into account would make the optimum zone heightdependent of its width, which would greatly complicate thecalculations, without giving additional information about thepossible existence of a fundamental resolution limit. �iii� Werestrict our calculations to FZPs with a �local� duty cycle of0.5, i.e., half of the zone plates volume is filled with matterand half is empty �see Eq. �1��. Again we accept that thismay not be the optimum FZP geometry, for the sake of sim-plicity.
Let f be the focal distance of the FZP for the first order inthe kinematic diffraction approximation �optically thin FZP�.In order to achieve a phase difference of � between twoconsecutive zones, which corresponds with an optical pathdifference of � /2, the zone boundaries are positioned at
x� = ±1
k��2� − 1��kf + �� −
1
2�2
�21/2
, � = 1,2,3, . . . ,N .
�1�
Here, k=2� /� is the magnitude of the wave vector and N isthe total number of zones. The width �x� of zone � is givenby �x�x�−x�−1. Below we present a simple imaging theorywhich predicts the wavefield at the image point. The purposeof our calculations is to determine the image spot size fordifferent outermost zone widths �xN and source distances s,with the aim to establish whether there are any fundamentallimits. We note that some of the FZPs considered here aretechnically not yet feasible; the smallest outer zone widthachieved so far for a full FZP is 15 nm,9 and aspect ratiosh /�xN higher than 10 are challenging, when lithographictechniques are used. Nonetheless, we believe that our con-siderations are useful for future design strategies. Especiallythe approach to use sectioned multilayers for the focusing ofx rays18 is not subject to the limitations mentioned above.
Our approach is based on the parabolic approximation inthe Helmholtz equation, enabling us to write the latter in theform of the Schrödinger equation.11 The problem then be-comes equivalent to finding the quantum wave function foran array of potential wells. The Helmholtz equation is givenby
�2u + n2k2u = 0, �2�
with �2=�2 /�x2+�2 /�z2 the Laplace operator, n�x�=1−��x�the refractive index �no absorption�, and u the scalar wave-field which represents the component Ey of the electric fieldE= �0,Ey ,0� parallel to the zones. For the solution u of Eq.�2� we make the ansatz
u�x,z� = �x,z�e−ikz, �3�
with �x ,z� the envelope wave function that slowly varieswith z. Substitution into Eq. �2� and neglecting �2 /�z2 re-sults in a wave equation that has the form of Schrödinger’sequation,
H = −i
k
�
�z, �4�
in which the Hamiltonian
FIG. 1. Definition of the variables and the coordinate system.
PFEIFFER et al. PHYSICAL REVIEW B 73, 245331 �2006�
245331-2

H H0 + V�x� −1
2k2
�2
�x2 + ��x� �5�
consists of a free-space kinetic energy contribution H0 and apotential term V�x�. In Eq. �4�, k and z replace 1/ and timet, respectively, and the mass m=1.
To neglect the �2 /�z2 term is known as the slowly vary-ing envelope approximation;19 this is frequently used in thebeam propagation method. The approximation is known tobe accurate if the variations in the refractive index are small��n /n�1� and if the angular spectrum of the field is narrow�kx /k�1�. Both conditions are generally met in x-ray optics.
The z independence of n�x� inside the FZP enables thedetermination of the eigenstates of the Hamiltonian in Eq.�5� within the entire zone plate in a straightforward manner.By separation of variables,
�x,z� = eikEz��x� , �6�
we obtain the time-independent Schrödinger equation
H� = E� . �7�
Let ��n� be the eigenfunctions of H and �En� the correspond-ing eigenvalues
H�n = En�n. �8�
The incoming wavefield x �in�n�x ,z=−h /2� is decom-posed in eigenfunctions
�in� = �n
�n�in���n� . �9�
After propagation within the zone plate over its thickness hthe wave function has evolved to the exit wavefield x �ex�ex�x ,z=h /2�, with
�ex� = �n
�n�in�eikEnh��n� . �10�
Behind the FZP, the field propagates as a free wave. Let ��n�and �En
0� be the eigenstates and the corresponding eigenval-ues of the free-space Hamiltonian H0, satisfying
H0�n = En0�n. �11�
At a distance z0 behind the FZP, the wave function hasevolved into x �z0
��x ,z=z0�, with
�z0� = �
m
�m�ex�eikEm0 �z−h/2���m� . �12�
The image is found at the distance zmax at which��x=0,z��2 has its maximum. The limiting value of thewidth, i.e., the resolution, is determined by the highest spa-tial frequency transmitted by the FZP.
As seen in the Appendix, the eigenstates ��n� outside theFZP are standing waves with wave vector qn= �2n−1�� /a,with a being the width of the interval over which the eigen-states of H0 are defined �Eqs. �A2� and �A4��. It is thereforeuseful to view the exit wave in Fourier space and define theFourier amplitude spectrum
�ex�qn�� � �n�z0�� = � �n�ex�� . �13�
The cutoff wave vector q beyond which ex�qn� falls offdetermines the resolution.
The energy diffracted into the first order equals
P = �−xw/2
+xw/2
��x,zmax��2dx , �14�
where the integration interval �−xw /2 , +xw /2� should be cho-sen to be large enough to include the majority of intensitydiffracted into the first order without significant contributionsof the zeroth, negative, or higher positive diffractionorders.20 Normalizing to the energy passing through the FZPwidth,
P0 = �−D/2
+D/2
�in�x��2dx , �15�
we obtain the diffraction efficiency in the first order,
=P
P0. �16�
This value is to be compared with =4/�2=0.405 for kine-matic diffraction into the first order from a square-wave,�-phase shifting profile in the absence of absorption.21 How-ever, it should be noted that efficiencies approaching unityare possible in the dynamical limit for zone plates of optimalgeometry, when the Bragg condition is fulfilled.
III. NUMERICAL IMPLEMENTATION AND RESULTS
Wavefields have been propagated through the FZPs listedin Table I for two imaging geometries �Fig. 2�: �a� a planeincident wave from a line source at infinite distance z→−�and �b� a cylindrical wave emerging from a source located atthe position z=−2f . According to the lens formula, illumina-tion by plane waves should yield an image at the focal dis-tance f behind the FZP, whereas in the second case thesource is imaged one-to-one at z=2f . In addition, the imag-ing properties of zone plate FZP-3 in Table I have been ana-lyzed for a wide range of source distances.
In each wavefield calculation, the number of zones N andthe focal length f of the FZP serve as input parameters. FromEq. �1� one obtains the corresponding aperture D�xN
+xN−1� and outermost zone width �xN, see Table I.For both geometries in Fig. 2, which we label as f and 2f ,
we compare the calculated full widths at half maximum�FWHM� of the images, wf and w2f, with the values expectedon the basis of kinematic diffraction from the FZP aperture.Diffraction from a linear aperture causes the image of a pointsource to broaden according to a �sinc�2 intensitydistribution.22 For an image distance z the FWHM of thecentral peak of such a distribution is given by
w = 0.89�z
D, �17�
with D /q being twice the numerical aperture NA. If the FZPis illuminated by a plane wave, z= f . Using Eq. �1� and ne-
NANOMETER FOCUSING PROPERTIES OF FRESNEL¼ PHYSICAL REVIEW B 73, 245331 �2006�
245331-3
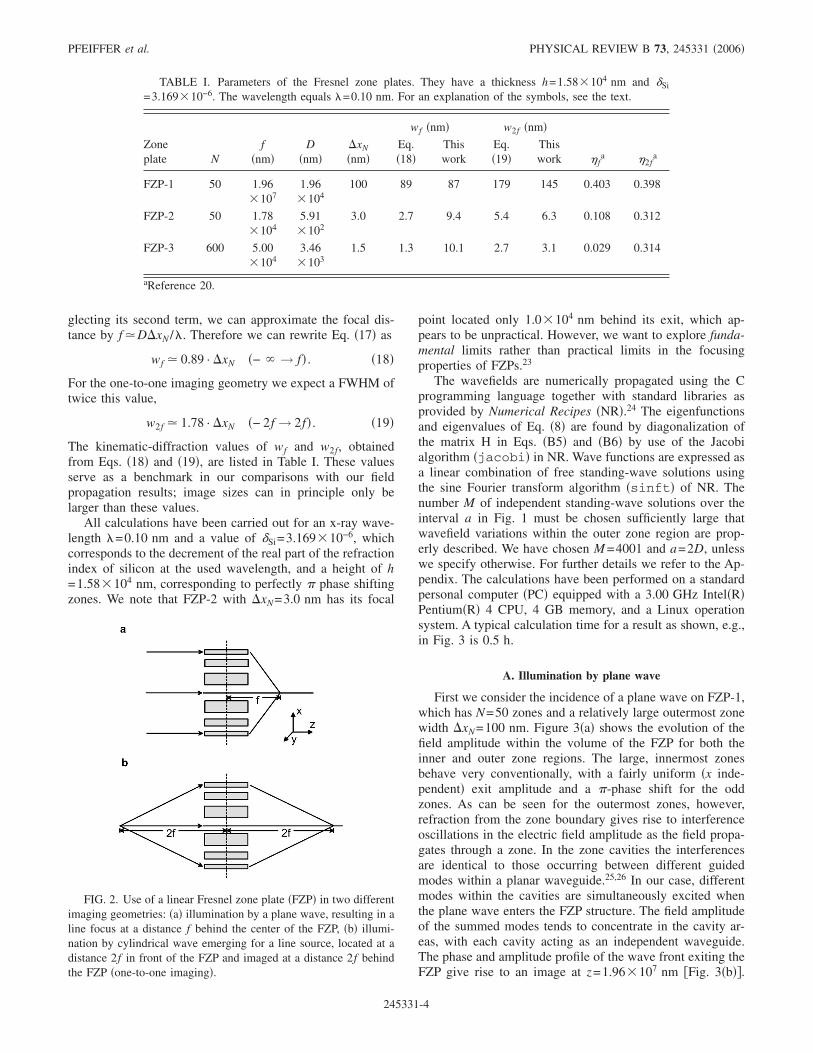
glecting its second term, we can approximate the focal dis-tance by f �D�xN /�. Therefore we can rewrite Eq. �17� as
wf � 0.89 · �xN �− � → f� . �18�
For the one-to-one imaging geometry we expect a FWHM oftwice this value,
w2f � 1.78 · �xN �− 2f → 2f� . �19�
The kinematic-diffraction values of wf and w2f, obtainedfrom Eqs. �18� and �19�, are listed in Table I. These valuesserve as a benchmark in our comparisons with our fieldpropagation results; image sizes can in principle only belarger than these values.
All calculations have been carried out for an x-ray wave-length �=0.10 nm and a value of �Si=3.169�10−6, whichcorresponds to the decrement of the real part of the refractionindex of silicon at the used wavelength, and a height of h=1.58�104 nm, corresponding to perfectly � phase shiftingzones. We note that FZP-2 with �xN=3.0 nm has its focal
point located only 1.0�104 nm behind its exit, which ap-pears to be unpractical. However, we want to explore funda-mental limits rather than practical limits in the focusingproperties of FZPs.23
The wavefields are numerically propagated using the Cprogramming language together with standard libraries asprovided by Numerical Recipes �NR�.24 The eigenfunctionsand eigenvalues of Eq. �8� are found by diagonalization ofthe matrix H in Eqs. �B5� and �B6� by use of the Jacobialgorithm �jacobi� in NR. Wave functions are expressed asa linear combination of free standing-wave solutions usingthe sine Fourier transform algorithm �sinft� of NR. Thenumber M of independent standing-wave solutions over theinterval a in Fig. 1 must be chosen sufficiently large thatwavefield variations within the outer zone region are prop-erly described. We have chosen M =4001 and a=2D, unlesswe specify otherwise. For further details we refer to the Ap-pendix. The calculations have been performed on a standardpersonal computer �PC� equipped with a 3.00 GHz Intel�R�Pentium�R� 4 CPU, 4 GB memory, and a Linux operationsystem. A typical calculation time for a result as shown, e.g.,in Fig. 3 is 0.5 h.
A. Illumination by plane wave
First we consider the incidence of a plane wave on FZP-1,which has N=50 zones and a relatively large outermost zonewidth �xN=100 nm. Figure 3�a� shows the evolution of thefield amplitude within the volume of the FZP for both theinner and outer zone regions. The large, innermost zonesbehave very conventionally, with a fairly uniform �x inde-pendent� exit amplitude and a �-phase shift for the oddzones. As can be seen for the outermost zones, however,refraction from the zone boundary gives rise to interferenceoscillations in the electric field amplitude as the field propa-gates through a zone. In the zone cavities the interferencesare identical to those occurring between different guidedmodes within a planar waveguide.25,26 In our case, differentmodes within the cavities are simultaneously excited whenthe plane wave enters the FZP structure. The field amplitudeof the summed modes tends to concentrate in the cavity ar-eas, with each cavity acting as an independent waveguide.The phase and amplitude profile of the wave front exiting theFZP give rise to an image at z=1.96�107 nm �Fig. 3�b��.
TABLE I. Parameters of the Fresnel zone plates. They have a thickness h=1.58�104 nm and �Si
=3.169�10−6. The wavelength equals �=0.10 nm. For an explanation of the symbols, see the text.
wf �nm� w2f �nm�Zoneplate N
f�nm�
D�nm�
�xN
�nm�Eq.�18�
Thiswork
Eq.�19�
Thiswork f
a 2fa
FZP-1 50 1.96�107
1.96�104
100 89 87 179 145 0.403 0.398
FZP-2 50 1.78�104
5.91�102
3.0 2.7 9.4 5.4 6.3 0.108 0.312
FZP-3 600 5.00�104
3.46�103
1.5 1.3 10.1 2.7 3.1 0.029 0.314
aReference 20.
FIG. 2. Use of a linear Fresnel zone plate �FZP� in two differentimaging geometries: �a� illumination by a plane wave, resulting in aline focus at a distance f behind the center of the FZP, �b� illumi-nation by cylindrical wave emerging for a line source, located at adistance 2f in front of the FZP and imaged at a distance 2f behindthe FZP �one-to-one imaging�.
PFEIFFER et al. PHYSICAL REVIEW B 73, 245331 �2006�
245331-4
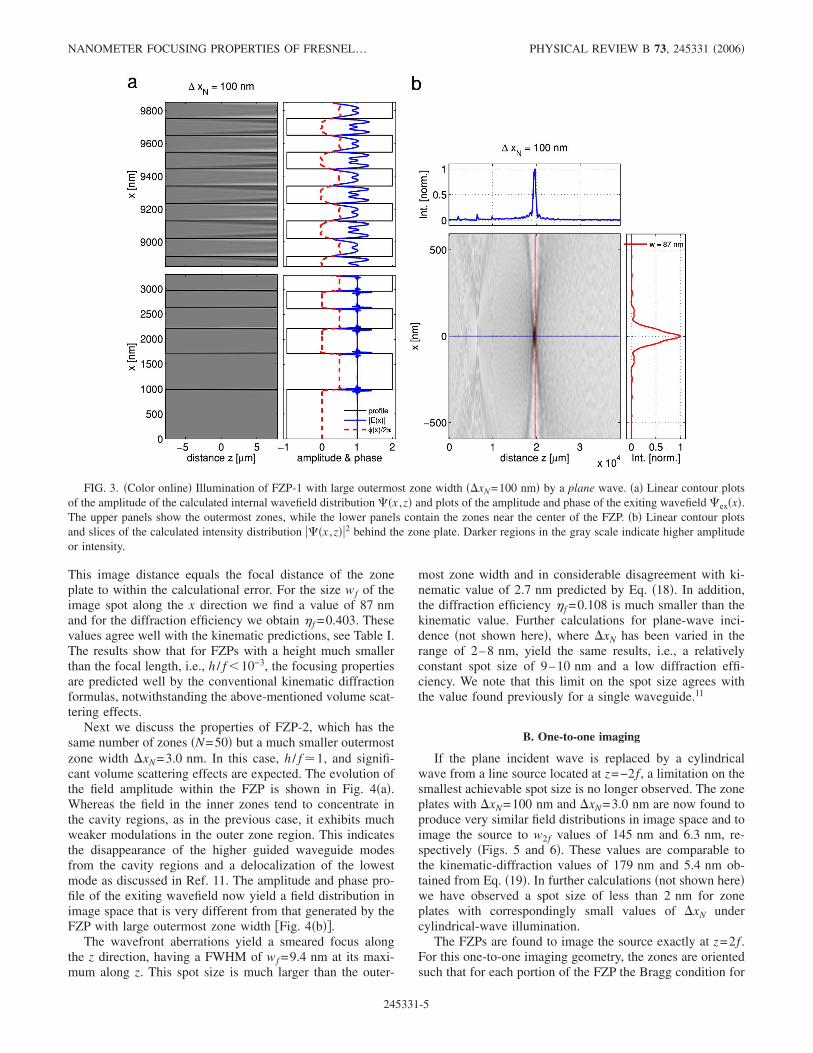
This image distance equals the focal distance of the zoneplate to within the calculational error. For the size wf of theimage spot along the x direction we find a value of 87 nmand for the diffraction efficiency we obtain f =0.403. Thesevalues agree well with the kinematic predictions, see Table I.The results show that for FZPs with a height much smallerthan the focal length, i.e., h / f �10−3, the focusing propertiesare predicted well by the conventional kinematic diffractionformulas, notwithstanding the above-mentioned volume scat-tering effects.
Next we discuss the properties of FZP-2, which has thesame number of zones �N=50� but a much smaller outermostzone width �xN=3.0 nm. In this case, h / f �1, and signifi-cant volume scattering effects are expected. The evolution ofthe field amplitude within the FZP is shown in Fig. 4�a�.Whereas the field in the inner zones tend to concentrate inthe cavity regions, as in the previous case, it exhibits muchweaker modulations in the outer zone region. This indicatesthe disappearance of the higher guided waveguide modesfrom the cavity regions and a delocalization of the lowestmode as discussed in Ref. 11. The amplitude and phase pro-file of the exiting wavefield now yield a field distribution inimage space that is very different from that generated by theFZP with large outermost zone width �Fig. 4�b��.
The wavefront aberrations yield a smeared focus alongthe z direction, having a FWHM of wf =9.4 nm at its maxi-mum along z. This spot size is much larger than the outer-
most zone width and in considerable disagreement with ki-nematic value of 2.7 nm predicted by Eq. �18�. In addition,the diffraction efficiency f =0.108 is much smaller than thekinematic value. Further calculations for plane-wave inci-dence �not shown here�, where �xN has been varied in therange of 2–8 nm, yield the same results, i.e., a relativelyconstant spot size of 9–10 nm and a low diffraction effi-ciency. We note that this limit on the spot size agrees withthe value found previously for a single waveguide.11
B. One-to-one imaging
If the plane incident wave is replaced by a cylindricalwave from a line source located at z=−2f , a limitation on thesmallest achievable spot size is no longer observed. The zoneplates with �xN=100 nm and �xN=3.0 nm are now found toproduce very similar field distributions in image space and toimage the source to w2f values of 145 nm and 6.3 nm, re-spectively �Figs. 5 and 6�. These values are comparable tothe kinematic-diffraction values of 179 nm and 5.4 nm ob-tained from Eq. �19�. In further calculations �not shown here�we have observed a spot size of less than 2 nm for zoneplates with correspondingly small values of �xN undercylindrical-wave illumination.
The FZPs are found to image the source exactly at z=2f .For this one-to-one imaging geometry, the zones are orientedsuch that for each portion of the FZP the Bragg condition for
FIG. 3. �Color online� Illumination of FZP-1 with large outermost zone width ��xN=100 nm� by a plane wave. �a� Linear contour plotsof the amplitude of the calculated internal wavefield distribution �x ,z� and plots of the amplitude and phase of the exiting wavefield ex�x�.The upper panels show the outermost zones, while the lower panels contain the zones near the center of the FZP. �b� Linear contour plotsand slices of the calculated intensity distribution ��x ,z��2 behind the zone plate. Darker regions in the gray scale indicate higher amplitudeor intensity.
NANOMETER FOCUSING PROPERTIES OF FRESNEL¼ PHYSICAL REVIEW B 73, 245331 �2006�
245331-5

diffraction into the first order is fulfilled. This results notonly in an extremely small spot size, but also in a muchhigher diffraction efficiency 2f in the first order than for theoff-Bragg case �see Table I�.
Although the FZPs with �xN=100 nm and �xN=3.0 nmproduce similar field distributions in the image space, thefield distributions within their volumes are markedly differ-ent. This is related to the very different angular apertures ofthe FZP-1 and FZP-2 in comparison to the critical angle �c
=�2�Si=2.518�10−3 rad for total reflection from Si. SinceD / �4f� equals 2.50�10−4 and 8.85�10−3 rad, respectively,x rays are incident at an angle smaller than �c with respect toall zone boundaries in the former case and only with respectto a few inner zones in the latter case. Hence, a substantialfraction of the populated waveguide modes in the outer zoneregion is of the guided type in FZP-1 with �xN=100 nm andof the radiative type in FZP-2 with �xN=3.0 nm.
C. Variable imaging distance
With the calculations presented so far, we have exploredthe two extreme cases of how FZPs can be used as opticalelements. Since we have found a considerable difference inthe corresponding focusing properties, we will now discussthe focusing limitations of FZPs in cases where the FZP isused as a �de�magnifying optical element, i.e., as a lens.Therefore we investigated the performance of a volume FZP
for a line source located at a distance −� �z�−f . The re-sulting image size then is a direct measure for the resolutionwhich would be achieved if a FZP is used as, e.g., an objec-tive lens in an x-ray microscope. Figure 7 displays the spotsize w �FWHM� in the image plane as a function of thedistance of the line source from the FZP center for the zoneplate FZP-3 which has an outermost zone width of �xN=1.5 nm. The image size is found to be smallest when thesource is located at a distance z=−2f from the FZP center,which corresponds to one-to-one imaging and Bragg reflec-tion from the zones into the first order of the FZP. In accor-dance with what has been found above for FZPs with anoutermost zone width considerably smaller than 10 nm, weobserve a minimal focus size of w2f =3.1 nm, which is ap-proximately equal to the kinematic-diffraction value of2.7 nm. With increasing source distance, for z�−2f , the im-age broadens and approaches the limit of the plane-wavecase, i.e., �10 nm. Equally, a broadening of the image size isobserved if the source distance is decreased to values of−2f �z�−h /2.
D. Fourier spectrum
It is quite illuminating to look at the Fourier spectrum�ex�qn�� of the exit wave, given by Eq. �13� and shown inFig. 8 for a few configurations. In the Bragg geometry, thecutoff frequency q /2� is given by the inverse of the outer-
FIG. 4. �Color online� Illumination of FZP-2 with small outermost zone width ��xN=3.0 nm� by a plane wave. �a� Linear contour plotsof the amplitude of the calculated internal wavefield distribution �x ,z� and plots of the amplitude and phase of the exiting wavefield ex�x�.The upper panels show the outermost zones, while the lower panels contain the zones near the center of the FZP. �b� Linear contour plotsand slices of the calculated intensity distribution ��x ,z��2 behind the Fresnel zone plate. Darker regions in the gray scale indicate higheramplitude or intensity.
PFEIFFER et al. PHYSICAL REVIEW B 73, 245331 �2006�
245331-6

most zone width, whereas in the off-Bragg case a muchlower cut-off frequency is found for zone plates with smalloutermost zone width. The size difference between FZP-1and FZP-2 can be brought out by plotting the Fourier spectraas a function of the normalized wave vector qna. For theBragg case the curves for FZP-1 and the curve for FZP-2 arefound to have identical shapes up over a large interval of qna.In an off-Bragg geometry the highest spatial frequencies arefiltered out by FZP-2. This is equivalent to the statement thatthe local diffraction efficiency decreases in the outer zoneregion to small values, resulting in a reduced numerical ap-erture and a correspondingly larger image size.
Rewriting Eq. �13� with the help of �10� as
�20�
we can see that the Fourier components of the exit wave arethe Fourier components of the incoming wave, “scrambled”by the mixing matrix M. This matrix is an intrinsic propertyof the optical device, not a property of the imaging geometryconsidered.
Written in the basis set of Fourier states, the mixing ma-trix is diagonally dominant, with off-diagonal components upto a distance �k�� from the diagonal. In the off-Bragg ge-
ometry, in particular for plane wave illumination, the incom-ing wave profile has very low Fourier components only, and�ex�qn�� itself cuts off beyond �k��, giving a broad focus.In the Bragg geometry, the incoming profile already has theFourier components needed for a much sharper focus, andthe mixing matrix essentially rearranges the phases of theFourier components to construct a converging wave front atthe exit.
IV. CONCLUSIONS
In contrast to x-ray waveguides, Fresnel zone plates pos-sess no fundamental limit to the smallest spot size to whichthey can focus, provided that they are operated in Bragggeometry for the diffraction order considered. We have dem-onstrated this for a zone plate with its zones parallel to theoptical axis, for which the Bragg geometry in the first dif-fraction order corresponds with one-to-one imaging withequal distances �2f� of source and image from the FZP cen-ter.
We conclude that for x-ray microscopy applications,where point to point imaging with unequal distances of thesource and image plane from the FZP center is desired, aFZP with its zone boundaries lying parallel to the optical axiswill be limited in resolution. Although not proven explicitly,
FIG. 5. �Color online� Illumination of FZP-1 with large outermost zone width ��xN=100 nm� by a cylindrical wave from a line sourceat z=−2f . �a� Linear contour plots of the amplitude of the calculated internal wavefield distribution �x ,z� and plots of the amplitude andphase of the exiting wavefield ex�x�. The upper panels show the outermost zones, while the lower panels contain the zones near the centerof the FZP. Note that the phase profile has been shifted horizontally in the upper right panel to allow for a better representation. �b� Linearcontour plots and slices of the calculated intensity distribution ��x ,z��2 behind the Fresnel zone plate. Darker regions in the gray scaleindicate higher amplitude or intensity.
NANOMETER FOCUSING PROPERTIES OF FRESNEL¼ PHYSICAL REVIEW B 73, 245331 �2006�
245331-7

the results of our calculation strongly suggest that tilting thezones to the correct Bragg angle, as discussed in Ref. 8, canovercome this fundamental limitation. However, whether itwill be possible to image the whole source plane with aresolution corresponding to the resolution of a FZP illumi-nated by an on-axis point source remains to be shown explic-itly.
Note added in proof. After submission of our manuscript,Kang et al. have published a paper that also discusses thefocusing limits of Fresnel zone plates �H. C. Kang et al.,Phys. Rev. Lett. 96, 127401 �2006��. Their mathematical ap-proach and the scope of their discussion are different, butthey reach broadly similar conclusions regarding the impor-tance of the Bragg condition.
ACKNOWLEDGMENTS
We are indebted to H.H. Solak for inspiring discussions.C.B. acknowledges the support of the Royal Society.
APPENDIX A: EIGENFUNCTIONS AND EIGENVALUESOF FREE-SPACE HAMILTONIAN H0
The eigenfunctions and eigenvalues of Eq. �11� arereadily found. Using Eq. �5� with V=0, we have to considerthe solutions of
FIG. 6. �Color online� Illumination of FZP-2 with small outermost zone width ��xN=3 nm� by a cylindrical wave from a line source atz=−2f . �a� Linear contour plots of the amplitude of the calculated internal wavefield distribution �x ,z� and plots of the amplitude and phaseof the exiting wavefield ex�x�. The upper panels show the outermost zones, while the lower panels contain the zones near the center of theFZP. Note that the phase profile has been shifted horizontally in the upper right panel to allow for a better representation. �b� Linear contourplots and slices of the calculated intensity distribution ��x ,z��2 behind the Fresnel zone plate. Darker regions in the gray scale indicatehigher amplitude or intensity.
FIG. 7. �Color online� FWHM image size as a function of thedistance of the line source from the FZP center in units of f , for aFZP with an outermost zone width of �xN=1.5 nm �f =5.0�104 nm�. The following other parameters have been used in thecalculations: N=600, M =6001, and a=2.5D.
PFEIFFER et al. PHYSICAL REVIEW B 73, 245331 �2006�
245331-8

−1
2k2
�2�
�x2 = E0� �A1�
satisfying the boundary condition that � is zero at both endsof the interval x� �−a /2 , a /2� �see Fig. 1�. Restricting our-selves to even functions around x=0, we find the followingnormalized standing wave solutions:
�n�x� =�2
acos�qnx�, n = 1,2, ... �A2�
and the corresponding eigenvalues
En0 =
qn2
2k2 �A3�
with
qn �2n − 1��
a�A4�
the wave vector associated with standing wave n. The eigen-functions �n form an orthonormal set,
�n��m� = �nm, �A5�
with �nm as the Kronecker delta.
APPENDIX B: EIGENFUNCTIONS AND EIGENVALUESOF HAMILTONIAN H
The eigenfunctions and eigenvalues of Eq. �7� are deter-mined by expanding ��� in the known eigenfunctions ���n��of H0,
��� = �n
cn��n� , �B1�
with
cn �n��� . �B2�
We want to express the Hamiltonian on the basis of the Fou-rier states ���n��. The Hamiltonian matrix element of the po-tential term is
Vkn �k�V��n� =2
a�
−a/2
a/2
cos qkx cos qnx · ��x�dx �B3�
while the H0 matrix elements are of course simply En0�kn,
since H0 is already diagonal in Fourier space.For the refractive index profile ��x� shown in Fig. 1 the
integral for Vkn can be performed analytically,
Vkn = � · ��=1
N/2 � sin�2�k − n��x2�/a��k − n��
−sin�2�k − n��x2�−1/a�
�k − n��
+sin�2�k + n − 1��x2�/a�
�k + n − 1��
−sin�2�k + n − 1��x2�−1/a�
�k + n − 1�� � , �B4�
where for the diagonal elements Vnn the first two terms in thesummation reduce to 2��x2�−x2�−1� /a. N in the upper limitof the summation equals the number of zones, which is takento be an even number.
In matrix notation on the basis of Fourier states we thenhave
Hc = Ec , �B5�
with
FIG. 8. �Color online� Comparison of the normalized Fourier amplitude spectrum �ex�qna�� of FZP-1 and FZP-2 for �a� plane waveillumination and �b� the one-to-one imaging geometry as a function of the normalized wave vector qna.
NANOMETER FOCUSING PROPERTIES OF FRESNEL¼ PHYSICAL REVIEW B 73, 245331 �2006�
245331-9

H =�E1
0 + V11 V12 V13 ¯ ¯ V1M
V21 E20 + V22 V23 ¯ ¯ V2M
V31 V32 � �� �
VM−1,1 ¯ VM−1,M
VM,1 VM,2 ¯ ¯ VM,M−1 EM0 + VMM
� ,
c =�c1
c2
��
cM−1
cM
� . �B6�
For computational reasons we can of course only considerfinite matrices, cut off beyond the Fourier component withwave vector qM. The eigenfunctions and eigenvalues of Hare found by diagonalizing the matrix. Because H is real andsymmetric, its eigenvalues are real and its eigenfunctions areorthogonal. The dimension M ��N� of the matrix has tobeen chosen such that the maximum spatial frequency of theeigenfunctions is significantly larger than the reciprocal ofthe outer zone width. Typically, M is in the range of 2000–5000, while N can be equal up to a few hundred. In order toavoid that the sine functions in Eq. �B4� would have to benumerically evaluated �108 times, we exploit the fact that His symmetric and that for a single summation term in Eq.�B4� the first two sine terms are constant along a co-diagonalof H and the latter two terms are constant along an antidi-agonal. This speeds up the matrix initialization by typically afactor of �103.
1 C. G. Schroer, M. Kuhlmann, U. T. Hunger, T. F. Günzler, O.Kurapova, S. Feste, F. Frehse, B. Lengeler, M. Drakopoulos, A.Somogyi, A. S. Simionovici, A. Snigirev, I. Snigireva, C. Schug,and W. H. Schröder, Appl. Phys. Lett. 82, 1485 �2003�.
2 C. G. Schroer, O. Kurapova, J. Patommel, P. Boye, J. Feldkamp,B. Lengeler, M. Burghammer, C. Riekel, L. Vincze, A. van derHart, and M. Küchler, Appl. Phys. Lett. 87, 124103-1 �2005�.
3 K. Yamauchi, K. Yamamura, H. Mimura, Y. Sano, A. Saito, A.Souvorov, M. Yabashi, K. Tamasaku, T. Ishikawa, and Y. Mori,J. Synchrotron Radiat. 9, 313 �2002�.
4 M. J. Zwanenburg, J. H. H. Bongaerts, J. F. Peters, D. Riese, andJ. F. van der Veen, Physica B 283, 285 �2000�.
5 F. Pfeiffer, C. David, M. Burghammer, C. Riekel, and T. Salditt,Science 297, 230 �2002�.
6 C. David, T. Weitkamp, B. Nöhammer, and J. F. van der Veen,Spectrochim. Acta, Part B 59, 1505 �2004�.
7 B. Nöhammer, C. David, M. Burghammer, and C. Riekel, Appl.Phys. Lett. 86, 163804 �2005�.
8 J. Maser, Proc. SPIE 5539, 185 �2004�.9 W. Chao, B. D. Harteneck, J. A. Liddle, E. H. Anderson, and D. T.
Attwood, Nature �London� 435, 1210 �2005�.10 D. H. Bilderback and R. Huang, AIP Conf. Proc. 705, 1271
�2004�.11 C. Bergemann, H. Keymeulen, and J. F. van der Veen, Phys. Rev.
Lett. 91, 204801 �2003�.12 C. G. Schroer and B. Lengeler, Phys. Rev. Lett. 94, 054802
�2005�.13 Y. V. Kopylov, A. V. Popov, and A. V. Vinogradov, Opt. Com-
mun. 118, 619 �1995�.14 J. Maser and G. Schmahl, Opt. Commun. 89, 355 �1992�.
15 G. Schneider, Appl. Phys. Lett. 71, 2242 �1997�.16 D. Hambach, G. Schneider, and E. M. Gullikson, Opt. Lett. 26,
1200 �2001�.17 A. N. Kurokhtin and A. V. Popov, J. Opt. Soc. Am. A 19, 315
�2002�.18 H. C. Kang, G. B. Stephenson, C. Liu, R. Conley, A. T. Macra-
nder, J. Maser, S. Bajt, and H. N. Chapman, Appl. Phys. Lett.86, 151109 �2005�.
19 R. Scarmozzino and R. M. Osgood, J. Opt. Soc. Am. B 8, 724�1991�.
20 In our case the numerical integration in Eq. �14� was carried outover an interval �−6��xN ,6��xN�.
21 J. Kirz, J. Opt. Soc. Am. 64, 301 �1974�.22 See, for example, M. Born and E. Wolf, Principles of Optics
�Pergamon, Oxford, 1980�, Chap. 8.23 In practice, FZPs will likely employ phase shifts ���� and
have corresponding structure heights of h=��� / �2���. With f�D�xN /� and �=�2r0ne / �2��, the condition f �h /2 becomesequivalent to �xM ��� / �2Dr0ne�, where r0 is the electron ra-dius and ne is the electron density of the FZP material. Note thatthe condition is independent of �.
24 W. H. Press, B. P. Flannery, S. A. Teukolsky, and W. T. Vetterling,Numerical Recipes in C: The Art of Scientific Computing, 2nded., �Cambridge University Press, Cambridge, 1992�.
25 M. J. Zwanenburg, J. F. Peters, J. H. H. Bongaerts, S. A. de Vries,D. L. Abernathy, and J. F. van der Veen, Phys. Rev. Lett. 82,1696 �1999�.
26 M. J. Zwanenburg, J. F. van der Veen, H. G. Ficke, and H. Neer-ings, Rev. Sci. Instrum. 71, 1723 �2000�.
PFEIFFER et al. PHYSICAL REVIEW B 73, 245331 �2006�
245331-10