mount william creek flood investigation
TRANSCRIPT

Mount William Creek Flood Investigation Final Report
Reference: R.M20045.007.01.FinalReport.docx Date: December 2014
A part of BMT in Energy and Environment

T:\M20045.JL.MtWilliamCkFS\Docs\R.M20045.007.01.FinalReport.docx
Mount William Creek Flood Investigation Final Report
Mount William Creek Flood Investigation Interim Report - Hydraulic Calibration Mount William Creek Flood Investigation Interim Report - Hydraulic Calibration
Prepared for: Wimmera Catchment Management Authority
Prepared by: BMT WBM Pty Ltd (Member of the BMT group of companies)
Offices Brisbane Denver London Mackay Melbourne Newcastle Perth Sydney Vancouver

T:\M20045.JL.MtWilliamCkFS\Docs\R.M20045.007.01.FinalReport.docx
Document Control Sheet
BMT WBM Pty Ltd Level 5, 99 King Street Melbourne Vic 3000 Australia PO Box 604 Collins Street West Vic 8007 Tel: +61 3 8620 6100 Fax: +61 3 8620 6105 ABN 54 010 830 421 www.bmtwbm.com.au
Document: R.M20045.007.01.FinalReport.docx
Title: Mount William Creek Flood Investigation Final Report
Project Manager: Joel Leister
Author: Joel Leister
Client: Wimmera Catchment Management Authority
Client Contact: Jack Purcell and Clare Wilson
Client Reference: WCMA 2012 - 2013 - 017
Synopsis: This final report documents the methodology and findings of the Mount William Creek Flood Investigation
REVISION/CHECKING HISTORY
Revision Number Date Checked by Issued by
0 17/10/2014 DR JL
1 11/12/2014 MT
JL
DISTRIBUTION
Destination Revision
0 1 2 3 4 5 6 7 8 9 10
WCMA (pdf) 1 1
WCMA (hardcopy) 0 4
BMT WBM File 1 1
BMT WBM Library 1 1
Executive Summary i
T:\M20045.JL.MtWilliamCkFS\Docs\R.M20045.007.01.FinalReport.docx
Executive Summary This Executive Summary outlines the objectives, methodology and key outcomes of the Mount William Creek Flood Investigation. The investigation provides information on flood levels and flood risk within the Mount William Creek Catchment.
Study Background Following the widespread flooding across Victoria in September 2010 and January 2011 the Minister for Water on the 19th September 2011 announced funding for the Mount William Creek Flood Investigation. Funding for the investigation was made available through the Victorian Coalition Government's Flood Warning Network - Repair and Improvement initiative and the Australian Government's Natural Disaster Resilience Grants Scheme. The Wimmera Catchment Management Authority (WCMA), in partnership with the Department of Environment and Primary Industries (DEPI), Northern Grampians Shire Council (NGSC), Horsham Rural City Council (HRCC) and Ararat Rural City Council (ARCC) has commissioned this investigation.
The Mount William Creek Catchment has an approximate area of 1,450 km2 and is located in Central West Victoria. The catchment includes a number of waterways, namely, Mount William Creek, Salt Creek, Fyans Creek, Pleasant Creek, Sheepwash Creek and Golton Creek along with their tributaries. The Wimmera River heavily influences the downstream reaches of the catchment. The majority of the catchment is used for agricultural purposes, predominately grazing. There are several townships within the catchment including Pomonal, Moyston, Stawell, Dadswells Bridge and Halls Gap (refer to Figure 1). However, whilst the township of Halls Gap is located within the Mount William Creek catchment, it will not be mapped as part of the current study as flood mapping has already been undertaken as part of the Halls Gap Flood Study (Water Technology, 2008). The catchment was subject to extensive flooding during January 2011, which emphasised the need for improved understanding of the flood behaviour. The WCMA engaged BMT WBM Pty Ltd (BMT WBM) to undertake the flood investigation of the catchment.


Executive Summary iii
T:\M20045.JL.MtWilliamCkFS\Docs\R.M20045.007.01.FinalReport.docx
Key Objectives The key objectives of this study are to:
Review available data and historic flood information;
Engage with the community and stakeholders in order to understand their experiences of flooding and desired outcomes. Data collected from the community will be potentially used as inputs (rainfall) and model outputs and verification (flood behaviour matching event observations);
Determination and documentation of flood levels, extents, velocities and depths (and thus flood risk) for a range of flood events (5, 10, 20, 50, 100 and 200 year recurrence intervals and Probable Maximum Flood) and including consideration for climate change;
A review of Ararat Rural City Council, Horsham Rural City Council and Northern Grampians Shire Council Planning Scheme’s current Land Subject to Inundation Overlay (LSIO) and Flood Overlay (FO) overlay in the existing planning scheme.;
Preparation of digital and hard copy floodplain maps for the 1 in 100 year ARI and other flood events showing both floodplain and floodway extents, suitable for incorporation into municipal planning schemes should council deem appropriate;
Assessment of flood damages;
Identification and assessment of structural and non-structural mitigation measures to alleviate intolerable flooding risk;
Costing and assessment of preferred structural mitigation measures;
Preparation of flood intelligence and consequence information, including maps, for various flood frequency return periods;
Review and make recommendations regarding the flood warning system within the catchment;
Provide Ararat Rural City Council, Horsham Rural City Council and Northern Grampians Shire Council with a revised flood response section of the Municipal Emergency Management Plan based upon the flood intelligence derived from the Study;
Delivery of all flood related data and outputs including fully attributed Victorian Flood Database (VFD) compliant datasets;
Transparently reporting the outcome of the study together with the process followed and the findings; and
Engage the community in all stages of the flood investigation to ensure that most appropriate outcomes are achieved.
Data Collection As part of the Mount William Creek Flood Investigation, datasets and information were obtained from a variety of organisations. The datasets obtained included:
Topographic Data – Including LiDAR and Permanent Survey Marks.
GIS Data – Including: aerial photography, flood overlays, historical flood extents, cadastral information, planning zones and other government zones.

Executive Summary iv
T:\M20045.JL.MtWilliamCkFS\Docs\R.M20045.007.01.FinalReport.docx
Infrastructure Data – Including: drainage network details and floodplain control structure details.
Rainfall and Streamflow Data – Including: daily rainfall, pluviograph, stream stage and stream flow records.
Historic Flood Levels – Including: surveyed flood levels and surveyed floor levels.
In addition to collecting data from external sources, site inspections and community surveys were also undertaken as part of the Mount William Creek Flood Investigation.
Stakeholder Engagement Community consultation was undertaken throughout the development of the Mount William Creek Flood Investigation. The consultation included a series of public meetings and through community surveys. Community meetings were held in Dadswells Bridge, Pomonal and Moyston. These information sessions were well attended by the local community who provided invaluable information on the history of flooding within the catchment. A large amount of reliable evidence of flood behaviour was provided by the community to check the outputs of the Investigation. Over 300 flood photos and 48 flood marks were provided by the local community to document the flooding that occurred during the January 2011 flood event, and other historic flood events within the catchment. The flood information provided by the residents was invaluable in the development of the study outcomes.
The WCMA formed a Steering Committee for the project which consisted of key stakeholders from WCMA, DEPI, GWM Water, Council, VicSES and the local community. The steering committee provided governance and management of the Investigation and ensured that issues important to the Mount William Creek community were properly considered. Throughout the study, regular meetings were with the Steering Committee at which the interim reports and presentations were discussed and issues were resolved.
Flood Model Development The fully calibrated flood model developed for the Mount William Creek Flood Investigation, to define flood behaviour within the study area and assess mitigation options, incorporates both hydrologic and hydraulic modelling techniques. Flood frequency analyses was undertaken using the FLIKE package to determine the magnitude of predicted peak discharges for a given level of risk or probability. Hydrologic modelling was undertaken using the RORB hydrologic modelling package to determine the rainfall-runoff characteristics of the catchment.
The catchment flows derived from the hydrologic modelling were then used as input flow boundaries for the TUFLOW hydraulic model. The TUFLOW hydraulic model was used to generate the required flood mapping and define the flooding characteristics of the study area.
The flood model was calibrated to the January 2011 flood event and validated against the December 1992 flood event. To assess the impacts of flooding on the Mount William Creek catchment, the flood model was run for the following Annual Recurrence Interval (ARI) events: 5 year, 10 year, 20 year, 50 year, 100 year and 200 year, along with the Probable Maximum Flood (PMF) event.
A key factor influencing the model sensitivity is the starting water levels of the storages, Lake Lonsdale, Lake Bellfield and Lake Fyans. The project steering committee supported
Executive Summary v
T:\M20045.JL.MtWilliamCkFS\Docs\R.M20045.007.01.FinalReport.docx
recommendations based on an analysis of historic water levels of storages at times of flood. The adopted starting water levels used for both Lake Belfield and Lake Fyans was full and the current operating level was used for Lake Lonsdale (53,300 ML, 187.12m AHD).
Hydrologic Modelling Flood Frequency Analysis
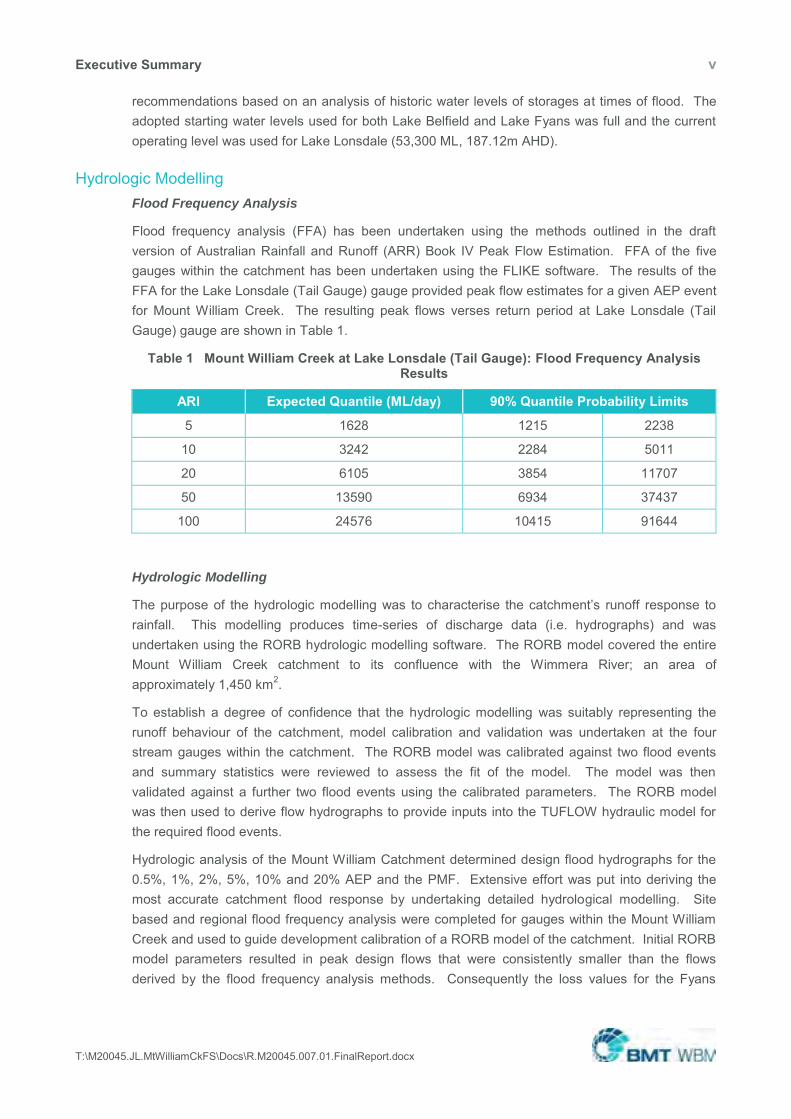
Flood frequency analysis (FFA) has been undertaken using the methods outlined in the draft version of Australian Rainfall and Runoff (ARR) Book IV Peak Flow Estimation. FFA of the five gauges within the catchment has been undertaken using the FLIKE software. The results of the FFA for the Lake Lonsdale (Tail Gauge) gauge provided peak flow estimates for a given AEP event for Mount William Creek. The resulting peak flows verses return period at Lake Lonsdale (Tail Gauge) gauge are shown in Table 1.
Table 1 Mount William Creek at Lake Lonsdale (Tail Gauge): Flood Frequency Analysis Results
ARI Expected Quantile (ML/day) 90% Quantile Probability Limits
5 1628 1215 2238
10 3242 2284 5011
20 6105 3854 11707
50 13590 6934 37437
100 24576 10415 91644
Hydrologic Modelling
The purpose of the hydrologic modelling was to characterise the catchment’s runoff response to rainfall. This modelling produces time-series of discharge data (i.e. hydrographs) and was undertaken using the RORB hydrologic modelling software. The RORB model covered the entire Mount William Creek catchment to its confluence with the Wimmera River; an area of approximately 1,450 km2.
To establish a degree of confidence that the hydrologic modelling was suitably representing the runoff behaviour of the catchment, model calibration and validation was undertaken at the four stream gauges within the catchment. The RORB model was calibrated against two flood events and summary statistics were reviewed to assess the fit of the model. The model was then validated against a further two flood events using the calibrated parameters. The RORB model was then used to derive flow hydrographs to provide inputs into the TUFLOW hydraulic model for the required flood events.
Hydrologic analysis of the Mount William Catchment determined design flood hydrographs for the 0.5%, 1%, 2%, 5%, 10% and 20% AEP and the PMF. Extensive effort was put into deriving the most accurate catchment flood response by undertaking detailed hydrological modelling. Site based and regional flood frequency analysis were completed for gauges within the Mount William Creek and used to guide development calibration of a RORB model of the catchment. Initial RORB model parameters resulted in peak design flows that were consistently smaller than the flows derived by the flood frequency analysis methods. Consequently the loss values for the Fyans
Executive Summary vi
T:\M20045.JL.MtWilliamCkFS\Docs\R.M20045.007.01.FinalReport.docx
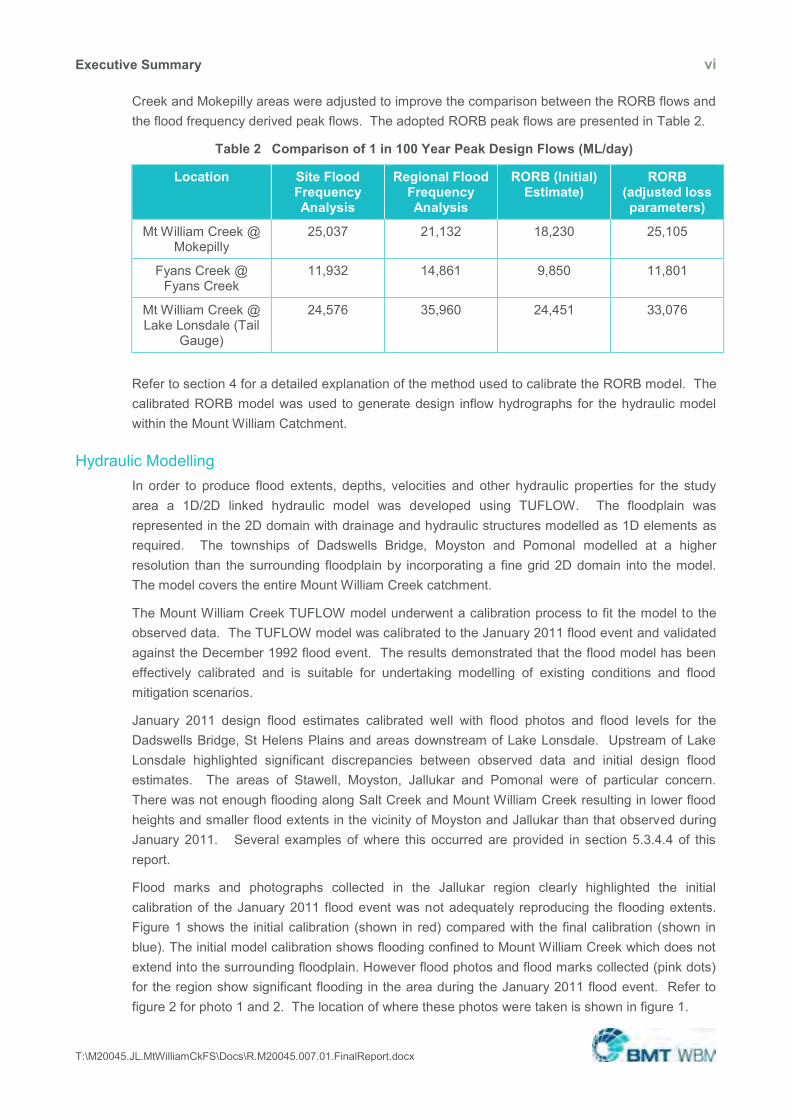
Creek and Mokepilly areas were adjusted to improve the comparison between the RORB flows and the flood frequency derived peak flows. The adopted RORB peak flows are presented in Table 2.
Table 2 Comparison of 1 in 100 Year Peak Design Flows (ML/day)
Location Site Flood Frequency Analysis
Regional Flood Frequency Analysis
RORB (Initial) Estimate)
RORB (adjusted loss parameters)
Mt William Creek @ Mokepilly
25,037 21,132 18,230 25,105
Fyans Creek @ Fyans Creek
11,932 14,861 9,850 11,801
Mt William Creek @ Lake Lonsdale (Tail
Gauge)
24,576 35,960 24,451 33,076
Refer to section 4 for a detailed explanation of the method used to calibrate the RORB model. The calibrated RORB model was used to generate design inflow hydrographs for the hydraulic model within the Mount William Catchment.
Hydraulic Modelling In order to produce flood extents, depths, velocities and other hydraulic properties for the study area a 1D/2D linked hydraulic model was developed using TUFLOW. The floodplain was represented in the 2D domain with drainage and hydraulic structures modelled as 1D elements as required. The townships of Dadswells Bridge, Moyston and Pomonal modelled at a higher resolution than the surrounding floodplain by incorporating a fine grid 2D domain into the model. The model covers the entire Mount William Creek catchment.
The Mount William Creek TUFLOW model underwent a calibration process to fit the model to the observed data. The TUFLOW model was calibrated to the January 2011 flood event and validated against the December 1992 flood event. The results demonstrated that the flood model has been effectively calibrated and is suitable for undertaking modelling of existing conditions and flood mitigation scenarios.
January 2011 design flood estimates calibrated well with flood photos and flood levels for the Dadswells Bridge, St Helens Plains and areas downstream of Lake Lonsdale. Upstream of Lake Lonsdale highlighted significant discrepancies between observed data and initial design flood estimates. The areas of Stawell, Moyston, Jallukar and Pomonal were of particular concern. There was not enough flooding along Salt Creek and Mount William Creek resulting in lower flood heights and smaller flood extents in the vicinity of Moyston and Jallukar than that observed during January 2011. Several examples of where this occurred are provided in section 5.3.4.4 of this report.
Flood marks and photographs collected in the Jallukar region clearly highlighted the initial calibration of the January 2011 flood event was not adequately reproducing the flooding extents. Figure 1 shows the initial calibration (shown in red) compared with the final calibration (shown in blue). The initial model calibration shows flooding confined to Mount William Creek which does not extend into the surrounding floodplain. However flood photos and flood marks collected (pink dots) for the region show significant flooding in the area during the January 2011 flood event. Refer to figure 2 for photo 1 and 2. The location of where these photos were taken is shown in figure 1.

Executive Summary vii
T:\M20045.JL.MtWilliamCkFS\Docs\R.M20045.007.01.FinalReport.docx
Figure 2 Comparison between initial and final January 2011 calibrations – Jallukar
Figure 3 Flooding of a property on Ararat – Halls Gap Road, Jallukar (left photo 1, right photo 2)
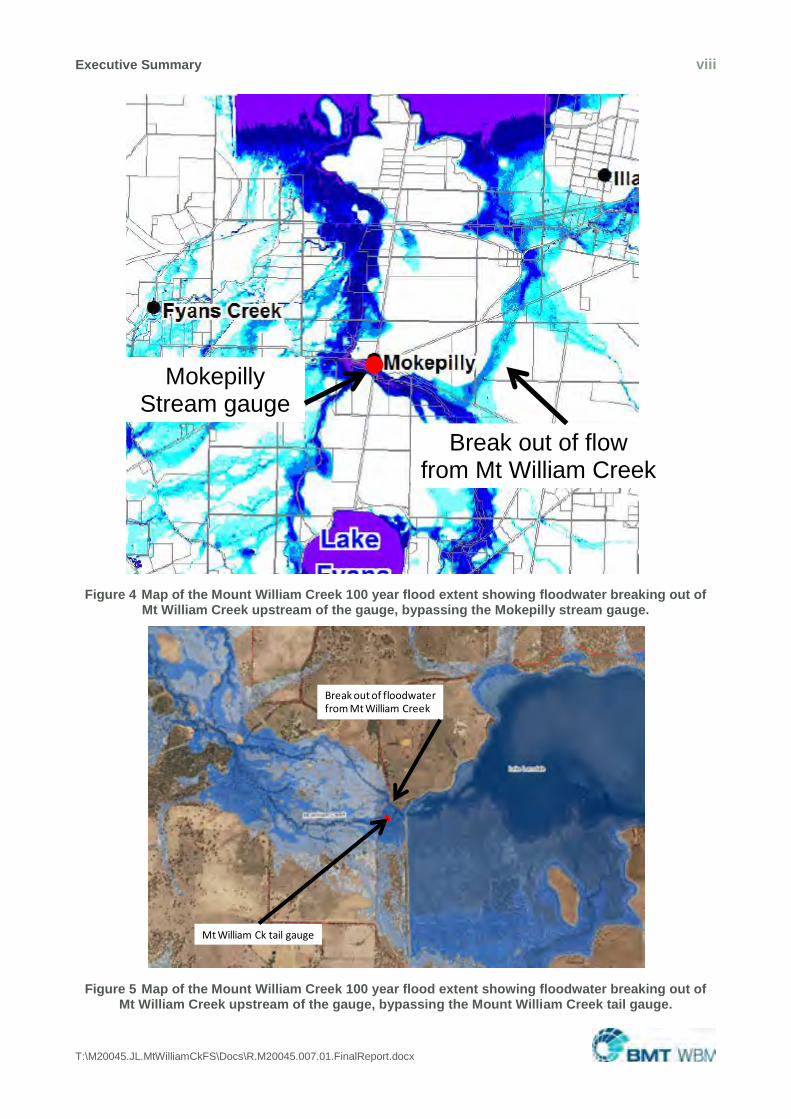
When calibrating the hydraulic model up stream of Lake Lonsdale more weight was applied to the photographs and flood marks rather than the stream gauge records. During large flood events such as the January 2011 event, stream gauge data for Mokepilly, Fyans Creek and Mount William tail gauge was deemed not accurate. As shown in Figure 4, Figure 5 and Figure 6, during large flood events floodwater was found to break out of these waterways upstream of the gauges, bypassing the stream gauge. During large flood events the stream record for these gauges is not representative of the flood behaviour.
Photo 1
Photo 2
Executive Summary viii
T:\M20045.JL.MtWilliamCkFS\Docs\R.M20045.007.01.FinalReport.docx
Figure 4 Map of the Mount William Creek 100 year flood extent showing floodwater breaking out of Mt William Creek upstream of the gauge, bypassing the Mokepilly stream gauge.
Figure 5 Map of the Mount William Creek 100 year flood extent showing floodwater breaking out of Mt William Creek upstream of the gauge, bypassing the Mount William Creek tail gauge.
Break out of floodwaterfrom Mt William Creek
Mt William Ck tail gauge
Mokepilly
Stream gauge
Break out of flow
from Mt William Creek

Executive Summary ix
T:\M20045.JL.MtWilliamCkFS\Docs\R.M20045.007.01.FinalReport.docx
Figure 6 Map of the 100 year flood extent showing floodwater breaking out of Fyans Creek upstream of the gauge, bypassing the Fyans Creek stream gauge.
A number of changes were made to improve the calibration so that better agreement could be achieved with flood marks captured and flood photos collected during the January 2011 event, refer to table 2 for a comparison between the recorded and design peak flows. The amendment of the hydraulic model calibration parameters resulted in increased flow along Mount William Creek upstream of Lake Lonsdale which ultimately result in flood extent and flood depths that better reflect survey marks and flood photography of 2011 event. Although changes to more acceptable values resulted in very poor calibration at Mokepilly gauge, the resultant flood extent and flood depths provide a much improved correlation to the community’s recollections when compared to the initial calibration. This method used to generate the design flood extents and flood levels is deemed acceptable by the project team given that during 100 year flood event; stream gauge records are not representative of flood behaviour in the Mt William Catchment. Refer to section 10.3.4.4 for recommendations to improve the stream gauge network to be more accurate during flood events.
Fyans Creek stream gauge
Break out of floodwaterfrom Fyans Creek

Executive Summary x
T:\M20045.JL.MtWilliamCkFS\Docs\R.M20045.007.01.FinalReport.docx
Table 3 Comparison of Peak Design Flows for January 2011 flood event (ML/day)
Location Recorded Peak Modelled Peak
Mt William Creek @ Mokepilly 7,160 38,991
Fyans Creek @ Fyans Creek 6,339 3,070
Mt William Creek @ Lake Lonsdale (Tail Gauge)
35,556 46,250
Existing Conditions Flood Mapping and Results The flood model was run for the 5 year, 10 year, 20 year, 50 year, 100 year and 200 year ARI design flood events (existing conditions) along with the PMF event. For each of these design flood events a suite of flood mapping outputs was generated including: flood depth, flood level, flood velocity, flood hazard and flood affected properties and buildings. Existing conditions peak flood depth for the 100 year ARI event is presented in Figure 7.


Mount William Creek Flood Investigation Final Report i Executive Summary
T:\M20045.JL.MtWilliamCkFS\Docs\R.M20045.007.01.FinalReport.docx
Existing Conditions Flood Damages Assessment The existing conditions flood damages were assessed using a combination of the Rapid Appraisal Method (RAM) and ANUFLOOD methods, both widely adopted throughout Victoria. The ANUFLOOD method was adopted to estimate potential building damages while the RAM method was used to estimate potential agricultural and infrastructure damages.
Flood damages assessments enable floodplain managers and decision makers to gain an understanding of the monetary magnitude of assets under threat from flooding. The information determined in the damages assessment is also used to inform the selection of mitigation measures via a benefit cost analysis. The results of the flood modelling indicated that during the 1% AEP event, 12 properties experience above floor flooding, as shown in Table 4. The existing conditions Average Annual Damages for the Mount William Creek catchment were calculated to be $1,624,200. However, agricultural damage and road infrastructure damage account for 56% and 34% of the total damage respectively.
Table 4 Properties flooded and above floor flooding against ARI event
Event ARI
No of Properties Inundated
No. of properties with Above Floor Flooding
PMF 41 35
200y 28 13
100y 24 12
50y 19 10
20y 13 7
10y 4 3
5y 4 2
Flood Management Options Assessment Through consultation with the community, emergency management authorities and other stakeholders, an understanding of the major factors that influence flood risk in the Mount William Creek catchment were identified. This understanding was further enhanced through computer flood modelling and mapping undertaken as part of the investigation. These factors relate to the physical characteristics of the floodplain that contribute to flood risk in the Mount William Creek catchment and the factors that hamper the community’s ability to manage the impact of flooding. The major factors are:
The locations of many of the towns, including Dadswells Bridge, Pomonal and Moyston, are on the banks of various known waterways that are subject to flooding;
Limited road access through the parts of the Mount William Creek catchment during times of flood;
The steep upper catchment resulting in fast flood responses from heavy rainfall. Flooding is generally fast flowing but confined to recognised flow paths

Mount William Creek Flood Investigation Final Report ii Executive Summary
T:\M20045.JL.MtWilliamCkFS\Docs\R.M20045.007.01.FinalReport.docx
The flat lower catchment results in widespread flooding (flood extents are wide); floodwaters are generally slower in velocity and more likely to simply ‘pond’ on the floodplain.
Numerous storages within the catchment have a significant impact on the timing and magnitude of the flood peaks throughout the catchment
The limited rain and streamflow gauges within the catchment limit the ability for the community and emergency services to respond to a flood event. Flood warning is designed more for the towns downstream on the Wimmera River, rather than the Mount William Creek catchment. Flood warning in the upper reaches of any catchment is challenging due to the rapid response of the upper catchment.
In order to address and manage these factors that contribute to the flood risk in the Mount William Creek catchment, a comprehensive flood management options assessment was undertaken, including both structural and non-structural management options.
Management Option Screening The screening was undertaken by the Technical Working Group. The Technical Working Group screened all management options collated as part of this investigation based on the knowledge of the members and the results of the flood modelling and analysis completed by BMT. The screening considered the feasibility of each potential management option in terms of;
The option’s likelihood of delivering the required flood alleviation to the communities of the Mount William Creek catchment; and
The economic, social and environmental costs.
In total, over 15 structural and eight non-structural management options were screened resulting in three structural and six non-structural management options were recommended for further assessment.
Structural Management Options Assessment The three management schemes that were assessed were:
Scheme 1: Dadswells Bridge Levee – A levee on the south side of the Western Highway, built to the same height as the existing highway level. This levee is designed to provide protection to a number of businesses on the south side of the Western Highway within the township of Dadswells Bridge
Scheme 2: Lake Lonsdale - A reduction in the operating level of Lake Lonsdale. Currently the operating level of Lake Lonsdale is 187.12 metres AHD, 0.5 metres below the spillway. This scheme will model the Lake Lonsdale operating level as being 185.62 m AHD, 2.0 metres below the spillway. This will allow for an additional 29,630 ML of flood storage within Lake Lonsdale.
Scheme 3: Road Access - Upgrading the Ararat – Halls Gap Road (C222) to minimise flooding over this key access road through the catchment. The intent of this component is to improve access during and following a flood event for the communities of Pomonal and Moyston (either through connection to Halls Gap or Ararat), and in doing so also improves access to the catchment for emergency services.

Mount William Creek Flood Investigation Final Report iii Executive Summary
T:\M20045.JL.MtWilliamCkFS\Docs\R.M20045.007.01.FinalReport.docx
Hydraulic modelling of the range of design events; that is the 5 year, 10 year, 20 year, 50 year, 100 year and 200 year ARI, as well as the PMF events; were used to undertake flood impact and damages assessments. Additionally, a benefit-cost ratio, which is an economic assessment based on preliminary cost estimates, was undertaken.
The resulting reductions in flood risk and Average Annual Damages (AAD) for the four schemes assessed was similar. As a result, the benefit-cost ratios were most heavily influenced by the cost of each scheme, as shown in Table 5.
Table 5 Structural Management Scheme Benefit-Cost Ratios
Structural Management Scheme
AAD Capital Cost
Total Scheme Cost
BCR
Existing $1,624,200
Scheme 1 $1,616,800 $230,000 $1,491,000 0.08
Scheme 2 $1,548,900 $11,190,000 $12,136,000 0.10
Scheme 3 $1,560,100 $11,990,000 $16,529,000 0.06
Recommended Structural Management Scheme All three modelled structural mitigation schemes provide minimal reductions to the Annual Average Damages and consequently result in very low Benefit-Cost Ratios. This is not unexpected due to the majority of the flood damages being incurred through damages to agricultural land and roads, and Schemes 1 and 3 making very little (if any) difference to these values. Whilst there is a noticeable reduction in the damages for Scheme 2, it comes at a significant capital cost; hence the BCR is still very low. However, the capital cost is based on the assumption that water from Lake Lonsdale would need to be ‘purchased’ in order to reduce the operating level. The BCR would improve significantly if this water did not need to be ‘purchased’.
Consequently, there is no preferred structural mitigation scheme recommended by the Steering Committee for the Mount William Creek Catchment. However, mitigation works should still be considered for protection of individual properties where deemed appropriate. A series of non-structural mitigation works will also be implemented across the catchment, including recommendations for improving the flood warning system and amendments to the planning scheme overlays.
Recommended Non-Structural Management Options A number of non-structural management options identified during options screening were recommended for implementation in the Mount William Creek Flood Investigation. These were:
Declaration of flood levels;
Amendments to planning schemes, including Planning Overlays (LSIO and FO);
Flood response plan, including flood intelligence and consequence information.
Flood warning system; and
Community education.
Mount William Creek Flood Investigation Final Report iv List of Abbreviations and Acronyms
T:\M20045.JL.MtWilliamCkFS\Docs\R.M20045.007.01.FinalReport.docx
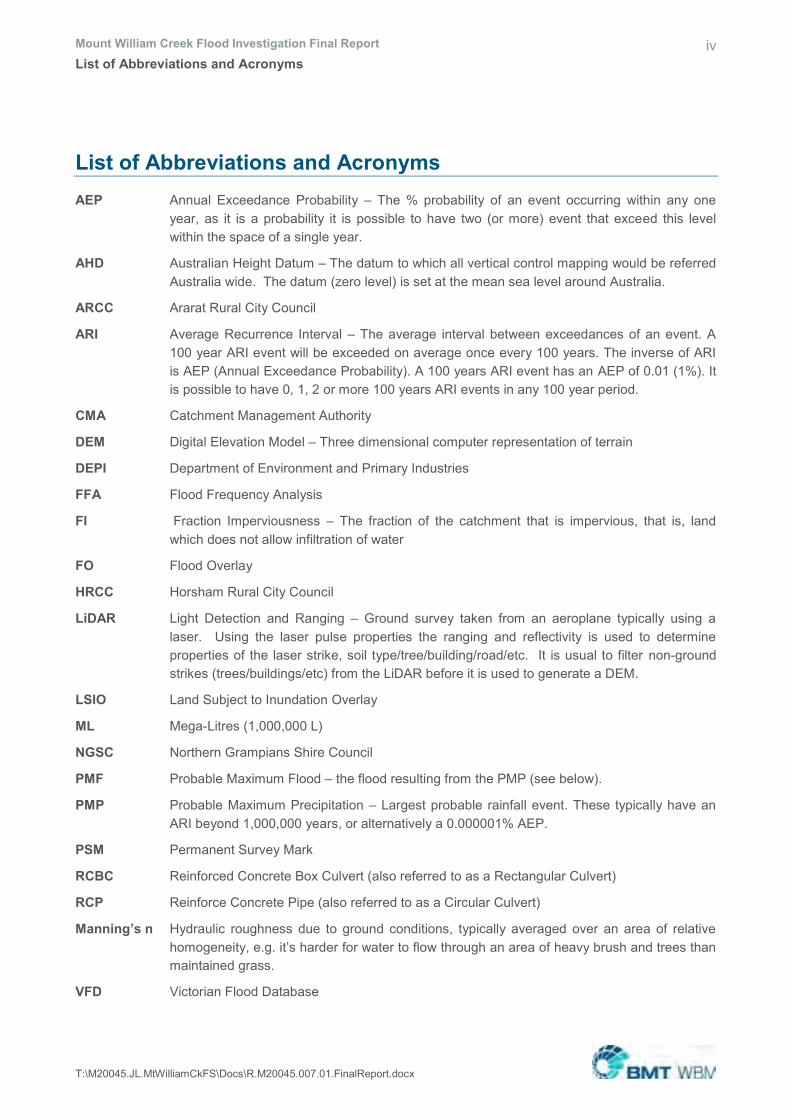
List of Abbreviations and Acronyms AEP Annual Exceedance Probability – The % probability of an event occurring within any one
year, as it is a probability it is possible to have two (or more) event that exceed this level within the space of a single year.
AHD Australian Height Datum – The datum to which all vertical control mapping would be referred Australia wide. The datum (zero level) is set at the mean sea level around Australia.
ARCC Ararat Rural City Council
ARI Average Recurrence Interval – The average interval between exceedances of an event. A 100 year ARI event will be exceeded on average once every 100 years. The inverse of ARI is AEP (Annual Exceedance Probability). A 100 years ARI event has an AEP of 0.01 (1%). It is possible to have 0, 1, 2 or more 100 years ARI events in any 100 year period.
CMA Catchment Management Authority
DEM Digital Elevation Model – Three dimensional computer representation of terrain
DEPI Department of Environment and Primary Industries
FFA Flood Frequency Analysis
FI Fraction Imperviousness – The fraction of the catchment that is impervious, that is, land which does not allow infiltration of water
FO Flood Overlay
HRCC Horsham Rural City Council
LiDAR Light Detection and Ranging – Ground survey taken from an aeroplane typically using a laser. Using the laser pulse properties the ranging and reflectivity is used to determine properties of the laser strike, soil type/tree/building/road/etc. It is usual to filter non-ground strikes (trees/buildings/etc) from the LiDAR before it is used to generate a DEM.
LSIO Land Subject to Inundation Overlay
ML Mega-Litres (1,000,000 L)
NGSC Northern Grampians Shire Council
PMF Probable Maximum Flood – the flood resulting from the PMP (see below).
PMP Probable Maximum Precipitation – Largest probable rainfall event. These typically have an ARI beyond 1,000,000 years, or alternatively a 0.000001% AEP.
PSM Permanent Survey Mark
RCBC Reinforced Concrete Box Culvert (also referred to as a Rectangular Culvert)
RCP Reinforce Concrete Pipe (also referred to as a Circular Culvert)
Manning’s n Hydraulic roughness due to ground conditions, typically averaged over an area of relative homogeneity, e.g. it’s harder for water to flow through an area of heavy brush and trees than maintained grass.
VFD Victorian Flood Database

Mount William Creek Flood Investigation Final Report v Contents
T:\M20045.JL.MtWilliamCkFS\Docs\R.M20045.007.01.FinalReport.docx
Contents Executive Summary i List of Abbreviations and Acronyms iv
1 Introduction 1
1.1 Study Background 1 1.2 Previous Reports 1 1.3 Catchment Description 2 1.4 Study Area 3 1.5 Historical Flooding 3 1.6 Key Objectives 3
2 Data Collation 7
2.1 Topographic Data 7 2.1.1 Ground Survey 8
2.2 Aerial Photography 8 2.3 Planning Scheme Information 9 2.4 Drainage Assets (Culverts and Bridges) 9
2.4.1 Discussion 11 2.5 Stream Gauge Data 11 2.6 Rainfall Data 12 2.7 Historic Flooding 13 2.8 Previous Studies 16
2.8.1 Halls Gap Flood Study (Water Technology, 2008) 16 2.8.2 Wimmera River – Yarriambiack Creek Flows Study (Water Technology,
2009) 16
3 Data Verification 18
3.1 LiDAR Verification 18 3.1.1 Vertical Accuracy 18 3.1.2 Discussion on Vertical Accuracy 20 3.1.3 Horizontal Accuracy 20 3.1.4 Summary 21
3.2 Verification of Other Data 21
4 Hydrologic Modelling 23
4.1 Flood Frequency Analysis 23 4.1.1 Introduction 23
Mount William Creek Flood Investigation Final Report vi Contents
T:\M20045.JL.MtWilliamCkFS\Docs\R.M20045.007.01.FinalReport.docx
4.1.1.1 Background on Approach 24 4.1.2 Data 24 4.1.2.1 Water Year 25 4.1.2.2 Gauged Data Error 25 4.1.2.3 Historic Data 26 4.1.2.4 Extending Instantaneous Flow Record 26 4.1.3 Flood Frequency Analysis 27 4.1.3.1 Annual Maximum Data 28 4.1.3.2 Censored Data 30 4.1.3.3 Inference Method 31 4.1.3.4 Results – 415217 Fyans Creek at Grampians Road Bridge 32 4.1.3.5 Results – 415214 Fyans Creek at Lake Bellfield 35 4.1.3.6 Results – 415250 Fyans Creek at Fyans Creek 38 4.1.3.7 Results – 415252 Mount William Creek at Mokepilly 41 4.1.3.8 Results – Mount William Creek at Lake Lonsdale (Tail Gauge) 44 4.1.4 Uncertainty of FFA 47 4.1.5 Discussion 47
4.2 Regional Flood Frequency Analysis 47 4.2.1 Discussion 48
4.3 RORB Model 49 4.3.1 Model Description 49 4.3.2 Sub-Catchment Definition 49 4.3.3 Reach Types 49 4.3.4 Fraction Impervious 50
4.4 Calibration and Validation 52 4.4.1 Calibration and Validation Process 52 4.4.2 Stream Gauge Information 52 4.4.3 Rainfall Selection and Distribution 52 4.4.4 Calibration and Validation Event Selection 56 4.4.4.1 Calibration and Validation Event Selection Summary 57 4.4.5 Calibration Parameters 58 4.4.6 January 2011 Calibration Results 59 4.4.7 December 1992 Calibration Results 62 4.4.8 October 1996 Verification Results 66 4.4.9 May 1974 Verification Results 68 4.4.10 Calibration / Validation Conclusions 69
4.5 Design Event Modelling 70

Mount William Creek Flood Investigation Final Report vii Contents
T:\M20045.JL.MtWilliamCkFS\Docs\R.M20045.007.01.FinalReport.docx
4.5.1 Global Parameters 70 4.5.2 Design Event Probabilities 70 4.5.3 Design Rainfall 70 4.5.3.1 Increase Rainfall Intensity - Climate Change 71 4.5.4 Temporal Patterns and Areal Reduction Factors 71 4.5.5 Calculation of PMP 72 4.5.6 Design Event Losses 72 4.5.7 Critical Event Derivation 72 4.5.8 Determination of Initial Water Levels for Storages 73 4.5.8.1 Discussion 77 4.5.8.2 Recommendations for Starting Lake Levels 77 4.5.9 Wimmera River Inflow 78 4.5.10 Peak Flows 78 4.5.11 Sensitivity Analysis - Climate Change 79
4.6 Discussion 82 4.7 Summary 82 4.8 Discussion and Recommendations 84
5 Hydraulic Modelling 85
5.1 Model Description 85 5.2 Model Development 85
5.2.1 Topography 86 5.2.2 Surface Roughness 86 5.2.3 Hydraulic Structures 87 5.2.3.1 Drainage Structures 87 5.2.3.2 Flow Control Structures 87 5.2.4 Boundary Conditions 87 5.2.5 Mount William Township Fine Mesh Domain 88
5.3 Model Calibration and Validation 91 5.3.1 Calibration and Validation Process 91 5.3.2 Calibration and Validation Data 91 5.3.3 Event Selection 92 5.3.4 January 2011 Calibration Event – Hydraulic Model Setup, Assumptions and
Results 92 5.3.4.1 Initial Calibration 93 5.3.4.2 Community Feedback 98 5.3.4.3 Final Calibration 98 5.3.4.4 Evidence to Support Final Calibration 104
Mount William Creek Flood Investigation Final Report viii Contents
T:\M20045.JL.MtWilliamCkFS\Docs\R.M20045.007.01.FinalReport.docx
5.3.5 December 1992 Verification Event – Hydraulic Model Setup, Assumptions and Results 111
5.3.6 Calibration and Validation Summary 115 5.4 Design Event Modelling 115
6 Quality Assurance 116
6.1 Hydrologic (RORB) Model Review 116 6.2 Hydraulic (TUFLOW) Model Review 116
7 Flood Mapping and Results 117
7.1 Flood Depth Mapping 117 7.2 Flood Hazard Mapping 117 7.3 Flood Velocity Mapping 118
8 Flood Damages Assessment 131
8.1 Methodology 132 8.2 Key Assumptions 133 8.3 ANUFLOOD Building Damages Assessment 134
8.3.1 ANUFLOOD Stage-Damage Curves 134 8.3.3 ANUFLOOD Building Damages Summary 136
8.4 Flooded Floor Levels 136 8.5 Rapid Appraisal Method (RAM) Damages Assessment 144
8.5.1 RAM Building Damages 144 8.5.1.1 Differences between ANUFLOOD and RAM Building Damages 145 8.5.2 RAM Agricultural Damages 145 8.5.3 RAM Road Infrastructure Damages 146
8.6 Average Annual Damages 147 8.7 Summary 148
9 Flood Mitigation Assessment 150
9.1 Flood Mitigation Overview 150 9.1.1 Background 150 9.1.2 Key Issues 150 9.1.3 Management Objectives 151
9.2 Management Option Screening 151 9.2.1 Structural Management Schemes Assessment 151
9.3 Structural Management Schemes 152 9.3.1 Scheme One 152 9.3.2 Scheme Two 152 9.3.3 Scheme Three 153

Mount William Creek Flood Investigation Final Report ix Contents
T:\M20045.JL.MtWilliamCkFS\Docs\R.M20045.007.01.FinalReport.docx
9.4 Assessment Methodology 153 9.4.1 Hydraulic Assessment and Flood Impact Mapping 153 9.4.2 Benefit Cost Ratio 153 9.4.3 Cost Estimates 155
9.5 Scheme 1: Dadswells Bridge Levees 156 9.5.1 Description of Works 156 9.5.2 Flood Impacts 156 9.5.3 Change in Flooded Floors 156 9.5.4 Benefit Cost Ratio 157 9.5.5 Advantages and Disadvantages 157
9.6 Scheme 2: Lake Lonsdale and Stawell Works 159 9.6.1 Description of Works 159 9.6.2 Flood Impacts 159 9.6.3 Change in Flooded Floors 159 9.6.4 Benefit Cost Ratio 160 9.6.5 Advantages and Disadvantages 160
9.7 Scheme 3: Whole of Catchment Access 163 9.7.1 Description of Works 163 9.7.2 Flood Impacts 163 9.7.3 Change in Flooded Floors 163 9.7.4 Benefit Cost Ratio 164 9.7.5 Advantages and Disadvantages 164
9.8 Flood Mitigation Conclusions 167
10 Flood Warning Systems 168
10.1 Flood Warning Systems 168 10.1.1 Limitations of Flood Warning Systems 168
10.2 Flooding within the Mount William Creek Catchment 168 10.2.1 Catchment Overview 168 10.2.2 Flood Behaviour 169 10.2.3 Flood Risk in the Mount William Creek Catchment 170 10.2.4 Flood Mitigation Options 171
10.3 The Task for Mount William Creek 172 10.3.1 The Problem 172 10.3.2 Existing Flood Warning System 172 10.3.3 What Will Need to be Done 172 10.3.4 Data Collection and Collation 173 10.3.4.1 Introduction 173

Mount William Creek Flood Investigation Final Report x Contents
T:\M20045.JL.MtWilliamCkFS\Docs\R.M20045.007.01.FinalReport.docx
10.3.4.2 Turn-Key Data Collection & Alerting Systems 173 10.3.4.3 Other Automated Data Collection and Alerting Systems 174 10.3.4.4 Existing Data Collection Network 176 10.3.4.5 Possible Additional Data Collection Sites 176 10.3.5 Flood Detection & Prediction 179 10.3.5.1 Use of Existing Gauges 180 10.3.6 Interpretation 182 10.3.7 Message Construction and Dissemination 182 10.3.8 Response 183 10.3.9 Community Flood Awareness 183
10.4 Suggested System for Mount William Creek 185 10.5 Suggested Actions 193
10.5.1 Stage 1 193 10.5.2 Stage 2 194 10.5.3 Stage 3 194 10.5.4 Stage 4 194 10.5.5 Stage 5 195 10.5.6 Stage 6 195 10.5.7 Stage 7 195 10.5.8 Stage 8 195
11 Floodplain Management 196
11.1 Flood Hazard 196 11.2 Planning Controls 196 11.3 Declared Flood Levels 197 11.4 Flood Response Plan 197
12 Summary and Recommendations 203
13 References 204
Appendix A Flood Depth Mapping A-1
Appendix B Flood Hazard Mapping B-1
Appendix C Flood Velocity Mapping C-1
Appendix D Mitigation Scenarios – Flood Impact Assessment D-1
Appendix E The Flood Warning Service Provided by BOM E-1
Appendix F Indicative Flood/No Flood Tools for Mount William Creek F-1
Appendix G Estimated costs for TFWS for Mount William Creek G-1

Mount William Creek Flood Investigation Final Report xi Contents
T:\M20045.JL.MtWilliamCkFS\Docs\R.M20045.007.01.FinalReport.docx
List of Figures Figure 1 Study Area and Town Map ii Figure 2 Comparison between initial and final January 2011 calibrations – Jallukar vii Figure 3 Flooding of a property on Ararat – Halls Gap Road, Jallukar (left photo 1, right
photo 2) vii Figure 4 Map of the Mount William Creek 100 year flood extent showing floodwater
breaking out of Mt William Creek upstream of the gauge, bypassing the Mokepilly stream gauge. viii
Figure 5 Map of the Mount William Creek 100 year flood extent showing floodwater breaking out of Mt William Creek upstream of the gauge, bypassing the Mount William Creek tail gauge. viii
Figure 6 Map of the 100 year flood extent showing floodwater breaking out of Fyans Creek upstream of the gauge, bypassing the Fyans Creek stream gauge. ix
Figure 7 Existing Conditions 1% AEP Peak Flood Depth xi Figure 1-1 Locality Map 5 Figure 1-2 Study Area 6 Figure 2-1 January 2011 Survey Marks 15 Figure 2-2 Existing Flood Mapping in the Mount William Creek Catchment 17 Figure 3-1 Distribution of PSM Differences 20 Figure 4-1 Recorded Flow at Lake Lonsdale (Tail Gauge) based on Old and New Ratings 26 Figure 4-2 Mean Daily vs Instantaneous Flow – Mount William Creek at Lake Lonsdale 27 Figure 4-3 FFA Results: Fyans Creek at Grampians Road Bridge - Log Normal Fitting 32 Figure 4-4 FFA Results: Fyans Creek at Grampians Road Bridge - LP3 Fitting 33 Figure 4-5 FFA Results: Fyans Creek at Grampians Road Bridge - Gumbel Fitting 33 Figure 4-6 FFA Results: Fyans Creek at Grampians Road Bridge - GEV Fitting 34 Figure 4-7 FFA Results: Fyans Creek at Grampians Road Bridge - Generalised Pareto
Fitting 34 Figure 4-8 FFA Results: Fyans Creek at Lake Bellfield - Log Normal Fitting 35 Figure 4-9 FFA Results: Fyans Creek at Lake Bellfield - LP3 Fitting 36 Figure 4-10 FFA Results: Fyans Creek at Lake Bellfield - Gumbel Fitting 36 Figure 4-11 FFA Results: Fyans Creek at Lake Bellfield - GEV Fitting 37 Figure 4-12 FFA Results: Fyans Creek at Lake Bellfield - Generalised Pareto Fitting 37 Figure 4-13 FFA Results: Fyans Creek at Fyans Creek - Log Normal Fitting 38 Figure 4-14 FFA Results: Fyans Creek at Fyans Creek - LP3 Fitting 39 Figure 4-15 FFA Results: Fyans Creek at Fyans Creek - Gumbel Fitting 39 Figure 4-16 FFA Results: Fyans Creek at Fyans Creek - GEV Fitting 40 Figure 4-17 FFA Results: Fyans Creek at Fyans Creek - Generalised Pareto Fitting 40

Mount William Creek Flood Investigation Final Report xii Contents
T:\M20045.JL.MtWilliamCkFS\Docs\R.M20045.007.01.FinalReport.docx
Figure 4-18 FFA Results: Mount William Creek at Mokepilly - Log Normal Fitting 41 Figure 4-19 FFA Results: Mount William Creek at Mokepilly - LP3 Fitting 42 Figure 4-20 FFA Results: Mount William Creek at Mokepilly - Gumbel Fitting 42 Figure 4-21 FFA Results: Mount William Creek at Mokepilly - GEV Fitting 43 Figure 4-22 FFA Results: Mount William Creek at Mokepilly - Generalised Pareto Fitting 43 Figure 4-23 FFA Results: Mount William Creek at Lake Lonsdale (Tail Gauge) - Log
Normal Fitting 44 Figure 4-24 FFA Results: Mount William Creek at Lake Lonsdale (Tail Gauge) - LP3 Fitting 45 Figure 4-25 FFA Results: Mount William Creek at Lake Lonsdale (Tail Gauge) - Gumbel
Fitting 45 Figure 4-26 FFA Results: Mount William Creek at Lake Lonsdale (Tail Gauge) - GEV
Fitting 46 Figure 4-27 FFA Results: Mount William Creek at Lake Lonsdale (Tail Gauge) -
Generalised Pareto Fitting 46 Figure 4-28 RORB Model Layout 51 Figure 4-29 Stream Gauge and Pluviograph Station Locations 54 Figure 4-30 Stream Gauge and Rainfall Station Locations 55 Figure 4-31 Calibrated Hydrograph Comparison for January 2011 – Fyans Creek at Fyans
Creek 61 Figure 4-32 Calibrated Hydrograph Comparison for January 2011 – Mount William Creek
at Mokepilly 61 Figure 4-33 Calibrated Hydrograph Comparison for January 2011 – Mount William Creek
at Lake Lonsdale Tail Gauge 62 Figure 4-34 Calibrated Hydrograph Comparison for December 1992 – Fyans Creek at
Fyans Creek 64 Figure 4-35 Calibrated Hydrograph Comparison for December 1992 – Mount William
Creek at Mokepilly 64 Figure 4-36 Calibrated Hydrograph Comparison for December 1992 – Mount William
Creek at Lake Lonsdale Head Gauge 65 Figure 4-37 Calibrated Hydrograph Comparison for December 1992 – Mount William
Creek at Lake Lonsdale Tail Gauge 65 Figure 4-38 Verification Hydrograph Comparison for October 1996 – Fyans Creek at
Fyans Creek 67 Figure 4-39 Verification Hydrograph Comparison for October 1996 – Mount William Creek
at Mokepilly 67 Figure 4-40 Verification Hydrograph Comparison for October 1996 – Mount William Creek
at Lake Lonsdale Head Gauge 68 Figure 4-41 Validation Hydrograph Comparison for May 1974 – Mount William Creek at
Lake Lonsdale Tail Gauge 69 Figure 4-42 Lake Bellfield Plot 74

Mount William Creek Flood Investigation Final Report xiii Contents
T:\M20045.JL.MtWilliamCkFS\Docs\R.M20045.007.01.FinalReport.docx
Figure 4-43 Lake Fyans Plot 75 Figure 4-44 Lake Lonsdale Plot 76 Figure 4-45 Lake Lonsdale Level Analysis 77 Figure 4-46 1 in 100 year ARI 18 Hour Initial Design Hydrographs 79 Figure 4-47 Climate Change Sensitivity – Fyans Creek 80 Figure 4-48 Climate Change Sensitivity – Mokepilly 80 Figure 4-49 Climate Change Sensitivity – Lake Lonsdale 81 Figure 4-50 Climate Change Sensitivity – Dadswells Bridge 81 Figure 5-1 TUFLOW Model Layout 89 Figure 5-2 Manning’s ‘n’ Roughness Coefficient Distribution 90 Figure 5-3 Initial January 2011 Calibration: Fyans Creek at Fyans Creek 93 Figure 5-4 Initial January 2011 Calibration: Mount William Creek at Mokepilly 94 Figure 5-5 Initial January 2011 Calibration: Mount William Creek at Lake Lonsdale 94 Figure 5-6 Initial January 2011 Calibration – Distribution of Surveyed Flood Marks 96 Figure 5-7 Initial January 2011 Calibration: Flood Depth and Survey Marks 97 Figure 5-8 Final January 2011 Calibration – Fyans Creek at Fyans Creek 100 Figure 5-9 Final January 2011 Calibration – Mount William Creek at Mokepilly 101 Figure 5-10 Final January 2011 Calibration – Mount William Creek at Lake Lonsdale 101 Figure 5-11 Final January 2011 Calibration – Distribution of Surveyed Flood Marks 102 Figure 5-12 Final January 2011 Calibration: Flood Depth and Survey Marks 103 Figure 5-13 Comparison between initial and final January 2011 calibrations – Jallukar (1) 104 Figure 5-14 Flooding of a property on Ararat – Halls Gap Road, Jallukar 105 Figure 5-15 Comparison between initial and final January 2011 calibrations – Jallukar (2) 106 Figure 5-16 Flooding of the Air Strip on Ararat – Halls Gap Road, Jallukar 106 Figure 5-17 Comparison between initial and final January 2011 calibrations – Jallukar (3) 107 Figure 5-18 Flooding of Ararat – Halls Gap Road (East of Lady Summers Bridge) 107 Figure 5-19 Comparison of initial and final January 2011 calibrations - Moyston 108 Figure 5-20 Flooding between house and shed - Presbyterian Church Road, Moyston 109 Figure 5-21 Comparison of initial and final January 2011 calibrations - Pomonal 110 Figure 5-22 Comparison of initial and final January 2011 calibrations – Halls Gap (Reids
Lane) 111 Figure 5-23 December 1992 Verification: Fyans Creek at Fyans Creek 112 Figure 5-24 December 1992 Verification: Mount William Creek at Mokepilly 112 Figure 5-25 December 1992 Verification: Mount William Creek at Lake Lonsdale 113 Figure 5-26 December 1992 Verification: Flood Depths 114

Mount William Creek Flood Investigation Final Report xiv Contents
T:\M20045.JL.MtWilliamCkFS\Docs\R.M20045.007.01.FinalReport.docx
Figure 7-1 1 in 100 Year ARI Peak Flood Depth – Catchment 119 Figure 7-2 1 in 100 Year ARI Peak Flood Depth – Dadswells Bridge 120 Figure 7-3 1 in 100 Year ARI Peak Flood Depth – Moyston 121 Figure 7-4 1 in 100 Year ARI Peak Flood Depth – Pomonal 122 Figure 7-5 1 in 100 Year ARI Peak Flood Hazard – Catchment 123 Figure 7-6 1 in 100 Year ARI Peak Flood Hazard – Dadswells Bridge 124 Figure 7-7 1 in 100 Year ARI Peak Flood Hazard – Moyston 125 Figure 7-8 1 in 100 Year ARI Peak Flood Hazard – Pomonal 126 Figure 7-9 1 in 100 Year ARI Peak Flood Velocity – Catchment 127 Figure 7-10 1 in 100 Year ARI Peak Flood Velocity – Dadswells Bridge 128 Figure 7-11 1 in 100 Year ARI Peak Flood Velocity – Moyston 129 Figure 7-12 1 in 100 Year ARI Peak Flood Velocity – Pomonal 130 Figure 8-1 Types and Categorisation of Flood Damage Costs - Reproduced from Rapid
Appraisal Method (RAM) For Floodplain Management (NRE 2000). 132 Figure 8-2 ANUFLOOD Stage-Damage Curves 135 Figure 8-3 1 in 5 Year ARI Flooded Buildings – Whole of Catchment 137 Figure 8-4 1 in 10 Year ARI Flooded Buildings – Whole of Catchment 138 Figure 8-5 1 in 20 Year ARI Flooded Buildings – Whole of Catchment 139 Figure 8-6 1 in 50 Year ARI Flooded Buildings – Whole of Catchment 140 Figure 8-7 1 in 100 Year ARI Flooded Buildings – Whole of Catchment 141 Figure 8-8 1 in 200 Year ARI Flooded Buildings – Whole of Catchment 142 Figure 8-9 PMF Flooded Buildings – Whole of Catchment 143 Figure 8-10 Existing Condition Probability-Damages Curve 148 Figure 9-1 Mitigation Option 1 – 100 Year ARI Flood Impact 158 Figure 9-2 Mitigation Option 2 – 100 Year ARI Flood Impact - Lake Lonsdale 161 Figure 9-3 Mitigation Option 2 – 100 Year ARI Flood Impact - Stawell Works 162 Figure 9-4 Mitigation Option 3 – 100 Year ARI Flood Impact – Road Upgrade 165 Figure 9-5 Mitigation Option 3 – 100 Year ARI Flood Impact – Main Channel
Reinstatement 166 Figure 10-1 Potential PALS locations for Dadswells Bridge 178 Figure 11-1 Proposed Planning Scheme - Catchment 198 Figure 11-2 Proposed Planning Scheme – ARCC 199 Figure 11-3 Proposed Planning Scheme - HRCC 200 Figure 11-4 Proposed Planning Scheme - NGSC 201

Mount William Creek Flood Investigation Final Report xv Contents
T:\M20045.JL.MtWilliamCkFS\Docs\R.M20045.007.01.FinalReport.docx
List of Tables Table 1 Mount William Creek at Lake Lonsdale (Tail Gauge): Flood Frequency
Analysis Results v Table 2 Comparison of 1 in 100 Year Peak Design Flows (ML/day) vi Table 3 Comparison of Peak Design Flows for January 2011 flood event (ML/day) x Table 4 Properties flooded and above floor flooding against ARI event i Table 5 Structural Management Scheme Benefit-Cost Ratios iii Table 3-1 Comparison of LiDAR to PSMs 19 Table 3-2 Comparison of LiDAR to Field Survey 19 Table 3-3 Verification of Culvert Details 22 Table 4-1 Stream Flow Gauges in the Mount William Creek Catchment 25 Table 4-2 Annual Maximum Series: 415217 Fyans Creek at Grampians Road Bridge 28 Table 4-3 Annual Maximum Series: 415214 Fyans Creek at Lake Bellfield 28 Table 4-4 Annual Maximum Series: 415250 Fyans Creek at Fyans Creek 29 Table 4-5 Annual Maximum Series: 415252 Mount William Creek at Mokepilly 29 Table 4-6 Annual Maximum Series: 415203 Mount William Creek at Lake Lonsdale (Tail
Gauge) 29 Table 4-7 Censored Data Values 31 Table 4-8 415217 Fyans Creek at Grampians Road Bridge: FFA Results 32 Table 4-9 415214 Fyans Creek at Lake Bellfield: FFA Results 35 Table 4-10 415250 Fyans Creek at Fyans Creek: Flood Frequency Analysis Results 38 Table 4-11 415252 Mount William Creek at Mokepilly: FFA Results 41 Table 4-12 Mount William Creek at Lake Lonsdale: Flood Frequency Analysis Results 44 Table 4-13 RFFE Results 48 Table 4-14 Comparison of Site FFA and RFFA Results 48 Table 4-15 Fraction Impervious Values 50 Table 4-16 Calibration and Validation Rainfall Event Rainfall Summary 58 Table 4-17 Calibrated Parameters and Values for January 2011 59 Table 4-18 Calibrated Parameters and Values for December 1992 62 Table 4-19 Validation Parameters and Values for October 1996 66 Table 4-20 Validation Parameters and Values for May 1974 68 Table 4-21 Initial RORB design parameters 70 Table 4-22 IFD Parameters 71 Table 4-23 GSAM Estimate of PMP Rainfall Depth 72 Table 4-24 RORB Design Event – Critical Duration 72

Mount William Creek Flood Investigation Final Report xvi Contents
T:\M20045.JL.MtWilliamCkFS\Docs\R.M20045.007.01.FinalReport.docx
Table 4-25 Lake Bellfield - % Exceedance Values 73 Table 4-26 Lake Fyans - % Exceedance Values 74 Table 4-27 Lake Lonsdale - % Exceedance Values 75 Table 4-28 Initial RORB Design Peak Flow Values 78 Table 4-29 Comparison of Initial Peak Design Flows 82 Table 4-30 Adopted RORB design parameters 83 Table 4-31 Adopted RORB Design Peak Flow Values 83 Table 4-32 Comparison of Adopted Peak Design Flows 84 Table 5-1 2D Domain Manning’s ‘n’ Coefficients 86 Table 5-2 Initial January 2011 Flow Comparison 95 Table 5-3 Final Calibration – January 2011 Flow Comparison 102 Table 5-4 December 1992 Verification: Flow Comparison 113 Table 8-1 Existing Conditions ANUFLOOD Building Damages Summary 136 Table 8-2 RAM Building Potential Damage Values 144 Table 8-3 Existing Conditions RAM Building Damages Summary 144 Table 8-4 RAM Agricultural Damage Values 145 Table 8-5 Existing Conditions RAM Agricultural Damages Summary 146 Table 8-6 RAM Road Infrastructure Damage Values 146 Table 8-7 Existing Conditions RAM Road Infrastructure Damages Summary 146 Table 8-8 Existing Conditions Damages Summary 148 Table 9-1 Present Value of Annual Benefits 154 Table 9-2 Change in Flooded Floors – Scheme One 156 Table 9-3 Scheme 1 BCR Summary 157 Table 9-4 Advantages and Disadvantages of Scheme 1 157 Table 9-5 Change in Flooded Floors – Scheme Two 159 Table 9-6 Scheme 1 BCR Summary 160 Table 9-7 Advantages and Disadvantages of Scheme 2 160 Table 9-8 Change in Flooded Floors – Scheme Three 163 Table 9-9 Scheme 3 BCR Summary 164 Table 9-10 Advantages and Disadvantages of Scheme 3 164 Table 10-1: Potential PALS locations, gauge zeroes and applicable design flood levels 178 Table 10-2 Expected Flood Magnitude Vs. Lake Lonsdale Tail Gauge Heights 181 Table 10-3 Expected Flood Magnitude Vs. Mokepilly Gauge Heights 181 Table 10-4 Expected Flood Magnitude Vs. Fyans Creek Gauge Heights 181

Mount William Creek Flood Investigation Final Report xvii Contents
T:\M20045.JL.MtWilliamCkFS\Docs\R.M20045.007.01.FinalReport.docx
Table 10-5 Flood Warning System Building Blocks and Possible Solution for the Mount William Creek catchment with due regard for the EMMV, Commonwealth-State arrangements for flood warning service provision (BoM, 1987; VFWCC, 2001; and EMA, 2009) 186