attachment b - cost engineering jordan creek flood …
TRANSCRIPT

Attachment B - 1
ATTACHMENT B - COST ENGINEERING
JORDAN CREEK FLOOD RISK MANAGEMENT FEASIBILITY STUDY, SPRINGFIELD, MISSOURI
19.1.0 INTRODUCTION This appendix contains a summary of the detailed feasibility cost estimate prepared for the Springfield, Missouri Flood Risk Management Feasibility Study. The study area lies entirely within the city limits of Springfield, Missouri. The streams studied, upstream from southwest to northeast, are the upper end of Wilson’s Creek, Jordan Creek and its North Branch and South Branch tributaries. The streams start in the northeast portion of Springfield and flow southwest-ward to the central west part of Springfield. The total drainage area for the study is about 19.3 square miles. The total study area is 13.75 square miles. The total length of the streams studied is approximately 6.9 miles. The main land uses of the study area vary from sparsely developed industrial to highly congested commercial. The stream conditions range from natural configuration with wooded banks to a man-modified channel forced through concrete culverts with buildings built over the culvert or concrete lined with vertical sidewalls. The land terrain is gently rolling. The geology of the area is rich soil overlying limestone bedrock with the rock occasionally rising to protrude into the channel bottom. Input for the cost estimates was obtained from the Project Delivery Team (PDT) consisting of the City of Springfield including the Storm Water Services Division of the Public Works Department and Design Branch, Planning, Environmental and Economics personnel of the Little Rock District of the U.S. Army Corps of Engineers. Guidance for preparation of these cost estimates was obtained from ER 1110-2-1150 Engineering and Design (E&D) for Civil Works Projects, ER 1110-1-1300 E&D Cost Engineering Policy and General Requirements, ER 1110-2-1302 Civil Works Cost Engineering, and ETL 1110-2-573 E&D Construction Cost Estimating Guide for Civil Works. The cost estimates were prepared using Micro-Computer Aided Cost Estimating System MII version 4, build.4. Supporting cost libraries or databases were MII 2010 cost library, 2011 Equipment expense library (EP 1110-1-8, dated November 30, 2011) and the 2012 R. S. Means labor rates library for Springfield, Missouri. Cost estimates were prepared at two levels - Class 4, initially, and Class 3 for inclusion in this feasibility report. Preliminary or Class 4 cost estimates were prepared for nine channel and/or detention basin plans designated as Alternatives A through J with levels of protection (LOP) from rainfall events having a reoccurrence interval ranging from 500 years down to 25 years. Alternative J, the National Economic Development Plan (NED), is the tentatively selected plan and consists of a LOP from the 500 year storm in reach E1 with the five detention ponds in the upper watershed. Two of the detention basins are located on the north branch tributary and three detention basins are located on the south branch tributary of Jordan Creek. See the main report for a description of the study reaches for this feasibility study. The quantities used in these cost estimates were developed primarily by the Civil Designer and Structural Designer from over 500 surveyed field cross sections from the HEC models from

Attachment B - 2
which the economic analyses were conducted. Quantity calculations by the designers were aided by the combination of Excel, ArcMap, HEC RAS, AutoCAD, and Google Earth software. The cost estimate presented in this cost appendix is for the design and construction of the tentatively selected plan, Plan J, which includes channel excavation of soil and rock, railroad bridges, automobile bridges and culverts, and water, sewer, natural gas, communications and electrical utilities relocations. 19.2.0 PRICE LEVEL Project costs are presented in December 2012 dollars and all project costs have been escalated to October 2014 price levels for inclusion in the 2015 budget. Labor rates for the estimates have been inflated over the construction period of this project. It is assumed that the metropolitan area of Springfield, Missouri, 2010 population of approximately 275,000, will have sufficient equipment operators, skilled craftsmen, and laborers to meet the needs of the contractors. The contractor is envisioned to only bring key personnel such as the project superintendent and one other key person to this job site. Only these persons will be provided living expenses in and above their salaries. Other sources of cost in these cost estimates are the 2010 MII Cost Library. Equipment costs are from the 2011 Region 5, which includes Springfield, Missouri, equipment rates from Engineering Pamphlet (EP) 1110-1-8 Construction Equipment Ownership and Operating Expense Schedule. The costs of all alternative estimates, especially Alternative J, are considered fair and reasonable to a prudent and capable contractor. 19.3.0 COST ESTIMATE STRUCTURE The cost estimates for the alternatives presented in this feasibility study were prepared by cost engineers in the Cost Engineering Section of Little Rock District. The cost estimates were organized according to the Civil Works – Work Breakdown Structure (CWWBS) and designated by using a source tag that designated the plan ID, reach ID, two levels (Feature and Sub-feature) of the Civil Works Work Breakdown Structure and subsequent levels of the source tag were from the April 2012 Masterformat® 2012 Numbers and Titles. The cost estimate work breakdown format shown in the MII source tag was structured to reflect the alternative and reach as well as two levels of the CWBS for which the estimate is being prepared for example AA_RR_FFSS - AA being the alternative, RR the reach, FF CWBS feature designator, and SS is the sub-feature designator. Project features in the total project cost summary (TPCS) are in accordance with the CWWBS: 01 Lands and Damages include the real estate acquisitions of project lands, easements and rights-of ways. Costs are real estate, non-Federal’s sponsors cost for land surveys, title preparation, legal opinions and Federal costs of reviewing the non-Federal sponsor’s documents for legal sufficiency.
Attachment B - 3
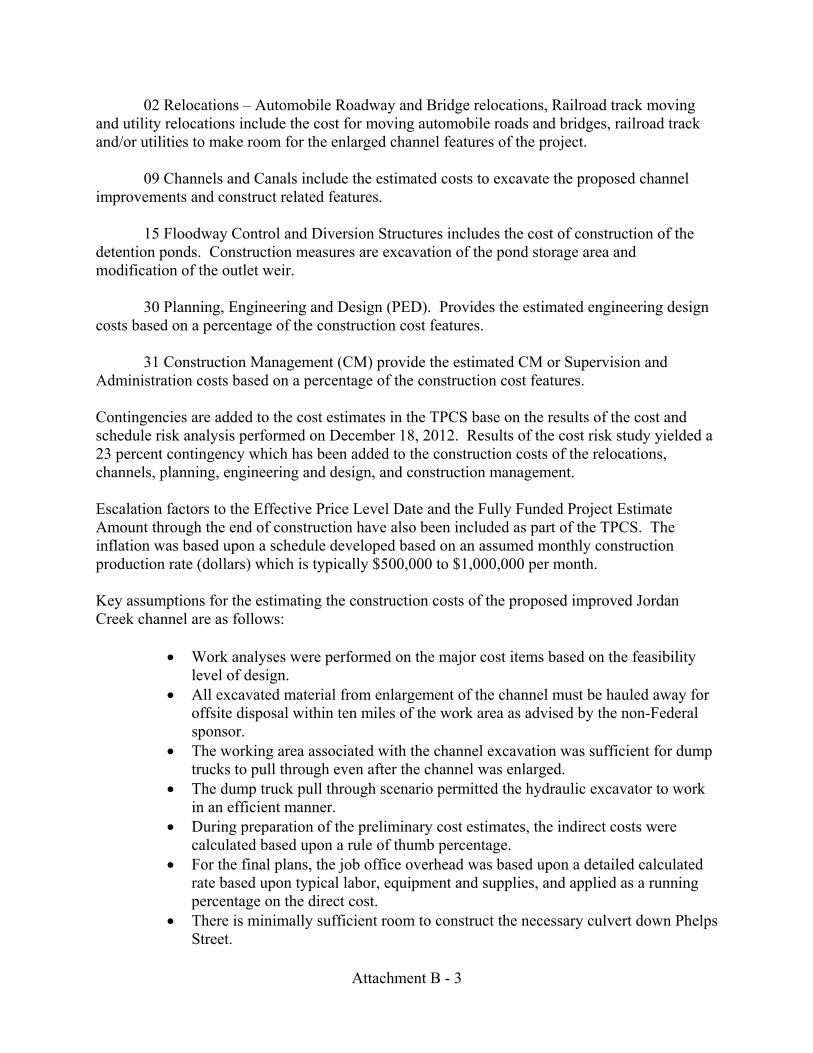
02 Relocations – Automobile Roadway and Bridge relocations, Railroad track moving and utility relocations include the cost for moving automobile roads and bridges, railroad track and/or utilities to make room for the enlarged channel features of the project. 09 Channels and Canals include the estimated costs to excavate the proposed channel improvements and construct related features. 15 Floodway Control and Diversion Structures includes the cost of construction of the detention ponds. Construction measures are excavation of the pond storage area and modification of the outlet weir. 30 Planning, Engineering and Design (PED). Provides the estimated engineering design costs based on a percentage of the construction cost features. 31 Construction Management (CM) provide the estimated CM or Supervision and Administration costs based on a percentage of the construction cost features. Contingencies are added to the cost estimates in the TPCS base on the results of the cost and schedule risk analysis performed on December 18, 2012. Results of the cost risk study yielded a 23 percent contingency which has been added to the construction costs of the relocations, channels, planning, engineering and design, and construction management. Escalation factors to the Effective Price Level Date and the Fully Funded Project Estimate Amount through the end of construction have also been included as part of the TPCS. The inflation was based upon a schedule developed based on an assumed monthly construction production rate (dollars) which is typically $500,000 to $1,000,000 per month. Key assumptions for the estimating the construction costs of the proposed improved Jordan Creek channel are as follows:
Work analyses were performed on the major cost items based on the feasibility level of design.
All excavated material from enlargement of the channel must be hauled away for offsite disposal within ten miles of the work area as advised by the non-Federal sponsor.
The working area associated with the channel excavation was sufficient for dump trucks to pull through even after the channel was enlarged.
The dump truck pull through scenario permitted the hydraulic excavator to work in an efficient manner.
During preparation of the preliminary cost estimates, the indirect costs were calculated based upon a rule of thumb percentage.
For the final plans, the job office overhead was based upon a detailed calculated rate based upon typical labor, equipment and supplies, and applied as a running percentage on the direct cost.
There is minimally sufficient room to construct the necessary culvert down Phelps Street.

Attachment B - 4
The latest Department of Defense Unit Cost data were used to cost the automobile and railway bridges in the cost estimates due to the time constraints.
19.4.0 DISCUSSIONS OF COSTS BY FEATURE 19.4.1 01-Lands and Damages The cost estimate for Lands and Damages is based on the estimated acres impacted by the project footprint as determined by the Civil and Structural Designer and estimated by Little Rock District Real Estate Division personnel. There are several types of real estate instruments required to obtain all land rights needed to construct this project. See the Real Estate Appendix for more detailed information regarding the development of the cost for Lands and Damages. 19.4.2 02 Relocations This section summarizes cost estimate information related to relocating roadway paving and bridges, utilities, and building demolition. 19.4.2.02.1 Road Bridges and Roads Bridge costs were based upon the Department of Defense (DoD) Pricing Guide for FY 2011 utilizing the square feet of proposed bridge decks. These square foot costs were derived from bridges constructed at various locations across the country within the previous year. 19.4.2.02.2 Utility Relocations Many utilities will be impacted by the construction of the Jordan Creek channel improvements regardless of which plan is selected. In consultation with the City of Springfield and its utility departments and private utilities, i.e. telephone cables, the various utilities were located, designated by type, and size. The designers consulted this list during the design of the improved channel and it was noted what modifications were required to move the utility out of the way of the flow in the improved channel. Underground utilities which include water, sanitary sewer, communication cables, and natural gas, were designated to be lowered during the improvement of the channel. Overhead utilities, primarily electrical lines, were relocated after study by its respective designer often by the installation of new poles and possibly additional lengths of properly sized wire. Costs were added to the alternative’s cost estimate based upon the action recommendation by the designers.

Attachment B - 5
19.4.3 09-Channels and Canals Results of the Hydrology and Hydraulic studies set the size and bottom elevation for the channel improvements to lessen flood risks along Jordan Creek within Springfield, Missouri. The civil designer along with input from other PDT members added required features to make the channel functional. The other features along with the excavation quantities were provided to the cost estimators. The estimators assembled the necessary labor, equipment and materials to construct the project and yielded the project cost. 19.5.0 CONTRACTOR AND INDIRECT COST CONSIDERATIONS The cost estimator assumed the work is done by a prime contractor which performs the excavation work as well as project management functions. Specialty work such as bridge construction and utility relocations are to be done by subcontractors hired by the prime contractor. This arrangement makes for two levels of contracting and two levels of markup costs (job office overhead, home office overhead, profit, and bond). 19.5.1 Prime Contractor The prime contractor’s job office overhead (JOOH) was calculated based upon the typical number of supervisory people, temporary office, equipment, and office supplies and the construction time estimated for the project. The calculated JOOH was 39 percent for Plan J channel contractor and 33 percent for the detention basin contractor in Plan J. The home office overhead (HOOH) expenses are those cost incurred by the contractor for its overall business management of their main office expenses. These main offices expenses include cost such as upper management, accounting, personnel, and legal. This cost estimator set the HOOH at 8 percent of the construction cost. Typically, HOOH ranges from 5 percent to 10 percent of the construction cost. The profit for the prime contractor was calculated to be 9.38 percent of the running construction cost, which includes direct cost, JOOH and HOOH markups, as determined utilizing the profit weighted guidelines method in ETL 1110-2-573. Performance and payment bond premium of 0.35 percent of the running construction cost, including the direct cost, JOOH, HOOH, and profit, as determined by the MII embedded bond premium table for Class B work. 19.5.2 Subcontractors JOOH rates for the subcontractors were assumed to be a constant 13 percent on the job. Mobilization and demobilization were assumed to be included within this percentage. Including in the mobilization is the cost to move equipment, support equipment and supplies to the close proximity of the work area. HOOH for the subcontractors is assumed to be a constant 8 percent to cover the subcontractors’ permanent offices or home office expense.

Attachment B - 6
Profit for the subcontractors was computed by the weighted guidelines methods to be 9.38 percent. 19.6.0 30-PLANNING, ENGINEERING AND DESIGN The Planning, Engineering and Design (PED) costs are the costs from authorization until the first construction contract is awarded. This work includes detailed surveys, soil investigations and preparation of the plans and specifications to guide the contractor to construct the project. Discussions with the PDT yielded a PED cost of 8.1 percent of the estimated construction cost. 19.7.0 31 CONSTRUCTION MANAGEMENT The Construction Management costs are determined as a percent of the estimated construction costs. For this feasibility level estimate, a percentage of 7.7 percent of the construction cost was used in consultation with Construction Branch personnel. 19.8.0 CONTINGENCY Current regulations require formal analyses of schedule and costs risks. See the Attachment C for the abbreviated Cost Risk Analysis Study documentation that was performed on December 18, 2012. The results of the cost risk study were that a 23 percent contingency was appropriate for construction costs, planning, engineering, and design, and construction management. The purpose of contingencies is an added cost included in the cost estimate to cover unknowns. Unknowns could include:
Quantity variation. Hidden features that will require modification or removal to construct the project as
planned. Construction components not identified during conduct of the feasibility study. For
example, is a temporary bypass required by railroad officials in order to replace the railroad bridge over Wilson Creek.
Additional costs to cover inflation while waiting for the project’s authorization and appropriations.
Additional costs to cover inflation while the non-Federal sponsors raises their cost share funds.
Delays due to litigation. Previously unknown HTRW.
19.9.0 PROJECT SCHEDULE Project schedules for the NED alternative was developed by the Little Rock District PDT. The construction scenario is that the channel improvement of reach E1 and the detention basins are to be constructed concurrently. The detention basin work is to be performed on one basin at a time. The NED alternative has an estimate construction period of 3 years and has a required average annual funding need of $ 4 million.

Attachment B - 7
19.10.0 OPERATIONS, MAINTENANCE, REPAIR, REHABILITATION AND REPLACEMENT (OMRR&R) COSTS A detailed OMRR&R cost estimate for this project has been prepared and is attached to this appendix. This estimate is to account for the net increase in project costs to operate and maintain the project features and to recognize costs for the repair, rehabilitation and replacement of primarily bridges and culverts. This cost will be required in the future to maintain the improved project for its expected life. The basis of the OMRR&R is a visual inspection of the project area via aerial photography which showed woody growth all along Jordan Creek outside of the business district between Main Street and Phelps Street indicating no regular maintenance. The difference in maintenance of bridges and culverts is due to the change in physical size of the structure. 19.11.0 FINAL FEASIBILITY ESTIMATE The final feasibility cost estimates as presented in the following Total Project Cost Summaries (TPCS) for the Jordan Creek Flood Risk Management Feasibility Study are as follows:
Cost of NED Alternative (Plan J) Jordan Creek, Springfield, Missouri
Flood Risk Management Feasibility Study Plan J National Economic Development Plan FY 2015 Price Level $ 20,277,000 Fully Funded Amount $ 21,129,000

**** TOTAL PROJECT COST SUMMARY **** Printed:1/15/2013Page 1 of 3
PROJECT: DISTRICT: SWL Little Rock District PREPARED: 12/20/2012LOCATION: Greene County, Missouri POC: CHIEF, COST ENGINEERING, Bruce Watson
This Estimate reflects the scope and schedule in report; Appendix C, Jordan Creek FRM Feasibility Study
Program Year (Budget EC): 2015
Effective Price Level Date: 1 OCT 14
Spent Thru:
WBS Civil Works COST CNTG CNTG TOTAL ESC COST CNTG TOTAL 1-Oct-14 COST CNTG FULLNUMBER Feature & Sub-Feature Description ($K) ($K) (%) ($K) (%) ($K) ($K) ($K) ($K) ($K) ($K) ($K)
A B C D E F G H I J K L M N O
02 RELOCATIONS $1,406 $323 23% $1,730 1.2% $1,424 $327 $1,751 $1,467 $337 $1,804
09 CHANNELS & CANALS $5,631 $1,295 23% $6,926 0.0% $5,631 $1,295 $6,926 $5,990 $1,378 $7,368
15 FLOODWAY CONTROL & DIVERSION STRUCTURE
$3,438 $791 23% $4,229 1.7% $3,497 $804 $4,302 $3,576 $823 $4,399
#N/A $0 $0 $0 $0 $0 $0
#N/A $0 $0 $0 $0 $0 $0
__________ __________ __________ _________ _________ __________ _________ _________ ____________CONSTRUCTION ESTIMATE TOTALS: $10,475 $2,409 $12,885 0.7% $10,552 $2,427 $12,979 $11,033 $2,538 $13,571
01 LANDS AND DAMAGES $3,824 $765 20% $4,589 1.3% $3,875 $775 $4,650 $3,919 $784 $4,703
30 PLANNING, ENGINEERING & DESIGN $845 $194 23% $1,039 1.6% $859 $198 $1,056 $911 $210 $1,120
31 CONSTRUCTION MANAGEMENT $820 $189 23% $1,009 1.7% $834 $192 $1,025 $921 $212 $1,133
PROJECT COST TOTALS: $15,965 $3,557 22% $19,522 $16,120 $3,591 $19,711 $16,784 $3,743 $20,527
Mandatory by Regulation CHIEF, COST ENGINEERING, Bruce Watson
ESTIMATED FEDERAL COST: 65% $13,343Mandatory by Regulation PROJECT MANAGER, Karyn Adams ESTIMATED NON-FEDERAL COST: 35% $7,184
Mandatory by Regulation CHIEF, REAL ESTATE, Don Balch ESTIMATED TOTAL PROJECT COST: $20,527
CHIEF, PLANNING, Patricia Anslow
CHIEF, ENGINEERING, Tony Batey
CHIEF, OPERATIONS, John Balgavy
CHIEF, CONSTRUCTION, DeJuan Carter
CHIEF, CONTRACTING, Sandra Easter
O&M OUTSIDE OF TOTAL PROJECT COST: CHIEF, PM-PB, Brinda Jackson
CHIEF, DPM, Dr. Randy Hathaway
TOTAL PROJECT COST (FULLY FUNDED)
Plan J Without Buyouts, Jordan Creek FRM Study, Springfield, Missouri 354082
WBS Structure ESTIMATED COST PROJECT FIRST COST (Constant Dollar Basis)
Filename: 20121219 Pln J wo buyouts TSP Springfield Non-CAP_TPCS_Mar2012 (r1).xlsxTPCS

**** TOTAL PROJECT COST SUMMARY **** Printed:1/15/2013Page 2 of 3
**** CONTRACT COST SUMMARY ****
PROJECT: DISTRICT: SWL Little Rock District PREPARED: 12/20/2012LOCATION: Greene County, Missouri POC: CHIEF, COST ENGINEERING, Bruce WatsonThis Estimate reflects the scope and schedule in report; Appendix C, Jordan Creek FRM Feasibility Study
20-Dec-12 2015 1-Oct-14 1 OCT 14
RISK BASED
WBS Civil Works COST CNTG CNTG TOTAL ESC COST CNTG TOTAL Mid-Point INFLATED COST CNTG FULLNUMBER Feature & Sub-Feature Description ($K) ($K) (%) ($K) (%) ($K) ($K) ($K) Date (%) ($K) ($K) ($K)
A B C D E F G H I J P L M N OPHASE 1 or CONTRACT 1 (Detention Ponds)
02 RELOCATIONS $1,012 $233 23% $1,245 1.7% $1,029 $237 $1,266 2016Q2 2.3% $1,053 $242 $1,29509 CHANNELS & CANALS
15FLOODWAY CONTROL & DIVERSION STRUCTURE $3,438 $791 23% $4,229 1.7% $3,497 $804 $4,302 2016Q2 2.3% $3,576 $823 $4,399
#N/A
#N/A
__________ __________ _________ __________ _________ _________ __________ _________ _________ ____________CONSTRUCTION ESTIMATE TOTALS: $4,450 $1,024 23% $5,474 $4,527 $1,041 $5,568 $4,629 $1,065 $5,694
01 LANDS AND DAMAGES $2,943 $589 20% $3,531 1.7% $2,993 $599 $3,592 2015Q1 $2,993 $599 $3,592
30 PLANNING, ENGINEERING & DESIGN
0.5% Project Management $22 $5 23% $27 3.8% $23 $5 $28 2015Q1 $23 $5 $28
1.0% Planning & Environmental Compliance $45 $10 23% $55 3.8% $47 $11 $57 2015Q1 $47 $11 $574.8% Engineering & Design $215 $49 23% $264 3.8% $223 $51 $275 2015Q1 $223 $51 $2750.5% Engineering Tech Review ITR & VE $22 $5 23% $27 3.8% $23 $5 $28 2015Q1 $23 $5 $280.5% Contracting & Reprographics $22 $5 23% $27 3.8% $23 $5 $28 2015Q1 $23 $5 $280.5% Engineering During Construction $22 $5 23% $27 3.8% $23 $5 $28 2016Q2 4.9% $24 $6 $29
0.3% Planning During Construction $11 $3 23% $14 3.8% $11 $3 $14 2016Q2 4.9% $12 $3 $15 Project Operations 23%
31 CONSTRUCTION MANAGEMENT
7.8% Construction Management $347 $80 23% $427 3.8% $360 $83 $443 2016Q2 4.9% $378 $87 $465
Project Operation: 23%
0.2% Project Management $9 $2 23% $11 3.8% $9 $2 $11 2016Q2 4.9% $10 $2 $12
CONTRACT COST TOTALS: $8,108 $1,776 $9,884 $8,262 $1,811 $10,073 $8,384 $1,839 $10,223
Estimate Prepared:Effective Price Level:
Program Year (Budget EC):Effective Price Level Date:
Plan J Without Buyouts, Jordan Creek FRM Study, Springfield, Missouri 354082
ESTIMATED COST PROJECT FIRST COST (Constant Dollar Basis) TOTAL PROJECT COST (FULLY FUNDED)WBS Structure
Filename: 20121219 Pln J wo buyouts TSP Springfield Non-CAP_TPCS_Mar2012 (r1).xlsxTPCS

**** TOTAL PROJECT COST SUMMARY **** Printed:1/15/2013Page 3 of 3
**** CONTRACT COST SUMMARY ****
PROJECT: DISTRICT: SWL Little Rock District PREPARED: 12/20/2012LOCATION: Greene County, Missouri POC: CHIEF, COST ENGINEERING, Bruce WatsonThis Estimate reflects the scope and schedule in report; Appendix C, Jordan Creek FRM Feasibility Study
20-Dec-12 2015 1-Oct-14 1 OCT 14
WBS Civil Works COST CNTG CNTG TOTAL ESC COST CNTG TOTAL Mid-Point INFLATED COST CNTG FULLNUMBER Feature & Sub-Feature Description ($K) ($K) (%) ($K) (%) ($K) ($K) ($K) Date (%) ($K) ($K) ($K)
A B C D E F G H I J P L M N OPHASE 2 or CONTRACT 2 (Reaches E3)
02 RELOCATIONS $394 $91 23% $485 $394 $91 $485 2016Q4 5.0% $414 $95 $509
09 CHANNELS & CANALS $5,631 $1,295 23% $6,926 $5,631 $1,295 $6,926 2017Q3 6.4% $5,990 $1,378 $7,368#N/A 23%
#N/A
#N/A
__________ __________ _________ __________ _________ _________ __________ _________ _________ ____________CONSTRUCTION ESTIMATE TOTALS: $6,025 $1,386 23% $7,411 $6,025 $1,386 $7,411 $6,404 $1,473 $7,877
01 LANDS AND DAMAGES $882 $176 20% $1,058 $882 $176 $1,058 2016Q4 5.0% $926 $185 $1,111
30 PLANNING, ENGINEERING & DESIGN
0.5% Project Management $30 $7 23% $37 $30 $7 $37 2016Q3 9.9% $33 $8 $41
1.0% Planning & Environmental Compliance $60 $14 23% $74 $60 $14 $74 2016Q3 9.9% $66 $15 $814.8% Engineering & Design $291 $67 23% $358 $291 $67 $358 2016Q3 9.9% $320 $74 $3930.5% Engineering Tech Review ITR & VE $30 $7 23% $37 $30 $7 $37 2016Q3 9.9% $33 $8 $410.5% Contracting & Reprographics $30 $7 23% $37 $30 $7 $37 2016Q3 9.9% $33 $8 $410.5% Engineering During Construction $30 $7 23% $37 $30 $7 $37 2017Q4 15.0% $35 $8 $42
0.3% Planning During Construction $15 $3 23% $18 $15 $3 $18 2017Q4 15.0% $17 $4 $21 Project Operations 23%
31 CONSTRUCTION MANAGEMENT
7.5% Construction Management $452 $104 23% $556 $452 $104 $556 2017Q4 15.0% $520 $120 $640
Project Operation: 23%
0.2% Project Management $12 $3 23% $15 $12 $3 $15 2017Q4 15.0% $14 $3 $17
CONTRACT COST TOTALS: $7,857 $1,781 $9,638 $7,857 $1,781 $9,638 $8,400 $1,904 $10,304
Estimate Prepared: Program Year (Budget EC):Effective Price Level: Effective Price Level Date:
Plan J Without Buyouts, Jordan Creek FRM Study, Springfield, Missouri 354082
ESTIMATED COST PROJECT FIRST COST (Constant Dollar Basis) TOTAL PROJECT COST (FULLY FUNDED)WBS Structure
Filename: 20121219 Pln J wo buyouts TSP Springfield Non-CAP_TPCS_Mar2012 (r1).xlsxTPCS

Date Prepared: January 18, 2013
Life Cycle: 50 years
Rate of Return: 7 percent
Code Item DescriptionEstimate O&M Cycle, years
Quantity Factor
Project Quantity
O&M Quantity
Unit Project Unit Price O&M Amount O&MMajor
ReplacementAnnual Cost Comments
$460,079 $1,556,189 $194,810
Reach E1 - Wilson's Creek and South Branch 0+00 to 37+9200 Periodic Inspections 1 1 1 1 Job $281.00 $281 $3,878 0 $281
Automobile Bridge Inspections 2 1 1 1 Job $271.00 $271 $3,158 0 $271 Every 2 years
02 No added OMM&R
09 Mowings 1 3 4.726 14.2 Acres $85.58 $1,213 $16,745 0 $1,213 3 times per yearWoody Vegetation Control 4 0.25 4.726 1.2 Acres $760.97 $899 $7,331 0 $531 Every four yearsSediment Removal 1 1 5 CY $63.68 $318 $4,394 0 $318 AnnuallyTrash/Debris Removal 1 1 1 Job $591.46 $591 $8,163 0 $591 AnnuallyScour Repair 5 0.20 5 CY $774.72 $592 $2,429 0 $176 Once every 5 yearsRiprap Repair 10 0.10 9 CY $229.24 $593 $2,433 0 $176 Once every 10 yearsRailway Bridges - Wilson Crk Station 322+92 10 0.01 1 0.1 LS $648,544.00 $6,485 $26,592 $627,250 $47,377Roadway Bridges - Scenic 10 0.01 1 0.1 LS $458,473.00 $4,585 $18,798 $443,420 $33,492 Monitor Foundation Shoring
Subtotal $84,428Reach E2 - Jordan Creek 37+93 to 109+99
No WorkSubtotal
Reach E3 - Jordan Creek 110+00 to 166+7000 Periodic Inspections 1 1 1 1 Job $0 $0 $0
Automobile Bridge Inspections 2 1 1 1 Job $0 $0 $0 Every 2 years
02 Roadway Bridges - Main Street 10 0.01 1 0.10 LS $0 $0 $0Roadway Bridges - Campbell Street 10 0.01 1 0.10 LS $0 $0 $0Railway Tracks Relocation 10 0.01 1 0.10 LS $0 $0 $0 As was originally. No extra OMM&R
09 Mowings 1 3 4.726 14.2 Acres $0 $0 $0 3 times per yearWoody Vegetation Control 4 0.25 4.726 1.2 Acres $0 $0 $0 Every four yearsSediment Removal 1 1 5 CY $0 $0 $0 AnnuallyTrash/Debris Removal 1 1 1 Job $0 $0 $0 AnnuallyScour Repair 5 0.20 5 CY $0 $0 $0 Once every 5 yearsRiprap Repair 10 0.10 9 CY $0 $0 $0 Once every 10 years
Roadway Bridges - Campbell Street 10 0.1 1 0.1 LS $0 $0Roadway Bridges - Boonville Street 10 0.01 1 0.1 LS $0 $0 $0Roadway Culvert - Phelps Street 1st Segment 10 0.01 1 0.10 LS $0 $0 $0 Once every 10 yearsRoadway Culvert - Phelps Street 2nd Segment 10 0.01 1 0.10 LS $0 $0 $0 Once every 10 years
Subtotal $0
Reach E4 - Jordan Creek North Branch 0+00 to 24+75
Present Value
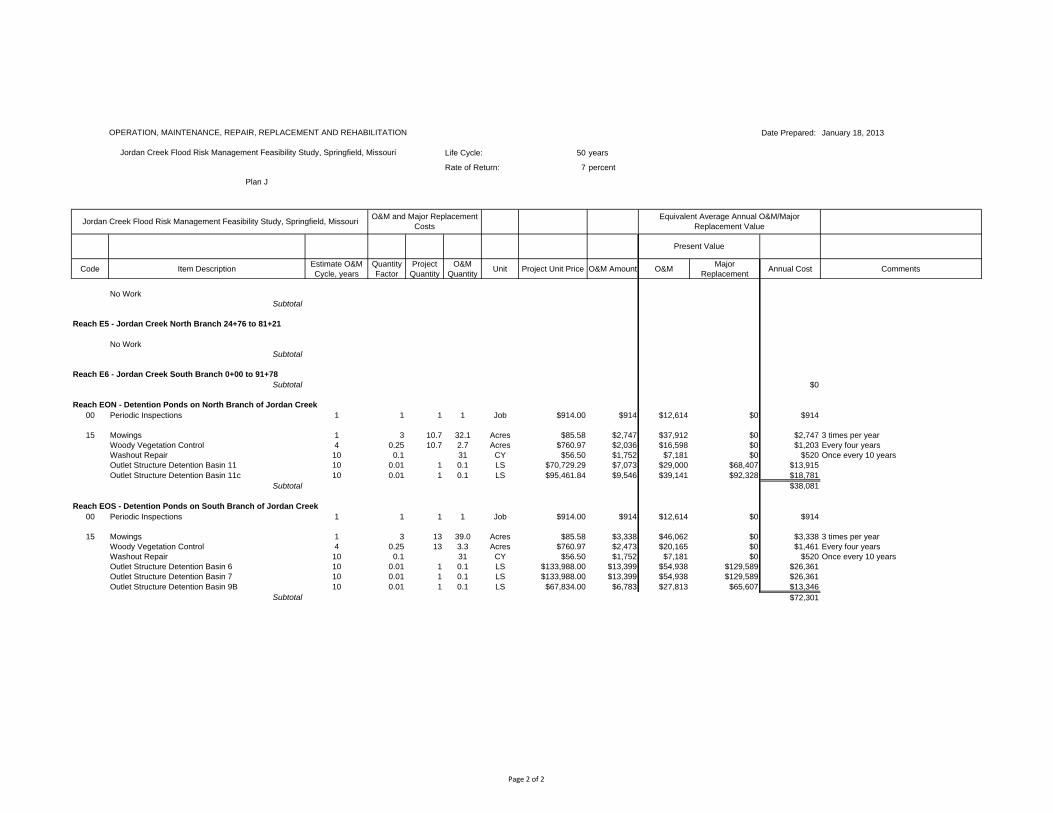
OPERATION, MAINTENANCE, REPAIR, REPLACEMENT AND REHABILITATION
Jordan Creek Flood Risk Management Feasibility Study, Springfield, Missouri
Plan J
Jordan Creek Flood Risk Management Feasibility Study, Springfield, MissouriO&M and Major Replacement
CostsEquivalent Average Annual O&M/Major
Replacement Value
Page 1 of 2
Date Prepared: January 18, 2013
Life Cycle: 50 years
Rate of Return: 7 percent
Code Item DescriptionEstimate O&M Cycle, years
Quantity Factor
Project Quantity
O&M Quantity
Unit Project Unit Price O&M Amount O&MMajor
ReplacementAnnual Cost Comments
Present Value
OPERATION, MAINTENANCE, REPAIR, REPLACEMENT AND REHABILITATION
Jordan Creek Flood Risk Management Feasibility Study, Springfield, Missouri
Plan J
Jordan Creek Flood Risk Management Feasibility Study, Springfield, MissouriO&M and Major Replacement
CostsEquivalent Average Annual O&M/Major
Replacement Value
No WorkSubtotal
Reach E5 - Jordan Creek North Branch 24+76 to 81+21
No WorkSubtotal
Reach E6 - Jordan Creek South Branch 0+00 to 91+78Subtotal $0
Reach EON - Detention Ponds on North Branch of Jordan Creek00 Periodic Inspections 1 1 1 1 Job $914.00 $914 $12,614 $0 $914
15 Mowings 1 3 10.7 32.1 Acres $85.58 $2,747 $37,912 $0 $2,747 3 times per yearWoody Vegetation Control 4 0.25 10.7 2.7 Acres $760.97 $2,036 $16,598 $0 $1,203 Every four yearsWashout Repair 10 0.1 31 CY $56.50 $1,752 $7,181 $0 $520 Once every 10 yearsOutlet Structure Detention Basin 11 10 0.01 1 0.1 LS $70,729.29 $7,073 $29,000 $68,407 $13,915Outlet Structure Detention Basin 11c 10 0.01 1 0.1 LS $95,461.84 $9,546 $39,141 $92,328 $18,781
Subtotal $38,081
Reach EOS - Detention Ponds on South Branch of Jordan Creek00 Periodic Inspections 1 1 1 1 Job $914.00 $914 $12,614 $0 $914
15 Mowings 1 3 13 39.0 Acres $85.58 $3,338 $46,062 $0 $3,338 3 times per yearWoody Vegetation Control 4 0.25 13 3.3 Acres $760.97 $2,473 $20,165 $0 $1,461 Every four yearsWashout Repair 10 0.1 31 CY $56.50 $1,752 $7,181 $0 $520 Once every 10 yearsOutlet Structure Detention Basin 6 10 0.01 1 0.1 LS $133,988.00 $13,399 $54,938 $129,589 $26,361Outlet Structure Detention Basin 7 10 0.01 1 0.1 LS $133,988.00 $13,399 $54,938 $129,589 $26,361Outlet Structure Detention Basin 9B 10 0.01 1 0.1 LS $67,834.00 $6,783 $27,813 $65,607 $13,346
Subtotal $72,301
Page 2 of 2

ID Task Name Duration Start Finish Predecessors
1 Springfield, MO Flood Risk Mgt Project -Plan J W/O Rea 1108 days Mon 9/30/13 Fri 3/2/18
2 Complete Feasibility Study 0 days Mon 9/30/13 Mon 9/30/13
3 Receive Congressional Authorization 0 days Tue 12/31/13 Tue 12/31/13
4 Sign the Project Partnership Agreement 1 day Tue 2/18/14 Tue 2/18/14 3FS+33 days
5 Appropriations for PED 44 days Wed 2/19/14 Tue 4/22/14 4
6 Implementation Period 968 days Wed 4/23/14 Fri 3/2/18 5
7 PED 18 mons Wed 4/23/14 Wed 11/18/15
8 Phase 1 594 days Wed 8/27/14 Tue 1/10/17
9 Detention Basin 11 Construction 286 days Wed 8/27/14 Fri 10/16/15
10 Lands & Damages 88 days Wed 8/27/14 Mon 1/5/15 7SS+88 days
11 Relocations 0 mons Tue 12/2/14 Tue 12/2/14 10SS+66 days
12 Detention Basin 11 Construction 88 days Fri 6/12/15 Fri 10/16/15 11SS+132 days
13 Detention Basin 11c Construction 242 days Tue 1/6/15 Mon 12/21/15
14 Lands & Damages 88 days Tue 1/6/15 Mon 5/11/15 10
15 Relocations 0 mons Thu 4/9/15 Thu 4/9/15 14SS+66 days
16 Detention Basin 11c Construction 44 days Mon 10/19/15 Mon 12/21/15 15SS+132 days
17 Detention Basin 6 Construction 231 days Tue 5/12/15 Tue 4/12/16
18 Lands & Damages 88 days Tue 5/12/15 Tue 9/15/15 14
19 Relocations 0 mons Thu 8/13/15 Thu 8/13/15 18SS+66 days
20 Detention Basin 6 Construction 33 days Fri 2/26/16 Tue 4/12/16 19SS+132 days
21 Detention Basin 7 Construction 330 days Wed 9/16/15 Tue 1/10/17
22 Lands & Damages 88 days Wed 9/16/15 Mon 1/25/16 18
23 Relocations 132 days Tue 12/22/15 Wed 6/29/16 22SS+66 days
24 Detention Basin 7 Construction 132 days Thu 6/30/16 Tue 1/10/17 23SS+132 days
25 Detention Basin 9B Construction 220 days Tue 1/26/16 Wed 12/7/16
9/30
12/31
12/2
4/9
8/13
tr tr tr tr tr tr tr tr tr tr tr tr tr tr tr tr tr tr tr tr tr tr tr tr 2013 2014 2015 2016 2017 2018
Task
Split
Progress
Milestone
Summary
Project Summary
External Tasks
External Milestone
Deadline
20121205 Plan J Without Buyouts Construction Schedule, Jordan Creek, Springfield, MO FRM Feasibility Study 354082
Page 1 of 2
Project: 20121205 Plan J Without BuyoDate: Wed 12/5/12

ID Task Name Duration Start Finish Predecessors
26 Lands & Damages 88 days Tue 1/26/16 Fri 5/27/16 22
27 Detention Basin 9B Construction 132 days Tue 5/31/16 Wed 12/7/16 26
28 Phase II 440 days Fri 11/20/15 Fri 8/18/17
29 Reach 1 440 days Fri 11/20/15 Fri 8/18/17
30 Final Design Reach 1 88 days Fri 11/20/15 Mon 3/28/16 7
31 Lands & Damages 10 mons Fri 2/26/16 Tue 1/10/17 30SS+66 days
32 Relocations 5 mons Tue 5/31/16 Thu 11/3/16 31SS+66 days
33 Reach 1 Project Construction 7 mons Wed 1/11/17 Fri 8/18/17 31,32SS+132 days
34 Project Closeout 66 days Mon 8/21/17 Fri 11/24/17 33
35 Final project accounting 66 days Mon 11/27/17 Fri 3/2/18 34
tr tr tr tr tr tr tr tr tr tr tr tr tr tr tr tr tr tr tr tr tr tr tr tr 2013 2014 2015 2016 2017 2018
Task
Split
Progress
Milestone
Summary
Project Summary
External Tasks
External Milestone
Deadline
20121205 Plan J Without Buyouts Construction Schedule, Jordan Creek, Springfield, MO FRM Feasibility Study 354082
Page 2 of 2
Project: 20121205 Plan J Without BuyoDate: Wed 12/5/12