molecular adaptation mechanisms of phototrophic sulfur ... · various organisms compete for this...
TRANSCRIPT
Molecular adaptation mechanisms of phototrophic sulfur
bacteria to different light conditions
Dissertation der Fakultät für Biologie
der Ludwig-Maximilian-Universität München
vorgelegt von
Ovidiu Ludwig Rücker
am 21.12.2011

1. Gutachter: Prof. Dr. Jörg Overmann
2. Gutachter: Prof. Dr. Dirk Schüler
Tag der mündlichen Prüfung: 09. Juli 2012
Contents
SUMMARY ................................................................................................................................ - 1 -
INTRODUCTION ...................................................................................................................... - 4 -
Adaptation of Chromatiaceae to specific wavelengths of light .............................................. - 6 -
Adaptation of Chlorobiaceae to low light conditions ........................................................... - 11 -
MATERIAL AND METHODS ................................................................................................ - 16 -
Adaptation of Chromatiaceae toward absorption of specific wavelengths of light .............. - 16 -
Cultivation and extraction of DNA ................................................................................... - 16 -
PCR amplification and cloning of photosynthesis genes .................................................. - 17 -
Transcriptional analysis ..................................................................................................... - 22 -
Cloning of environmental puf sequences ........................................................................... - 23 -
Sequence analyses ............................................................................................................. - 24 -
Modeling of three-dimensional structures ......................................................................... - 24 -
Chlorobiaceae and the adaptation to low light conditions .................................................... - 26 -
Cultivation of Chlorobiaceae ............................................................................................ - 26 -
In silico subtractive hybridization analysis ....................................................................... - 27 -
Prokaryotic cDNA suppression subtractive hybridisation (cDNA-SSH) .......................... - 27 -
Illumina cDNA sequencing ............................................................................................... - 29 -
Characterization of Chlorobiaceae from the chemocline of Lake Faro ............................ - 30 -
Identification of carotenoids and fossil DNA in sediments ............................................... - 32 -
Distribution of Chlorobiaceae in the chemocline of Lake Sakinaw ................................. - 34 -
RESULTS ................................................................................................................................. - 36 -
Adaptation of Chromatiaceae toward absorption of specific wavelengths of light .............. - 36 -
Structure of the puf operon in strain 970 ........................................................................... - 36 -
Structure of the puf operon in Trv. winogradskyi strains 06511 and DSM6702T ............. - 43 -
Transcriptional analysis of the puf operon in strain 970 ................................................... - 48 -
Comparative analysis of the Puf polypeptides ................................................................. - 50 -
Structural models for the LHC1 polypeptides ................................................................... - 53 -
Phylogenetic relationship of LHC1 and RC sequences ..................................................... - 55 -
The adaptation of Chlorobiaceae to growth at low light conditions..................................... - 59 -
Identification and classification of genes unique to the BS1 genome ............................... - 59 -
Transcriptional analysis of cultures grown under different light conditions ..................... - 60 -
Characterization of Chlorobiaceae from the chemocline of Lake Faro ............................ - 67 -
Distribution of molecular markers in sediments................................................................ - 71 -
Distribution of Chlorobiaceae in the chemocline of Lake Sakinaw ................................. - 76 -
DISCUSSION ........................................................................................................................... - 78 -
Adaptation of Chromatiaceae toward absorption of specific wavelengths of light .............. - 78 -
Structure of the puf operons in strain 970 and Trv. winogradskyi ..................................... - 78 -
Transcriptional regulation of the puf operon in strain 970 ................................................ - 79 -
Significance of amino-acid substitutions in the LHC1 polypeptides ................................ - 80 -
Phylogeny of the unusual LHC1 in strain 970 .................................................................. - 82 -
The adaptation of Chlorobiaceae to growth at low light conditions..................................... - 84 -
Genes up-regulated under high light condition ................................................................. - 85 -
Genes up-regulated under low light condition .................................................................. - 90 -
Distribution of Chlorobiaceae in different chemoclines and their molecular markers in
marine sediments ............................................................................................................... - 94 -
Conclusions ........................................................................................................................... - 98 -
APPENDIX ............................................................................................................................. - 101 -
REFERENCES ....................................................................................................................... - 119 -
Publications ............................................................................................................................. - 130 -
Danksagung............................................................................................................................. - 131 -
Curriculum vitae ..................................................................................................................... - 132 -
Summary
- 1 -
SUMMARY
The dependence on the simultaneous presence of light and sulfide typically restricts phototrophic
sulfur bacteria to areas well below the surface of water or sediments. Various organisms compete
for this main energy source, which led to the evolution of different strategies for the development
of advantageous phenotypic traits.
Purple sulfur bacteria display various light absorption patterns, mainly due to the usage of
different pigments integrated in their light harvesting complexes (LHC). Additionally, changes in
the light absorption pattern can also occur, if the structure of proteins involved in the interaction
with pigments is altered. The light harvesting complex 1 (LHC1) of strain 970 exhibits a unique
absorption spectrum with an absorption peak at 963 nm. Its closest relatives, Thiorhodovibrio
(Trv.) winogradskyi DSM6702T and strain 06511 display a absorption peak at 867 nm, that is
characteristic for most proteobacteria with an LHC 1 which is associated with BChla. As a first
step toward the identification of the structural basis for this characteristic, the operon structure
and the nucleotide sequences of the puf genes were determined and an analysis of their
transcription in strain 970 was performed. The puf operons encoding the LHC1 and reaction
center proteins were amplified, cloned and sequenced. For the Trv. winogradskyi strains they
show the common pufBALMC gene arrangement, whereas strain 970 contains a second pufBA
copy downstream of pufC. In strain 970 only pufB1A1 is transcribed and the corresponding
mRNA fragment had an increased stability. Candidate amino acids involved in the extreme red-
shift of the Qy absorption band in strain 970 were identified by comparing the inferred amino
acid sequences of the LHC1 polypeptides with those of the two phylogenetically closest
relatives, Trv. winogradskyi strains DSM6702T and 06511, as well as with those of more
distantly related purple sulfur bacteria. Alignments of the deduced protein sequences showed that
the LHC1 polypeptides are closely related to those of Thermochromatium (Tch.) tepidum. A
deletion between αHis0 and αTrp
+11, thought to be responsible for the red shifted Qy absorption
in Tch. tepidum was also detected in strain 970 and Trv. winogradskyi, whereas αLys+12
is
replaced by histidine only in strain 970. Based on our structural modeling, the side chain of this
αHis is predicted to be in close proximity to the BChla, suggesting that it exerts a modulating
effect on the spectral properties of the highly unusual LHC1 complex of strain 970. Since no

Summary
- 2 -
other Chromatiaceae with extremely red-shifted QY absorption bands have been reported so far,
the presence of bacteria related to strain 970 was assessed in a series of environmental samples
from tidal sediments in the Little Sippewissett Saltmarsh. No pufLM sequences clustering
together with strain 970 and the two Trv. winogradskyi sequences were detected.
The ability of Chl. phaeobacteroides BS1 to grow in the chemocline of the Black Sea where
light intensities are very low compared to other habitats raises the question about the
maintenance requirements and adaptational abilities of this bacterium. When compared to the 11
other green sulfur bacterial (GSB) genomes as a whole, a total of 331 ORFs were identified to be
unique for the Chl. phaeobacteroides BS1 of which 222 ORFs code for hypothetical proteins
with unknown functions. Employing different growth conditions regarding light availability to
BS1 cultures as a model system, the present comparative genomic and transcriptomic study
yielded a first inventory of genes with potential relevance to adaptation at low light intensities.
Many of the 135 down regulated genes identified for low light condition, are part of major
metabolic pathways like nitrogen fixation, molybdenum transport, molybdenum cofactor
biosynthesis, phosphate transport or biotin synthesis. These operons code for enzymes involved
in pathways with elevated energy requirement which seem not to be essential under conditions
like low light availability. Additionally, some of the genes with multiple copies are also being
down regulated which is expected to decrease maintenance energy requirements. Nevertheless,
the transcriptome of Chl. phaeobacteroides BS1 still contains transcripts of a majority of the
identified 2524 ORFs in the genome under low light condition. In comparison to cultures grown
under higher light intensities, 76 genes involved in general stress response, transcription
regulation and energy production are being up regulated inferring potential relevance for
adaptation at low light intensities. But still most of the differentially regulated genes are coding
for hypothetical proteins with unknown function. Through these investigations many of the
genes belonging to this category could for the first time be affiliated to a physiological condition.
The identification of another Chlorobi strain adapted to low light intensities in the chemocline
of Lake Sakinaw opens a new perspective in investigating this trait. Measurements of BChl e
concentrations together with the concentration of ITS-RNA copies in the cell reflects the
abundance and activity of this bacterium in different depths of the chemocline. A clear
correlation with available light intensities in the chemocline has been observed.
Summary
- 3 -
In the chemocline of Lake Faro three different Chlorobi strains could be identified through
GSB specific 16S rRNA PCR amplification and sequencing. One strain revealed 100% identical
16S rRNA nucleotide sequence information to Chl. phaeobacteroides BS1 present in the Black
Sea chemocline. Further sequence analysis showed that the internal transcribed spacer (ITS)
region of both strains differed in their nucleotide sequence composition. All strains were shown
to persist over a longer period of time with slight shifts of distribution during the sampling
period.
The investigation of sediment samples for fossil molecular markers specific for GSB like the
carotenoid isorenieratene is often used as indicator of past water column anoxia (Passier et al.,
1999; Menzel et al., 2002). The concentration of the carotenoid isorenieratene was measured in
sediment samples from different locations in the Black Sea and Mediterranean Sea. In all
investigated samples isorenieratene was detected, also in recently deposited sediments where the
presence of an extended water anoxia reaching to the photic zone can definitely be excluded.
This finding reconfirms the assumption that deposited isorenieratene can originate from
allochthonous sources (Coolen and Overmann, 2007) and shows the importance of the usage of
fossil DNA markers. Phylogenetic comparison of fossil DNA sequences of the ITS region with
nucleotide sequences from recent bacterial populations of Chl. phaeobacteroides BS1 from the
Black Sea and Lake Faro was also performed. It revealed a closer relationship between the
extinct Mediterranean BS1 population and the green sulfur bacteria present now in the
chemocline of the Black Sea. Therefore the BS1 strain found in Lake Faro represents a lineage
which was geographically isolated much earlier from the Black Sea lineage, as the time of the
sediment deposition 172.000 years ago.
Introduction
- 4 -
INTRODUCTION
Sun light is the main source of energy present on our planet and its radiation is utilized by
various forms of organisms capable of performing photosynthesis. On the way through the earth
atmosphere, over 50% of the total amount of radiation is scattered or absorbed, and only an
average of 160 W m-2
is reaching the earth surface (Gates, 1965; Dietrich et al., 1975). In order
to make use of this energy, organisms have to capture electromagnetic energy and transform it
into chemical energy, for the purpose of cellular maintenance and growth. Today, terrestrial
higher plants represent the majority of photosynthetic active biomass, but marine phototrophs,
although resembling much lower biomass, show a higher turnover thus contributing significantly
to total primary productivity. Marine photoautotrophs are a diverse group with green, red, and
brown seaweeds along coasts; diatoms, dinoflagellates, and coccolithophorids dominating shelf
phytoplankton; and cyanobacterial and green picoplankton in oligotrophic mid-ocean
environments. The latter represent prokaryotic organisms of which the unicellular cyanobacterial
strains Prochlorococcus and Synechococcus may be responsible for the fixation of as much as
10-25% of the global primary productivity (Garcia-Pichel, 1999). Cyanobacteria are the only
prokaryotes which are capable of oxygenic photosynthesis, in contrast to the group of various
anoxygenic phototrophs. Under the present oxic atmosphere, anoxygenic phototrophs represent a
less significant group when seen on global scale, mostly because they are constrained to specific
anoxic habitats. But the diversity of this group leads to a scientific interest, which is based on the
simple molecular architecture, the variety of their photosystems and their implication in the
reconstruction of the evolution of photosynthesis.
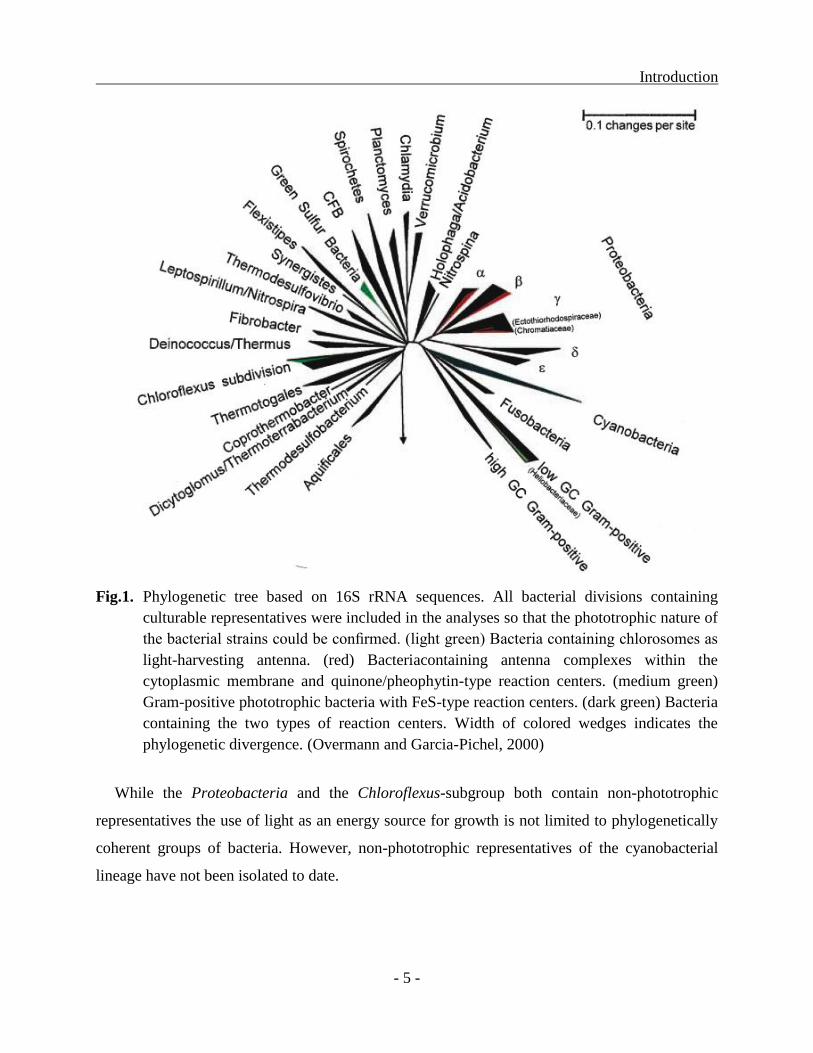
Phototrophic bacteria are found in six of the currently recognized bacterial lineages: the
Chloroflexus subgroup, the green sulfur bacteria (Chlorobiaceae), the Proteobacteria, the
Cyanobacteria, the Chloracidobacteria and the Heliobacteriaceae (Fig. 1). With the exception
of the Cyanobacteria, phototrophic bacteria perform anoxygenic photosynthesis. This light
mediated form of energy acquisition uses various substrates, mainly H2S, but also S0, S2O3
2-,
Fe2+
or NO2- as external electron donors. Therefore it is not accompanied by photochemical
cleavage of water and does not lead to the formation of molecular oxygen.
Introduction
- 5 -
Fig.1. Phylogenetic tree based on 16S rRNA sequences. All bacterial divisions containing
culturable representatives were included in the analyses so that the phototrophic nature of
the bacterial strains could be confirmed. (light green) Bacteria containing chlorosomes as
light-harvesting antenna. (red) Bacteriacontaining antenna complexes within the
cytoplasmic membrane and quinone/pheophytin-type reaction centers. (medium green)
Gram-positive phototrophic bacteria with FeS-type reaction centers. (dark green) Bacteria
containing the two types of reaction centers. Width of colored wedges indicates the
phylogenetic divergence. (Overmann and Garcia-Pichel, 2000)
While the Proteobacteria and the Chloroflexus-subgroup both contain non-phototrophic
representatives the use of light as an energy source for growth is not limited to phylogenetically
coherent groups of bacteria. However, non-phototrophic representatives of the cyanobacterial
lineage have not been isolated to date.
Introduction
- 6 -
Adaptation of Chromatiaceae to specific wavelengths of light
Purple sulfur bacteria are anoxygenic phototrophs belonging to the phylum Proteobacteria,
which occur primarily in stratified environments, where sufficient light reaches sulfide-
containing water or sediment layers. In lakes harboring these bacteria, an average of 28.7% of
primary production is anoxygenic (Overmann, 1997). The dependence of this pathway on
reduced inorganic sulfur compounds which originate from the anaerobic degradation of organic
carbon, previously fixed by oxygenic photosynthesis, has led to the term secondary primary
production (Pfennig, 1978). Besides the limiting factors such as the availability of reduced sulfur
compounds, organic carbon substrates, absence of oxygen, temperature and availability of
nutrients, the availability and quality of light reaching these niches is another major determinant
of the presence and composition of anoxygenic phototrophic communities. Depending on the
position of these specific habitats, penetrating light lacks certain regions of its spectrum, due to
scattering or absorption in the layers above. Being constrained to these anoxic environments,
anoxygenic phototrophs had to adapt to performing photosynthesis with light that reaches their
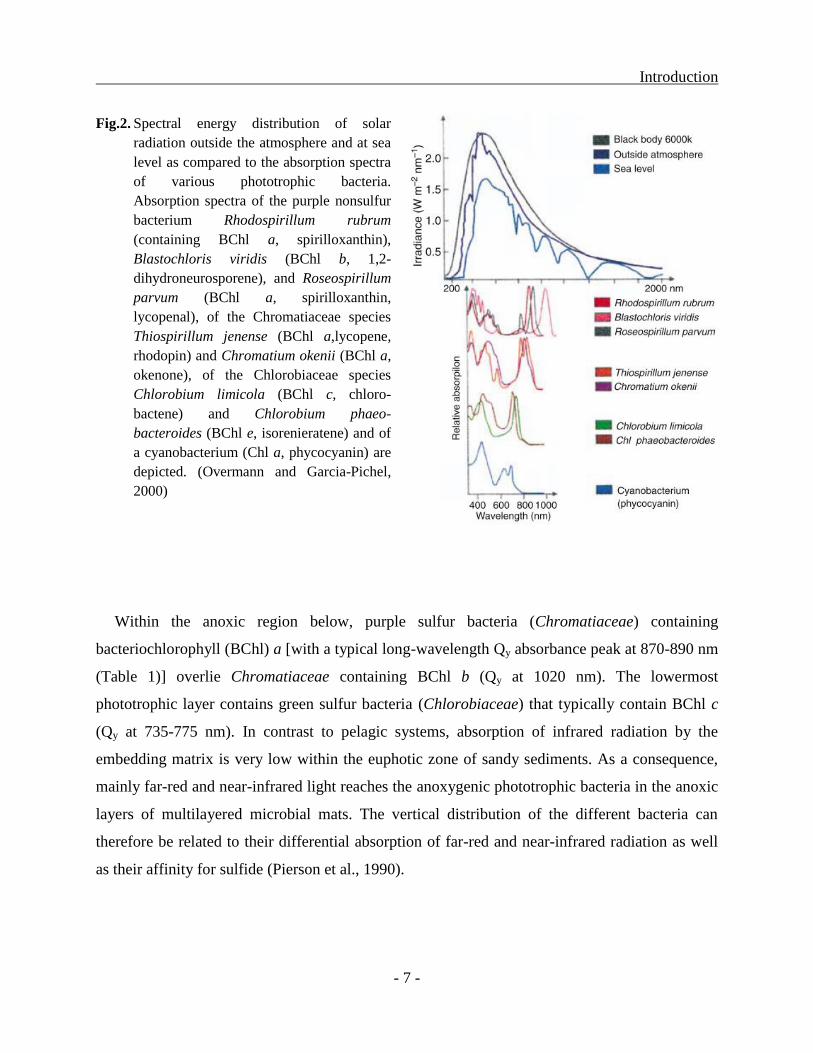
habitats. At sea level, light of the wavelength between 400 to 700 nm represents 50% of this
irradiation (Fig. 2), mainly due to water vapor absorbing infrared light. In aquatic habitats, water
is the major light-absorbing component only in very clear open ocean and inland lakes. Blue
light is predominant, but between the wavelengths where water molecules absorb light (for
example between 750 and 900nm) there are still niches available (Stomp et al., 2007). In many
lacustrine and coastal habitats, light absorption by phytoplankton, or of other dissolved
substances like gilvin and humic acids, exceeds that of water itself, leading to the prevalence of
the long wavelength portion of the spectrum (Kirk, 1983).
This limited wavelength range available at great depth selects for species of anoxygenic
phototrophic bacteria with complementary absorption spectra. The competition for light lead to
the prevalence of species using different pigments and light harvesting antenna for the absorption
of available light spectra (Fig. 2). Another habitat for anoxygenic phototrophs are intertidal
marine sandy sediments, which harbor complex, fine-layered microbial mats that predominantly
consist of a vertical sequence of different types of phototrophic microorganisms (Nicholson et al.
1987). The top layer is formed by a layer of diatoms, followed by a layer of cyanobacteria.
Introduction
- 7 -
Fig.2. Spectral energy distribution of solar
radiation outside the atmosphere and at sea
level as compared to the absorption spectra
of various phototrophic bacteria.
Absorption spectra of the purple nonsulfur
bacterium Rhodospirillum rubrum
(containing BChl a, spirilloxanthin),
Blastochloris viridis (BChl b, 1,2-
dihydroneurosporene), and Roseospirillum
parvum (BChl a, spirilloxanthin,
lycopenal), of the Chromatiaceae species
Thiospirillum jenense (BChl a,lycopene,
rhodopin) and Chromatium okenii (BChl a,
okenone), of the Chlorobiaceae species
Chlorobium limicola (BChl c, chloro-
bactene) and Chlorobium phaeo-
bacteroides (BChl e, isorenieratene) and of
a cyanobacterium (Chl a, phycocyanin) are
depicted. (Overmann and Garcia-Pichel,
2000)
Within the anoxic region below, purple sulfur bacteria (Chromatiaceae) containing
bacteriochlorophyll (BChl) a [with a typical long-wavelength Qy absorbance peak at 870-890 nm
(Table 1)] overlie Chromatiaceae containing BChl b (Qy at 1020 nm). The lowermost
phototrophic layer contains green sulfur bacteria (Chlorobiaceae) that typically contain BChl c
(Qy at 735-775 nm). In contrast to pelagic systems, absorption of infrared radiation by the
embedding matrix is very low within the euphotic zone of sandy sediments. As a consequence,
mainly far-red and near-infrared light reaches the anoxygenic phototrophic bacteria in the anoxic
layers of multilayered microbial mats. The vertical distribution of the different bacteria can
therefore be related to their differential absorption of far-red and near-infrared radiation as well
as their affinity for sulfide (Pierson et al., 1990).
Introduction
- 8 -
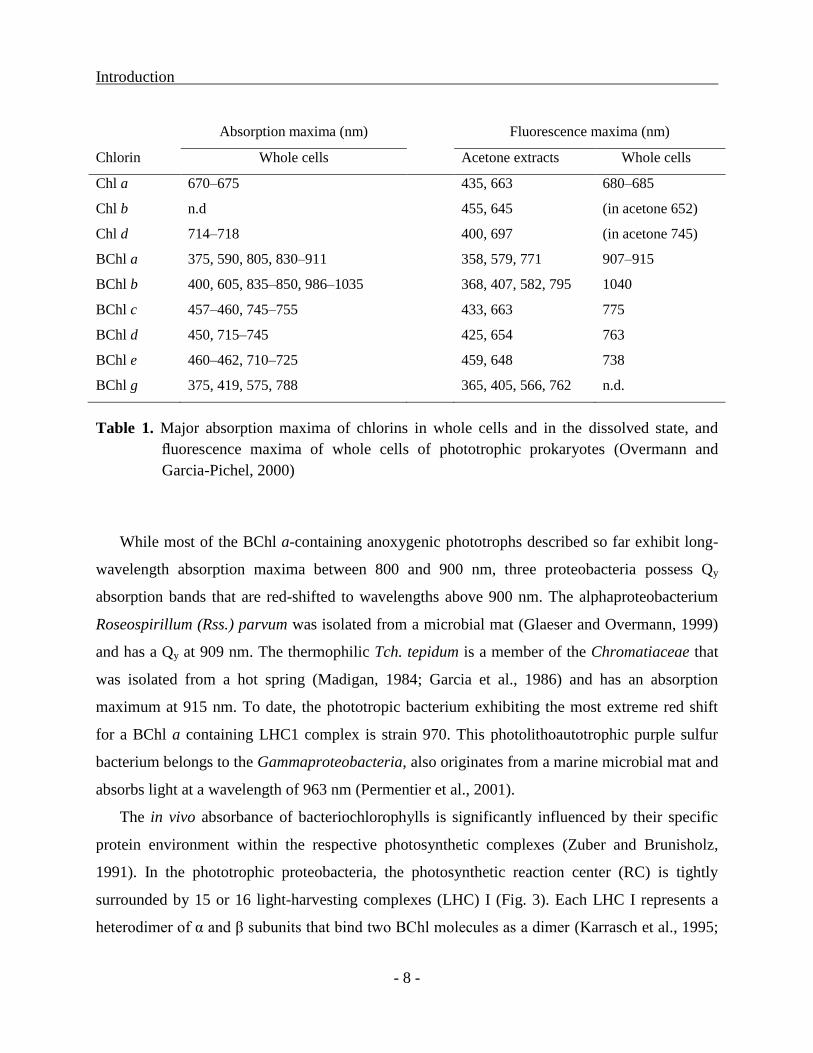
Absorption maxima (nm) Fluorescence maxima (nm)
Chlorin Whole cells Acetone extracts Whole cells
Chl a 670–675 435, 663 680–685
Chl b n.d 455, 645 (in acetone 652)
Chl d 714–718 400, 697 (in acetone 745)
BChl a 375, 590, 805, 830–911 358, 579, 771 907–915
BChl b 400, 605, 835–850, 986–1035 368, 407, 582, 795 1040
BChl c 457–460, 745–755 433, 663 775
BChl d 450, 715–745 425, 654 763
BChl e 460–462, 710–725 459, 648 738
BChl g 375, 419, 575, 788 365, 405, 566, 762 n.d.
Table 1. Major absorption maxima of chlorins in whole cells and in the dissolved state, and
fluorescence maxima of whole cells of phototrophic prokaryotes (Overmann and
Garcia-Pichel, 2000)
While most of the BChl a-containing anoxygenic phototrophs described so far exhibit long-
wavelength absorption maxima between 800 and 900 nm, three proteobacteria possess Qy
absorption bands that are red-shifted to wavelengths above 900 nm. The alphaproteobacterium
Roseospirillum (Rss.) parvum was isolated from a microbial mat (Glaeser and Overmann, 1999)
and has a Qy at 909 nm. The thermophilic Tch. tepidum is a member of the Chromatiaceae that
was isolated from a hot spring (Madigan, 1984; Garcia et al., 1986) and has an absorption
maximum at 915 nm. To date, the phototropic bacterium exhibiting the most extreme red shift
for a BChl a containing LHC1 complex is strain 970. This photolithoautotrophic purple sulfur
bacterium belongs to the Gammaproteobacteria, also originates from a marine microbial mat and
absorbs light at a wavelength of 963 nm (Permentier et al., 2001).
The in vivo absorbance of bacteriochlorophylls is significantly influenced by their specific
protein environment within the respective photosynthetic complexes (Zuber and Brunisholz,
1991). In the phototrophic proteobacteria, the photosynthetic reaction center (RC) is tightly
surrounded by 15 or 16 light-harvesting complexes (LHC) I (Fig. 3). Each LHC I represents a
heterodimer of α and β subunits that bind two BChl molecules as a dimer (Karrasch et al., 1995;
Introduction
- 9 -
Roszak et al., 2003) via the highly conserved αHis0 and βHis
0 histidine residues (Zuber and
Cogdell, 1995). The van der Waals interaction of the BChl molecules has the largest impact on
the red shift of the absorption band (Cogdell et al., 2002). Additionally, polar residues and point
charges in the local pigment environment (Eccles and Honig, 1983), the deformation of the BChl
macrocycle (Cogdell et al., 2002), and hydrogen bonding to the BChl macrocycle (Gudowska-
Nowak et al., 1990) influence the position of the Qy absorption.
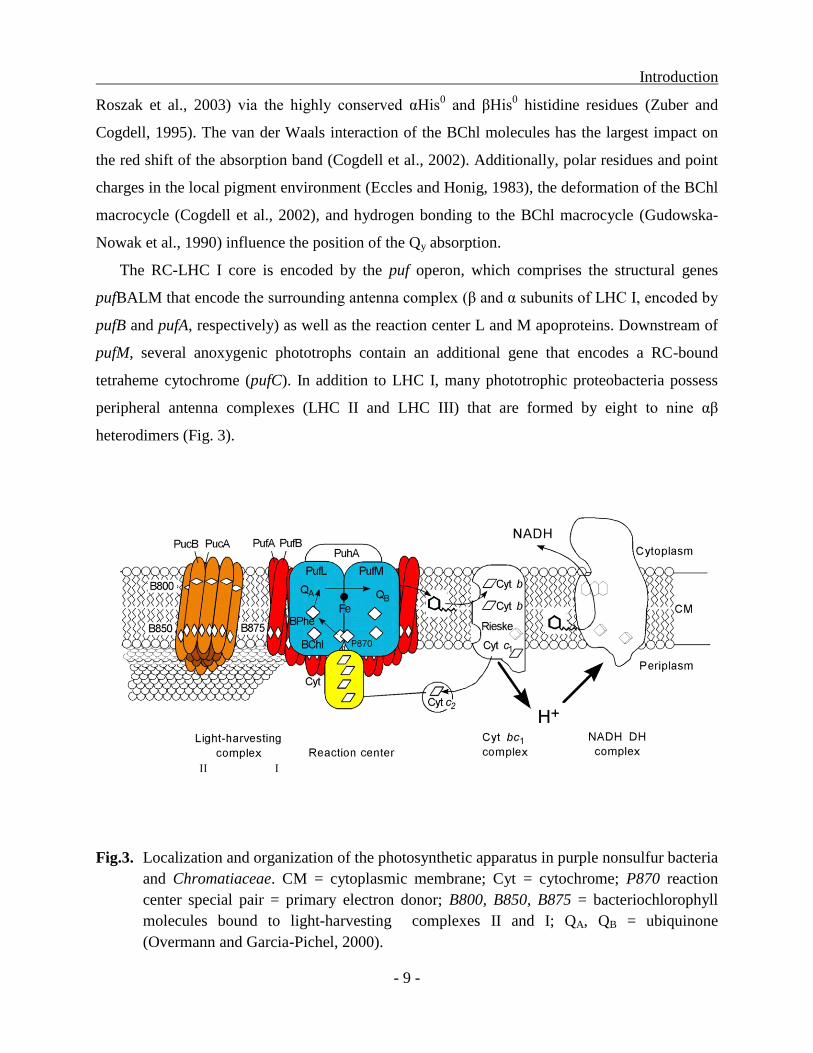
The RC-LHC I core is encoded by the puf operon, which comprises the structural genes
pufBALM that encode the surrounding antenna complex (β and α subunits of LHC I, encoded by
pufB and pufA, respectively) as well as the reaction center L and M apoproteins. Downstream of
pufM, several anoxygenic phototrophs contain an additional gene that encodes a RC-bound
tetraheme cytochrome (pufC). In addition to LHC I, many phototrophic proteobacteria possess
peripheral antenna complexes (LHC II and LHC III) that are formed by eight to nine αβ
heterodimers (Fig. 3).
Fig.3. Localization and organization of the photosynthetic apparatus in purple nonsulfur bacteria
and Chromatiaceae. CM = cytoplasmic membrane; Cyt = cytochrome; P870 reaction
center special pair = primary electron donor; B800, B850, B875 = bacteriochlorophyll
molecules bound to light-harvesting complexes II and I; QA, QB = ubiquinone
(Overmann and Garcia-Pichel, 2000).

Introduction
- 10 -
The heterodimers in these peripheral complexes (β and α subunits of LHC II, encoded by
pucB and pucA, respectively) contain one monomeric BChl molecule in addition to the BChl
dimer (McLuskey et al., 2001). Whereas the monomeric BChl a in both complexes absorbs at
800 nm (Zuber and Brunisholz, 1991; Cogdell et al., 1999), the absorption maxima of the
dimeric BChl a arrays in LHC II and LHC III are positioned at 850 and 820 nm, respectively,
which enables an efficient funneling of excitation energy toward the photosynthetic reaction
center (Zuber and Brunisholz, 1991; McLuskey et al., 2001).

Introduction
- 11 -
Adaptation of Chlorobiaceae to low light conditions
Because phototrophic sulfur bacteria require the presence of light and sulfide for optimal growth,
they are restricted to environments located well below the surface of water or sediments.
Consequently, the light energy reaching these deeper layers represents a rather low percentage in
the range of 0.02 and 10% of surface light intensity in pelagic environments (Van Gemerden and
Mas, 1995). Selective pressure for efficient light harvesting and maximum quantum yield is
therefore highly elevated when light represents the main variable controlling anoxygenic
photosynthesis.
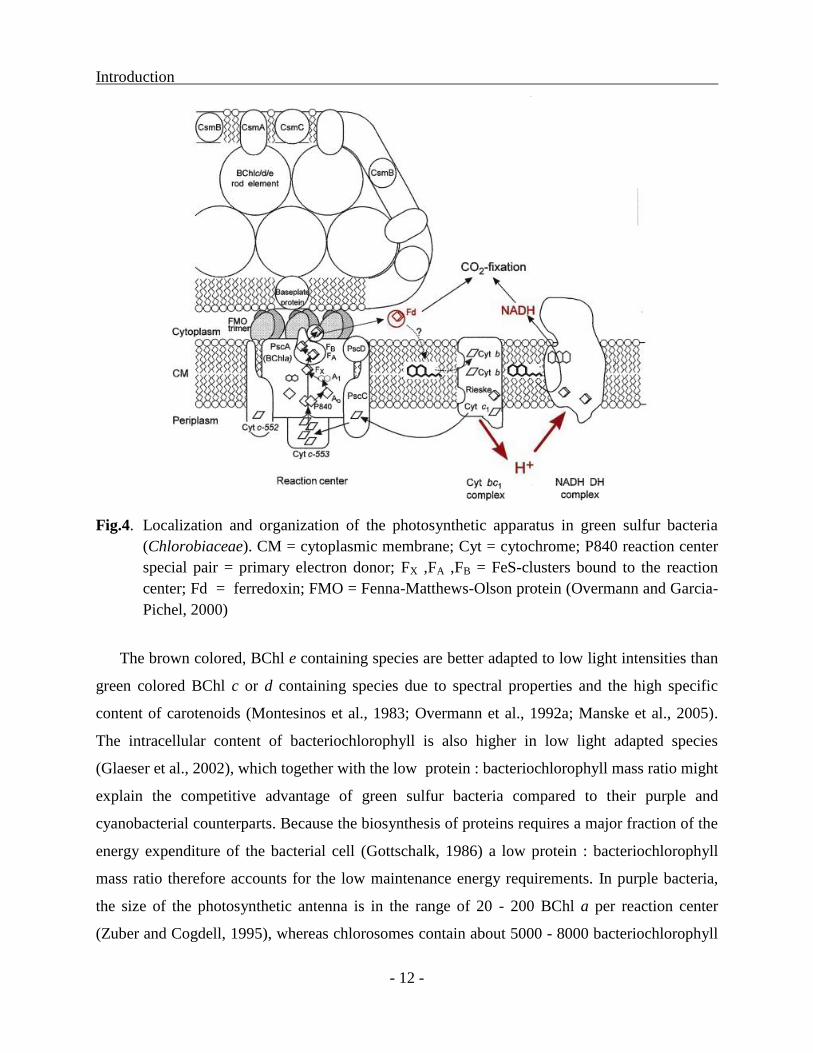
Green sulfur bacteria are well adapted to such low light habitats due to their large
photosynthetic antennae (Fig. 4), their low maintenance energy requirements and higher sulfide
tolerance (Overmann and Garcia-Pichel, 2000). The large light harvesting complexes of green
sulfur bacteria are pigment carrying organelles, called chlorosomes (Olson, 1998). These contain
bacteriochlorophylls c, d or e with carotenoids as antenna pigments and are attached to the inner
cytoplasmic membrane via a baseplate consisting of trimeric proteins called Fenna-Matthews-
Olson (FMO) protein. This FMO protein is an additional antenna complex containing BChl a
which is mediating the energy transfer between the chlorosomes and the reaction center
(Frigaard, 1997). Chlorosomes are exceptional in that proteins do not seem to be involved as
ligands for most of the antenna bacteriochlorophyll molecules. Instead, interactions between the
bacteriochlorophylls themselves determine the absorptive properties of the photosynthetic
antenna in green sulfur bacteria (Blankenship and Matsuura, 2003). Recent investigation using
bioimaging techniques revealed the assembly structure of bacteriochlorophylls inside the
chlorosomes (Ganapathy et al., 2009). The assembly into coaxial cylinders in a new syn-anti
stacking mode forms tubular shaped elements. Through this close packing of BChls a very
efficient transmission of excitation energy is achieved, which is crucial for photosynthetic
growth at very low light intensities. This suprastructure is also optimal for heterogenous side
chains allowing an evolutionary optimization of light harvesting without the need of interacting
proteins. This feature is critical in natural environments that are severely energy limited.
Introduction
- 12 -
Fig.4. Localization and organization of the photosynthetic apparatus in green sulfur bacteria
(Chlorobiaceae). CM = cytoplasmic membrane; Cyt = cytochrome; P840 reaction center
special pair = primary electron donor; FX ,FA ,FB = FeS-clusters bound to the reaction
center; Fd = ferredoxin; FMO = Fenna-Matthews-Olson protein (Overmann and Garcia-
Pichel, 2000)
The brown colored, BChl e containing species are better adapted to low light intensities than
green colored BChl c or d containing species due to spectral properties and the high specific
content of carotenoids (Montesinos et al., 1983; Overmann et al., 1992a; Manske et al., 2005).
The intracellular content of bacteriochlorophyll is also higher in low light adapted species
(Glaeser et al., 2002), which together with the low protein : bacteriochlorophyll mass ratio might
explain the competitive advantage of green sulfur bacteria compared to their purple and
cyanobacterial counterparts. Because the biosynthesis of proteins requires a major fraction of the
energy expenditure of the bacterial cell (Gottschalk, 1986) a low protein : bacteriochlorophyll
mass ratio therefore accounts for the low maintenance energy requirements. In purple bacteria,
the size of the photosynthetic antenna is in the range of 20 - 200 BChl a per reaction center
(Zuber and Cogdell, 1995), whereas chlorosomes contain about 5000 - 8000 bacteriochlorophyll
Introduction
- 13 -
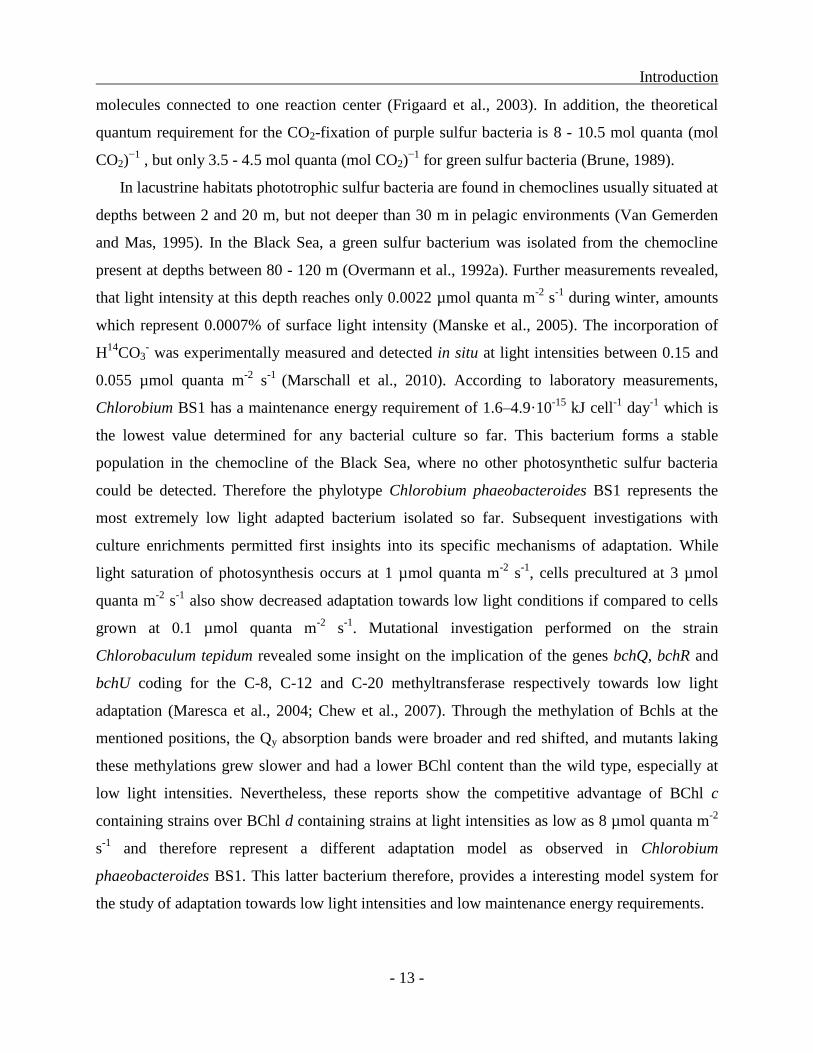
molecules connected to one reaction center (Frigaard et al., 2003). In addition, the theoretical
quantum requirement for the CO2-fixation of purple sulfur bacteria is 8 - 10.5 mol quanta (mol
CO2)−1
, but only 3.5 - 4.5 mol quanta (mol CO2)−1
for green sulfur bacteria (Brune, 1989).
In lacustrine habitats phototrophic sulfur bacteria are found in chemoclines usually situated at
depths between 2 and 20 m, but not deeper than 30 m in pelagic environments (Van Gemerden
and Mas, 1995). In the Black Sea, a green sulfur bacterium was isolated from the chemocline
present at depths between 80 - 120 m (Overmann et al., 1992a). Further measurements revealed,
that light intensity at this depth reaches only 0.0022 µmol quanta m-2
s-1
during winter, amounts
which represent 0.0007% of surface light intensity (Manske et al., 2005). The incorporation of
H14
CO3- was experimentally measured and detected in situ at light intensities between 0.15 and
0.055 µmol quanta m-2
s-1
(Marschall et al., 2010). According to laboratory measurements,
Chlorobium BS1 has a maintenance energy requirement of 1.6–4.9·10-15
kJ cell-1
day-1
which is
the lowest value determined for any bacterial culture so far. This bacterium forms a stable
population in the chemocline of the Black Sea, where no other photosynthetic sulfur bacteria
could be detected. Therefore the phylotype Chlorobium phaeobacteroides BS1 represents the
most extremely low light adapted bacterium isolated so far. Subsequent investigations with
culture enrichments permitted first insights into its specific mechanisms of adaptation. While
light saturation of photosynthesis occurs at 1 µmol quanta m-2
s-1
, cells precultured at 3 µmol
quanta m-2
s-1
also show decreased adaptation towards low light conditions if compared to cells
grown at 0.1 µmol quanta m-2
s-1
. Mutational investigation performed on the strain
Chlorobaculum tepidum revealed some insight on the implication of the genes bchQ, bchR and
bchU coding for the C-8, C-12 and C-20 methyltransferase respectively towards low light
adaptation (Maresca et al., 2004; Chew et al., 2007). Through the methylation of Bchls at the
mentioned positions, the Qy absorption bands were broader and red shifted, and mutants laking
these methylations grew slower and had a lower BChl content than the wild type, especially at
low light intensities. Nevertheless, these reports show the competitive advantage of BChl c
containing strains over BChl d containing strains at light intensities as low as 8 µmol quanta m-2
s-1
and therefore represent a different adaptation model as observed in Chlorobium
phaeobacteroides BS1. This latter bacterium therefore, provides a interesting model system for
the study of adaptation towards low light intensities and low maintenance energy requirements.
Introduction
- 14 -
Today, habitats of sulfur bacteria are scarce and the Black Sea represents the largest anoxic
water body on earth. An oxic top layer of approximatively 60 m is followed by a 40 m thick
suboxic intermediate zone devoid of oxygen and sulfide, beneath which a 2000 m deep anoxic
sulfidic bottom zone can be found (Murray et al., 1989). As a consequence, between 87 and 92%
of the Black Sea water body remain permanently anoxic (Sorokin, 2002). In contrast to today’s
oxygenated oceans, the entire Proterozoic ocean may have consisted of sulfidic deep water
covered by a possibly 100 m thick oxic surface layer (Anbar and Knoll, 2002), conditions which
may have persisted over 1000 million years, and repeatedly occurred during later periods. Due to
the fact that all known green sulfur bacteria are obligate anaerobic photolithoautotrophs, specific
markers occurring only in these bacteria provide the opportunity to reconstruct past ecosystems.
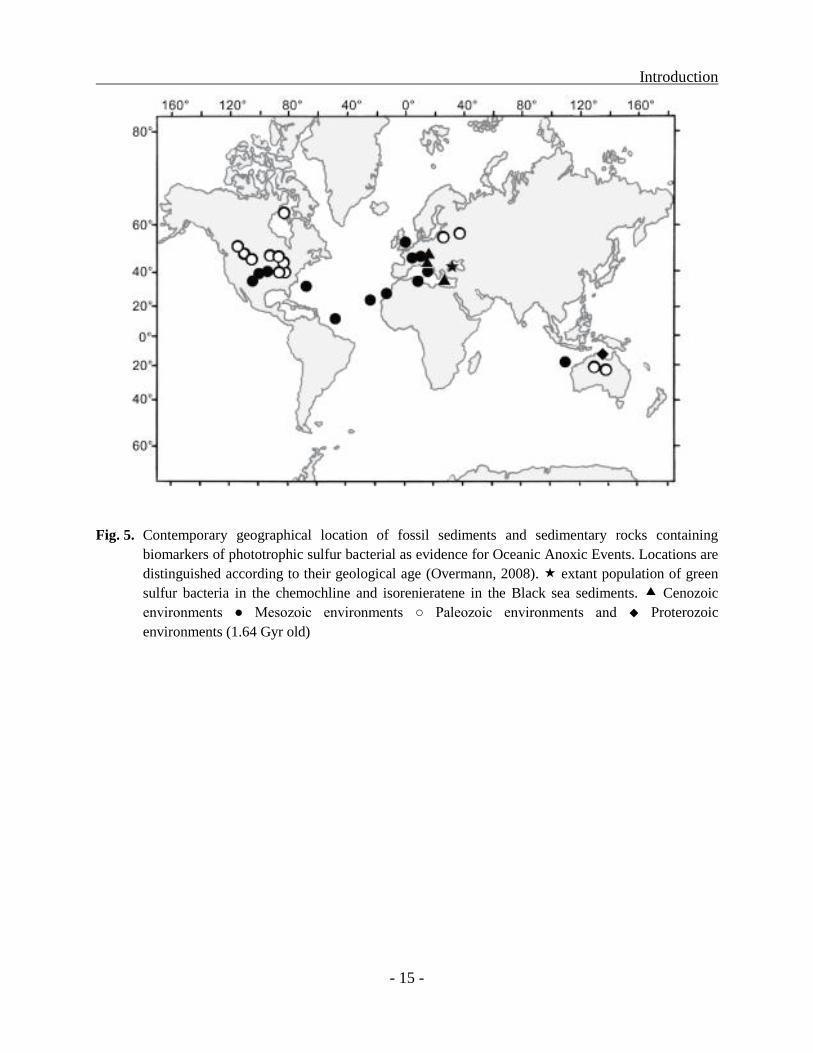
Numerous studies have used the presence of isorenieratene and its geochemical derivatives
(Sinninghe Damste et al., 1993; Passier et al., 1999; Menzel et al., 2002) as evidence for
extended water column anoxia of ancient oceans (Fig. 5). Since it represents a modern analogue
of past water column anoxia, the development of anoxic conditions in the Black Sea has been
studied extensively. Due to the intrusion of saltwater from the Mediterranean via the Bosporus
strait, bottom water anoxia started to develop between 7000 and 8000 years ago (Degens and
Ross, 1972). Subfossil isorenieratene has been identified in up to 6000 year old sediment layers
of the Black Sea (Sinninghe Damste et al., 1993) indicating the occurrence of GSB strains at that
time. Recently, investigations using subfossil 16S rRNA gene sequences retrieved from
sediments enabled a new approach for the reconstruction of past ecosystems. The occurrence of
GSB specific sequences in sediments retrieved from the Black Sea (Manske et al., 2008) and the
Mediterranean (Coolen and Overmann, 2007) was assessed. Fossil DNA could be retrieved and
amplified from sediments up to 217,000 years old. Unexpectedly, however, recovered sequences
grouped with freshwater or brackish, rather than truly marine, types of green sulfur bacteria
indicating an allochtonous origin of these fossil biomarkers. The fact that carotenoids cannot
enable such precise classification of the source of these fossil remnants, predisposes the use of
fossil DNA for a much detailed reconstruction of past ecosystems. Further investigations using
the Black Sea and Chlorobium phaeobacteroides BS1 as a modern analogue offer therefore a
great potential for the evaluation of past water column anoxia.
Introduction
- 15 -
Fig. 5. Contemporary geographical location of fossil sediments and sedimentary rocks containing
biomarkers of phototrophic sulfur bacterial as evidence for Oceanic Anoxic Events. Locations are
distinguished according to their geological age (Overmann, 2008). extant population of green
sulfur bacteria in the chemochline and isorenieratene in the Black sea sediments. Cenozoic
environments ● Mesozoic environments ○ Paleozoic environments and Proterozoic
environments (1.64 Gyr old)
Material and Methods
- 16 -
MATERIAL AND METHODS
Adaptation of Chromatiaceae toward absorption of specific wavelengths of
light
Cultivation and extraction of DNA
The purple sulfur bacteria strain 970 and Trv. winogradskyi strain 06511 and DSM6702T were
grown under anaerobic conditions. Basal media contained KH2PO4 , 1.84 mM; NH4Cl, 6.36 mM;
KCl, 4.56 mM; MgSO4·7 H2O, 14.2 mM; CaCl2·2 H2O, 1.7 mM and NaCl, 342.2 mM. After
autoclaving, the following components were added: NaHCO3, 60 mM; Na2S, 1.25 mM; SL12,
1ml·l-1
(Overmann et al., 1992b), and vitamin B12, 20 µg·l-1
. The pH was adjusted to 7.3 and the
medium distributed aseptically and anoxically in screw-cap bottles or tubes. Repeated addition of
neutralized 100 mM sulfide solution (Siefert and Pfennig, 1984) and acetate (final concentration,
5 mM) was used to obtain higher cell yields. Stock cultures were grown photosynthetically at a
light intensity of 100 µmol quanta·m-2
·s-1
of a 40 W-tungsten lamp bulb as determined with an
LI-189 quantum meter plus an LI-200 pyranometer sensor (sensitivity range, 400–1,100 nm;
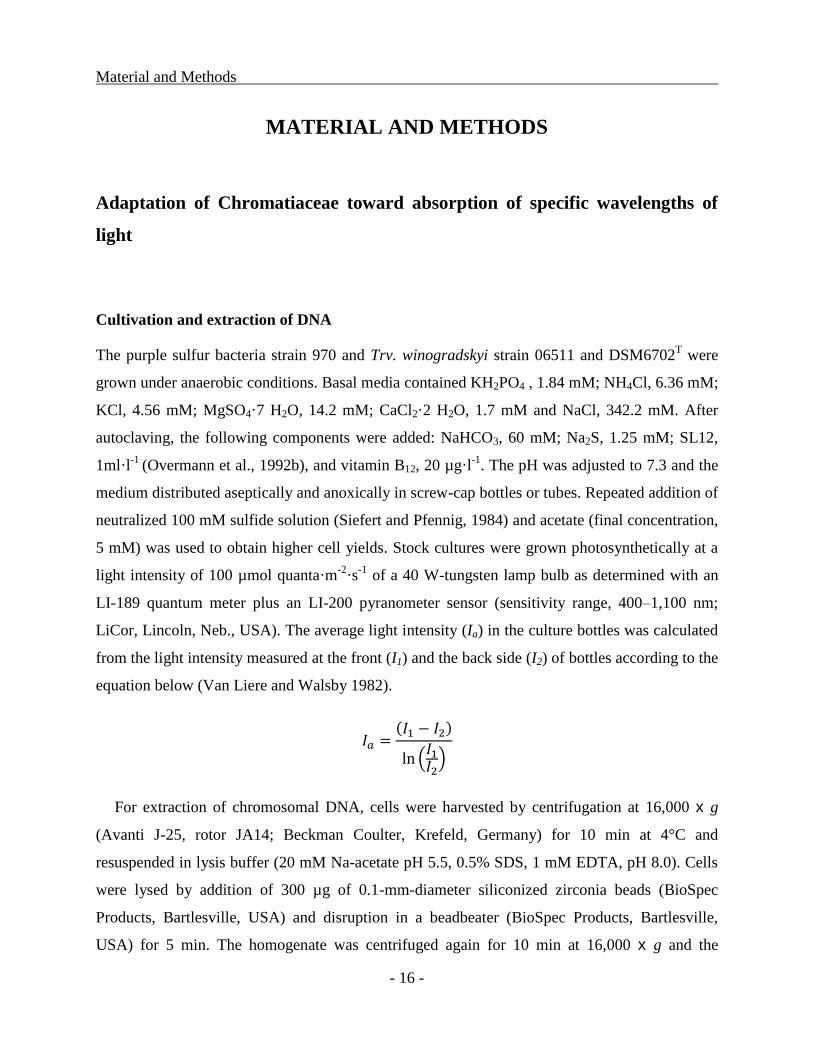
LiCor, Lincoln, Neb., USA). The average light intensity (Ia) in the culture bottles was calculated
from the light intensity measured at the front (I1) and the back side (I2) of bottles according to the
equation below (Van Liere and Walsby 1982).
For extraction of chromosomal DNA, cells were harvested by centrifugation at 16,000 x g
(Avanti J-25, rotor JA14; Beckman Coulter, Krefeld, Germany) for 10 min at 4°C and
resuspended in lysis buffer (20 mM Na-acetate pH 5.5, 0.5% SDS, 1 mM EDTA, pH 8.0). Cells
were lysed by addition of 300 µg of 0.1-mm-diameter siliconized zirconia beads (BioSpec
Products, Bartlesville, USA) and disruption in a beadbeater (BioSpec Products, Bartlesville,
USA) for 5 min. The homogenate was centrifuged again for 10 min at 16,000 x g and the
Material and Methods
- 17 -
supernatant was treated further using the DNeasy®
Blood and Tissue Kit (Quiagen, Hilden,
Germany) according to the instructions of the manufacturer. In order to obtain DNA of sufficient
purity for quantitative PCR amplifications an additional purification step was included. DNA
was precipitated by adding 0.1 volumes of 3 M sodium acetate and 0.8 volumes ice cold 100%
isopropanol followed by incubation at -20°C overnight. The DNA was sedimented by
centrifugation at 18,000 x g for 30 minutes at 4°C (Eppendorf, 5417R), washed with ice cold
70% (v/v) ethanol, dried and resuspended in 50 to 100 µl of sterile Tris-buffer (2 mM Tris-HCl,
pH 8.0) and stored at -20°C until further usage. The DNA concentrations were determined with
the nanodrop ND-1000 (peqlab, Erlangen, Germany), and quality was assessed on a agarose gel
(1%, w/v).
For cloning, Escherichia (E.) coli strain DH5α (Invitrogen, Carlsbad, CA, USA) was used.
This strain was grown in Luria Bertani (LB) medium containing 1% Bacto-Tryptone, 1% NaCl
and 0.5% yeast extract (Sambrook and Russell, 2001) and incubated at 37°C overnight. The pH
was adjusted to 7 and ampicillin (100 µg·ml-1
)was supplemented as the selective antibiotic.
Plasmid DNA was extracted with the NucleoSpin®
Plasmid Kit (Macherey-Nagel, Düren,
Germany) according to the instructions of the manufacturer.
PCR amplification and cloning of photosynthesis genes
Starting from fragments of pufLM genes, amplified with the pufL-f and pufM-r primers
(Nagashima et al., 1997) (Table 2), similar amplification strategies was pursued for the three
strains investigated. Polymerase chain reactions (PCR) were performed in a Veriti® 96-well
thermal cycler (Applied Biosystems, Foster City, CA, USA) using the BD Advantage™ 2PCR
Kit (BD, Franklin Lakes, New Jersey, USA) that employs proofreading polymerase.
For strain 970, additional cloning steps were performed for the primary identification of
fragments containing pufLM genes. For the fragment size identification Southern Blot analysis
was performed. A total of 3 µg chromosomal DNA of strain 970 were digested with the
restriction endonucleases EcoR I, Sac I, Sph I, Pvu I and Xba I (MBI Fermentas, St Leon-Rot,
Germany) according to the instructions of the manufacturer. All of these endonucleases showed
less than two recognition sites in the previously known sequence of pufLM genes. The resulting
fragments were separated by gel electrophoresis and transferred by capillary blotting on a
Hybond-N+ nylon membrane (Amersham Pharmacia, Freiburg, Germany) and crosslinked.
Material and Methods
- 18 -
Hybridization was performed with the Digoxigenin (DIG)-System (Roche, Basel, Switzerland)
according to the instructions of the manufacturer. As a pufLM probe, a fragment of the pufLM
gene was amplified using the primers PufLM-St970-f and PufLM-St970–r (MWG Eurofins,
Ebersberg, Germany) (Table 2) and labeled via DIG incorporation during PCR. The
amplification program included a 2 minutes denaturation step at 95°C followed by 10 cycles
with 10 sec denaturation at 95°C, 30 sec annealing at 60°C, and 2 min elongation at 72°C
additional 20 cycles with 10 sec denaturation at 95°C, 30 sec annealing at 60°C, and 2 min plus
20 sec (for each additional cycle) elongation at 72°C with an final 7 min elongation step at 72°C.
Hybridisation with the pufLM probe was achieved at 50°C overnight. Detection procedure was
performed using the chemolimunescent alkaline phosphatase substrate CSPD (Roche) and X-ray
film (WICO Rex+; Linhardt Röntgenbedarf, Munich, Germany) according to the instructions of
the manufacturer. Suitable fragments could be identified for the EcoR I digest and hence were
chosen for futher analysis. Digested genomic DNA was separated by gel electrophoresis and
bands were excised according to the detected fragment length. DNA fragments were extracted
using the Nucleospin Extract II Kit (Macherey-Nagel) according to the instructions of the
manufacturer and eluted in 30 µl of sterile Tris-buffer (2 mM Tris-HCl, pH 8.0). For cloning, 6µl
of genomic DNA fragments were ligated with EcoRI-digested pUC18 16h at 15°C in a volume
of 100 µl using 10 U of T4 DNA ligase (MBI Fermentas). Ligase inactivation was achieved
through incubation at 65°C for 15 min. Resulting plasmids were cloned in chemocompetent
E. coli DH5α cells. For this, the whole ligation reaction was added to 100 µl chemocompetent
cells and incubated at 4°C for 30 min. A heat shock was performed at 42°C for 2 min followed
by cooling down on ice for 2 min. After the addition of 600 µl LB medium and incubation at
37°C for 1 h, cells were spread on LB plates with added ampicillin as the selective antibiotic.
Clones containing fragments with pufLM genes were identified via PCR using PufLM-St970-f
and PufLM-St970–r primers and a program including a 2 minutes denaturation step at 95°C
followed by 35 cycles with 30 sec denaturation at 95°C, 30 sec annealing at 58°C, and 1 min
elongation at 72°C. The initial cloned fragment was sequenced using primers M13-forward,
M13-reverse, St970-seq-rev1, st970-IrevB103, PufLM-St970-f, PufLM-St970–r, st970-IfwA891
and St970-seq-fw1. Sequencing was performed on a ABI 3730 capillary sequencer (Applied
Biosystems) using the BigDye Terminator v3.1 cycle sequencing kit (Applied Biosystems)
according to the protocol of the manufacturer.
Material and Methods
- 19 -
Additional sequence information for the puf operons was obtained by an inverse PCR (iPCR)
approach (Ochman et al., 1993). Based on the sequence information obtained by the cloning
experiment outlined above, restriction sites suitable for iPCR were identified and 1 µg of
chromosomal DNA was used for digestion following the protocols of the manufacturer (MBI
Fermentas). Digested fragments were then ligated for 16 h at 15°C in a volume of 100 µl using
10 U of T4 DNA ligase (MBI Fermentas). For the genomic region upstream of pufLM iPCRs
with primers st970-IfwA891 and st970-IrevA127 amplifying unknown flanking regions (Table 1)
were performed on 100 ng ligated fragments which were previously digested with Pvu I. A PCR
protocol that comprised a hot start at 95°C for 5 min, followed by 30 cycles with denaturation at
95°C for 30 sec as well as a combined annealing and extension step at 68°C for 4 min was
employed. Amplification products were sequenced using nested primers st970-IfwB910 and
st970-IrevB103 from known regions and missing sequence stretches were obtained by primer
walking with the primers St970-seq-rev1 and St970-seq-rev2. For the genomic region
downstream of pufC iPCR with primers St970-IfwPufC and St970-IrevPufC amplifying
unknown flanking regions (Table 1) was performed on 100 ng ligated fragments which were
previously digested with Pvu I. A PCR protocol that comprised a hot start at 95°C for 5 min,
followed by 30 cycles with denaturation at 95°C for 30 sec as well as a combined annealing and
extension step at 68°C for 4 min was employed. Amplification products were cloned and
sequenced using the primers M13-forward, M13-reverse, St970-IfwPufC and St970-IrevPufC
from known regions and missing sequence stretches were obtained by primer walking with the
primer St970-seq-fw2. In order to identify a putative third copy of pufBA genes, genomic DNA
was digested with Hind III and self-ligated as described above. This experiment was performed
by Anne Köhler. iPCR with primers St970-seq-fw2 and St970-IrevBA3 was applied for
amplification of unknown flanking regions. A PCR protocol that comprised a hot start at 95°C
for 5 min, followed by 30 cycles with denaturation at 95°C for 30 sec as well as a combined
annealing and extension step at 68°C for 4 min was employed. Amplification products were
cloned and sequenced using the primers M13-forward and M13-reverse.
The pufLM genes from Trv. winogradskyi strain 06511 were amplified using the pufL-f and
pufM-r primers (Nagashima et al., 1997). For the genomic region upstream of pufLM iPCRs with
primers Wino-Ipcr-fw2 and Wino-Ipcr-rev2 amplifying unknown flanking regions (Table 1)
were performed on 100 ng ligated fragments which were previously digested with EcoR I. A
Material and Methods
- 20 -
PCR protocol that comprised a hot start at 95°C for 5 min, followed by 30 cycles with
denaturation at 95°C for 30 sec annealing at 63°C and extension step at 72°C for 3 min was
employed. Amplification products were cloned and sequenced using the same primers and Wino-
Ipcr-fw1 from known regions. The genomic region further upstream of pufA was amplified via
iPCR using the primers Wino-Ipcr-fw3 and Wino-Ipcr-rev4 (Table 2) on 100 ng ligated
fragments which were previously digested with Sac I. A PCR protocol that comprised a hot start
at 95°C for 5 min, followed by 30 cycles with denaturation at 95°C for 30 sec annealing at 60°C
and extension step at 72°C for 3 min was employed. Amplification products were cloned and
sequenced using the primers M13-forward and M13-reverse.
For Trv. winogradskyi strain DSM6702T the information gained from strain 06511 was used
for the design of a forward primer in the conserved site of the bchZ gene. The genetic region
containing the pufBA genes was amplified using this forward primer (W6702-BChlZ-f) and a
reverse primer (W6702-r; Table 2) targeting the known pufLM sequence. A PCR protocol that
comprised a hot start at 95°C for 5 min, followed by 30 cycles with denaturation at 95°C for 30
sec annealing at 58°C and extension step at 72°C for 90 sec was employed. Amplification
products were cloned and sequenced using the primers M13-forward and M13-reverse.
Material and Methods
- 21 -
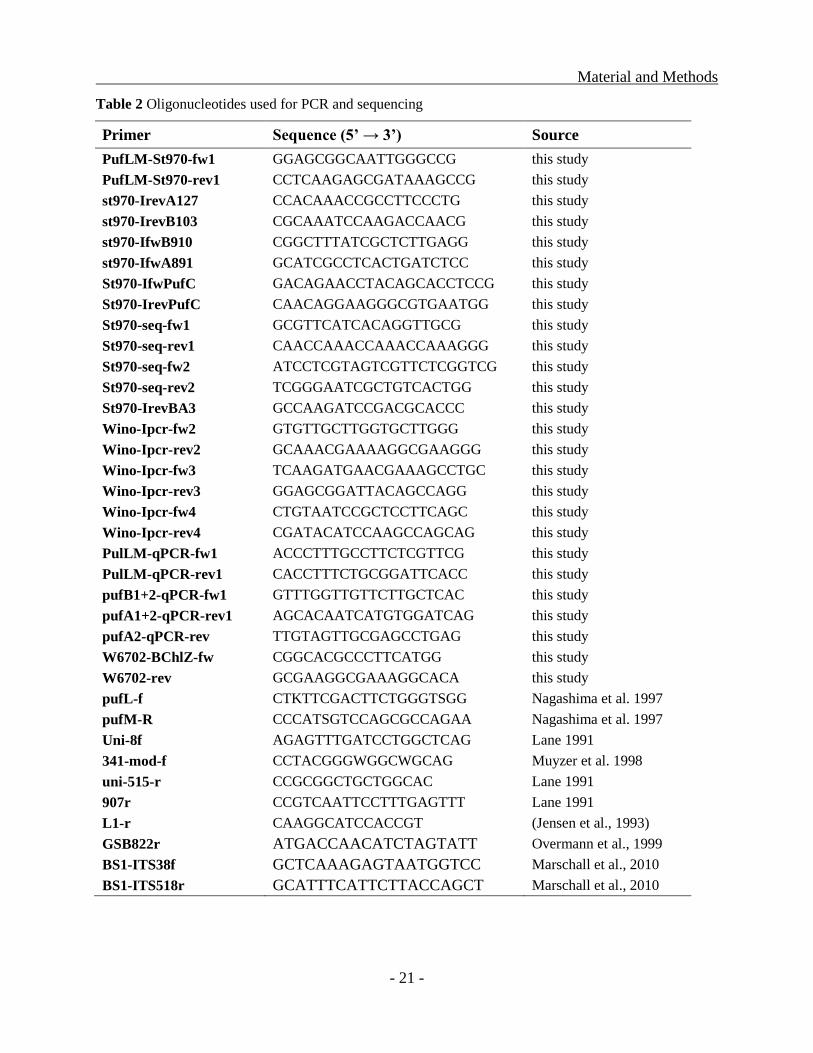
Table 2 Oligonucleotides used for PCR and sequencing
Primer Sequence (5’ → 3’) Source
PufLM-St970-fw1 GGAGCGGCAATTGGGCCG this study
PufLM-St970-rev1 CCTCAAGAGCGATAAAGCCG this study
st970-IrevA127 CCACAAACCGCCTTCCCTG this study
st970-IrevB103 CGCAAATCCAAGACCAACG this study
st970-IfwB910 CGGCTTTATCGCTCTTGAGG this study
st970-IfwA891 GCATCGCCTCACTGATCTCC this study
St970-IfwPufC GACAGAACCTACAGCACCTCCG this study
St970-IrevPufC CAACAGGAAGGGCGTGAATGG this study
St970-seq-fw1 GCGTTCATCACAGGTTGCG this study
St970-seq-rev1 CAACCAAACCAAACCAAAGGG this study
St970-seq-fw2 ATCCTCGTAGTCGTTCTCGGTCG this study
St970-seq-rev2 TCGGGAATCGCTGTCACTGG this study
St970-IrevBA3 GCCAAGATCCGACGCACCC this study
Wino-Ipcr-fw2 GTGTTGCTTGGTGCTTGGG this study
Wino-Ipcr-rev2 GCAAACGAAAAGGCGAAGGG this study
Wino-Ipcr-fw3 TCAAGATGAACGAAAGCCTGC this study
Wino-Ipcr-rev3 GGAGCGGATTACAGCCAGG this study
Wino-Ipcr-fw4 CTGTAATCCGCTCCTTCAGC this study
Wino-Ipcr-rev4 CGATACATCCAAGCCAGCAG this study
PulLM-qPCR-fw1 ACCCTTTGCCTTCTCGTTCG this study
PulLM-qPCR-rev1 CACCTTTCTGCGGATTCACC this study
pufB1+2-qPCR-fw1 GTTTGGTTGTTCTTGCTCAC this study
pufA1+2-qPCR-rev1 AGCACAATCATGTGGATCAG this study
pufA2-qPCR-rev TTGTAGTTGCGAGCCTGAG this study
W6702-BChlZ-fw CGGCACGCCCTTCATGG this study
W6702-rev GCGAAGGCGAAAGGCACA this study
pufL-f CTKTTCGACTTCTGGGTSGG Nagashima et al. 1997
pufM-R CCCATSGTCCAGCGCCAGAA Nagashima et al. 1997
Uni-8f AGAGTTTGATCCTGGCTCAG Lane 1991
341-mod-f CCTACGGGWGGCWGCAG Muyzer et al. 1998
uni-515-r CCGCGGCTGCTGGCAC Lane 1991
907r CCGTCAATTCCTTTGAGTTT Lane 1991
L1-r CAAGGCATCCACCGT (Jensen et al., 1993)
GSB822r ATGACCAACATCTAGTATT Overmann et al., 1999
BS1-ITS38f GCTCAAAGAGTAATGGTCC Marschall et al., 2010
BS1-ITS518r GCATTTCATTCTTACCAGCT Marschall et al., 2010
Material and Methods
- 22 -
Transcriptional analysis
For RNA extraction, cells growing in culture were mixed with 12.5% ice-cold ethanol/phenol
stop solution (5% phenol pH 4.5-5.5 in 100% ethanol) to avoid RNA degradation. After
centrifugation at 10,000 x g for 10 min at 4°C, pellets were frozen in liquid nitrogen and stored
at -80°C. Extraction was started by resuspending cells in lysis buffer (20 mM Na-acetate pH 5.5,
0.5% SDS, 1 mM EDTA, pH 8.0) supplemented with one volume of phenol (pH 4.5-5.5), and
using bead beating with the addition of 300 µg of 0.1-mm-diameter siliconized zirconia beads
(BioSpec Products) for 1 min. Total RNA was isolated using phenol-chloroform (Chomczynski
and Sacchi, 1987) and subsequently purified with the RNeasy Mini Kit (Quiagen) according to
the protocol of the manufacturer. The RNA was treated with Turbo DNA free (Applied
Biosystems) to remove all remaining DNA contamination. For this purpose the rigorous
treatment was chosen and additional 2 U of Turbo DNase was added after 30 min of incubation
and incubation lasted another 30 min. Another purification step using the RNeasy Mini Kit
(Quiagen) followed subsequently. RNA concentrations were determined with the nanodrop ND-
1000 (peqlab, Erlangen, Germany), and quality was assessed on a formaldehyde gel (3.1%, w/v).
Reverse transcription was performed with RevertAid™ First strand cDNA Synthesis Kit
(Fermentas) using 1 µg of RNA according to the protocol of the manufacturer. Negative controls
were prepared by omitting the reverse transcriptase and served to verify the absence of
contaminating genomic DNA. Quantitative real-time PCR (RT-qPCR) with custom designed
gene specific primers (pufB1+2-qPCR-f, pufA1+2-qPCR-r, pufA2-qPCR-r, PulLM-qPCR-fw1
and PulLM-qPCR-rev1 Table 2) was performed using 20 µl reactions, the LightCycler 480
SYBR Green I Master and 1 µl of cDNA solution.in a LightCycler 480 (Roche). The RT-qPCR
reaction protocol comprised a hot start at 95°C for 5 min, followed by 35 cycles with
denaturation at 95°C for 10 sec annealing at 56°C for 15 sec and an extension step at 72°C for 16
sec was employed. Melting curve was measured continuously between 65-97°C at a ramp rate of
0.11°C/s. For standardization, the copy number of 16S rRNA gene transcripts was quantified in
parallel for all samples using the eubacterial primer set 341-mod-f and Uni-515-r (Lane, 1991;
Muyzer and Smalla, 1998). A linearized plasmid containing the cloned fragment from the puf
operon of strain 970 was used for calibration. Each quantification was performed in three
parallels. cDNA samples for determination of 16S rRNA concentrations were diluted before
qPCR. For the measurement of transcript half-lives, cultures of strain 970 were grown to a total
Material and Methods
- 23 -
cell density of 2 x 10⁷ cells ml
-1 at 100 µmol quanta m
-2 s
-1 and cells from 50 ml culture were
harvested for RNA isolation at consecutive time points. Additionally cultures were grown under
limiting light intensities of 2 µmol quanta·m-2
·s-1
. Transcription initiation was inhibited by the
addition of rifampicin (200 µg·ml-1
) (Campbell et al., 2001). The data obtained after 15 min of
incubation were used for the calculation of transcript half-lifes.
Cloning of environmental puf sequences
Several layered microbial mats and sediments containing purple bacteria were collected from
Little Sippewissett Saltmarsh, Falmouth, MA, USA. The samples comprised (i) the sandy, pink-
colored bottom sediment of a small puddle (Sipp1), (ii) pink cell aggregates from a tidal pond
(Sipp2), (iii) sandy, pink to orange-colored bottom sediment of a tidal channel (Sipp3), (iv) a
layered microbial mat (Sipp4), and (v) a cyanobacterial mat (Sipp5). Samples were stored in 50
ml screw cap tubes at 4°C. Genomic DNA was extracted from 2 g of sample using the
UltraClean® Mega Soil DNA Isolation Kit (MoBio Laboratories, Inc. Carlsbad, CA, USA) and
following the protocol of the manufacturer. The genomic region containing pufLM was amplified
with conserved primers PufL-f and PufM-r (Nagashima et al., 1997) using 10 µg of DNA as
template. The PCR reaction protocol comprised a hot start at 95°C for 5 min, followed by 40
cycles with denaturation at 95°C for 15 sec annealing at 62°C for 15 sec extension step at 72°C
for 1.5 min and a final extention step was employed for 7 min. The amplification products with a
size of 1.4 kb were excised from an agarose gel (1%, w/v) cleaned using the Nucleospin® Extract
II Kit (Macherey-Nagel) according to the instructions of the manufacturer and eluted in 30 µl of
sterile Tris-buffer (2 mM Tris-HCl, pH 8.0). Further on, 4 µl cleaned PCR product was cloned
using the TopoTA cloning kit (Invitrogen) according to the protocol of the manufacturer. A total
of 60 clones were picked and grown in LB medium with 100 µm ampicillin added as selective
antibiotic. Plasmids were extracted using the Nucleospin®
Plasmid Kit (Macherey-Nagel)
according to the instructions of the manufacturer and eluted in 30 µl of sterile Tris-buffer (2 mM
Tris-HCl, pH 8.0). The insertion of cloned PCR products were tested by digesting 1 µl of
plasmid DNA with the restriction endonuclease EcoR I and separation with electrophoresis on an
agarose gel (1 %, w/v). Positive clones were subsequently sequenced using the primers M13-
forward and M13-reverse.
Material and Methods
- 24 -
Sequence analyses
Sequences were analyzed by comparative database searches employing the BLAST X program
(Altschul et al., 1997), ORF Finder (http://www.ncbi.nlm.nih.gov/gorf/gorf.html) and processed
with Vector NTI version 11.0 (Invitrogen). Open reading frames (ORFs) were identified using
the NCBI ORF Finder graphical analysis tool (http://www.ncbi.nlm.nih.gov/gorf/gorf.html).
Stem loop structures were predicted and free energy for stabilities of secondary structures were
calculated with the Mfold web server (Zuker, 2003). For comparison, related sequences of
photosynthesis genes and proteins were retrieved from the GenBank database (Benson et al.,
2008). Raw sequence data were aligned with Clustal X version 2.0.11 (Larkin et al., 2007) and
imported into the ARB program package (Ludwig et al., 2004). Phylogenetic trees were
constructed using the RAxML maximum likelihood algorithm for proteins and with
FastDNAML for 16S rRNA, followed by bootstrap analyses for 100 datasets. The nucleotide
sequences obtained in this study have been deposited in the GenBank database under accession
numbers JF523526 (puf operon strain 970), JF523525 (puf operon Trv. winogradskyi strain
06511) JF523524 (puf operon Trv. winogradskyi DSM6702T), JF523527 (SIPP-1-1), JF523528
(SIPP-1-2), JF523529 (SIPP-1-4), JF523530 (SIPP-1-6), JF523531 (SIPP-2-2), JF523532 (SIPP-
2-7), JF523533 (SIPP-2-8), JF523534 (SIPP-3-1), JF523535 (SIPP-4-7), JF523536 (SIPP-4-8)
and JF523537 (SIPP-5-8).
Modeling of three-dimensional structures
In order to identify potential polypeptide BChl interactions in the antenna complex of strain 970,
three-dimensional (3-D) models were constructed. The RCSB protein data bank (www.pdb.org)
(Berman et al., 2000) was used for the identification and acquisition of appropriate modeling
templates. The SWISS-Model workspace (Arnold et al., 2006) was then employed for modeling
via the alignment mode using the chosen templates. Visualization of 3-D models was achieved
with the program Deep View – Swiss-Pdb Viewer version 4.0.1 (Guex and Peitsch, 1997).
To date only few entries of 3-D structures of purple bacterial LH1 are available in the Protein
Data Bank (PDB) and comprise the solution structures of Rhodobacter (Rbc.) sphaeroides LH1β
(1dx7) and of LH1β (1wrg) and LH1α (1xrd) from Rhodospirillum (Rsp.) rubrum, respectively.
While the crystal structure of the RC-LH1 core complex from Rhodopseudomonas (Rps.)
palustris is available at a 4.8 Å resolution, this structure does not contain the information about

Material and Methods
- 25 -
the exact location of the LHC1 polypeptide residues. Detailed information is available for two
LH2 crystal structures, including Rhodoblastus (Rbl.) acidophila (1nkz) at 2.0 Å resolution and
Phaeospirillum (Phs.) molischianum (1lgh) at 2.4 Å resolution. The latter structures include also
information about pigment coordination inside the complex. Therefore, the structural models of
LH2 complexes were also used for the modeling of the polypeptides of strain 970 in order to
provide additional information about protein-pigment interactions.
Material and Methods
- 26 -
Chlorobiaceae and the adaptation to low light conditions
Cultivation of Chlorobiaceae
The bacterial strain Chl. phaeobacteroides BS1 previously isolated from the chemocline of the
Black Sea was cultivated in artificial seawater medium as an enrichment culture where it
constitutes ≥ 80% of cells in culture (Manske et al., 2005). Artificial seawater medium (Coolen
and Overmann, 2000) was adjusted to the ionic strength of the Black Sea chemocline. The
medium contained (per liter) 14.1 g NaCl, 2.9 g MgCl2 • 6 H2O, 0.6 g CaCl2 • 2 H2O, 0.4 g KCl,
2.3 g Na2SO4, 2.4 g HEPES, 0.2 ml selenite-tungstate solution (58), 100 mg KBr, 24.7 mg
H3BO3, 23.8 mg SrCl2, 21.4 mg NH4Cl, 5.4 mg KH2PO4 and 2.9 mg NaF. After autoclaving, 1.4
mM NaHCO3, 1 mM Na2S • 9 H2O, 1 ml of trace element solution SL10 (75 mM g/l Fe(II)Cl2 • 4
H2O, 92 mM CoCl2 • 6 H2O, 618 mM MnCl2 • 2 H2O, 514 mM ZnCl2, 100 mM NiCl2 • 6 H2O,
149 mM Na2MoO4 • 2 H2O, 97 mM H3BO3, 12 mM CuCl2 • 2 H2O) (Widdel et al., 1983), 0.1 ml
of a solution of 10 vitamins (Balch et al., 1979), and 200 µM dithionite were added. The pH was
adjusted to 7.2 and the medium was distributed into 500-ml screw cap bottles. Cultures were
incubated under low light (0.15 µmol quanta·m-2
·s-1
) and high light (3 µmol quanta·m-2
·s-1
)
conditions using a 40 W-tungsten lamp bulb. Light intensities were determined with an LI-189
quantum meter plus an LI-200 pyranometer sensor (sensitivity range, 400–1,100 nm; LiCor,
Lincoln, Neb., USA). The average light intensity (Ia) in the culture bottles was calculated from
the light intensity measured at the front (I1) and the back side (I2) of bottles according to the
equation described in the previous chapter (Van Liere and Walsby 1982).
Enrichments from Sakinaw Lake were cultivated in SL10 medium containing 2.5 mM
KH2PO4 , 6.4 mM NH4Cl, 4.6 mM KCl, 2.0 mM MgSO4 • 7 H2O and 2.0 mM CaCl2 • 2 H2O.
After autoclaving, 18.0 mM NaHCO3, 2.5 mM Na2S • 9 H2O, 1 ml of trace element solution
SL10, 0.1 ml of a solution of 10 vitamins and 20 µg/l Vitamin B12 were also added. The pH was
adjusted to 6.7 and the medium was distributed into 50-ml screw cap bottles. Cultures were
incubated under the low light (0.15 µmol quanta·m-2
·s-1
) and high light (3 µmol quanta·m-2
·s-1
)
conditions.
Enrichment cultures from Faro Lake were cultivated in SL10 medium and artificial seawater
medium at low light intensities as described above.
Material and Methods
- 27 -
In silico subtractive hybridization analysis
In silico subtractive hybridization was conducted with the Phylogenetic Profiler available at the
DOE Joint genome Institute website (http://img.jgi.doe.gov). The Chl. phaeobacteroides BS1
genome http://genome.jgi-psf.org/chlpb/chlpb.home.html) was screened for single genes which
had no homologs based on BLASTP alignments against the other 11 publicly available genome
sequences of the green sulfur bacteria Chlorobaculum parvum NCIB 8327, Cba. tepidum ATCC
49652T, Chl. ferrooxidans DSM 13031
T, Chl. limicola DSM 245
T, Chl. luteolum DSM 273
T,
Chl. phaeobacteroides BS1, Chl. phaeobacteroides DSM 266T, Chl. phaeovibrioides DSM 265,
Chl. clathratiforme DSM 5477T, Chloroherpeton thalassium ATCC 35110
T and
Prosthecochloris aestuarii DSM 271T (http://img.jgi.doe.gov/cgi-bin/geba/main.cgi?section
=TaxonListandpage=taxonListPhyloandpidt=14955.1250667420). A maximum e-value of 10-5
and a minimum identity of 30% were applied for identification of homologs.
Prokaryotic cDNA suppression subtractive hybridisation (cDNA-SSH)
Cultures of Chl. phaeobacteroides BS1 grown under low light (0.15 µmol quanta·m-2
·s-1
) and
high light (3 µmol quanta·m-2
·s-1
) were used for determination of differentially expressed genes
under changed light conditions. For RNA extraction, cells exponentially growing in culture were
mixed with 12.5% ice-cold ethanol/phenol stop solution (5% phenol pH 4.5-5.5 in 100% ethanol)
to avoid RNA degradation. After centrifugation at 10,000 x g for 10 min at 4°C pellets were
frozen in liquid nitrogen and stored at -80°C. Total RNA was isolated using phenol-chloroform
(Chomczynski and Sacchi, 1987) and subsequently purified with the RNeasy Mini Kit (Quiagen)
according to the protocol of the manufacturer. The RNA was treated with Turbo DNA free
(Applied Biosystems) to remove all remaining DNA contamination. As a test for the absence of
genomic DNA, a step-down PCR was inferred, using a specific pair of primers
BS1-Sig70-94fw (5’- ACGGCGGAAGATGAGGTGAA-3’) and BS1-Sig70-252rev (5’-
CTGATTCTGGTATTGTTTGGCGA-3’) targeting the rpoD-gene (Cphamn1_2035) which
codes for the RNA polymerase sigma factor A. The test was conducted using 200 ng of the total
RNA preparation. RNA concentrations were determined with the nanodrop ND-1000 (peqlab,
Erlangen, Germany), and quality was assessed on a formaldehyde gel (3.1%, w/v).
Material and Methods
- 28 -
The separation of the mRNA from 40 µg of total RNA was performed with the
MICROBExpress bacterial mRNA enrichment kit (Applied Biosystems) according to the
instructions of the manufacturer. Multiple preparations were pooled and concentrated with the
RNeasy MinElute Cleanup Kit (Qiagen). The efficiency of rRNA depletion in the mRNA extract
was analyzed using an Agilent 2100 bioanalyzer with a RNA LabChip (Agilent Technologies,
Santa Clara, USA). First strand cDNA synthesis was done with Superscript III Reverse
Transscriptase (Invitrogen) as described by the manufacturer, using 2 µg of mRNA 0.5 µl of
10 µM PCS primer (De Long et al., 2008) and 400 U reverse transcriptase. After 90 min of
incubation, additional 400 U of the enzyme were added and the incubation continued for another
90 min. Two first strand synthesis reactions were pooled and the second strand cDNA synthesis
performed with the PCR-Select™ cDNA substraction kit (Clontech Laboratories, Mountain
View, USA) according to the instructions of the manufacturer. One microliter of DNase-free
RNase (500 µg·ml-1
) (AppliChem, Darmstadt, Germany) was added and the samples incubated
for 30 min at 37°C. The cDNA was purified with a QIAquick PCR purification kit (Qiagen) and
yields were quantified by absorbance at 260 nm. Tester and driver were digested with RsaI and
purified using the MinElute reaction cleanup kit (Qiagen). Successful digestion of the cDNA was
verified by gel electrophoresis on a 1% agarose gel stained with ethidium bromide. Adaptor
ligation was performed according to the manual for the PCR-Select™ cDNA substraction kit
(Clontech). Afterwards the ligation efficency was tested using the primer pair targeting the rpoD-
gene described above. The first and second hybridisations were done following the instructions
of the kit with the exception that 3 µl denaturated driver and 1 µl 4x hybridisation buffer were
used during the second hybridization for high light cDNA as driver and 0.5 µl denaturated driver
and 0.5 µl 4x hybridisation buffer were used during the second hybridization for low light cDNA
as driver. Primary and secondary nested suppression PCRs were run in a GeneAmp 9700
Thermal Cycler (Applied Biosystems) with Advantage 2 polymerase mix (Clontech) according
to the PCR-Select™ cDNA substraction kit (Clontech) protocol using 50 nM of nested-PCR
primer 2R in the secondary PCR. Amplification products of this secondary PCR were cloned
using the TOPO TA cloning kit (Invitrogen). Plasmids were isolated from selected clones and
inserts were sequenced with M13 forward and reverse primers (Invitrogen). Sequence analysis
was performed on basis of the annotated genome sequence of Chl. phaeobacteroides BS1.
Material and Methods
- 29 -
Illumina cDNA sequencing
Total RNA from cultures of Chl. phaeobacteroides BS1 grown at different light conditions were
extracted as described above. Library preparation and sequencing were performed at the
University of Delaware by Brian Eddie and Prof. Thomas Hanson.
cDNA library preparation and sequencing. RNA samples were partially depleted of rRNA
using the MicrobExpress kit (Ambion, Austin, TX, USA) following the instructions of the
manufacturer. cDNA was generated from 25 ng of RNA using the Ovation mRNA-seq kit
(Nugen, San Carlos, CA, USA), fragemented by the recommended protocol using an S2
Adaptive Focused Acoustic Disruptor (Covaris, Woburn, MA, USA). Fragmented cDNA was
end repaired, ligated to sequencing adapters and prepared for sequencing using the Encore
library generation kit (Nugen). Sequencing was carried out on the Illumina Genome Analyzer IIx
(Illumina, San Diego, CA, USA). Sequences of 42 bp long were aligned to the Chl.
phaeobacteroides BS-1 genome (NC_010831) by the Eland software package allowing for up to
two mismatched bases, which yielded 2,792,174 uniquely matching sequences for the STRG
sample and 3,280,048 uniquely matching sequences for the SLK sample.
Gene expression calculation and analysis. The mean coverage depth for every annotated
feature was calculated from the Eland alignment output using custom Perl scripts. The coverage
depth per gene was Log2 transformed and normalized between the two samples using the
quantile normalization procedure using the mean of expression for each gene as the reference
distribution (Bullard et al., 2010). Statistical significance thresholds were determined by
calculating the standard deviation from a null expectation of a 1:1 expression ratio for each ORF,
over a sliding window of 101 genes centered on the gene of interest. The resulting set of standard
deviations was fitted to the equation σ = 0.35/(0.8+(em^1.5
)/2)+0.45, where m is the mean of
expression for each ORF. ORFs that had a difference of expression greater than 2σ were
considered differentially expressed.
Material and Methods
- 30 -
Characterization of Chlorobiaceae from the chemocline of Lake Faro
Isolation of DNA, PCR amplification and cloning. Samples of 100 ml from different depths
of the chemocline in Lake Faro (Sicily, Italy) were taken in May, June and July 2008 (sampling
was performed by Dr. Alessandro Sacca, University of Messina). Cell material was concentrated
on polycarbonate filters (0.22 µm pore size Millipore, Bedford, MA) and stored at -20°C. For
extraction of chromosomal DNA, cells on filters were lysed by addition of 600µl lysis buffer
(20 mM Na-acetate pH 5.5, 0.5% SDS, 1 mM EDTA, pH 8.0), 300 µg of 0.1-mm-diameter
siliconized zirconia beads (BioSpec Products, Bartlesville, USA) and disruption in a beadbeater
(BioSpec Products, Bartlesville, USA) for 5 min. The homogenate was centrifuged for 10 min at
16,000 x g and the supernatant was treated further using the DNeasy®
Blood and Tissue Kit
(Quiagen, Hilden, Germany) according to the instructions of the manufacturer.
The 16S rRNA gene fragments and 16S to 23S rRNA intergenic transcribed spacer regions
(ITS) were amplified using the primer combination 8f/L1R. The PCR reaction protocol
comprised a hot start at 95°C for 5 min, followed by 10 cycles with denaturation at 95°C for 15
sec annealing at 55°C for 15 sec extension step at 72°C for 2 min, then 15 cycles with changed
annealing temperature of 50°C and a final extention step for 7 min. The amplification products
with a size of 2 kb were excised from an agarose gel (1%, w/v) cleaned using the Nucleospin®
Extract II Kit (Macherey-Nagel) according to the instructions of the manufacturer and eluted in
30 µl of sterile Tris-buffer (2 mM Tris-HCl, pH 8.0). Further on, 4 µl cleaned PCR product was
cloned using the pGEM Easy cloning kit (Promega, Madison, WI) according to the protocol of
the manufacturer. A total of 110 clones were picked and grown in LB medium with 100 µM
ampicillin added as selective antibiotic. Plasmids were extracted using the Nucleospin® Plasmid
Kit (Macherey-Nagel) according to the instructions of the manufacturer and eluted in 30 µl of
sterile Tris-buffer (2 mM Tris-HCl, pH 8.0). A fragment of the cloned PCR products were
amplified using the primer. The variable region of 16S rRNA genes was amplified using the
universal bacterial primer GC341f and 907r. To ensure stable melting behavior of PCR-
generated DNA fragments primer 341f contained a 40 bp-long GC-clamp at its 5’ end. Cycling
conditions were as followed. A hot start at 96°C for 4 min was followed by a step-down PCR
protocol: 10 cycles with denaturation at 94°C for 30 sec, primer annealing at 58°C for 45 sec and
elongation at 72°C for 1 min were followed by 20 cycles with denaturation at 94°C for 30 sec,
Material and Methods
- 31 -
primer annealing 53°C for 45 sec and elongation 72 °C for 1 min. A final extension at 72°C for 7
min was included to ensure maximum amount of correct-sized PCR products. For specific PCR
amplification of green sulfur bacterial sequences primer 341f in combination with GSB822r was
used (Overmann et al., 1999). Standard conditions for PCR comprised 20 ng DNA, 10 µM of
each primer, 5 µl of 10x PCR buffer, 0.2 mM of each deoxynucleoside triphosphate, 3.5 mM
MgCl2 and 2.5 U Taq DNA polymerase (Qiagen) in a total volume of 50 µl. All reactions were
run in a Veriti 96 well thermocycler (Applied Biosystems). Amplification products were
analyzed by standard agarose gel electrophoresis.
Denaturing gradient gel electrophoresis and sequencing. PCR products were loaded onto
6% (wt/vol) polyacrylamide gels in 1x TAE (40 mM Tris-acetate, 1 mM EDTA, pH 7.4)
containing a urea/formamide gradient from 70% to 30% where 100% denaturant is defined as
7M urea and 40% (v/v) formamide, were used (Muyzer et al., 1995). Electrophoresis was
performed in an Ingeny phoU system (Ingeny International BV, Goes, The Netherlands).
Electrophoresis buffer was preheated to 60°C. Electrophoresis was run at 150 V for 16 h. Gels
were subsequently stained in a rotating buffer bath containing 1 in 10000 diluted SYBRgold
(MoBiTec, Göttingen, Germany) for 45 min. Bands were visualized on a UV transilluminator
(LTF Labortechnik, Wasserburg, Germany) and gels were then photographed (Visitron Systems
GmbH, Puchheim, Germany). For sequence analyses gel bands were excised with a sterile
scalpel and immediately transferred to 1.5 ml reaction tubes each containing, 40 µl of 10 mM
Tris-HCl (pH 8.5) and eluted at 65°C for 45 min. For initial identification of different bands and
subsequent sequencing, 1 µl of the eluate was reamplified using the same primer set without GC-
clamp and the same PCR cycling conditions. The reamplification products were purified with the
Nucleospin Extract II Kit (Macherey-Nagel). For sequencing of 16S rRNA gene amplificates
from DGGE fragments and cloned fragments, primers M13, 8f, 341f, 907r, L1R and M13r were
used. Sequencing was performed on a ABI 3730 capillary sequencer (Applied Biosystems) using
the BigDye Terminator v3.1 cycle sequencing kit (Applied Biosystems) according to the
protocol of the manufacturer. DGGE, 16S rRNA amplification and cloning experiments were
partially performed by the student Roland Schmitz under the supervision of Ovidiu Rücker
during a laboratory internship.
Material and Methods
- 32 -
Identification of carotenoids and fossil DNA in sediments
Isolation of isorenieratene. The carotenoid isorenieratene was extracted from several
samples taken from the Black Sea and the Mediterranean Sea using 2.5 g of sediment (sediment
samples were taken by Prof. Jörg Overmann and Evelyn Marschall). Carotenoids from the
sediment were dissolved using following solvents: (i) 20 ml methanol/acetone (2/7 v/v), (ii)
20 ml acetone, (iii) 20 ml dichlormethane and (iv) 30 ml methanol/KOH (6% KOH v/v). During
all extraction steps samples were sonicated 10 min in an ultrasonic bath in the dark at room
temperature except the extraction with methanol/KOH where extraction was performed at 60°C
for 20 min. After each extraction step sediment samples were centrifuged for 15 min at 15.000 x
g and supernatants were collected and stored in the dark. Pooled extracts were transferred in a
separatory funnel and the organic phase was collected after the addition of 30 ml of
dichlormethane and 30 ml H2O. The water phase was washed again twice with the addition of 30
ml of dichlormethane. All organic supernatants were pooled and evaporated using a rotary
evaporator at 35°C. Remaining solvent containing carotenoids was transferred to brown glass
tubes, dried via a constant nitrogen flow and stored under nitrogen at -20°C until use. Prior to
chromatography samples were purified through filtration (0.22 µm pore size). One third of the
filter was dissected into small pieces and extracted three times with 2.5 ml methanol/acetone
(80:20 v/v). The combined supernatants were centrifuged (10 min, 14000 x g, 4°C), and the
supernatant was evaporated to dryness with a rotary evaporator. The sample is stored under
nitrogen atmosphere at -20°C until use for further usage.
Chromatography and mass spectrometry. Further enrichment of carotenoids was achieved
by a RP18 chromatograpy (Waters, Milford, Massachusetts, USA), which was suspended in
methanol and filled in a column with 2.5cm diameter and length of 15 cm. Then the column was
equilibrated with 60% acetone for several hours. The pigments were diluted in 1 ml acetone and
applied on the column. The separation was carried out with the following step gradient: 60%
acetone; 70% acetone; 80% acetone; 85% acetone; 90% acetone and 100% acetone. The
isorenieratene containing fraction (90% and 100% acetone) was collected and diluted with 15ml
water, 100 µl of saturated NaCl solution and 15 ml hexane. The hexane phase was separated,
washed twice with water and dried by addition of Na2SO4. The absorption of the isorenieratene
containing fractions were recorded and employing the molar extinction coefficient of 107 mM-1
Material and Methods
- 33 -
cm-1
at 450 nm the absolute concentration was calculated (Borrego et al., 1999). The samples
were dissolved in 500 µl acetone, and frozen for 2 hours at-20°C. Afterwards the samples were
centrifuged (15 min, 14,000 x g, 4°C), dried via a constant nitrogen flow and stored under
nitrogen at -20°C until use. Prior to the measurement samples were dissolved in 100 µl
methanol/dimethylsulfoxide (1:1, v/v). LC-MS data were acquired on a LTQ-Orbitrap mass
spectrometer (Thermo Fisher Scientific Inc.,Waltham, MA, US). From each sample 2 µl was
injected on a 3 µm C18 ACE capillary column (Bischoff, Leonberg, Germany) with 10 cm to
100 µm ID and separated with CH3CN/MeOH/THF (5.8/3.5/0.7, v/v/v) under isocratic
conditions for 120 min at 25°C. MS run time was 120 min, which included three scan events.
First scan event (1): Fourier transform mass spectrometry (FTMS) resolution was set to 60000
with a detected mass range of 528.0-532.0 and a surface-induced dissociation (SID) achieved at
35.0V. Second scan event (2): ion trap mass spectrometry (ITMS) for the most intense ion from
(1) MS/MS activation type: collision-induced dissociation (CID), minimum signal required:
20.0, isolation width: 3.00; normalized collected energy: 15.0, default charge state: 1, activation
Q: 0.250, activation time: 30,000. Third scan event: ITMS for the most intense ion from parent
list in (2) MS3 activation type: CID, minimum signal required: 20.0, isolation width: 3.00,
normalized collected energy: 20.0, default charge state:1, activation Q: 0.250, activation time:
30,000 (chromatography and LC-MS measurements were performed by Ulrike Oster, from the
working group of Prof. Soll at the Department of Botany, LMU Munich).
Examination of fossil DNA. Genomic DNA from sediment samples was extracted using the
Ultra Clean Soil™ DNA Kit (Mobio Laboratories, Solana Beach, CA) according to the
instructions of the manufacturer, using 0.4 ml aliquots of each sample. For the detection of BS-1
genomic DNA in sediments a set of specific primers was employed BS1-ITS38f and BS1-
ITS518r (Marschall et al., 2010). For specific amplification of green sulfur bacterial sequences
primer 341f in combination with GSB822r was used (Overmann et al., 1999). Quantitative real-
time PCR (RT-qPCR) reactions were performed in 25 ml of reactions using the iQ SYBR
GreenSupermix (Biorad) and a Biorad iCycler. To each reaction, bovine serumalbumine was
added at a concentration of 0.4 mg ml-1
. Each reaction contained between 0.5 and 5 ng of DNA
extract or the cDNA equivalent to 9 ng of RNA. PCR conditions were 95°C for 5 min, 45 cycles
consisting of 94°C for 30 sec, melting at 63°C for 45 sec, and extension at 72°C for 1 min, and a
final step of 10 min at 72°C. In the sediment samples, the copy numbers of ITS-DNA were
Material and Methods
- 34 -
determined using 20 ng of DNA per assay. A linearized plasmid containing the cloned fragment
from the 16S and 23S rRNA operon of Chlorobium phaeobacteroides BS1 was used for
calibration. An inhibition test containing 105 copies of this plasmid was performed for each
sample. When inhibition was observed a sample dilution of 1:10 was employed for further
measurements. Each quantification was performed in three parallels. (DNA was extracted by
Evelyn Marschall and RT-qPCR were performed by Evelyn Marschall and Ovidiu Rücker)
Distribution of Chlorobiaceae in the chemocline of Lake Sakinaw
Pigment analysis. Samples from different depths of the chemocline in Lake Sakinaw (Canada)
were taken in May 2008 (500 ml) and July 2009 (2 l) (sampling was performed by Prof. Tom
Beatty, University of British Columbia). Cell material was concentrated on GF/F filters
(Whatman, Maidstone, UK) and stored at -20°C. For pigment extraction 4 ml methanol/acetone
(2:7, v/v) were added to each filter and after 15 min of sonication in an ultrasonic bath extraction
was performed in the dark at 4°C over night. The resulting extracts were purified through
filtration (0.22 µm pore size), the solvent evaporated by a nitrogen flow and dried samples were
stored at -20°C upon usage. For standardization of BChl e contents pigment extracts from Chl.
phaeobacteroides BS1 were used. Total standard BChl e was quantified photometrically at a
wavelength of 650 nm (Lambda 25 spectrophotometer, Perkin Elmer), after redissolving the
pigments in acetone, employing the molar extinction coefficient of 48.9 mM-1
cm-1
(58.6 l g-1
cm-1
) (Borrego et al., 1999).
For separation of different homologs, pigments were redissolved in 135 µl
methanol/acetonitrile (1:5, v/v) and 15 µl of a ammonium acetate solution as ion pairing agent
were added. Reversed-phase HPLC was accomplished using a Dionex system equipped with a
P580 pump, an STH585 column oven, a PDA-100 photo diode array detector and a RF2000
online fluorescence detector (Dionex Softron, Sunnyvale, CA). For separation, a Spherisorb
ODS2 column (3µm, 250 mm by 4.6mm) in-line with a precolumn packed with the same
material (CS Chromatographie Service, Langerwehe, Germany) was employed. The mobile
phase consisted of a linear gradient of a mixture of acetonitrile, methanol, 0.01M ammonium
acetate and ethyl acetate at a flow rate of 0.7 ml min-1
as described previously (Airs et al., 2001).
Fluorimetric detection was carried out at an excitation wavelength of 476 nm and an emission at
Material and Methods
- 35 -
676 nm. For samples from 2009 measurements were performed by Anne Köhler under
supervision of O. Rücker.
RNA extraction and RT-qPCR. Samples from different depths of the chemocline in Lake
Sakinaw were taken July 2009 (2 l). Cell material was concentrated on filters in sterivex and
1 ml RNAlater solution was added. Cells from filters were lysed by addition of 600 µl lysis
buffer (50 mM Na-acetate, 1% SDS, 10 mM EDTA, pH 4.2), 600 µl phenol (pH 4.5-5.5) and 1 g
of 0.1-mm-diameter siliconized zirconia beads (BioSpec Products, Bartlesville, USA) followed
by disruption in a beadbeater (BioSpec Products, Bartlesville, USA) for 5 min. The RNAlater
solution was concentrated using Amicon Ultra – 0.5 ml 50K centricons (Millipore, Bedford,
MA) and 0.7 ml lysis buffer (20 mM Na-acetate pH 5.5, 0.5% SDS, 1 mM EDTA, pH 8.0) were
added. Cells were lysed by mechanical disruption using a syringe needle with 0.6 µm diameter.
Total RNA from filter and liquid fractions was isolated using phenol-chloroform (Chomczynski
and Sacchi, 1987) and subsequently pooled and purified with the RNeasy MiniElute Cleanup Kit
(Qiagen, Hilden, Germany) according to the protocol of the manufacturer. The RNA was treated
with Turbo DNA free (Applied Biosystems, Foster City, CA) to remove all remaining DNA
contamination. RNA concentrations were determined with the nanodrop ND-1000 (peqlab,
Erlangen, Germany), and quality was assessed on a formaldehyde gel (3.1%, w/v).
Reverse transcription was performed with the ImProm II Kit (Promega) using 4.5 µl of RNA
samples (total 16 µl) according to the protocol of the manufacturer. Negative controls were
prepared by omitting the reverse transcriptase and served to verify the absence of contaminating
genomic DNA. Quantitative real-time PCR (RT-qPCR) reactions with custom designed gene
specific primers were performed using 25 µl reactions with iQ SYBR Green Supermix and 4 µl
of cDNA solution and at optimized PCR conditions in a iCycler (Bio-Rad, Hercules, CA). For
standardization, the copy number of 16S rRNA gene transcripts was quantified in parallel for all
samples using a plasmid containing the cloned fragment from the 16S rRNA and ITS region of
the investigated bacterium. Each quantification was performed in three parallels. This
experiment was performed by Anne Köhler under the supervision of O. Rücker.
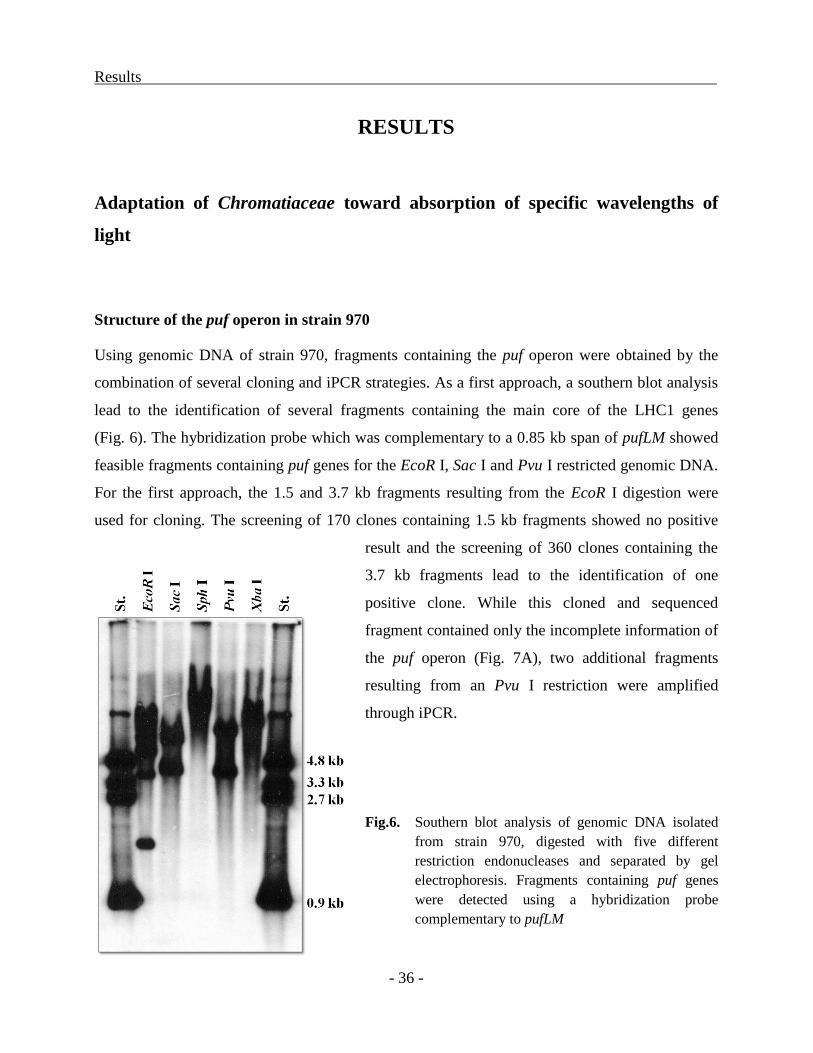
Results
- 36 -
RESULTS
Adaptation of Chromatiaceae toward absorption of specific wavelengths of
light
Structure of the puf operon in strain 970
Using genomic DNA of strain 970, fragments containing the puf operon were obtained by the
combination of several cloning and iPCR strategies. As a first approach, a southern blot analysis
lead to the identification of several fragments containing the main core of the LHC1 genes
(Fig. 6). The hybridization probe which was complementary to a 0.85 kb span of pufLM showed
feasible fragments containing puf genes for the EcoR I, Sac I and Pvu I restricted genomic DNA.
For the first approach, the 1.5 and 3.7 kb fragments resulting from the EcoR I digestion were
used for cloning. The screening of 170 clones containing 1.5 kb fragments showed no positive
result and the screening of 360 clones containing the
3.7 kb fragments lead to the identification of one
positive clone. While this cloned and sequenced
fragment contained only the incomplete information of
the puf operon (Fig. 7A), two additional fragments
resulting from an Pvu I restriction were amplified
through iPCR.
Fig.6. Southern blot analysis of genomic DNA isolated
from strain 970, digested with five different
restriction endonucleases and separated by gel
electrophoresis. Fragments containing puf genes
were detected using a hybridization probe
complementary to pufLM
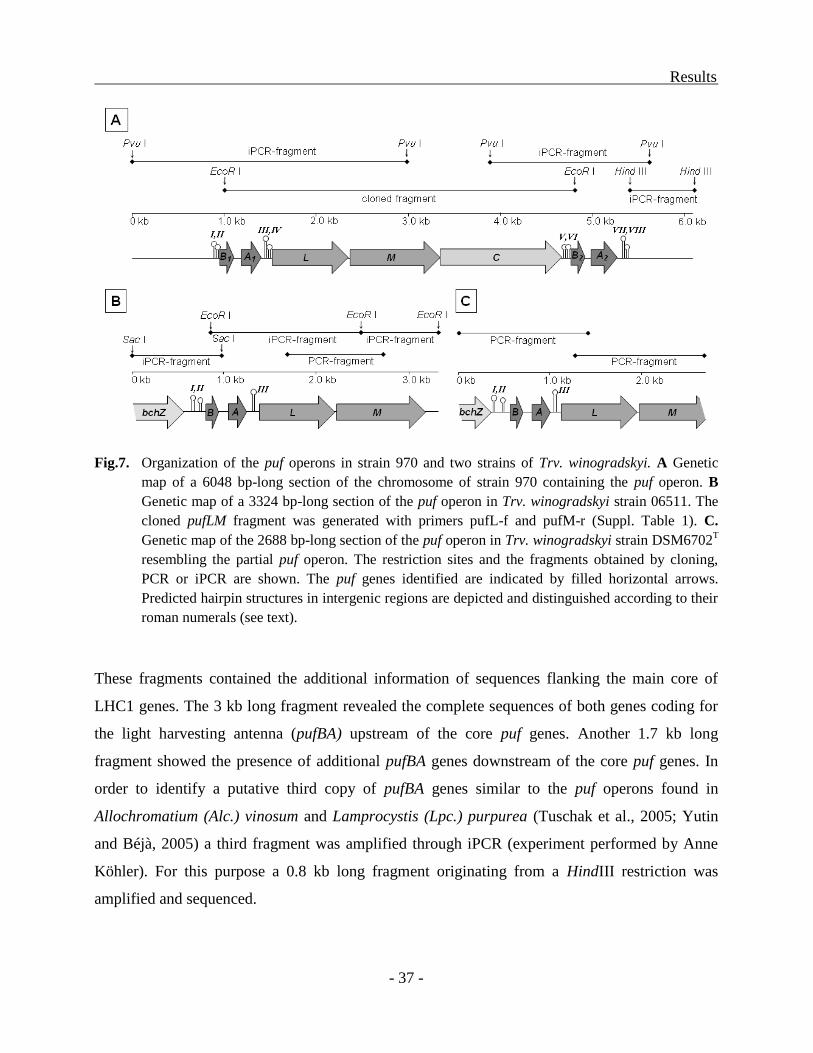
Results
- 37 -
Fig.7. Organization of the puf operons in strain 970 and two strains of Trv. winogradskyi. A Genetic
map of a 6048 bp-long section of the chromosome of strain 970 containing the puf operon. B
Genetic map of a 3324 bp-long section of the puf operon in Trv. winogradskyi strain 06511. The
cloned pufLM fragment was generated with primers pufL-f and pufM-r (Suppl. Table 1). C.
Genetic map of the 2688 bp-long section of the puf operon in Trv. winogradskyi strain DSM6702T
resembling the partial puf operon. The restriction sites and the fragments obtained by cloning,
PCR or iPCR are shown. The puf genes identified are indicated by filled horizontal arrows.
Predicted hairpin structures in intergenic regions are depicted and distinguished according to their
roman numerals (see text).
These fragments contained the additional information of sequences flanking the main core of
LHC1 genes. The 3 kb long fragment revealed the complete sequences of both genes coding for
the light harvesting antenna (pufBA) upstream of the core puf genes. Another 1.7 kb long
fragment showed the presence of additional pufBA genes downstream of the core puf genes. In
order to identify a putative third copy of pufBA genes similar to the puf operons found in
Allochromatium (Alc.) vinosum and Lamprocystis (Lpc.) purpurea (Tuschak et al., 2005; Yutin
and Béjà, 2005) a third fragment was amplified through iPCR (experiment performed by Anne
Köhler). For this purpose a 0.8 kb long fragment originating from a HindIII restriction was
amplified and sequenced.
Results
- 38 -
A 6084 nucleotides (nt)-long genome fragment containing the puf operon was obtained by the
combined cloning and iPCR strategy (Fig. 7A, Fig. 8). Seven ORFs with high similarity to
pufBALMC genes of other proteobacterial species were comprised within this whole fragment.
Two copies of the genes encoding the β and α subunits of the LHC1 (pufB1A1 and pufB2A2) are
flanking the three genes coding for the L and M subunits (pufLM) and for the RC-bound
tetraheme cytochrome (pufC) of the photosynthetic reaction center. The individual puf genes
were 141 nt (pufB1), 222 nt (pufA1), 822 nt (pufL), 975 nt (pufM), 1329 nt (pufC), 141 nt (pufB2),
and 261 nt (pufA2) long. An additional ORF was detected 3’ of pufA2 and represents a putative
fragment of a radical SAM domain protein (not shown in Fig. 7A). This sequence is most closely
related to the Rps. palustris BisA53 radical SAM domain-containing protein (accession no.
YP_781910.1), a protein that usually is not located in the proximity of the puf operon. ORFs
detected upstream of pufB1 encode putative peptides with no significant similarity to known
protein functions. In addition, no fragments of bchZ could be found.
Several secondary structures flanking the pufBA genes were detected (Fig. 7A, Fig. 8) and
their stabilities calculated with Mfold. Two predicted hairpin structures were found upstream of
pufB1 (I: δG = -17.3 kcal mol-1
, II: δG = -12.5 kcal mol-1
; compare Fig. 7A) and two more stable
secondary structures in the intergenic region between pufA1 and pufL (III: δG = -38.3 kcal mol-1
,
IV: δG = -16.0 kcal mol-1
). Similarly, stable hairpins are present between pufC and pufB2 (V: δG
= -10.8 kcal mol-1
, VI: δG = -11.5 kcal mol-1
) and downstream of pufA2 (VII: δG = -34.9 kcal
mol-1
, VIII: δG = -13.7 kcal mol-1
).

Results
- 39 -
Fig.8. Nucleotide sequence and deduced amino acid sequences of predicted puf genes of strain 970.
Gene names were depicted at the codon start and stop codons are marked with an asterisk.
Predicted hairpin-loop structures are underlined and numbered on the left side of the sequence
from I to VIII. Recognition sites for Escherichia coli RNase E (GAUUU) found in the sequence
of puf A2 are shaded in grey.
1 CCCGTATCACAGTCAGGGCAAATCTGTTCTGAGCAGACAGCGCGAGAGCCGGCCNGGCGC
61 GGCGCTGGCGTCAGTTGTCAGTGAGACGGAGCTAGTCAAAGACCAGACGCGGCAAGCGAG
121 CCAGACGTTGAATGGCCGCGGCCAGGGTGCCATCCGAGATGAGCTTAATCACGCCGATGG
181 CGAAGCATTGCAAGGCATTCATGCTCTCCGGTCTGCGCTCCGTGCGGATGGTTGAGCGAT
241 CCTCATCCCAGCTTCGAGCCCACCTTGGATCCATGCGCCAGTGACAGCGATTCCCGATCA
301 CCTAGTGTCGCAATAAAGGCTAGCAGGCGCTCGGGGTCAGGCTTCCCGGAGGATGGCTTG
361 TGCCCCAATGGATTCAGGAATTGCTGGGTCGTTAAGGGTTCATCCTGGTAGAGGTGTAAA
421 TCGGACTTGACATGTTCATCAGTCAGGCTAGACTTACACCTAGTTTCCCGAGCCGGCCCC
481 CGAGGCGGGCTCTGTCATCCTGGTTCTTCGCGACTAGACCCATTGCACAAATGCCCACTG
541 ACAGCCTGACTAATAACATAAGCACATCCCCGGTGGCTGCTCTTGTGCAACGTTCGCCCA
601 GGCAACCCTCTCTCAGCGGGTTGGATCTGACCCCGTTGGGGGAGGCTGACAGTGTGGTGG
661 ATATTCGCAATAGCATTCAATCAGGAGGCTGTGGATTGGCCAGGTGCCACAACGGGGAAA
721 CAGTTTCGTGGTTGGTTGCCGGAGCAAGAGTTGCTGCGGGAACCGACTCGTTTAGAGCTT
781 CAGTGGTGCCTGTCGATTTGTCATGCACCCAAGAAGCGCATGGCCGCCCGGNTCGTACGG
841 I,II GCACTTGGTCCGTTGGGGCAGTTTTGTCCCAACAAACAAGATGGTGCGTTGCAAGCGCGC
901 CGAAAACCTAAGCCGCAAGGCTCAACTCACTCTCTAGAGAGGATTTCATCATGGCTGAAA
pufB1 M A E
961 AATCAACCACCGGTCTGACTGAAGCAGAATCAAAAGAATTCCACGGAATTTTCATGGCCA
K S T T G L T E A E S K E F H G I F M A
1021 GCATGACCCTTTGGTTTGGTTTGGTTGTTCTTGCTCACATTCTGTCTTGGTTGTACCGCC
S M T L W F G L V V L A H I L S W L Y R
1081 CCTGGCTGTAAGCCCTTCGAGCTAGTCCGACCGACCTTTCTTTATTAGCAGATGCCGATG
P W L *
1141 TTCGGCACTGTGACACGCACTTGGAGATGACACAATGAACGCAAAAAGCTTCGACGGTAT
pufA1 M N A K S F D G M
1201 GCACAAACTGTGGATGATCATGAACCCGGTTTCCACACTTTGGGCCATCTTTATTTTCCA
H K L W M I M N P V S T L W A I F I F Q
1261 GATCTTCCTGGGTCTGCTGATCCACATGGTTGTGCTGAGCTCTGACCTGAACTGGCATGA
I F L G L L I H M V V L S S D L N W H D
1321 TGATCAGATTCCTGTCGGTTATCAGCTGCAGGGCGAGACGTTGCCTGTCAACCTCGAAAT
D Q I P V G Y Q L Q G E T L P V N L E M
1381 III GAAAGCCGCCCAATAAATCGGCCCAACGGTCCTTTTCGGATGGTGCTGACCGGGGCGTAC
K A A Q *
1441 IV TCGCCCCCCGGGTTTGCGCGTCGGTCAGCATCCGAATTGCTATGTGGAGGCAGCAGGTCA
1501 TGGTGTCTCCCCAGCAGAGGAAATTACGATGGCCTTGCTAAATTTTGAGAAAAAATACCG
pufL M A L L N F E K K Y R
1561 CGTACGCGGTGGGACGTTGGTCGGGGGAGACCTGTTTGACTTTTGGGTGGGGCCGTTTTA
V R G G T L V G G D L F D F W V G P F Y
1621 TGTCGGCTTCTTCGGAGTCTCGGCGGTCTTCTTCGCGACCCTCGGTACCATGCTGATCTT
V G F F G V S A V F F A T L G T M L I L
1681 ATTTGGAGCGGCAATTGGGCCGACATTAAACATCTGGCAAATCAGTATTGCCCCGCCTGA
F G A A I G P T L N I W Q I S I A P P D
1741 TCTAAGCGTTGGTCTTGGATTTGCGCCGATCAGGGAAGGCGGTTTGTGGCAGGTAATCAC
L S V G L G F A P I R E G G L W Q V I T
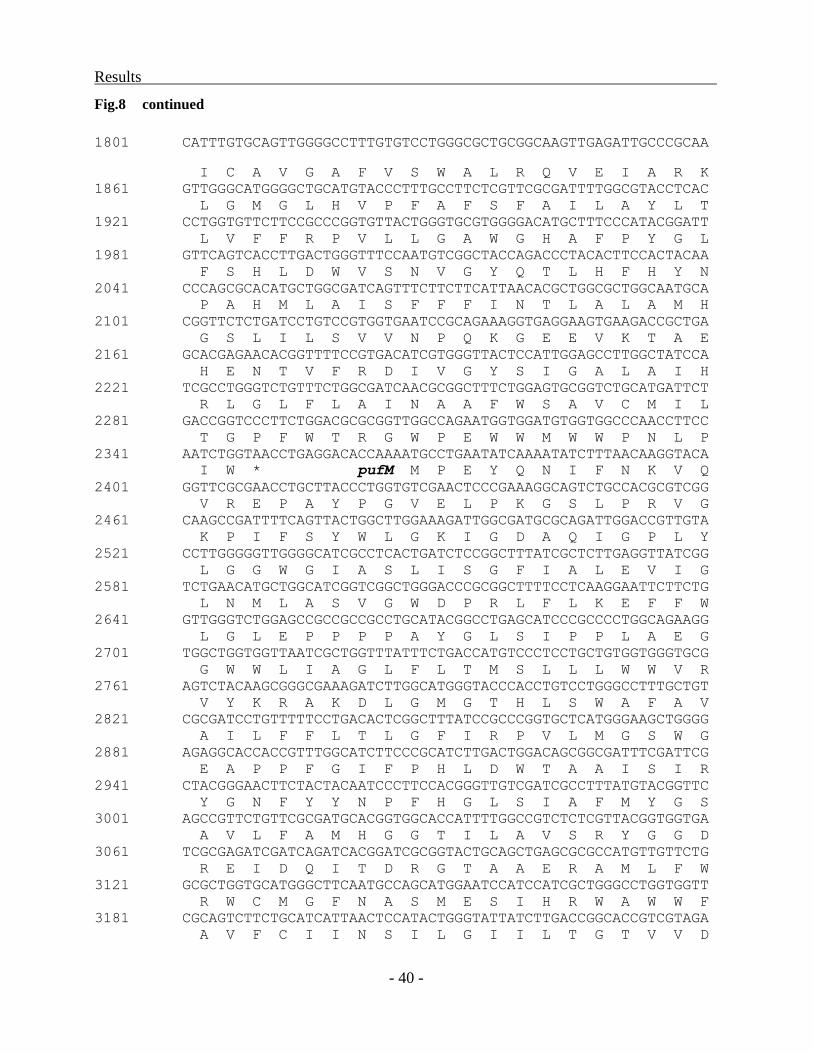
Results
- 40 -
Fig.8 continued
1801 CATTTGTGCAGTTGGGGCCTTTGTGTCCTGGGCGCTGCGGCAAGTTGAGATTGCCCGCAA
I C A V G A F V S W A L R Q V E I A R K
1861 GTTGGGCATGGGGCTGCATGTACCCTTTGCCTTCTCGTTCGCGATTTTGGCGTACCTCAC
L G M G L H V P F A F S F A I L A Y L T
1921 CCTGGTGTTCTTCCGCCCGGTGTTACTGGGTGCGTGGGGACATGCTTTCCCATACGGATT
L V F F R P V L L G A W G H A F P Y G L
1981 GTTCAGTCACCTTGACTGGGTTTCCAATGTCGGCTACCAGACCCTACACTTCCACTACAA
F S H L D W V S N V G Y Q T L H F H Y N
2041 CCCAGCGCACATGCTGGCGATCAGTTTCTTCTTCATTAACACGCTGGCGCTGGCAATGCA
P A H M L A I S F F F I N T L A L A M H
2101 CGGTTCTCTGATCCTGTCCGTGGTGAATCCGCAGAAAGGTGAGGAAGTGAAGACCGCTGA
G S L I L S V V N P Q K G E E V K T A E
2161 GCACGAGAACACGGTTTTCCGTGACATCGTGGGTTACTCCATTGGAGCCTTGGCTATCCA
H E N T V F R D I V G Y S I G A L A I H
2221 TCGCCTGGGTCTGTTTCTGGCGATCAACGCGGCTTTCTGGAGTGCGGTCTGCATGATTCT
R L G L F L A I N A A F W S A V C M I L
2281 GACCGGTCCCTTCTGGACGCGCGGTTGGCCAGAATGGTGGATGTGGTGGCCCAACCTTCC
T G P F W T R G W P E W W M W W P N L P
2341 AATCTGGTAACCTGAGGACACCAAAATGCCTGAATATCAAAATATCTTTAACAAGGTACA
I W * pufM M P E Y Q N I F N K V Q
2401 GGTTCGCGAACCTGCTTACCCTGGTGTCGAACTCCCGAAAGGCAGTCTGCCACGCGTCGG
V R E P A Y P G V E L P K G S L P R V G
2461 CAAGCCGATTTTCAGTTACTGGCTTGGAAAGATTGGCGATGCGCAGATTGGACCGTTGTA
K P I F S Y W L G K I G D A Q I G P L Y
2521 CCTTGGGGGTTGGGGCATCGCCTCACTGATCTCCGGCTTTATCGCTCTTGAGGTTATCGG
L G G W G I A S L I S G F I A L E V I G
2581 TCTGAACATGCTGGCATCGGTCGGCTGGGACCCGCGGCTTTTCCTCAAGGAATTCTTCTG
L N M L A S V G W D P R L F L K E F F W
2641 GTTGGGTCTGGAGCCGCCGCCGCCTGCATACGGCCTGAGCATCCCGCCCCTGGCAGAAGG
L G L E P P P P A Y G L S I P P L A E G
2701 TGGCTGGTGGTTAATCGCTGGTTTATTTCTGACCATGTCCCTCCTGCTGTGGTGGGTGCG
G W W L I A G L F L T M S L L L W W V R
2761 AGTCTACAAGCGGGCGAAAGATCTTGGCATGGGTACCCACCTGTCCTGGGCCTTTGCTGT
V Y K R A K D L G M G T H L S W A F A V
2821 CGCGATCCTGTTTTTCCTGACACTCGGCTTTATCCGCCCGGTGCTCATGGGAAGCTGGGG
A I L F F L T L G F I R P V L M G S W G
2881 AGAGGCACCACCGTTTGGCATCTTCCCGCATCTTGACTGGACAGCGGCGATTTCGATTCG
E A P P F G I F P H L D W T A A I S I R
2941 CTACGGGAACTTCTACTACAATCCCTTCCACGGGTTGTCGATCGCCTTTATGTACGGTTC
Y G N F Y Y N P F H G L S I A F M Y G S
3001 AGCCGTTCTGTTCGCGATGCACGGTGGCACCATTTTGGCCGTCTCTCGTTACGGTGGTGA
A V L F A M H G G T I L A V S R Y G G D
3061 TCGCGAGATCGATCAGATCACGGATCGCGGTACTGCAGCTGAGCGCGCCATGTTGTTCTG
R E I D Q I T D R G T A A E R A M L F W
3121 GCGCTGGTGCATGGGCTTCAATGCCAGCATGGAATCCATCCATCGCTGGGCCTGGTGGTT
R W C M G F N A S M E S I H R W A W W F
3181 CGCAGTCTTCTGCATCATTAACTCCATACTGGGTATTATCTTGACCGGCACCGTCGTAGA
A V F C I I N S I L G I I L T G T V V D

Results
- 41 -
Fig.8 continued
3241 CAACTGGTACCTTTGGGCAGTGAAACACGGCGTAGCACCCAGCTACCCATCTGAGCTGAC
N W Y L W A V K H G V A P S Y P S E L T
3301 CATCGATAATCCCTACCTGACGCAGGGGGTGGCGCAATGAAACAGCGAAATCATCACGCG
I D N P Y L T Q G V A Q *
pufC M K Q R N H H A
3361 CTGGCACTTCTGAGTCTCGGAGTAGCCGCGTTCATCACAGGTTGCGATTTTCCGCCGCAA
L A L L S L G V A A F I T G C D F P P Q
3421 GACGTGGTACAGACCGGCTACCGTGGTTTGGGCATGCAGCAAAACTACAACCCGAAACTG
D V V Q T G Y R G L G M Q Q N Y N P K L
3481 TTGCAGAAAGTCATCGACGCCACTCAGGTGCCGGATGCGATTCCTGCGGCGACCCCGGGT
L Q K V I D A T Q V P D A I P A A T P G
3541 GGAGCATTGGCCAAGGACGTCTACAAAAACGTCCAGGTTCTCGGCGACCTGTCGGTCAAC
G A L A K D V Y K N V Q V L G D L S V N
3601 GAGTTCAACCGCACCATGGTGGCACTGACCACCTGGGTTGCTCCGAACGAAGGCTGCACC
E F N R T M V A L T T W V A P N E G C T
3661 TACTGCCACGAGGGCACGAACTGGGAGTCTGATGGCGTCTACACCAAGATCGCCTCGCGG
Y C H E G T N W E S D G V Y T K I A S R
3721 CGCATGTTGGAAATGACCCGTGACACCAACAGCAACTGGAAAGGGCACGTGGCAGATACC
R M L E M T R D T N S N W K G H V A D T
3781 GGTGTGACCTGCTACACCTGCCATCGTGGCAAACCCGTACCGGAGCATGTCTGGACGACC
G V T C Y T C H R G K P V P E H V W T T
3841 GATCCTGGTCCGGATATTCCGTCTGTTTTCCCGTCAAATGGGCAAAATACGATCGGCTAC
D P G P D I P S V F P S N G Q N T I G Y
3901 AACGTGGCTTATACCGCGCTGCCGTTTGATCCATTCACGCCCTTCCTGTTGGGAGAAAAT
N V A Y T A L P F D P F T P F L L G E N
3961 GAAATCCGAGTCTCGGGCAACACCGACCTGCGCAATACCAACCGCAAGTCGATCAAGCAG
E I R V S G N T D L R N T N R K S I K Q
4021 GCGGAGTGGACCTTTGCACTGATGACCCACTTCTCCGAGGCGCTTGGCGTGAACTGCACC
A E W T F A L M T H F S E A L G V N C T
4081 TATTGCCATAACAGCCGGGCCTTCATGGACTGGAATCAGAGCACACCCAAGCGTGTGCCG
Y C H N S R A F M D W N Q S T P K R V P
4141 GCGTGGCATGCGATTCGCAATGTGCGAGACATCAACATCCAGTATGTCGAGCCATTGGGC
A W H A I R N V R D I N I Q Y V E P L G
4201 GAGGTGTTGCCTGCGTCGCGCAAAGGACCGCTTGGCGATCCGTTCAAGGTGAACTGCTTA
E V L P A S R K G P L G D P F K V N C L
4261 ACCTGTCACCAAGGCGCCTACAAGCCATTGTTCGGCGTACCCATGGCGAAGGACTATCCG
T C H Q G A Y K P L F G V P M A K D Y P
4321 GCGCTTTATGAAACGGCGGCTGTAGAGGAAGAGGCTCCTGCTGCGGAAGCTGAGGCAGCT
A L Y E T A A V E E E A P A A E A E A A
4381 CCTGCTGAAGCAGCACCGGTCGCGGAAGCTCCGGCTGAAGCGGCACCGGCTGAAGCTGAA
P A E A A P V A E A P A E A A P A E A E
4441 GCAGCTCCGGCGGCGGAAGCTGAAGCGGCTCCTGCTGAAGTTGCACCGGTTGCGGAAGCT
A A P A A E A E A A P A E V A P V A E A
4501 CCGGCTGAAGCAGCTCCTGCTTCCGAAGCAGCTGAGGCTCCGGCTCCGATGGCCGATGCG
P A E A A P A S E A A E A P A P M A D A
4561 GGTGACGTTGTCGCTCCAGAGGCGACTCCGACAGAACCTACAGCACCTCCGATGCAGTAC
G D V V A P E A T P T E P T A P P M Q Y
4621 V GTCCCTGCGCCGATAGGCTACCAACCGGCACCTGCGCAACGCTAGGGGACGGGTTTATCC
V P A P I G Y Q P A P A Q R *
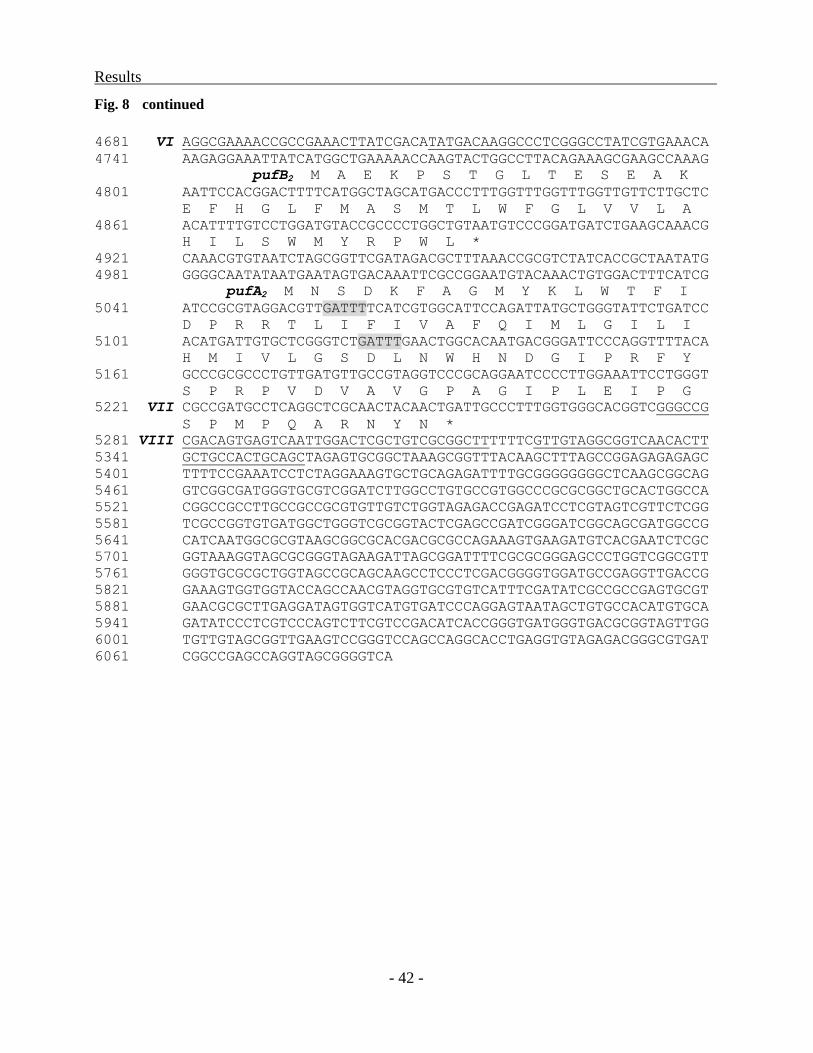
Results
- 42 -
Fig. 8 continued
4681 VI AGGCGAAAACCGCCGAAACTTATCGACATATGACAAGGCCCTCGGGCCTATCGTGAAACA
4741 AAGAGGAAATTATCATGGCTGAAAAACCAAGTACTGGCCTTACAGAAAGCGAAGCCAAAG
pufB2 M A E K P S T G L T E S E A K
4801 AATTCCACGGACTTTTCATGGCTAGCATGACCCTTTGGTTTGGTTTGGTTGTTCTTGCTC
E F H G L F M A S M T L W F G L V V L A
4861 ACATTTTGTCCTGGATGTACCGCCCCTGGCTGTAATGTCCCGGATGATCTGAAGCAAACG
H I L S W M Y R P W L *
4921 CAAACGTGTAATCTAGCGGTTCGATAGACGCTTTAAACCGCGTCTATCACCGCTAATATG
4981 GGGGCAATATAATGAATAGTGACAAATTCGCCGGAATGTACAAACTGTGGACTTTCATCG
pufA2 M N S D K F A G M Y K L W T F I
5041 ATCCGCGTAGGACGTTGATTTTCATCGTGGCATTCCAGATTATGCTGGGTATTCTGATCC
D P R R T L I F I V A F Q I M L G I L I
5101 ACATGATTGTGCTCGGGTCTGATTTGAACTGGCACAATGACGGGATTCCCAGGTTTTACA
H M I V L G S D L N W H N D G I P R F Y
5161 GCCCGCGCCCTGTTGATGTTGCCGTAGGTCCCGCAGGAATCCCCTTGGAAATTCCTGGGT
S P R P V D V A V G P A G I P L E I P G
5221 VII CGCCGATGCCTCAGGCTCGCAACTACAACTGATTGCCCTTTGGTGGGCACGGTCGGGCCG
S P M P Q A R N Y N *
5281 VIII CGACAGTGAGTCAATTGGACTCGCTGTCGCGGCTTTTTTCGTTGTAGGCGGTCAACACTT
5341 GCTGCCACTGCAGCTAGAGTGCGGCTAAAGCGGTTTACAAGCTTTAGCCGGAGAGAGAGC
5401 TTTTCCGAAATCCTCTAGGAAAGTGCTGCAGAGATTTTGCGGGGGGGGCTCAAGCGGCAG
5461 GTCGGCGATGGGTGCGTCGGATCTTGGCCTGTGCCGTGGCCCGCGCGGCTGCACTGGCCA
5521 CGGCCGCCTTGCCGCCGCGTGTTGTCTGGTAGAGACCGAGATCCTCGTAGTCGTTCTCGG
5581 TCGCCGGTGTGATGGCTGGGTCGCGGTACTCGAGCCGATCGGGATCGGCAGCGATGGCCG
5641 CATCAATGGCGCGTAAGCGGCGCACGACGCGCCAGAAAGTGAAGATGTCACGAATCTCGC
5701 GGTAAAGGTAGCGCGGGTAGAAGATTAGCGGATTTTCGCGCGGGAGCCCTGGTCGGCGTT
5761 GGGTGCGCGCTGGTAGCCGCAGCAAGCCTCCCTCGACGGGGTGGATGCCGAGGTTGACCG
5821 GAAAGTGGTGGTACCAGCCAACGTAGGTGCGTGTCATTTCGATATCGCCGCCGAGTGCGT
5881 GAACGCGCTTGAGGATAGTGGTCATGTGATCCCAGGAGTAATAGCTGTGCCACATGTGCA
5941 GATATCCCTCGTCCCAGTCTTCGTCCGACATCACCGGGTGATGGGTGACGCGGTAGTTGG
6001 TGTTGTAGCGGTTGAAGTCCGGGTCCAGCCAGGCACCTGAGGTGTAGAGACGGGCGTGAT
6061 CGGCCGAGCCAGGTAGCGGGGTCA
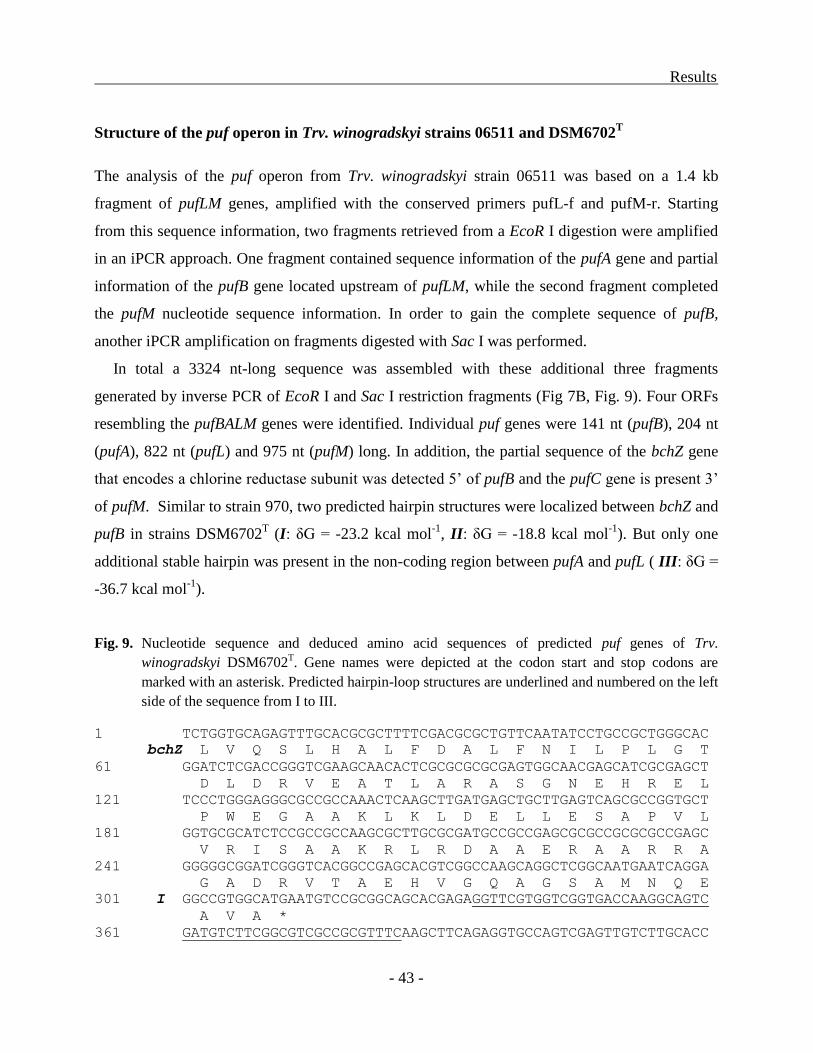
Results
- 43 -
Structure of the puf operon in Trv. winogradskyi strains 06511 and DSM6702T
The analysis of the puf operon from Trv. winogradskyi strain 06511 was based on a 1.4 kb
fragment of pufLM genes, amplified with the conserved primers pufL-f and pufM-r. Starting
from this sequence information, two fragments retrieved from a EcoR I digestion were amplified
in an iPCR approach. One fragment contained sequence information of the pufA gene and partial
information of the pufB gene located upstream of pufLM, while the second fragment completed
the pufM nucleotide sequence information. In order to gain the complete sequence of pufB,
another iPCR amplification on fragments digested with Sac I was performed.
In total a 3324 nt-long sequence was assembled with these additional three fragments
generated by inverse PCR of EcoR I and Sac I restriction fragments (Fig 7B, Fig. 9). Four ORFs
resembling the pufBALM genes were identified. Individual puf genes were 141 nt (pufB), 204 nt
(pufA), 822 nt (pufL) and 975 nt (pufM) long. In addition, the partial sequence of the bchZ gene
that encodes a chlorine reductase subunit was detected 5’ of pufB and the pufC gene is present 3’
of pufM. Similar to strain 970, two predicted hairpin structures were localized between bchZ and
pufB in strains DSM6702T (I: δG = -23.2 kcal mol
-1, II: δG = -18.8 kcal mol
-1). But only one
additional stable hairpin was present in the non-coding region between pufA and pufL ( III: δG =
-36.7 kcal mol-1
).
Fig. 9. Nucleotide sequence and deduced amino acid sequences of predicted puf genes of Trv.
winogradskyi DSM6702T. Gene names were depicted at the codon start and stop codons are
marked with an asterisk. Predicted hairpin-loop structures are underlined and numbered on the left
side of the sequence from I to III.
1 TCTGGTGCAGAGTTTGCACGCGCTTTTCGACGCGCTGTTCAATATCCTGCCGCTGGGCAC
bchZ L V Q S L H A L F D A L F N I L P L G T
61 GGATCTCGACCGGGTCGAAGCAACACTCGCGCGCGCGAGTGGCAACGAGCATCGCGAGCT
D L D R V E A T L A R A S G N E H R E L
121 TCCCTGGGAGGGCGCCGCCAAACTCAAGCTTGATGAGCTGCTTGAGTCAGCGCCGGTGCT
P W E G A A K L K L D E L L E S A P V L
181 GGTGCGCATCTCCGCCGCCAAGCGCTTGCGCGATGCCGCCGAGCGCGCCGCGCGCCGAGC
V R I S A A K R L R D A A E R A A R R A
241 GGGGGCGGATCGGGTCACGGCCGAGCACGTCGGCCAAGCAGGCTCGGCAATGAATCAGGA
G A D R V T A E H V G Q A G S A M N Q E
301 I GGCCGTGGCATGAATGTCCGCGGCAGCACGAGAGGTTCGTGGTCGGTGACCAAGGCAGTC
A V A *
361 GATGTCTTCGGCGTCGCCGCGTTTCAAGCTTCAGAGGTGCCAGTCGAGTTGTCTTGCACC
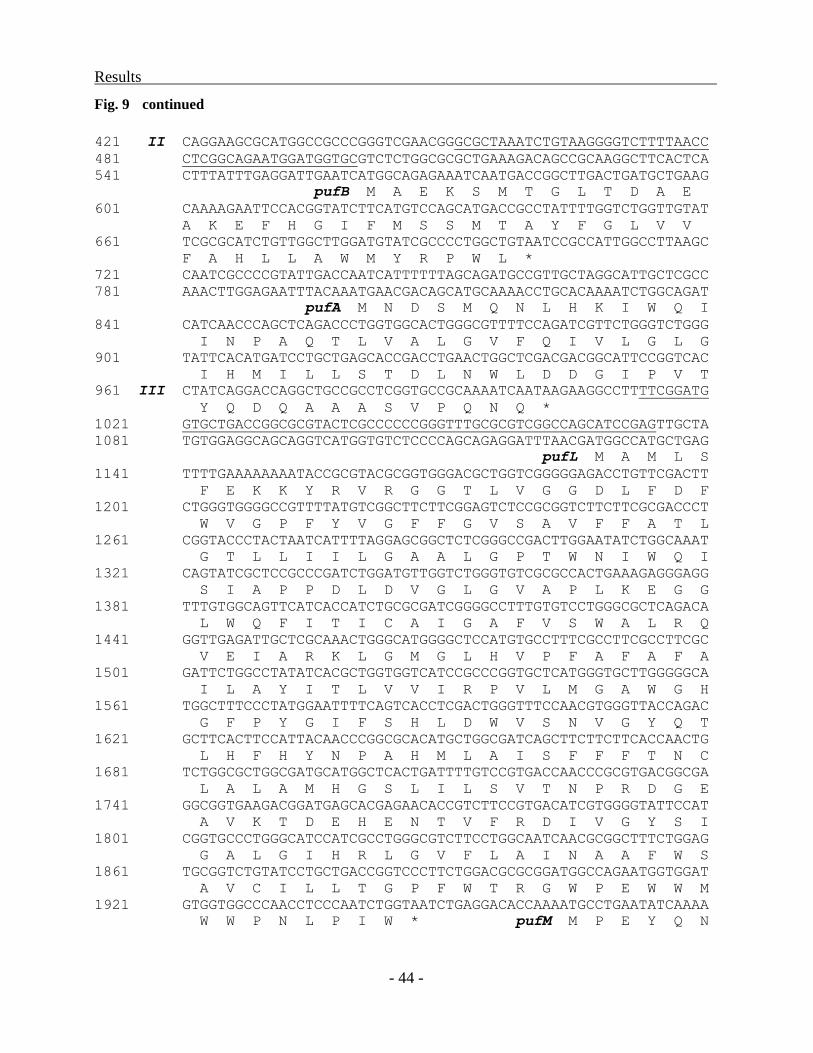
Results
- 44 -
Fig. 9 continued
421 II CAGGAAGCGCATGGCCGCCCGGGTCGAACGGGCGCTAAATCTGTAAGGGGTCTTTTAACC
481 CTCGGCAGAATGGATGGTGCGTCTCTGGCGCGCTGAAAGACAGCCGCAAGGCTTCACTCA
541 CTTTATTTGAGGATTGAATCATGGCAGAGAAATCAATGACCGGCTTGACTGATGCTGAAG
pufB M A E K S M T G L T D A E
601 CAAAAGAATTCCACGGTATCTTCATGTCCAGCATGACCGCCTATTTTGGTCTGGTTGTAT
A K E F H G I F M S S M T A Y F G L V V
661 TCGCGCATCTGTTGGCTTGGATGTATCGCCCCTGGCTGTAATCCGCCATTGGCCTTAAGC
F A H L L A W M Y R P W L *
721 CAATCGCCCCGTATTGACCAATCATTTTTTAGCAGATGCCGTTGCTAGGCATTGCTCGCC
781 AAACTTGGAGAATTTACAAATGAACGACAGCATGCAAAACCTGCACAAAATCTGGCAGAT
pufA M N D S M Q N L H K I W Q I
841 CATCAACCCAGCTCAGACCCTGGTGGCACTGGGCGTTTTCCAGATCGTTCTGGGTCTGGG
I N P A Q T L V A L G V F Q I V L G L G
901 TATTCACATGATCCTGCTGAGCACCGACCTGAACTGGCTCGACGACGGCATTCCGGTCAC
I H M I L L S T D L N W L D D G I P V T
961 III CTATCAGGACCAGGCTGCCGCCTCGGTGCCGCAAAATCAATAAGAAGGCCTTTTCGGATG
Y Q D Q A A A S V P Q N Q *
1021 GTGCTGACCGGCGCGTACTCGCCCCCCGGGTTTGCGCGTCGGCCAGCATCCGAGTTGCTA
1081 TGTGGAGGCAGCAGGTCATGGTGTCTCCCCAGCAGAGGATTTAACGATGGCCATGCTGAG
pufL M A M L S
1141 TTTTGAAAAAAAATACCGCGTACGCGGTGGGACGCTGGTCGGGGGAGACCTGTTCGACTT
F E K K Y R V R G G T L V G G D L F D F
1201 CTGGGTGGGGCCGTTTTATGTCGGCTTCTTCGGAGTCTCCGCGGTCTTCTTCGCGACCCT
W V G P F Y V G F F G V S A V F F A T L
1261 CGGTACCCTACTAATCATTTTAGGAGCGGCTCTCGGGCCGACTTGGAATATCTGGCAAAT
G T L L I I L G A A L G P T W N I W Q I
1321 CAGTATCGCTCCGCCCGATCTGGATGTTGGTCTGGGTGTCGCGCCACTGAAAGAGGGAGG
S I A P P D L D V G L G V A P L K E G G
1381 TTTGTGGCAGTTCATCACCATCTGCGCGATCGGGGCCTTTGTGTCCTGGGCGCTCAGACA
L W Q F I T I C A I G A F V S W A L R Q
1441 GGTTGAGATTGCTCGCAAACTGGGCATGGGGCTCCATGTGCCTTTCGCCTTCGCCTTCGC
V E I A R K L G M G L H V P F A F A F A
1501 GATTCTGGCCTATATCACGCTGGTGGTCATCCGCCCGGTGCTCATGGGTGCTTGGGGGCA
I L A Y I T L V V I R P V L M G A W G H
1561 TGGCTTTCCCTATGGAATTTTCAGTCACCTCGACTGGGTTTCCAACGTGGGTTACCAGAC
G F P Y G I F S H L D W V S N V G Y Q T
1621 GCTTCACTTCCATTACAACCCGGCGCACATGCTGGCGATCAGCTTCTTCTTCACCAACTG
L H F H Y N P A H M L A I S F F F T N C
1681 TCTGGCGCTGGCGATGCATGGCTCACTGATTTTGTCCGTGACCAACCCGCGTGACGGCGA
L A L A M H G S L I L S V T N P R D G E
1741 GGCGGTGAAGACGGATGAGCACGAGAACACCGTCTTCCGTGACATCGTGGGGTATTCCAT
A V K T D E H E N T V F R D I V G Y S I
1801 CGGTGCCCTGGGCATCCATCGCCTGGGCGTCTTCCTGGCAATCAACGCGGCTTTCTGGAG
G A L G I H R L G V F L A I N A A F W S
1861 TGCGGTCTGTATCCTGCTGACCGGTCCCTTCTGGACGCGCGGATGGCCAGAATGGTGGAT
A V C I L L T G P F W T R G W P E W W M
1921 GTGGTGGCCCAACCTCCCAATCTGGTAATCTGAGGACACCAAAATGCCTGAATATCAAAA
W W P N L P I W * pufM M P E Y Q N
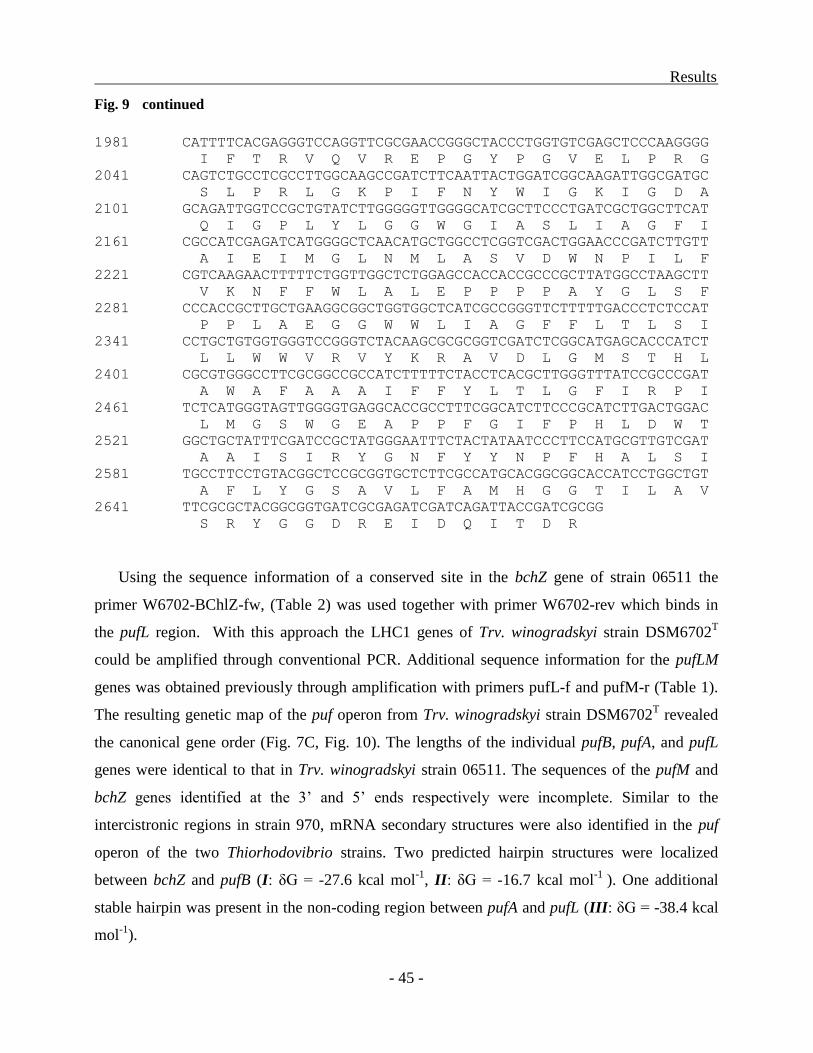
Results
- 45 -
Fig. 9 continued
1981 CATTTTCACGAGGGTCCAGGTTCGCGAACCGGGCTACCCTGGTGTCGAGCTCCCAAGGGG
I F T R V Q V R E P G Y P G V E L P R G
2041 CAGTCTGCCTCGCCTTGGCAAGCCGATCTTCAATTACTGGATCGGCAAGATTGGCGATGC
S L P R L G K P I F N Y W I G K I G D A
2101 GCAGATTGGTCCGCTGTATCTTGGGGGTTGGGGCATCGCTTCCCTGATCGCTGGCTTCAT
Q I G P L Y L G G W G I A S L I A G F I
2161 CGCCATCGAGATCATGGGGCTCAACATGCTGGCCTCGGTCGACTGGAACCCGATCTTGTT
A I E I M G L N M L A S V D W N P I L F
2221 CGTCAAGAACTTTTTCTGGTTGGCTCTGGAGCCACCACCGCCCGCTTATGGCCTAAGCTT
V K N F F W L A L E P P P P A Y G L S F
2281 CCCACCGCTTGCTGAAGGCGGCTGGTGGCTCATCGCCGGGTTCTTTTTGACCCTCTCCAT
P P L A E G G W W L I A G F F L T L S I
2341 CCTGCTGTGGTGGGTCCGGGTCTACAAGCGCGCGGTCGATCTCGGCATGAGCACCCATCT
L L W W V R V Y K R A V D L G M S T H L
2401 CGCGTGGGCCTTCGCGGCCGCCATCTTTTTCTACCTCACGCTTGGGTTTATCCGCCCGAT
A W A F A A A I F F Y L T L G F I R P I
2461 TCTCATGGGTAGTTGGGGTGAGGCACCGCCTTTCGGCATCTTCCCGCATCTTGACTGGAC
L M G S W G E A P P F G I F P H L D W T
2521 GGCTGCTATTTCGATCCGCTATGGGAATTTCTACTATAATCCCTTCCATGCGTTGTCGAT
A A I S I R Y G N F Y Y N P F H A L S I
2581 TGCCTTCCTGTACGGCTCCGCGGTGCTCTTCGCCATGCACGGCGGCACCATCCTGGCTGT
A F L Y G S A V L F A M H G G T I L A V
2641 TTCGCGCTACGGCGGTGATCGCGAGATCGATCAGATTACCGATCGCGG
S R Y G G D R E I D Q I T D R
Using the sequence information of a conserved site in the bchZ gene of strain 06511 the
primer W6702-BChlZ-fw, (Table 2) was used together with primer W6702-rev which binds in
the pufL region. With this approach the LHC1 genes of Trv. winogradskyi strain DSM6702T
could be amplified through conventional PCR. Additional sequence information for the pufLM
genes was obtained previously through amplification with primers pufL-f and pufM-r (Table 1).
The resulting genetic map of the puf operon from Trv. winogradskyi strain DSM6702T revealed
the canonical gene order (Fig. 7C, Fig. 10). The lengths of the individual pufB, pufA, and pufL
genes were identical to that in Trv. winogradskyi strain 06511. The sequences of the pufM and
bchZ genes identified at the 3’ and 5’ ends respectively were incomplete. Similar to the
intercistronic regions in strain 970, mRNA secondary structures were also identified in the puf
operon of the two Thiorhodovibrio strains. Two predicted hairpin structures were localized
between bchZ and pufB (I: δG = -27.6 kcal mol-1
, II: δG = -16.7 kcal mol-1
). One additional
stable hairpin was present in the non-coding region between pufA and pufL (III: δG = -38.4 kcal
mol-1
).

Results
- 46 -
Fig.10. Nucleotide sequence and deduced amino acid sequences of predicted puf genes of Trv.
winogradskyi strain 06511. Gene names were depicted at the codon start and stop codons are
marked with an asterisk. Predicted hairpin-loop structures are underlined and numbered on the left
side of the sequence from I to III.
1 GAGCTCGGCATGCCCTGTCATTTCGCCATCGCGCGTCGCCCCGGGGTCAAGACCGATAAC
bchZ E L G M P C H F A I A R R P G V K T D N
61 GCTGCCACGCGCGAGGCGGTGCGTGGCAAGACTCCGCTGGTGGTCTTCGGCGGCTACAAC
A A T R E A V R G K T P L V V F G G Y N
121 GAGCGCATGTATCTGGCCGAGGCCGGCGGACGCGCGGCTTTCATCCCGGCCTCGCTGCCC
E R M Y L A E A G G R A A F I P A S L P
181 GGCACCCTGGTGCGCCGCCACACCGGCACGCCCTTCATGGGCTTCTCGGGCGCGACCTAT
G T L V R R H T G T P F M G F S G A T Y
241 CTAGTGCAGGAAGTCTGCAACGCGCTCTTTGATGCGCTCTTTAATATTTTGCCCCTGGGT
L V Q E V C N A L F D A L F N I L P L G
301 ACGGACCTTGACCGGGTCGAAGGGACTCTTGCCCGCGCCGGCAGCGAGCGCCACCGCGAG
T D L D R V E G T L A R A G S E R H R E
361 CTGCCGTGGGAGAGCGATGCCAAGCGCAAGCTCGACGAGATGCTGGAATCAGCGCCCGTT
L P W E S D A K R K L D E M L E S A P V
421 CTGGTGCGCATCTCCGCTGCCAAGCGGCTGCGCGACGCGGCCGAGCGCGCAGCGCGCAGC
L V R I S A A K R L R D A A E R A A R S
481 GCGGGTGAAGATCGAGTAACAGCCGAGCATGTCGCACAAGCGGGCTCGGCGATGAATCAG
A G E D R V T A E H V A Q A G S A M N Q
541 GAGGCCGTGGCATGAAAAAAGCCGCGAGCCAGCTAAAAGCTTTGTGTTCGGTTTTCGGGA
E A V A *
601 I CTTCGTATGTCCGGGGTGCCGACGCATTTCGCGCTTCAGAGGTGCTAGTCGCGTTTTTGT
661 II GCACCCAGGAAGCACATAGTCGTCCGGGCAACCGGACCTCTGGTCTGTTGGGGCATCTGC
721 TTGCCTCGACGCCCGTTATGGTGCGCCGCGGGCGCGCTGACAGCCGCAAGGCTTAACACT
781 TAAATCTCTTCGGAGGATTTACTCATGGCTGAAAAATCAATGACCGGTCTGACCGACGCT
pufB M A E K S M T G L T D A
841 GAAGCAAAAGAATTCCATGGCATCTTCATGGCTAGCATGAGCGCCTACTTCGGCTTGGTG
E A K E F H G I F M A S M S A Y F G L V
901 GTTTTCGCCCATCTGCTGGCTTGGATGTATCGCCCCTGGCTGTAATCCGCTCCTTCAGCA
V F A H L L A W M Y R P W L *
961 TAACGGGAGCTCATCGCGAGCCCGCCGGACCTTTTTTCTGATGCTGCTTCTAGGCAGCGC
1021 CTTACACCAAATTTGGAGATATCAAGATGAACGAAAGCCTGCAAAACCTGCACAAAGTTT
pufA M N E S L Q N L H K V
1081 GGCTGCTGATCAATCCTGCTCAGGTCCTGGTCGCTCTTGGCGTTTTTCAGATCGTTTTGG
W L L I N P A Q V L V A L G V F Q I V L
1141 GTCTTGGGATCCACATGATCCTGCTCAGCACCGACCTCAACTGGCTGGACGACGGCGTGC
G L G I H M I L L S T D L N W L D D G V
1201 CTGTGACTTATCAGGCACAGGCTGCATCGGCAGCGCCCCAGAACAAATAAGAAGGCCTTT
P V T Y Q A Q A A S A A P Q N K *
1261 III TCGGATGGTGCTGACCCGCGCGGGCTCGCCCCCCGGGCCCACGTGCCGGTCAGCATCCGA
1321 GTTGCTATGTGGAGGCAGCAGGTCATGGTGTCTCCCCAGCAGAGGAATTAACGATGGCCA
pufL M A
1381 TGCTGAGTTTTGAAAAAAAATACCGCGTACGCGGTGGGACGCTGGTCGGGGGAGATCTGT
M L S F E K K Y R V R G G T L V G G D L
1441 TCGACTTCTGGGTGGGGCCGTTTTATGTCGGCTTCTTCGGTGTGTCGACGGTTTTCTTCG
F D F W V G P F Y V G F F G V S T V F F
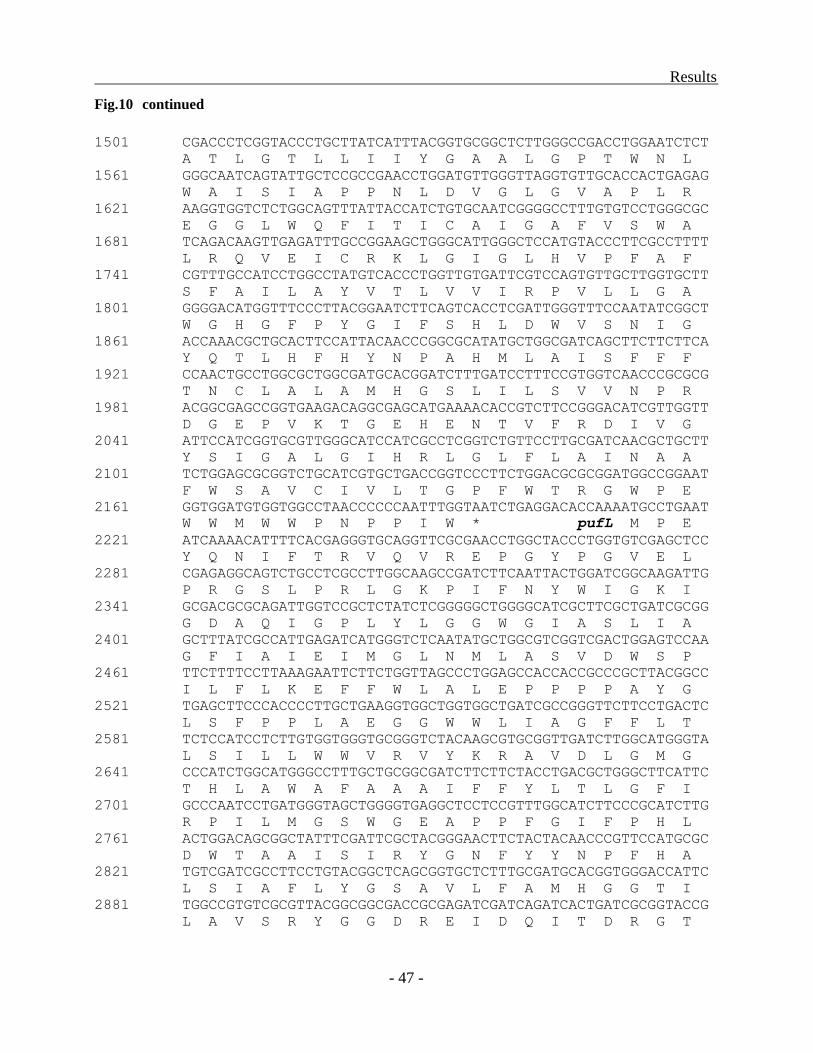
Results
- 47 -
Fig.10 continued
1501 CGACCCTCGGTACCCTGCTTATCATTTACGGTGCGGCTCTTGGGCCGACCTGGAATCTCT
A T L G T L L I I Y G A A L G P T W N L
1561 GGGCAATCAGTATTGCTCCGCCGAACCTGGATGTTGGGTTAGGTGTTGCACCACTGAGAG
W A I S I A P P N L D V G L G V A P L R
1621 AAGGTGGTCTCTGGCAGTTTATTACCATCTGTGCAATCGGGGCCTTTGTGTCCTGGGCGC
E G G L W Q F I T I C A I G A F V S W A
1681 TCAGACAAGTTGAGATTTGCCGGAAGCTGGGCATTGGGCTCCATGTACCCTTCGCCTTTT
L R Q V E I C R K L G I G L H V P F A F
1741 CGTTTGCCATCCTGGCCTATGTCACCCTGGTTGTGATTCGTCCAGTGTTGCTTGGTGCTT
S F A I L A Y V T L V V I R P V L L G A
1801 GGGGACATGGTTTCCCTTACGGAATCTTCAGTCACCTCGATTGGGTTTCCAATATCGGCT
W G H G F P Y G I F S H L D W V S N I G
1861 ACCAAACGCTGCACTTCCATTACAACCCGGCGCATATGCTGGCGATCAGCTTCTTCTTCA
Y Q T L H F H Y N P A H M L A I S F F F
1921 CCAACTGCCTGGCGCTGGCGATGCACGGATCTTTGATCCTTTCCGTGGTCAACCCGCGCG
T N C L A L A M H G S L I L S V V N P R
1981 ACGGCGAGCCGGTGAAGACAGGCGAGCATGAAAACACCGTCTTCCGGGACATCGTTGGTT
D G E P V K T G E H E N T V F R D I V G
2041 ATTCCATCGGTGCGTTGGGCATCCATCGCCTCGGTCTGTTCCTTGCGATCAACGCTGCTT
Y S I G A L G I H R L G L F L A I N A A
2101 TCTGGAGCGCGGTCTGCATCGTGCTGACCGGTCCCTTCTGGACGCGCGGATGGCCGGAAT
F W S A V C I V L T G P F W T R G W P E
2161 GGTGGATGTGGTGGCCTAACCCCCCAATTTGGTAATCTGAGGACACCAAAATGCCTGAAT
W W M W W P N P P I W * pufL M P E
2221 ATCAAAACATTTTCACGAGGGTGCAGGTTCGCGAACCTGGCTACCCTGGTGTCGAGCTCC
Y Q N I F T R V Q V R E P G Y P G V E L
2281 CGAGAGGCAGTCTGCCTCGCCTTGGCAAGCCGATCTTCAATTACTGGATCGGCAAGATTG
P R G S L P R L G K P I F N Y W I G K I
2341 GCGACGCGCAGATTGGTCCGCTCTATCTCGGGGGCTGGGGCATCGCTTCGCTGATCGCGG
G D A Q I G P L Y L G G W G I A S L I A
2401 GCTTTATCGCCATTGAGATCATGGGTCTCAATATGCTGGCGTCGGTCGACTGGAGTCCAA
G F I A I E I M G L N M L A S V D W S P
2461 TTCTTTTCCTTAAAGAATTCTTCTGGTTAGCCCTGGAGCCACCACCGCCCGCTTACGGCC
I L F L K E F F W L A L E P P P P A Y G
2521 TGAGCTTCCCACCCCTTGCTGAAGGTGGCTGGTGGCTGATCGCCGGGTTCTTCCTGACTC
L S F P P L A E G G W W L I A G F F L T
2581 TCTCCATCCTCTTGTGGTGGGTGCGGGTCTACAAGCGTGCGGTTGATCTTGGCATGGGTA
L S I L L W W V R V Y K R A V D L G M G
2641 CCCATCTGGCATGGGCCTTTGCTGCGGCGATCTTCTTCTACCTGACGCTGGGCTTCATTC
T H L A W A F A A A I F F Y L T L G F I
2701 GCCCAATCCTGATGGGTAGCTGGGGTGAGGCTCCTCCGTTTGGCATCTTCCCGCATCTTG
R P I L M G S W G E A P P F G I F P H L
2761 ACTGGACAGCGGCTATTTCGATTCGCTACGGGAACTTCTACTACAACCCGTTCCATGCGC
D W T A A I S I R Y G N F Y Y N P F H A
2821 TGTCGATCGCCTTCCTGTACGGCTCAGCGGTGCTCTTTGCGATGCACGGTGGGACCATTC
L S I A F L Y G S A V L F A M H G G T I
2881 TGGCCGTGTCGCGTTACGGCGGCGACCGCGAGATCGATCAGATCACTGATCGCGGTACCG
L A V S R Y G G D R E I D Q I T D R G T
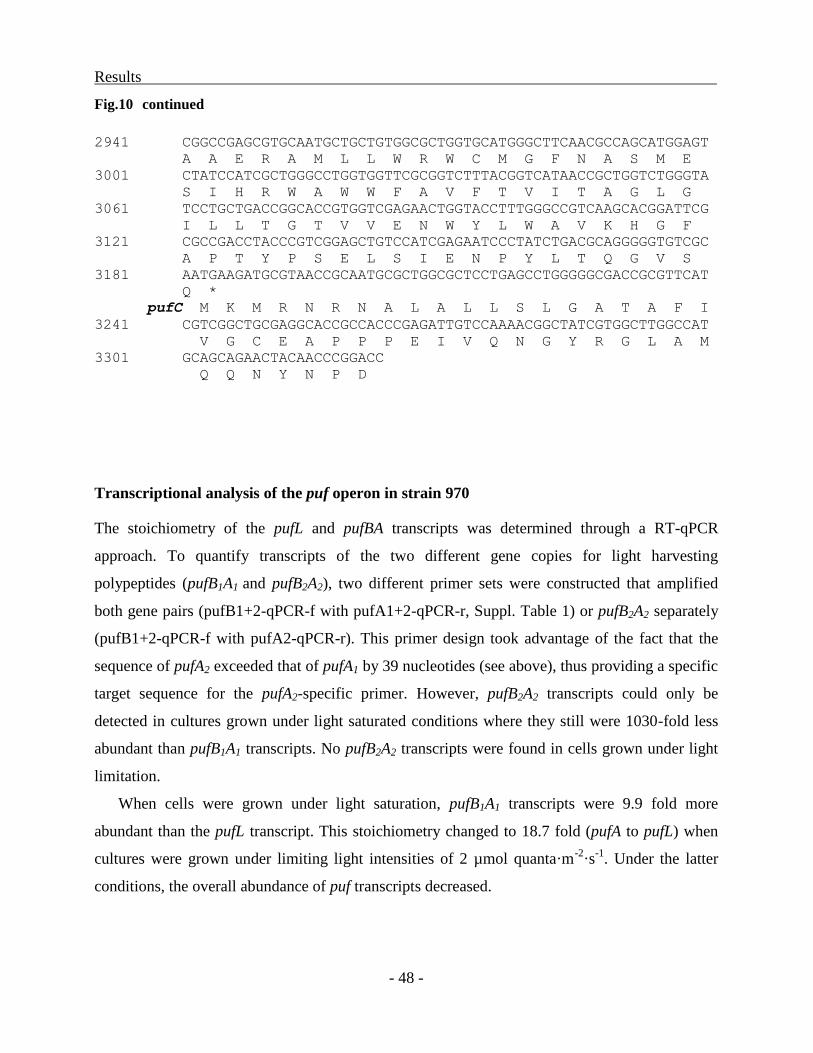
Results
- 48 -
Fig.10 continued
2941 CGGCCGAGCGTGCAATGCTGCTGTGGCGCTGGTGCATGGGCTTCAACGCCAGCATGGAGT
A A E R A M L L W R W C M G F N A S M E
3001 CTATCCATCGCTGGGCCTGGTGGTTCGCGGTCTTTACGGTCATAACCGCTGGTCTGGGTA
S I H R W A W W F A V F T V I T A G L G
3061 TCCTGCTGACCGGCACCGTGGTCGAGAACTGGTACCTTTGGGCCGTCAAGCACGGATTCG
I L L T G T V V E N W Y L W A V K H G F
3121 CGCCGACCTACCCGTCGGAGCTGTCCATCGAGAATCCCTATCTGACGCAGGGGGTGTCGC
A P T Y P S E L S I E N P Y L T Q G V S
3181 AATGAAGATGCGTAACCGCAATGCGCTGGCGCTCCTGAGCCTGGGGGCGACCGCGTTCAT
Q *
pufC M K M R N R N A L A L L S L G A T A F I
3241 CGTCGGCTGCGAGGCACCGCCACCCGAGATTGTCCAAAACGGCTATCGTGGCTTGGCCAT
V G C E A P P P E I V Q N G Y R G L A M
3301 GCAGCAGAACTACAACCCGGACC
Q Q N Y N P D
Transcriptional analysis of the puf operon in strain 970
The stoichiometry of the pufL and pufBA transcripts was determined through a RT-qPCR
approach. To quantify transcripts of the two different gene copies for light harvesting
polypeptides (pufB1A1 and pufB2A2), two different primer sets were constructed that amplified
both gene pairs (pufB1+2-qPCR-f with pufA1+2-qPCR-r, Suppl. Table 1) or pufB2A2 separately
(pufB1+2-qPCR-f with pufA2-qPCR-r). This primer design took advantage of the fact that the
sequence of pufA2 exceeded that of pufA1 by 39 nucleotides (see above), thus providing a specific
target sequence for the pufA2-specific primer. However, pufB2A2 transcripts could only be
detected in cultures grown under light saturated conditions where they still were 1030-fold less
abundant than pufB1A1 transcripts. No pufB2A2 transcripts were found in cells grown under light
limitation.
When cells were grown under light saturation, pufB1A1 transcripts were 9.9 fold more
abundant than the pufL transcript. This stoichiometry changed to 18.7 fold (pufA to pufL) when
cultures were grown under limiting light intensities of 2 µmol quanta·m-2
·s-1
. Under the latter
conditions, the overall abundance of puf transcripts decreased.
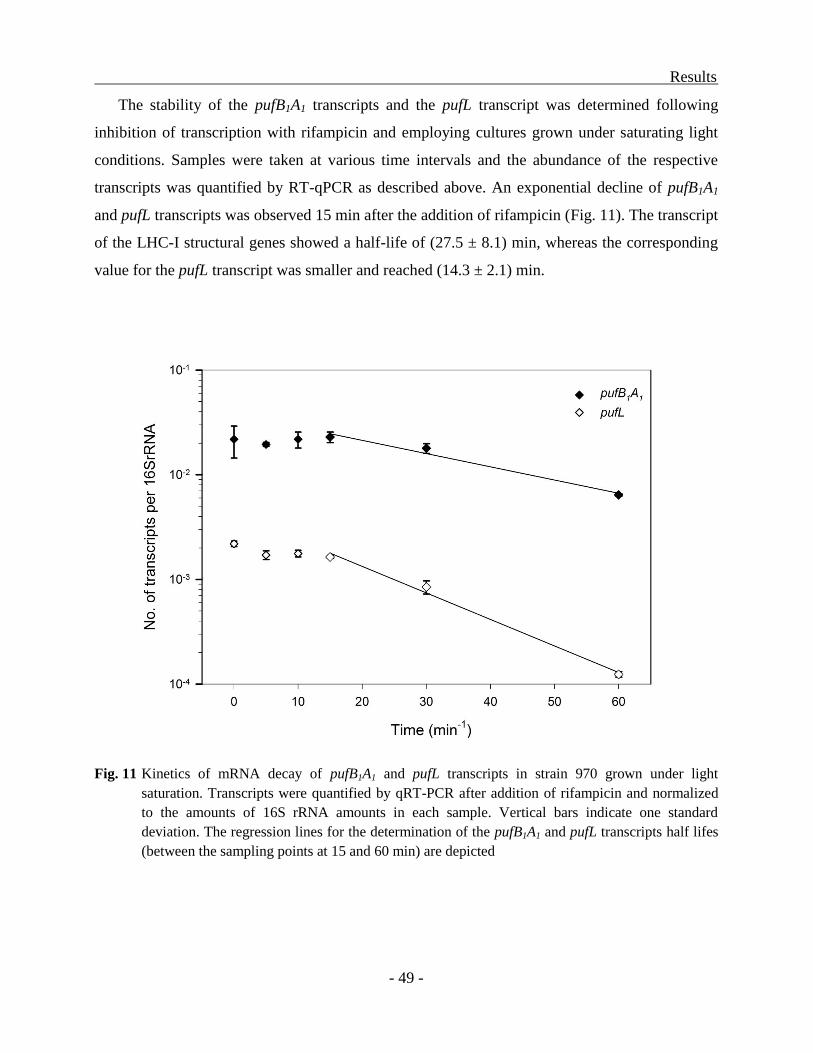
Results
- 49 -
The stability of the pufB1A1 transcripts and the pufL transcript was determined following
inhibition of transcription with rifampicin and employing cultures grown under saturating light
conditions. Samples were taken at various time intervals and the abundance of the respective
transcripts was quantified by RT-qPCR as described above. An exponential decline of pufB1A1
and pufL transcripts was observed 15 min after the addition of rifampicin (Fig. 11). The transcript
of the LHC-I structural genes showed a half-life of (27.5 ± 8.1) min, whereas the corresponding
value for the pufL transcript was smaller and reached (14.3 ± 2.1) min.
Fig. 11 Kinetics of mRNA decay of pufB1A1 and pufL transcripts in strain 970 grown under light
saturation. Transcripts were quantified by qRT-PCR after addition of rifampicin and normalized
to the amounts of 16S rRNA amounts in each sample. Vertical bars indicate one standard
deviation. The regression lines for the determination of the pufB1A1 and pufL transcripts half lifes
(between the sampling points at 15 and 60 min) are depicted

Results
- 50 -
Comparative analysis of the Puf polypeptides
Typically, the LHC1 α- and β-polypeptides are between 40 and 70 amino acid residues long.
Comparable lengths of amino acid (aa) sequences can be inferred for LHC1β of strain 970 and
the two Trv. winogradskyi strains (46 aa) and for LHC1α of the two Trv. winogradskyi strains
(67 aa). In contrast, the two LHC1α polypeptides of strain 970 display an unusual length of 73 aa
and 86 aa, respectively. An alignment of the sequences of all LHC1 α and β polypeptides
obtained in the present study against all available LHC1 sequences confirmed the three domain
structure of the polypetides including polar N- and C-terminal domains that frame a hydrophobic
transmembrane α-helix (Bullough et al., 2008).
A detailed comparison of amino acid sequences of the LHC1α- and β-polypeptides was
conducted with 73 sequences retrieved from 65 different microbial strains. After omitting
redundant sequence information, a total of 33 other LHC1 polypeptide sequences encompassing
the conserved region and the transmembrane region were analysed (Fig. 12). The LHC1α
polypeptides of all three investigated puf operons show a deletion between αHis0 and αTrp
+11 in a
region with close interactions with BChla. This deletion can also be found in LHC1α chains of
Tch. tepidum ATCC 43061T, Roseobacter denitrificans ATCC33940
T, Roseobacter litoralis
Och149 and Jannaschia sp. CCS1. Our analysis also revealed the presence of two conspicuous
amino acid replacements that clearly distinguish PufBA sequences of strain 970 from all other
known sequences or all other sequences except (in one case) that of Thermochromatium tepidum
ATCC 43061T (highlighted in black in Fig. 12). In strain 970, histidine replaces the αLys
+12. This
change together with the deletion is positioned in the vicinity of the acetyl carbonyl of the BChla
macrocycle and represents a unique feature of strain 970 LHC1α polypeptides. Another
significant change is the occurrence of βTrp-8
in both LH1β sequences of strain 970, a feature
that is also observed in the LHC1β chain of Tch. tepidum ATCC 43061T, and not in LHC1β from
both Trv. winogradskyi strains or any other anoxygenic phototrophic proteobacterium. While
more conserved than the LHC1α, the LHC1β polypeptides of strain 970 harbors an uncharged
polar βSer+3
residue instead of the more commonly found apolar βVal+3
or βAla+3
residues.
Another LHC1β chains harbouring an βSer+3
can only be found in Rhodomicrobium vannielii
ATCC 17100T
.
Results
- 51 -
In addition, the polarity of the N- and C-terminal domains framing the membrane spanning α-
helices of both LHC1 polypeptides varies between the different strains. Instead of three acidic
side chains, only two appear in the N-terminal domain of LHC1β in strain 970 and both strains of
Trv. winogradskyi. This feature is shared with several other sequences, however (Fig. 12).
Similarly, the N-terminal domain of LHC1α lacks some charged polar side chains in strain 970
(PufA1) and Trv. winogradskyi. The conserved positions αAsp-20
, αArg-18
and αArg-17
are
substituted with αAsn-20
, αVal-18
and αSer-17
in strain 970 and αAsn-20
, αAla-18
and αGln-17
in Trv.
winogradskyi. A similar decrease in the number of charged polar side chains was only detected
in Chloroflexus (Cfl.) aurantiacus and the LHC1α protein of Lpc. purpurea.
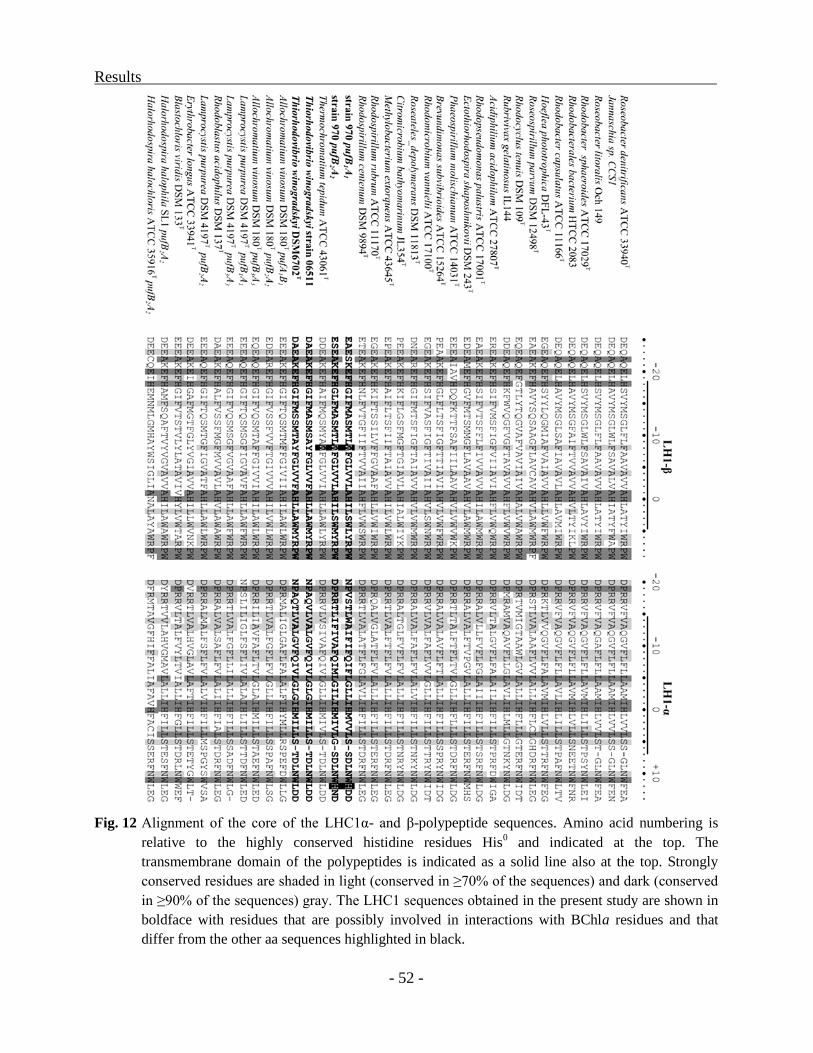
Results
- 52 -
Fig. 12 Alignment of the core of the LHC1α- and β-polypeptide sequences. Amino acid numbering is
relative to the highly conserved histidine residues His0 and indicated at the top. The
transmembrane domain of the polypeptides is indicated as a solid line also at the top. Strongly
conserved residues are shaded in light (conserved in ≥70% of the sequences) and dark (conserved
in ≥90% of the sequences) gray. The LHC1 sequences obtained in the present study are shown in
boldface with residues that are possibly involved in interactions with BChla residues and that
differ from the other aa sequences highlighted in black.
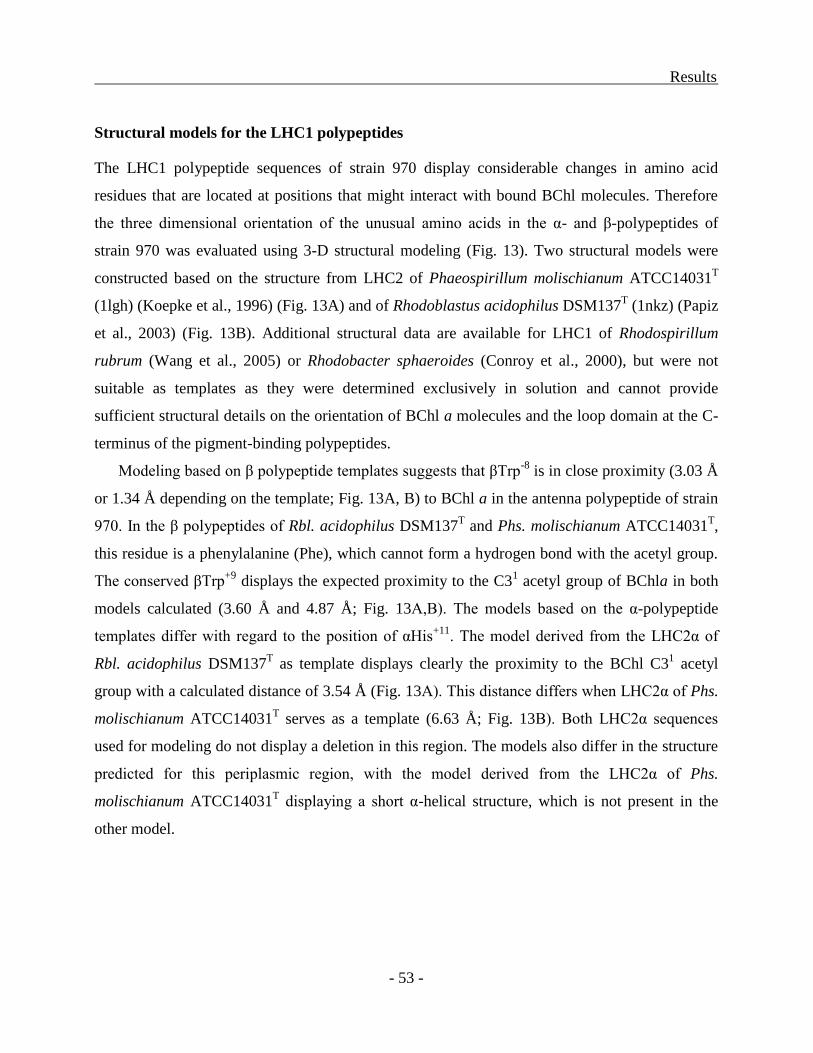
Results
- 53 -
Structural models for the LHC1 polypeptides
The LHC1 polypeptide sequences of strain 970 display considerable changes in amino acid
residues that are located at positions that might interact with bound BChl molecules. Therefore
the three dimensional orientation of the unusual amino acids in the α- and β-polypeptides of
strain 970 was evaluated using 3-D structural modeling (Fig. 13). Two structural models were
constructed based on the structure from LHC2 of Phaeospirillum molischianum ATCC14031T
(1lgh) (Koepke et al., 1996) (Fig. 13A) and of Rhodoblastus acidophilus DSM137T (1nkz) (Papiz
et al., 2003) (Fig. 13B). Additional structural data are available for LHC1 of Rhodospirillum
rubrum (Wang et al., 2005) or Rhodobacter sphaeroides (Conroy et al., 2000), but were not
suitable as templates as they were determined exclusively in solution and cannot provide
sufficient structural details on the orientation of BChl a molecules and the loop domain at the C-
terminus of the pigment-binding polypeptides.
Modeling based on β polypeptide templates suggests that βTrp-8
is in close proximity (3.03 Å
or 1.34 Å depending on the template; Fig. 13A, B) to BChl a in the antenna polypeptide of strain
970. In the β polypeptides of Rbl. acidophilus DSM137T and Phs. molischianum ATCC14031
T,
this residue is a phenylalanine (Phe), which cannot form a hydrogen bond with the acetyl group.
The conserved βTrp+9
displays the expected proximity to the C31 acetyl group of BChla in both
models calculated (3.60 Å and 4.87 Å; Fig. 13A,B). The models based on the α-polypeptide
templates differ with regard to the position of αHis+11
. The model derived from the LHC2α of
Rbl. acidophilus DSM137T as template displays clearly the proximity to the BChl C3
1 acetyl
group with a calculated distance of 3.54 Å (Fig. 13A). This distance differs when LHC2α of Phs.
molischianum ATCC14031T serves as a template (6.63 Å; Fig. 13B). Both LHC2α sequences
used for modeling do not display a deletion in this region. The models also differ in the structure
predicted for this periplasmic region, with the model derived from the LHC2α of Phs.
molischianum ATCC14031T displaying a short α-helical structure, which is not present in the
other model.
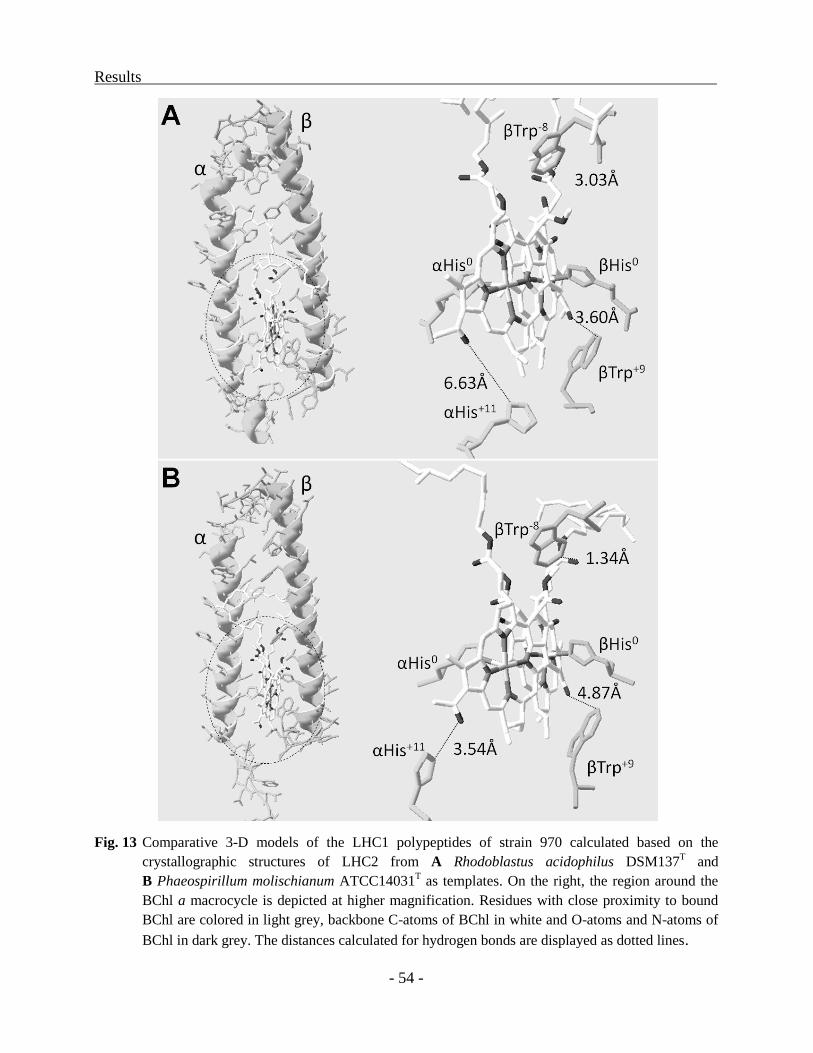
Results
- 54 -
Fig. 13 Comparative 3-D models of the LHC1 polypeptides of strain 970 calculated based on the
crystallographic structures of LHC2 from A Rhodoblastus acidophilus DSM137T and
B Phaeospirillum molischianum ATCC14031T as templates. On the right, the region around the
BChl a macrocycle is depicted at higher magnification. Residues with close proximity to bound
BChl are colored in light grey, backbone C-atoms of BChl in white and O-atoms and N-atoms of
BChl in dark grey. The distances calculated for hydrogen bonds are displayed as dotted lines.
Results
- 55 -
Phylogenetic relationship of LHC1 and RC sequences
Some of the peculiarities of LHC1 polypeptides of strain 970 and Trv. winogradskyi strains were
also detected in a few sequences of other proteobacteria (Fig. 13). Therefore, the phylogenetic
relationships of LHC1 polypeptides of strain 970 and Trv. winogradskyi strains with those found
in other bacteria were evaluated (Fig. 14). Since previous investigations (Tuschak et al., 2004)
had shown that the phylogenetic relationships of α and β LH1 polypeptides are very similar,
amino acid sequences of the two polypeptides were concatenated in these analyses. The LHC1
sequences from strain 970 and both Trv. winogradskyi strains are most closely related to those of
Tch. tepidum ATCC43061T and cluster together with polypeptides from the other
Gammaproteobacteria. Most notably, LHC1 sequences of strain 970 are very closely related to
those of Tch. tepidum ATCC43061T. In contrast, the phylogenetic analysis of the 16S rRNA gene
sequences placed strain 970 among the Thiorhodovibrio strains and at a larger distance to Tch.
tepidum ATCC43061T , the latter falling into a cluster with Alc. vinosum DSM180
T and Lpc.
purpurea DSM4197T (Fig. 14). Similarly, the phylogenetic analysis of concatenated pufLM gene
sequences placed strain 970 and both Trv. winogradskyi strains in one subcluster that was only
distantly related to Tch. tepidum ATCC43061T, Alc. vinosum DSM180
T and Lpc. purpurea
DSM4197T (Fig. 15).
Since no other Chromatiaceae with extremely red-shifted QY absorption bands have been
reported so far, the presence of bacteria related to strain 970 was assessed in a series of
environmental samples from tidal sediments that were visibly colonized by anoxygenic
phototrophs. Because pufLM sequences are more conserved than pufBA sequences, only primers
are available that permit a selective amplification of pufLM sequences from all known sequence
types. Sequence analysis of clone libraries prepared with the amplification products of five
different types of samples revealed that most of the retrieved sequences were closely related to
Roseobacter species, whereas only three sequences were related to those of known
Gammaproteobacteria (Fig. 15). No sequences clustering together with strain 970 and the two
Trv. winogradskyi sequences were detected.

Results
- 56 -
Fig. 14 Phylogenetic tree based on amino acid sequences of LHC1 antenna polypeptides of anoxygenic
phototrophic proteobacteria (left) compared to the phylogeny inferred from 16S rRNA gene
sequences for the closest relatives of strain 970 (right). Both trees were determined by maximum
likelihood analysis. Bootstrap values of 50% or higher are given at the nodes. Bars represent
substitutions per site. Strains present in both trees are interconnected with continuous lines, strains
investigated in the present paper are shown in boldface. 1st, 2
nd, 3
rd, denote phylogenetic positions
of pufBA gene sequences of strains with multiple gene copies.
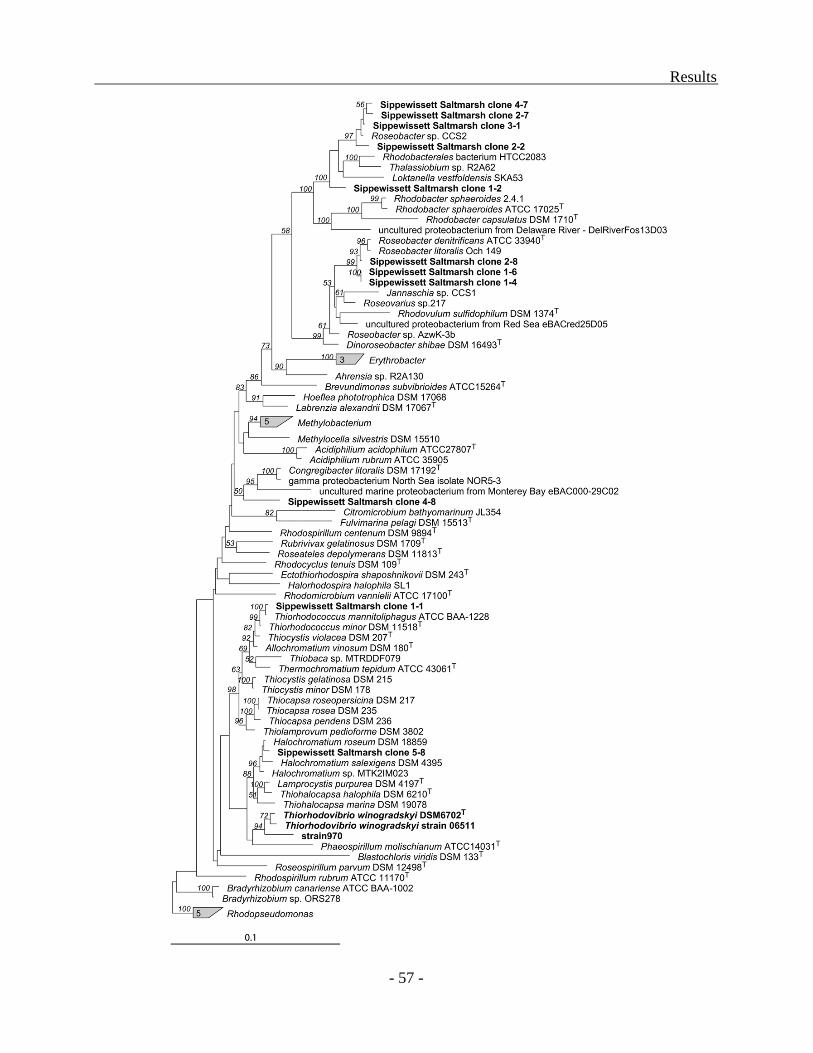
Results
- 57 -

Results
- 58 -
Fig. 15 (depicted on previous page) Maximum likelihood phylogenetic pufLM tree of amino acid
sequences from 74 different anoxygenic phototrophic proteobacteria, as well as 11 environmental
sequences and 3 cultured sequence types from the present study. Bootstrap values of 50% or
higher are given at the nodes. Bars represent substitutions per site. Sequences originating from
strains or environmental clone libraries investigated in the present paper are shown in boldface.

Results
- 59 -
The adaptation of Chlorobiaceae to growth at low light conditions
Identification and classification of genes unique to the BS1 genome
There are 12 available genome sequences of green sulfur bacteria covering the phylogenetic
diversity of this group (Eisen et al., 2002). Therefore, a comparison of the Chl. phaeobacteroides
BS1 genome to the 11 genomes of the free living relatives was used in order to identify ORFs
which are unique to this green sulfur bacterium. Such genes could potentially be involved in the
low light adaptation of Chl. phaeobacteroides BS1. Pairwise comparisons by in silico subtractive
hybridization analysis revealed that the BS1 genome contained 740 (compared to Chl.
phaeobacteroides DSM 266T) to 1201 (compared to Chloroherpeton thalassium ATCC 35110
T)
unique genes. When compared to the 11 other green sulfur bacterial genomes as a whole, a total
of 331 ORFs were identified to be unique for the Chl. phaeobacteroides BS1 (Fig.16, Appendix
Table 1).
Fig. 16 Distribution of function for the 331 ORFs identified to be unique to Chl. phaeobacteroides BS1
when compared to the other 11 green sulfur bacterial genomes
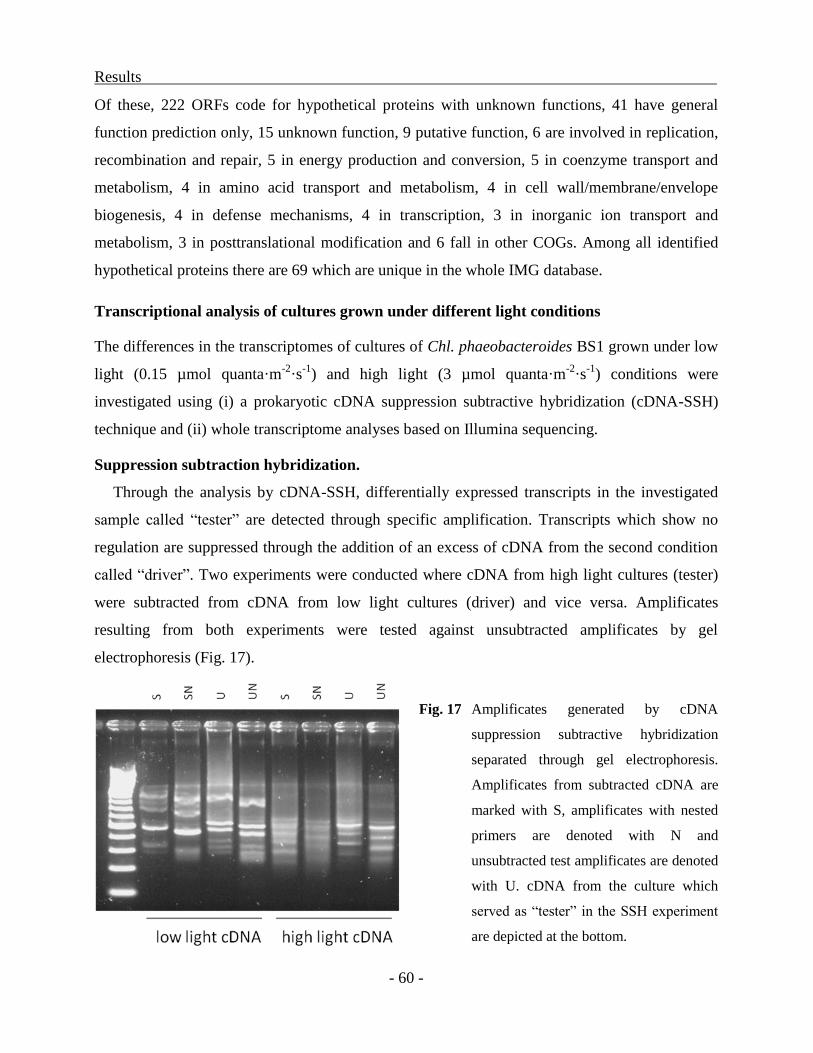
Results
- 60 -
Of these, 222 ORFs code for hypothetical proteins with unknown functions, 41 have general
function prediction only, 15 unknown function, 9 putative function, 6 are involved in replication,
recombination and repair, 5 in energy production and conversion, 5 in coenzyme transport and
metabolism, 4 in amino acid transport and metabolism, 4 in cell wall/membrane/envelope
biogenesis, 4 in defense mechanisms, 4 in transcription, 3 in inorganic ion transport and
metabolism, 3 in posttranslational modification and 6 fall in other COGs. Among all identified
hypothetical proteins there are 69 which are unique in the whole IMG database.
Transcriptional analysis of cultures grown under different light conditions
The differences in the transcriptomes of cultures of Chl. phaeobacteroides BS1 grown under low
light (0.15 µmol quanta·m-2
·s-1
) and high light (3 µmol quanta·m-2
·s-1
) conditions were
investigated using (i) a prokaryotic cDNA suppression subtractive hybridization (cDNA-SSH)
technique and (ii) whole transcriptome analyses based on Illumina sequencing.
Suppression subtraction hybridization.
Through the analysis by cDNA-SSH, differentially expressed transcripts in the investigated
sample called “tester” are detected through specific amplification. Transcripts which show no
regulation are suppressed through the addition of an excess of cDNA from the second condition
called “driver”. Two experiments were conducted where cDNA from high light cultures (tester)
were subtracted from cDNA from low light cultures (driver) and vice versa. Amplificates
resulting from both experiments were tested against unsubtracted amplificates by gel
electrophoresis (Fig. 17).
Fig. 17 Amplificates generated by cDNA
suppression subtractive hybridization
separated through gel electrophoresis.
Amplificates from subtracted cDNA are
marked with S, amplificates with nested
primers are denoted with N and
unsubtracted test amplificates are denoted
with U. cDNA from the culture which
served as “tester” in the SSH experiment
are depicted at the bottom.
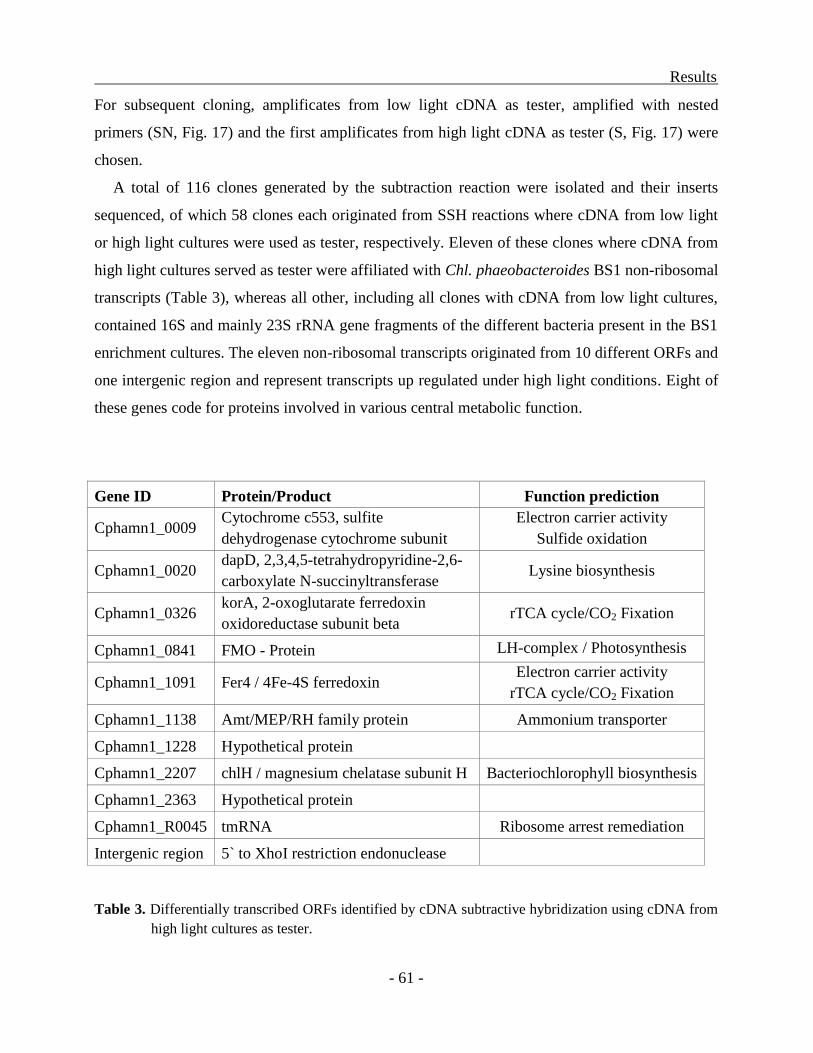
Results
- 61 -
For subsequent cloning, amplificates from low light cDNA as tester, amplified with nested
primers (SN, Fig. 17) and the first amplificates from high light cDNA as tester (S, Fig. 17) were
chosen.
A total of 116 clones generated by the subtraction reaction were isolated and their inserts
sequenced, of which 58 clones each originated from SSH reactions where cDNA from low light
or high light cultures were used as tester, respectively. Eleven of these clones where cDNA from
high light cultures served as tester were affiliated with Chl. phaeobacteroides BS1 non-ribosomal
transcripts (Table 3), whereas all other, including all clones with cDNA from low light cultures,
contained 16S and mainly 23S rRNA gene fragments of the different bacteria present in the BS1
enrichment cultures. The eleven non-ribosomal transcripts originated from 10 different ORFs and
one intergenic region and represent transcripts up regulated under high light conditions. Eight of
these genes code for proteins involved in various central metabolic function.
Gene ID Protein/Product Function prediction
Cphamn1_0009 Cytochrome c553, sulfite
dehydrogenase cytochrome subunit
Electron carrier activity
Sulfide oxidation
Cphamn1_0020 dapD, 2,3,4,5-tetrahydropyridine-2,6-
carboxylate N-succinyltransferase Lysine biosynthesis
Cphamn1_0326 korA, 2-oxoglutarate ferredoxin
oxidoreductase subunit beta rTCA cycle/CO2 Fixation
Cphamn1_0841 FMO - Protein LH-complex / Photosynthesis
Cphamn1_1091 Fer4 / 4Fe-4S ferredoxin Electron carrier activity
rTCA cycle/CO2 Fixation
Cphamn1_1138 Amt/MEP/RH family protein Ammonium transporter
Cphamn1_1228 Hypothetical protein
Cphamn1_2207 chlH / magnesium chelatase subunit H Bacteriochlorophyll biosynthesis
Cphamn1_2363 Hypothetical protein
Cphamn1_R0045 tmRNA Ribosome arrest remediation
Intergenic region 5` to XhoI restriction endonuclease
Table 3. Differentially transcribed ORFs identified by cDNA subtractive hybridization using cDNA from
high light cultures as tester.
Results
- 62 -
Proteins involved in photosynthesis and related pathways are coded by five of the detected
genes. While the FMO-protein (Cphamn1_0841) is directly involved in the photosynthetic
apparatus another gene, the magnesium chelatase subunit H (Cphamn1_2207) codes for a protein
involved in the bacteriochlorophyll biosynthesis. Two other proteins, the oxoglutarate ferredoxin
oxidoreductase (Cphamn1_0326, subunit beta) and ferredoxin (Cphamn1_1091) are involved in
the reductive citric acid (rTCA) cycle. One cytochrome which is involved in sulfide oxidation
(Cphamn1_0009), thus providing the electron donors for photosynthesis is also being up
regulated. Other genes being up regulated under high light conditions are involved in the lysine
biosynthesis (Cphamn1_0020), ammonium transport (Cphamn1_1138) or in ribosome arrest
remediation (Cphamn1_R0045). Two ORFs were identified to code for hypothetic proteins, with
Cphamn1_2363 being unique to Chl. phaeobacteroides BS1.
Transcriptome sequencing
A first comparative analysis of global transcriptomes of BS1 cultures grown under low light
and high light conditions was achieved by Illumina sequencing of cDNA libraries. After
removing sequence tags that matched to rRNA, a total of 2,792,174 uniquely matching sequences
originating from the high light sample and 3,280,048 uniquely matching sequences from the low
light sample were mapped to the Chl. phaeobacteroides BS1 genome. Additionally out of 2524
total number of genes (excluding pseudogenes), 81 genes from cultures grown under high light
and 85 under low light conditions had zero reads, out of which 70 genes showed no reads in
cultures from both conditions of growth. ORFs that had a difference of expression greater than
2σ were considered differentially expressed (σ = 0.35/(0.8+(em^1.5
)/2)+0.45, where m is the mean
of expression for each ORF). A total of 211 genes were determined to be differentially expressed
between cultures grown under high light and low light conditions (Fig.18, Appendix Table 3). Of
these, transcripts of 11 genes were only found in low light cultures, whereas transcripts of 12
genes were only detected in the library from high light cultures. These genes were found to code
mainly for hypothetical proteins, 5 expressed only in low light toghther with 6 expressed only in
high light and represent extreme examples of differential detection. Other 8 ORF code for several
tRNAs (Val, Ser, Pro tRNA in high light and Thr, Leu tRNA in low light) two IS5 family
transposases and one non coding RNAs like the ffs signal recognition particle
(Cphamn1_R0055).
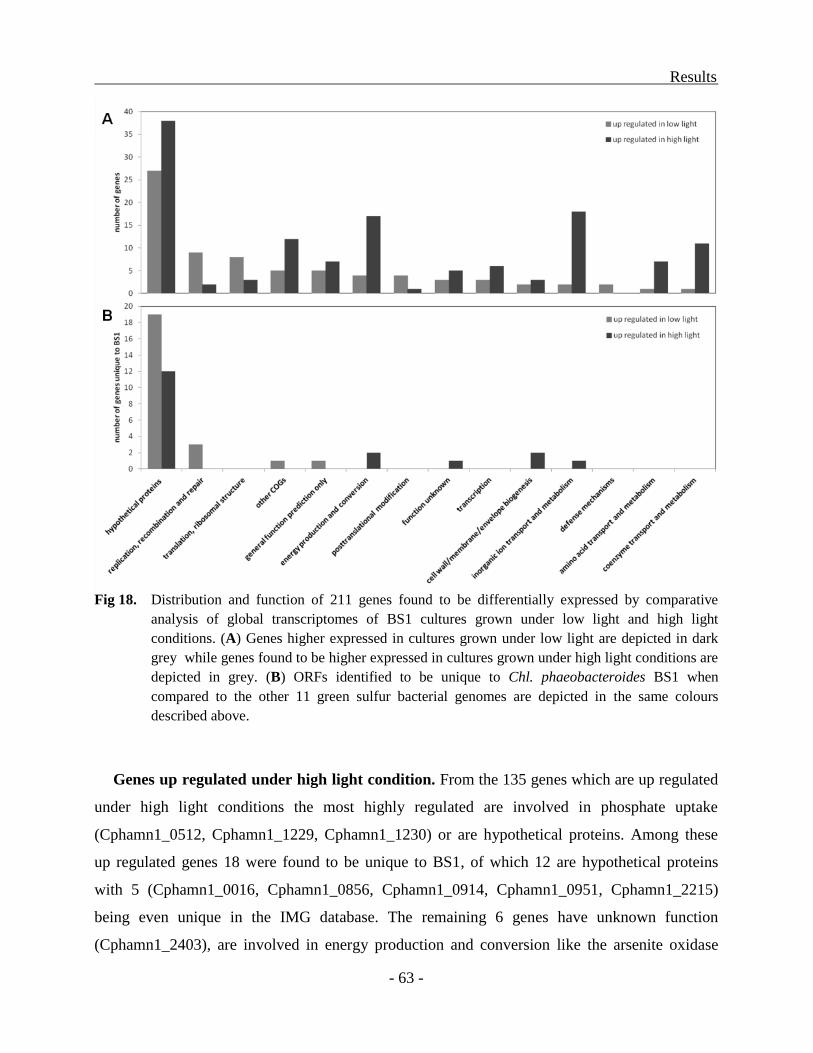
Results
- 63 -
Fig 18. Distribution and function of 211 genes found to be differentially expressed by comparative
analysis of global transcriptomes of BS1 cultures grown under low light and high light
conditions. (A) Genes higher expressed in cultures grown under low light are depicted in dark
grey while genes found to be higher expressed in cultures grown under high light conditions are
depicted in grey. (B) ORFs identified to be unique to Chl. phaeobacteroides BS1 when
compared to the other 11 green sulfur bacterial genomes are depicted in the same colours
described above.
Genes up regulated under high light condition. From the 135 genes which are up regulated
under high light conditions the most highly regulated are involved in phosphate uptake
(Cphamn1_0512, Cphamn1_1229, Cphamn1_1230) or are hypothetical proteins. Among these
up regulated genes 18 were found to be unique to BS1, of which 12 are hypothetical proteins
with 5 (Cphamn1_0016, Cphamn1_0856, Cphamn1_0914, Cphamn1_0951, Cphamn1_2215)
being even unique in the IMG database. The remaining 6 genes have unknown function
(Cphamn1_2403), are involved in energy production and conversion like the arsenite oxidase
Results
- 64 -
(Cphamn1_2364 – small subunit, Cphamn1_2365 – large subunit), in cell wall/membrane/
envelope biogenesis like the outer membrane efflux protein (Cphamn1_0863) and the efflux
transporter (Cphamn1_0864) or in inorganic ion transport like the sodium/hydrogen exchanger
(Cphamn1_1652).
Most of the here regulated genes with known function are involved in (i) inorganic ion
transport like phosphate uptake (Cphamn1_1229 to Cphamn1_1237) and molybdenum uptake
(Cphamn1_0451 to Cphamn1_0453), (ii) energy production and conversion like genes belonging
to the nitrogenase coding nif-operon (Cphamn1_1748 to Cphamn1_1758) or (iii) coenzyme
transport and metabolism like molybdenum cofactor biosynthesis (Cphamn1_2359,
Cphamn1_2361, Cphamn1_2362 and Cphamn1_2366) and biotin biosynthesis (Cphamn1_2453
to Cphamn1_2459). In comparison to up regulated genes under low light conditions, more genes
involved in inorganig ion transport and metabolism (18 genes vs. 2 genes), energy production an
conversion (17 vs. 4) and coenzyme transport and metabolism (11 vs. 1) were highly transcribed
under high light conditions. This is surely the case also because under this condition, large
clusters of genes are being transcriptionally regulated, which obviously is not the case for the low
light condition. Some of the ORFs identified by cDNA-SSH were again determined as up
regulated under high light condition including a gene coding for a cytochrome c class I protein
(Cphamn1_0009), an ammonium transporter (Cphamn1_1138) and the two hypothetical proteins
(Cphamn1_1228 and Cphamn1_2363).
Genes up regulated under low light condition. A total number of 76 genes were found to be
up regulated under low light conditions. Over one third (35.5%) of these genes code for
hypothetical proteins (27 genes), with 19 of them being unique to BS1 and 6 (Cphamn1_0191,
Cphamn1_0915, Cphamn1_1141, Cphamn1_1468, Cphamn1_1897 and Cphamn1_2005)also
unique in the IMG database. From genes with known function the majority are involved in (i)
replication, recombination and repair like endo- and excinucleases (Cphamn1_1984,
Cphamn1_1412) or transposases (Cphamn1_0494, Cphamn1_1363, Cphamn1_1382,
Cphamn1_2371, Cphamn1_2434) or (ii) translation and ribosomal structure like tRNAs
(Cphamn1_R0001, Cphamn1_R0020, Cphamn1_R0021, Cphamn1_R0027, Cphamn1_R0033,
Cphamn1_R0036) or ribosomal proteins (Cphamn1_0975, Cphamn1_1934). Also represented
and of major interest are genes involved in (i) energy production and conversion like two
Results
- 65 -
cytochromes (Cphamn1_2425, Cphamn1_2426) and a membrane bound proton translocating
pyrophosphatase (Cphamn1_1101), (ii) posttranslational modification like heat shock proteins
and chaperones (Cphamn1_0783, Cphamn1_1706, Cphamn1_1707) or a peroxiredoxin
(Cphamn1_0848) and (iii) transcriptional regulation (Cphamn1_1095, Cphamn1_1366,
Cphamn1_1637). In comparison to up regulated genes under high light conditions, more genes
involved in replication, recombination and repair (9 genes vs. 2 genes) and translation and
ribosomal structure (8 vs. 3) were highly transcribed under low light conditions. Interestingly 11
out of the 20 highest up regulated genes are unique for BS1 and 4 of them even unique in the
IMG database. The occurrence of Cphamn1_2207 coding for a magnesium chelatase subunit H
in the group of up regulated genes under low light conditions is contradictory to the cDNA-SSH
results, but represents the gene with the lowest difference in expression in this group.
Only some genes are found to be closely located on the chromosome like two hypothetical
proteins and a gene coding for a dinitrogenase iron-molybdenum cofactor biosynthesis protein of
unknown function (Cphamn1_1075 to 1077) and also the two genes coding for a cytochrome
B561 and a cytochrome c family protein (Cphamn1_2425, Cphamn1_2426). These two
cytochromes, of which cytochrome B561 is closely related to phsC (thiosulfate reductase
cytochrome b subunit) are always clustered in the genomes of 7 other Chlorobi (Prosthecochloris
aestuarii DSM 271T, Chl. clathratiforme DSM 5477
T, Chl. luteolum DSM 273
T, Chl.
phaeovibrioides DSM 265, Cba. parvum NCIB 8327, Chl. limicola DSM 245T and Chl.
phaeobacteroides DSM 266T) and several other bacterial strains belonging mainly to the group
of sulfate reducers like the genera Desulfovibrio and Desulfatibacillum, or to phototrophic
sulphur bacteria like Allochromatium vinosum DSM 180 and Halorhodospira halophila DSM
244. In Chl. vibrioforme and Chl. luteolum these genes are also clustered with a gene closely
related to hppA membrane bound proton translocating pyrophosphatase (Cphamn1_1101) which
is also upregulated under low light conditions in Chl. phaeobacteroides BS1. This inorganic
pyrophosphatase is also present and not clustered with the two cytochromes in the other 5
Chlorobi and several other bacteria. The two other genes (phsA and B) present in the phs operon
of Salmonella typhimurium are not present in either of the Chlorobi genomes.
Results
- 66 -
Genes highly transcribed under low light condition. When grown under low light
condition, BS1 cultures still sustains a large amount of transcripts with the gene coding
bacteriochlorophyll C binding protein (Cphamn1_2195) being the most transcribed (Suppl. Table
4). Among the 50 genes showing the highest transcript abundance there are genes involved in (i)
chlorosome structure and photosynthesis like the clorosome envelope protein (Cphamn1_0265),
the photosystem P840 reaction center cytochrome c-551 (Cphamn1_0578) the
bacteriochlorophyll a protein (Cphamn1_0841) and the bacteriochlorophyll c binding protein
(Cphamn1_2195), or (ii) ribosomal structure (Cphamn1_2272, Cphamn1_2273, Cphamn1_2279,
Cphamn1_2283, Cphamn1_R0006), or (iii) transcriptional regulation (Cphamn1_0720,
Cphamn1_1366, Cphamn1_1367) and (iv) posttranslational modification (Cphamn1_0414,
Cphamn1_0782, Cphamn1_2210). There are also 20 hypothetical proteins, 8 of them being
unique to BS1 and two (Cphamn1_0719 and Cphamn1_0892) being unique in the IMG database.
Only 5 genes of these 50 are significantly different transcribed, while two genes (Cphamn1_0841
and Cphamn1_R0006) were identified by cDNA-SSH but not by transcriptome sequencing.
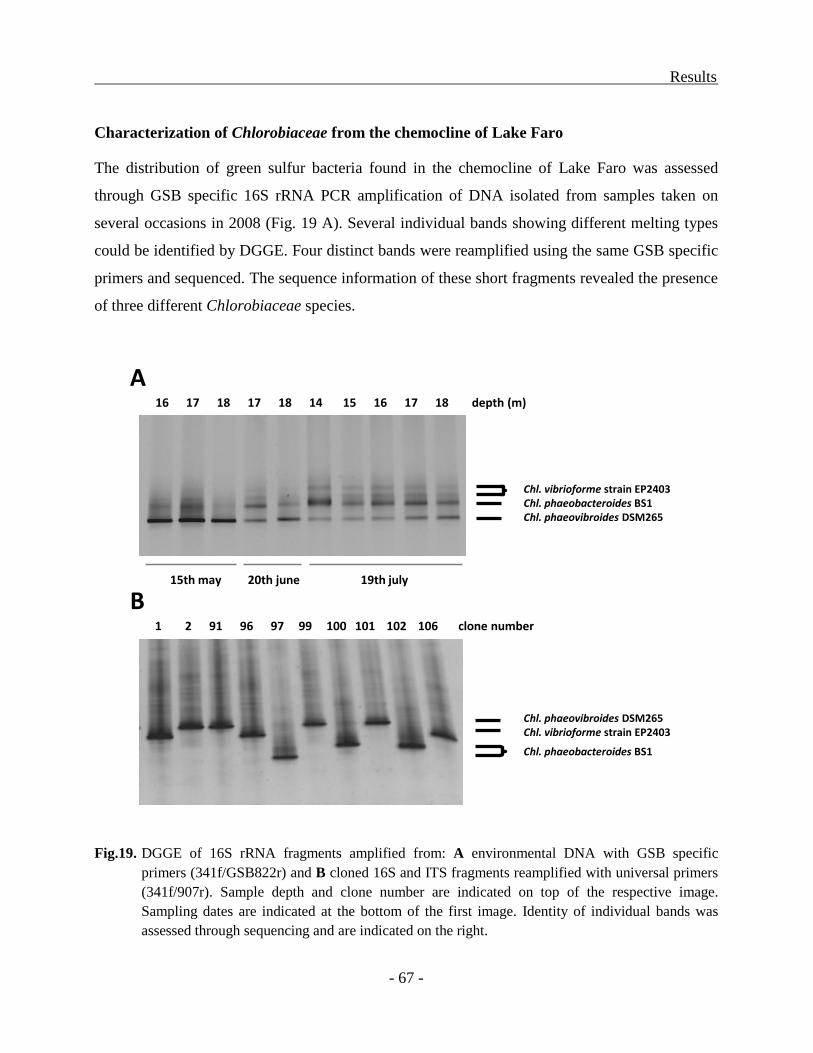
Results
- 67 -
Characterization of Chlorobiaceae from the chemocline of Lake Faro
The distribution of green sulfur bacteria found in the chemocline of Lake Faro was assessed
through GSB specific 16S rRNA PCR amplification of DNA isolated from samples taken on
several occasions in 2008 (Fig. 19 A). Several individual bands showing different melting types
could be identified by DGGE. Four distinct bands were reamplified using the same GSB specific
primers and sequenced. The sequence information of these short fragments revealed the presence
of three different Chlorobiaceae species.
Fig.19. DGGE of 16S rRNA fragments amplified from: A environmental DNA with GSB specific
primers (341f/GSB822r) and B cloned 16S and ITS fragments reamplified with universal primers
(341f/907r). Sample depth and clone number are indicated on top of the respective image.
Sampling dates are indicated at the bottom of the first image. Identity of individual bands was
assessed through sequencing and are indicated on the right.
16 17 18 17 18 14 15 16 17 18 depth (m)
15th may 20th june 19th july
Chl. vibrioforme strain EP2403Chl. phaeobacteroides BS1Chl. phaeovibroides DSM265
Chl. phaeovibroides DSM265Chl. vibrioforme strain EP2403
Chl. phaeobacteroides BS1
1 2 91 96 97 99 100 101 102 106 clone number
A
B
Results
- 68 -
The nucleotide sequence retrieved from the upper two bands was identical although showing
slightly different melting type. Both 0.5 kb long fragments showed high similarity to Chl.
vibrioforme (93% and 86% respectively) The more prominent middle band showed high
similarity to Chl. phaeobacteroides BS1 (73%) while the lowermost band was identical to the
sequence from Chl. phaeovibroides DSM 265. In the sample taken in May, Chl. phaeovibroides
DSM 265 was the predominant green sulfur bacterium in the chemocline of Lake Faro. This
distribution changes in the samples taken in June and July, where Chl. phaeobacteroides BS1 can
also be detected with a strong presence in all investigated layers of the chemocline. The most
striking changes can therefore be seen between samples taken at different times but not at
different depths of the chemocline.
For more detailed information about the identity of the green sulfur bacteria present in the
chemocline of Lake Faro, genomic fragments containing information of 16S rRNA gene and ITS
were amplified and cloned. Screening of 106 individual clones led to the identification of 30
clones bearing sequence information related to green sulfur bacteria. DGGE analyses of these
clones revealed 4 different melting types (Fig. 19B) which were identified through sequencing as
Chl. vibrioforme EP2403 (eg. clone 1 and 96, Fig 19 B), Chl. phaeovibroides DSM 265 (eg.
clone 2, 91, 99 and 101, Fig 19 B) and Chl. phaeobacteroides BS1 (eg. clone 97, 100 and 102,
Fig 19B). All 6 clones containing sequence information most related to Chl. phaeobacteroides
BS1 were sequenced showing 100% identity of 16S rRNA gene region. Only in the ITS region
mutational changes were observed, with the occurrence of two distinct types. All clones showed
three A↔G transitional mutations (Faro clone type 2, Fig. 20) and only one clone was bearing
additional 2 A→G transitions (Faro clone type 1, Fig 20). In order to investigate how the two
populations of Chl. phaeobacteroides BS1 present in the Black Sea and Lake Faro can be linked,
fossil DNA retrieved from sediments of the Mediterranean Sea was also used as comparison (see
next chapter).
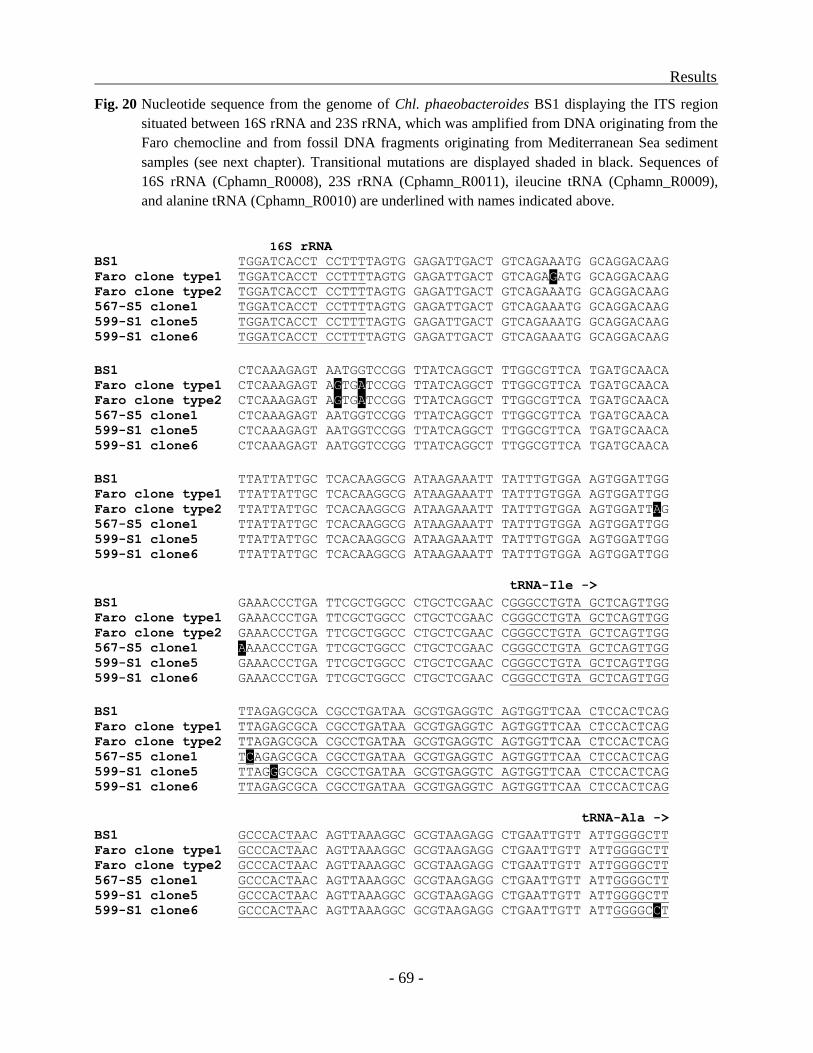
Results
- 69 -
Fig. 20 Nucleotide sequence from the genome of Chl. phaeobacteroides BS1 displaying the ITS region
situated between 16S rRNA and 23S rRNA, which was amplified from DNA originating from the
Faro chemocline and from fossil DNA fragments originating from Mediterranean Sea sediment
samples (see next chapter). Transitional mutations are displayed shaded in black. Sequences of
16S rRNA (Cphamn_R0008), 23S rRNA (Cphamn_R0011), ileucine tRNA (Cphamn_R0009),
and alanine tRNA (Cphamn_R0010) are underlined with names indicated above.
16S rRNA
BS1 TGGATCACCT CCTTTTAGTG GAGATTGACT GTCAGAAATG GCAGGACAAG
Faro clone type1 TGGATCACCT CCTTTTAGTG GAGATTGACT GTCAGAGATG GCAGGACAAG
Faro clone type2 TGGATCACCT CCTTTTAGTG GAGATTGACT GTCAGAAATG GCAGGACAAG
567-S5 clone1 TGGATCACCT CCTTTTAGTG GAGATTGACT GTCAGAAATG GCAGGACAAG
599-S1 clone5 TGGATCACCT CCTTTTAGTG GAGATTGACT GTCAGAAATG GCAGGACAAG
599-S1 clone6 TGGATCACCT CCTTTTAGTG GAGATTGACT GTCAGAAATG GCAGGACAAG
BS1 CTCAAAGAGT AATGGTCCGG TTATCAGGCT TTGGCGTTCA TGATGCAACA
Faro clone type1 CTCAAAGAGT AGTGATCCGG TTATCAGGCT TTGGCGTTCA TGATGCAACA
Faro clone type2 CTCAAAGAGT AGTGATCCGG TTATCAGGCT TTGGCGTTCA TGATGCAACA
567-S5 clone1 CTCAAAGAGT AATGGTCCGG TTATCAGGCT TTGGCGTTCA TGATGCAACA
599-S1 clone5 CTCAAAGAGT AATGGTCCGG TTATCAGGCT TTGGCGTTCA TGATGCAACA
599-S1 clone6 CTCAAAGAGT AATGGTCCGG TTATCAGGCT TTGGCGTTCA TGATGCAACA
BS1 TTATTATTGC TCACAAGGCG ATAAGAAATT TATTTGTGGA AGTGGATTGG
Faro clone type1 TTATTATTGC TCACAAGGCG ATAAGAAATT TATTTGTGGA AGTGGATTGG
Faro clone type2 TTATTATTGC TCACAAGGCG ATAAGAAATT TATTTGTGGA AGTGGATTAG
567-S5 clone1 TTATTATTGC TCACAAGGCG ATAAGAAATT TATTTGTGGA AGTGGATTGG
599-S1 clone5 TTATTATTGC TCACAAGGCG ATAAGAAATT TATTTGTGGA AGTGGATTGG
599-S1 clone6 TTATTATTGC TCACAAGGCG ATAAGAAATT TATTTGTGGA AGTGGATTGG
tRNA-Ile ->
BS1 GAAACCCTGA TTCGCTGGCC CTGCTCGAAC CGGGCCTGTA GCTCAGTTGG
Faro clone type1 GAAACCCTGA TTCGCTGGCC CTGCTCGAAC CGGGCCTGTA GCTCAGTTGG
Faro clone type2 GAAACCCTGA TTCGCTGGCC CTGCTCGAAC CGGGCCTGTA GCTCAGTTGG
567-S5 clone1 AAAACCCTGA TTCGCTGGCC CTGCTCGAAC CGGGCCTGTA GCTCAGTTGG
599-S1 clone5 GAAACCCTGA TTCGCTGGCC CTGCTCGAAC CGGGCCTGTA GCTCAGTTGG
599-S1 clone6 GAAACCCTGA TTCGCTGGCC CTGCTCGAAC CGGGCCTGTA GCTCAGTTGG
BS1 TTAGAGCGCA CGCCTGATAA GCGTGAGGTC AGTGGTTCAA CTCCACTCAG
Faro clone type1 TTAGAGCGCA CGCCTGATAA GCGTGAGGTC AGTGGTTCAA CTCCACTCAG
Faro clone type2 TTAGAGCGCA CGCCTGATAA GCGTGAGGTC AGTGGTTCAA CTCCACTCAG
567-S5 clone1 TCAGAGCGCA CGCCTGATAA GCGTGAGGTC AGTGGTTCAA CTCCACTCAG
599-S1 clone5 TTAGGGCGCA CGCCTGATAA GCGTGAGGTC AGTGGTTCAA CTCCACTCAG
599-S1 clone6 TTAGAGCGCA CGCCTGATAA GCGTGAGGTC AGTGGTTCAA CTCCACTCAG
tRNA-Ala -> BS1 GCCCACTAAC AGTTAAAGGC GCGTAAGAGG CTGAATTGTT ATTGGGGCTT
Faro clone type1 GCCCACTAAC AGTTAAAGGC GCGTAAGAGG CTGAATTGTT ATTGGGGCTT
Faro clone type2 GCCCACTAAC AGTTAAAGGC GCGTAAGAGG CTGAATTGTT ATTGGGGCTT
567-S5 clone1 GCCCACTAAC AGTTAAAGGC GCGTAAGAGG CTGAATTGTT ATTGGGGCTT
599-S1 clone5 GCCCACTAAC AGTTAAAGGC GCGTAAGAGG CTGAATTGTT ATTGGGGCTT
599-S1 clone6 GCCCACTAAC AGTTAAAGGC GCGTAAGAGG CTGAATTGTT ATTGGGGCCT
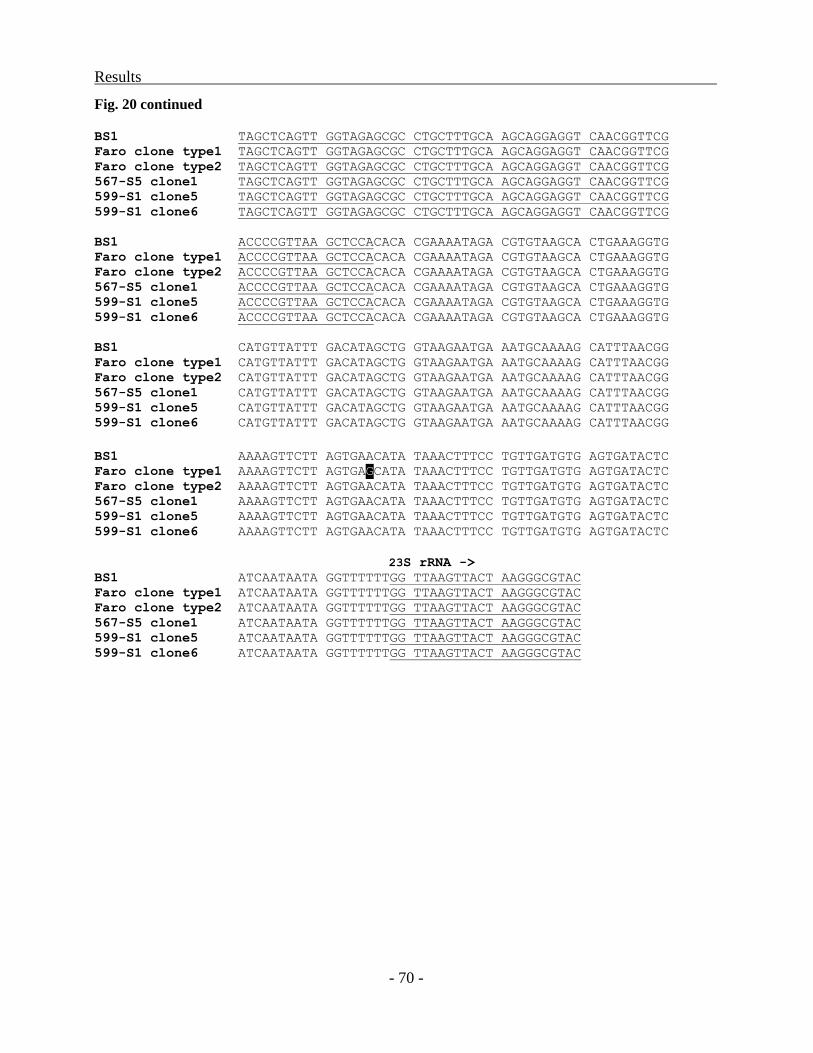
Results
- 70 -
Fig. 20 continued
BS1 TAGCTCAGTT GGTAGAGCGC CTGCTTTGCA AGCAGGAGGT CAACGGTTCG
Faro clone type1 TAGCTCAGTT GGTAGAGCGC CTGCTTTGCA AGCAGGAGGT CAACGGTTCG
Faro clone type2 TAGCTCAGTT GGTAGAGCGC CTGCTTTGCA AGCAGGAGGT CAACGGTTCG
567-S5 clone1 TAGCTCAGTT GGTAGAGCGC CTGCTTTGCA AGCAGGAGGT CAACGGTTCG
599-S1 clone5 TAGCTCAGTT GGTAGAGCGC CTGCTTTGCA AGCAGGAGGT CAACGGTTCG
599-S1 clone6 TAGCTCAGTT GGTAGAGCGC CTGCTTTGCA AGCAGGAGGT CAACGGTTCG
BS1 ACCCCGTTAA GCTCCACACA CGAAAATAGA CGTGTAAGCA CTGAAAGGTG
Faro clone type1 ACCCCGTTAA GCTCCACACA CGAAAATAGA CGTGTAAGCA CTGAAAGGTG
Faro clone type2 ACCCCGTTAA GCTCCACACA CGAAAATAGA CGTGTAAGCA CTGAAAGGTG
567-S5 clone1 ACCCCGTTAA GCTCCACACA CGAAAATAGA CGTGTAAGCA CTGAAAGGTG
599-S1 clone5 ACCCCGTTAA GCTCCACACA CGAAAATAGA CGTGTAAGCA CTGAAAGGTG
599-S1 clone6 ACCCCGTTAA GCTCCACACA CGAAAATAGA CGTGTAAGCA CTGAAAGGTG
BS1 CATGTTATTT GACATAGCTG GTAAGAATGA AATGCAAAAG CATTTAACGG
Faro clone type1 CATGTTATTT GACATAGCTG GTAAGAATGA AATGCAAAAG CATTTAACGG
Faro clone type2 CATGTTATTT GACATAGCTG GTAAGAATGA AATGCAAAAG CATTTAACGG
567-S5 clone1 CATGTTATTT GACATAGCTG GTAAGAATGA AATGCAAAAG CATTTAACGG
599-S1 clone5 CATGTTATTT GACATAGCTG GTAAGAATGA AATGCAAAAG CATTTAACGG
599-S1 clone6 CATGTTATTT GACATAGCTG GTAAGAATGA AATGCAAAAG CATTTAACGG
BS1 AAAAGTTCTT AGTGAACATA TAAACTTTCC TGTTGATGTG AGTGATACTC
Faro clone type1 AAAAGTTCTT AGTGAGCATA TAAACTTTCC TGTTGATGTG AGTGATACTC
Faro clone type2 AAAAGTTCTT AGTGAACATA TAAACTTTCC TGTTGATGTG AGTGATACTC
567-S5 clone1 AAAAGTTCTT AGTGAACATA TAAACTTTCC TGTTGATGTG AGTGATACTC
599-S1 clone5 AAAAGTTCTT AGTGAACATA TAAACTTTCC TGTTGATGTG AGTGATACTC
599-S1 clone6 AAAAGTTCTT AGTGAACATA TAAACTTTCC TGTTGATGTG AGTGATACTC
23S rRNA ->
BS1 ATCAATAATA GGTTTTTTGG TTAAGTTACT AAGGGCGTAC
Faro clone type1 ATCAATAATA GGTTTTTTGG TTAAGTTACT AAGGGCGTAC
Faro clone type2 ATCAATAATA GGTTTTTTGG TTAAGTTACT AAGGGCGTAC
567-S5 clone1 ATCAATAATA GGTTTTTTGG TTAAGTTACT AAGGGCGTAC
599-S1 clone5 ATCAATAATA GGTTTTTTGG TTAAGTTACT AAGGGCGTAC
599-S1 clone6 ATCAATAATA GGTTTTTTGG TTAAGTTACT AAGGGCGTAC

Results
- 71 -
Distribution of molecular markers in sediments
The concentration of the carotenoid isorenieratene was measured in sediment samples from
different locations in the Black Sea and Mediterranean Sea (Fig. 21, Table 4). Samples from the
Eastern Mediterranean Sea were taken from the sediment surface layer (Z0) or the corresponding
sapropel layers (S1, S4 and S5) from sediment cores from various locations mainly in the Aegean
Sea. These sapropel layers were previously described and represent layers of sediment which was
deposited under anoxic conditions 8,000 (S1), 124,000 (S4) and 176,000 (S5) years ago (Emeis
K.-C. et al., 2000).
Fig. 21 Geographic map of the eastern Mediterranean basin and the Black Sea. Locations where sediment
samples contained isorenieratene and BS1 fossil DNA are depicted with black circles; locations
where sediment samples contained only isorenieratene are depicted with grey circles; current
locations where Chl. phaeobacteroides BS1 was identified in the chemocline are depicted with
white circles.
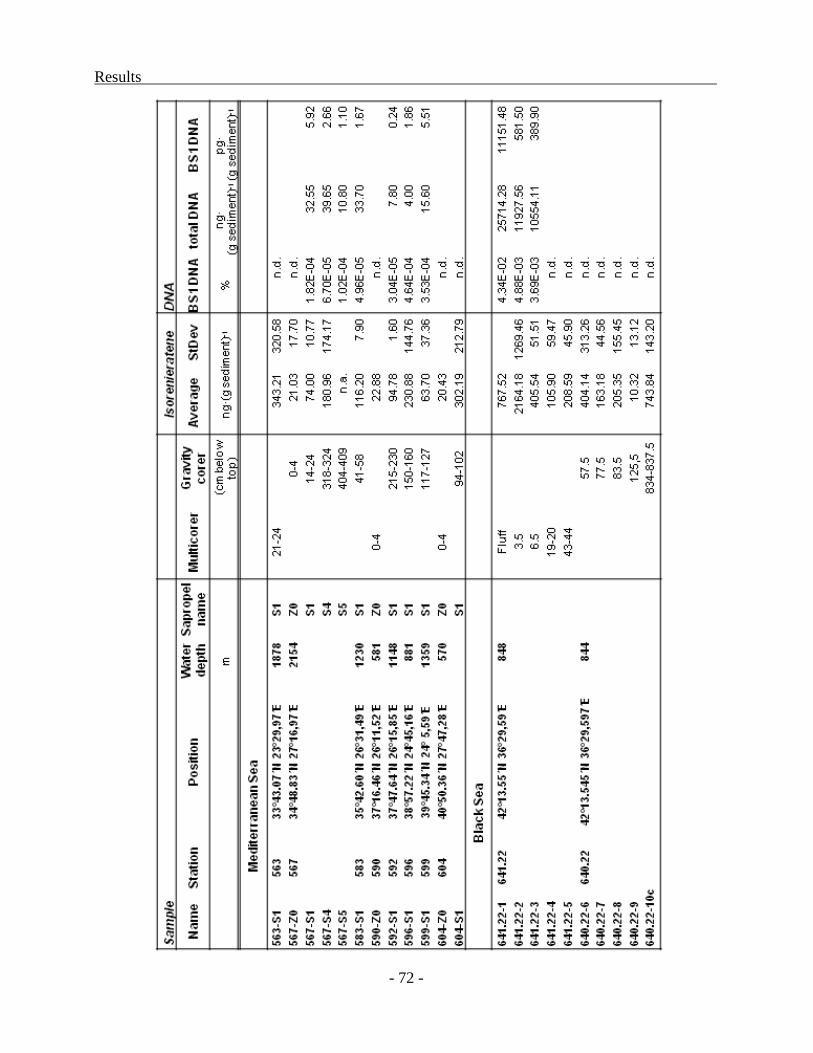
Results
- 72 -
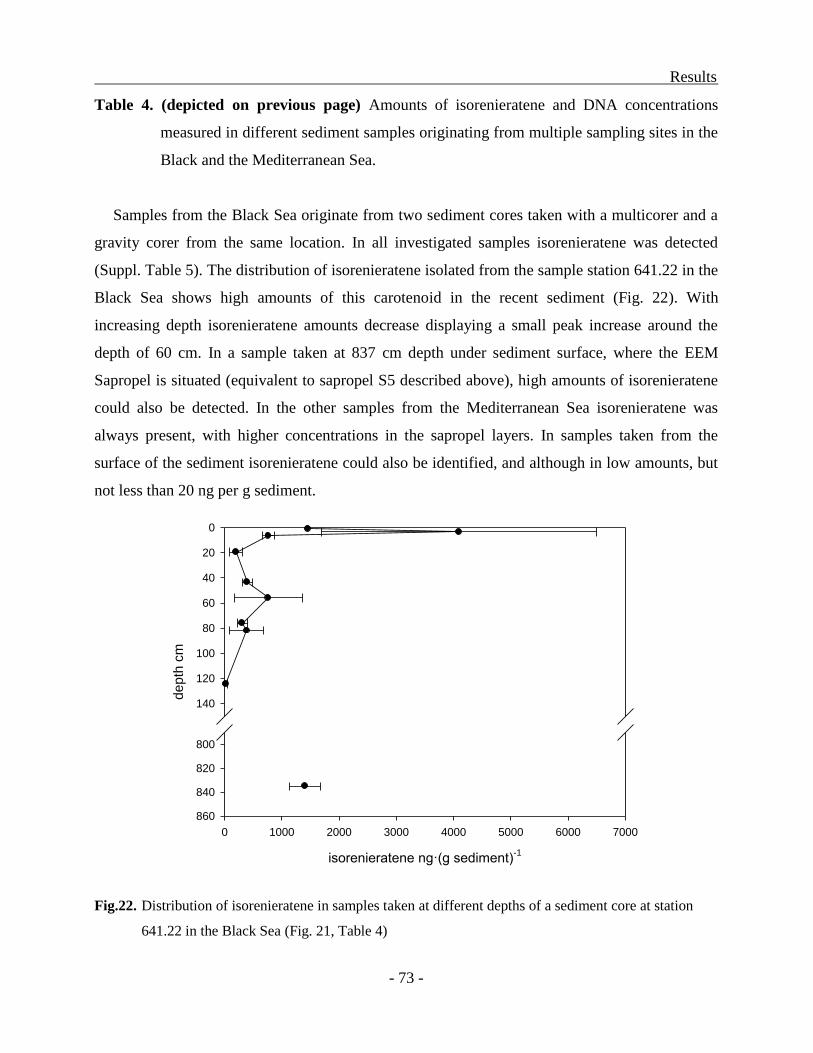
Results
- 73 -
Table 4. (depicted on previous page) Amounts of isorenieratene and DNA concentrations
measured in different sediment samples originating from multiple sampling sites in the
Black and the Mediterranean Sea.
Samples from the Black Sea originate from two sediment cores taken with a multicorer and a
gravity corer from the same location. In all investigated samples isorenieratene was detected
(Suppl. Table 5). The distribution of isorenieratene isolated from the sample station 641.22 in the
Black Sea shows high amounts of this carotenoid in the recent sediment (Fig. 22). With
increasing depth isorenieratene amounts decrease displaying a small peak increase around the
depth of 60 cm. In a sample taken at 837 cm depth under sediment surface, where the EEM
Sapropel is situated (equivalent to sapropel S5 described above), high amounts of isorenieratene
could also be detected. In the other samples from the Mediterranean Sea isorenieratene was
always present, with higher concentrations in the sapropel layers. In samples taken from the
surface of the sediment isorenieratene could also be identified, and although in low amounts, but
not less than 20 ng per g sediment.
Fig.22. Distribution of isorenieratene in samples taken at different depths of a sediment core at station
641.22 in the Black Sea (Fig. 21, Table 4)
isorenieratene ng·(g sediment)-1
0 1000 2000 3000 4000 5000 6000 7000
depth
cm
0
20
40
60
80
100
120
140
800
820
840
860
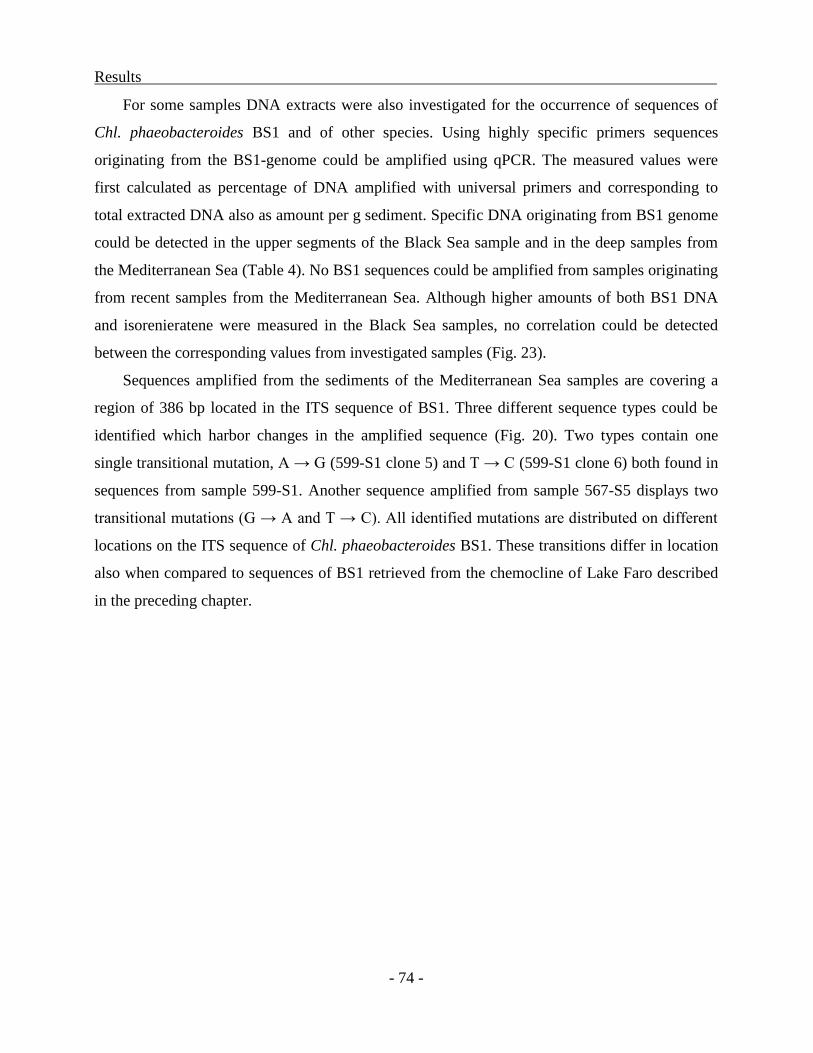
Results
- 74 -
For some samples DNA extracts were also investigated for the occurrence of sequences of
Chl. phaeobacteroides BS1 and of other species. Using highly specific primers sequences
originating from the BS1-genome could be amplified using qPCR. The measured values were
first calculated as percentage of DNA amplified with universal primers and corresponding to
total extracted DNA also as amount per g sediment. Specific DNA originating from BS1 genome
could be detected in the upper segments of the Black Sea sample and in the deep samples from
the Mediterranean Sea (Table 4). No BS1 sequences could be amplified from samples originating
from recent samples from the Mediterranean Sea. Although higher amounts of both BS1 DNA
and isorenieratene were measured in the Black Sea samples, no correlation could be detected
between the corresponding values from investigated samples (Fig. 23).
Sequences amplified from the sediments of the Mediterranean Sea samples are covering a
region of 386 bp located in the ITS sequence of BS1. Three different sequence types could be
identified which harbor changes in the amplified sequence (Fig. 20). Two types contain one
single transitional mutation, A → G (599-S1 clone 5) and T → C (599-S1 clone 6) both found in
sequences from sample 599-S1. Another sequence amplified from sample 567-S5 displays two
transitional mutations (G → A and T → C). All identified mutations are distributed on different
locations on the ITS sequence of Chl. phaeobacteroides BS1. These transitions differ in location
also when compared to sequences of BS1 retrieved from the chemocline of Lake Faro described
in the preceding chapter.
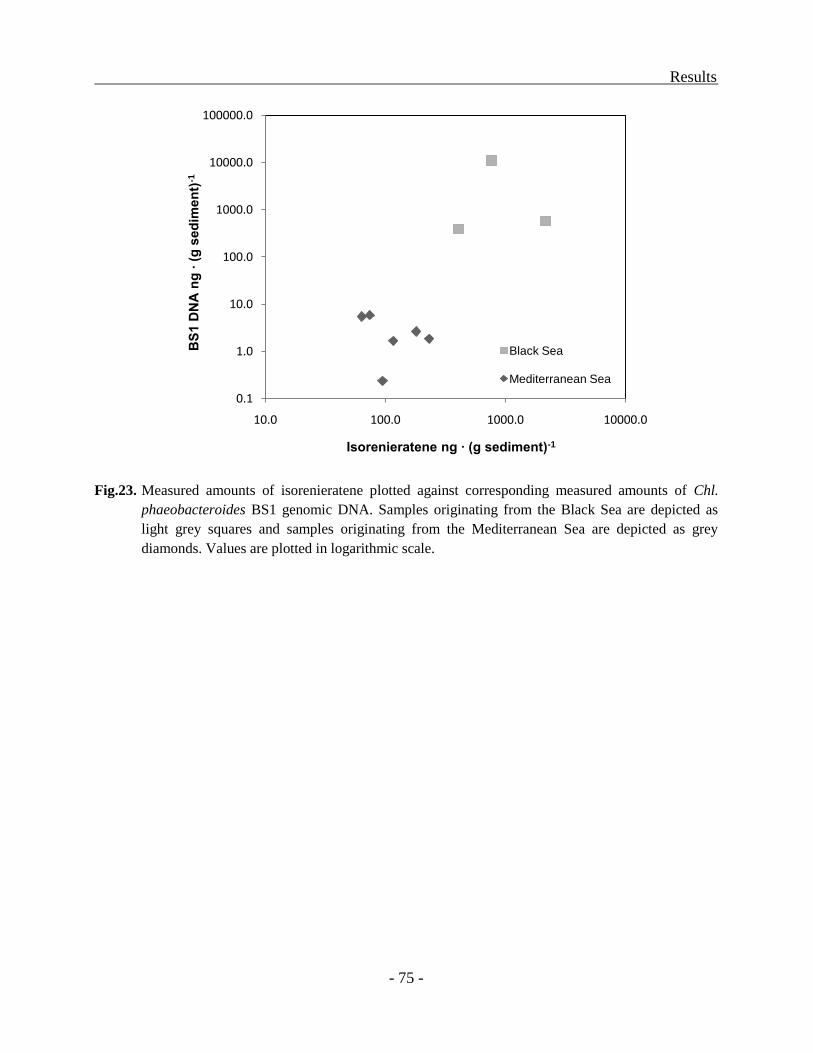
Results
- 75 -
Fig.23. Measured amounts of isorenieratene plotted against corresponding measured amounts of Chl.
phaeobacteroides BS1 genomic DNA. Samples originating from the Black Sea are depicted as
light grey squares and samples originating from the Mediterranean Sea are depicted as grey
diamonds. Values are plotted in logarithmic scale.
0.1
1.0
10.0
100.0
1000.0
10000.0
100000.0
10.0 100.0 1000.0 10000.0
BS
1 D
NA
ng
∙ (
g s
ed
ime
nt)
-1
Isorenieratene ng ∙ (g sediment)-1
Black Sea
Mediterranean Sea
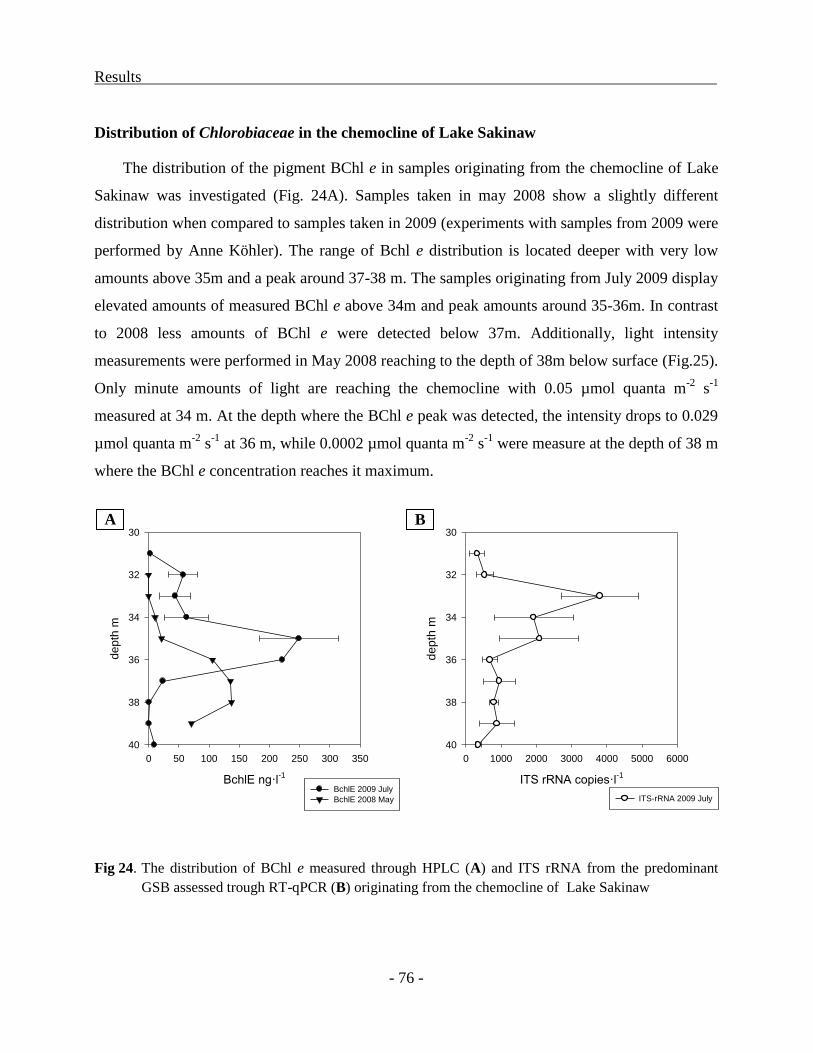
Results
- 76 -
Distribution of Chlorobiaceae in the chemocline of Lake Sakinaw
The distribution of the pigment BChl e in samples originating from the chemocline of Lake
Sakinaw was investigated (Fig. 24A). Samples taken in may 2008 show a slightly different
distribution when compared to samples taken in 2009 (experiments with samples from 2009 were
performed by Anne Köhler). The range of Bchl e distribution is located deeper with very low
amounts above 35m and a peak around 37-38 m. The samples originating from July 2009 display
elevated amounts of measured BChl e above 34m and peak amounts around 35-36m. In contrast
to 2008 less amounts of BChl e were detected below 37m. Additionally, light intensity
measurements were performed in May 2008 reaching to the depth of 38m below surface (Fig.25).
Only minute amounts of light are reaching the chemocline with 0.05 µmol quanta m-2
s-1
measured at 34 m. At the depth where the BChl e peak was detected, the intensity drops to 0.029
µmol quanta m-2
s-1
at 36 m, while 0.0002 µmol quanta m-2
s-1
were measure at the depth of 38 m
where the BChl e concentration reaches it maximum.
Fig 24. The distribution of BChl e measured through HPLC (A) and ITS rRNA from the predominant
GSB assessed trough RT-qPCR (B) originating from the chemocline of Lake Sakinaw
BchlE ng·l-1
0 50 100 150 200 250 300 350
depth
m
30
32
34
36
38
40
BchlE 2009 July
BchlE 2008 May
ITS rRNA copies·l-1
0 1000 2000 3000 4000 5000 6000
depth
m
30
32
34
36
38
40
ITS-rRNA 2009 July
A B
Results
- 77 -
The activity of the predominant BChl e containing green sulfur bacterium found in the
chemocline of Lake Sakinaw was assessed through RT-qPCR for samples taken in July 2009
(Fig. 24B). In agreement with the inferred pattern of pigment distribution specific ITS transcripts
were detected in all investigated samples. Peak amounts correlating with high activity can be
observed at the depth of 33 m with decreasing activity at 34-35m. Regions above 32 m and
below 36 m show very low activity patterns. Although BChl e concentrations at 33 m are much
lower than at deeper depths cells thriving at these depths are more active due to the higher light
intensity. These activity patterns show clear correlation with light intensity which drops
dramatically when reaching pigment rich layers in the chemocline as shown in measurements
from 2008.
Fig 25. Depth profile of the light intensity distribution measured in the Lake Sakinaw during the sampling
session in May 2008 (A). Expand view of light intensities measured below 30 m is shown inserted
(B). (E. Gies and T. Beatty, unpublished data)
Discussion
- 78 -
DISCUSSION
Adaptation of Chromatiaceae toward absorption of specific wavelengths of
light
Structure of the puf operons in strain 970 and Trv. winogradskyi
All puf operons sequenced in this study follow the arrangement pufBALMC common to other
purple sulfur bacteria (Tuschak et al., 2005). Like other Gammaproteobacteria from the family
Chromatiaceae such as Allochromatium. vinosum and Lamprocystis. purpurea (Tuschak et al.,
2005; Yutin and Béjà, 2005), strain 970 has multiple copies of pufBA. Instead of the three copies
found in these other species, only two copies are present in strain 970, however, and the
occurrence of an ORF downstream of pufA2 that is not related to the genes typical for the puf
operon renders a presence of a third copy of LHC genes unlikely. Accordingly, the puf operon
structure detected in strain 970 represents a novel type among the anoxygenic phototrophic
proteobacteria. In addition, the two pufA copies are also unusually long with pufA2 spanning over
261 nt. Because the sequenced part of the puf operons of Trv. winogradskyi did not extend
beyond pufC, it remains unclear whether additional pufBA copies are present in these two strains.
Since a partial sequence of bchZ was detected upstream of pufBA in both Trv. winogradskyi
strains, the puf genes are likely to be part of a photosynthesis gene cluster as in other purple
bacteria (Beja et al., 2002). In contrast no sequence of bchZ was detected upstream of pufBA in
strain 970. No other known bacterial sequence shows such an unusual arrangement of the puf
operon. In Citromicrobium bathyomarinum strain JL354 a second incomplete photosynthetic
operon consisting only of pufLMC and puhCBA genes could be identified by whole-genome
sequencing (Jiao et al., 2010). The sequence similarity between the two pufLM genes in the same
genome is less than 70%. Since no second pufLM sequence could be detected in strain 970 it
remains unclear how the photosynthesis gene cluster is organized in this bacterium. The
investigated sequence resembles a complete puf operon and transcriptional analysis with specific
primers clearly shows transcriptional activity in photosynthetic active cultures of strain 970.

Discussion
- 79 -
Transcriptional regulation of the puf operon in strain 970
Besides light intensity and oxygen concentrations that affect the transcription of puf genes via
several repressors and transactivators (Bauer and Bird 1996; Gregor and Klug 1999), the
expression of puf genes is also regulated via the stability of their mRNA transcripts. With regard
to the latter, differential degradation rates of the polycistronic mRNA are caused by intercistronic
secondary structures of the transcripts (Rauhut and Klug 1999). In the present study,
intercistronic hairpin loop structures were found between pufA and pufL in all the investigated
puf operons. Similar structures were previously shown to exert stabilizing effects on the short
pufBA mRNA segment by protecting it against 3’ to 5’ exonucleases (Klug et al., 1987; Chen et
al., 1988). A significantly longer half life of the pufB1A1 transcript compared to that of the pufLM
mRNA was previously also determined in strains of Rhodobacter capsulatus (Klug et al., 1987;
Klug, 1993), where transcripts of pufB1A1 and pufLM display half lives of 33 min and 8 min,
respectively, which are in the same range as the values determined for strain 970. It is concluded,
that the increased stability of the pufBA mRNA segment causes a predominance of pufB1A1
transcripts over the pufLM mRNA in strain 970. Furthermore, the ratio of the two transcripts
doubled under light-limiting conditions. Therefore our results indicate that transcriptional
regulation of puf genes in strain 970 follows the patterns known for other phototrophic
proteobacteria.
So far, the reason for the low abundance of pufB2A2 transcripts remain elusive. No putative
sites of transcriptional terminators could be found between the pufC and pufB2 intercistronic
region and only a strong secondary structure downstream of pufA2 that is followed by several
uracil residues displays features of a described transcriptional terminator for the puf operon of
Rhodospirillum rubrum (Bélanger and Gingras, 1988). This suggests that the additional copies of
pufBA genes are within the co-transcribed puf operon and possibly also the presence of additional
destabilizing, yet unrecognized, RNA structures upstream or within the pufB2A2 transcripts. In
this context it is noteworthy that the nucleotide sequence of pufA2 but not pufA1 was found to
harbor two consensus sequences that were earlier suggested as recognition sites for Escherichia
coli RNase E (GAUUU) Fig. 8, (Ehretsmann et al., 1992).
Discussion
- 80 -
Significance of amino-acid substitutions in the LHC1 polypeptides
The α and β polypeptides of LHC1 encompass a single transmembrane α helical segment with a
conserved histidine that ligates the Mg atom of the BChl macrocycle (Zuber and Brunisholz,
1991). Mutational exchange of this residue results in either the complete loss or severely limited
expression of LHC1 (Bylina et al., 1988; Olsen et al., 1994, 1997; Davis et al., 1997).
Additional interactions between the polypeptide and BChl include hydrogen bonding between
the BChl C31 acetyl group and αTrp
+11 or βTrp
+9 (Olsen et al., 1994; Sturgis et al., 1997).
The sequence analysis of the LHC1 polypeptides of strain 970 revealed a conspicuous
difference to most or all other known sequence types. The change in polarity of the N- and C-
terminal domains framing the membrane spanning α-helices of both LHC1 polypeptides is
unlikely to impact the absorption pattern as similar changes are also found in sequences from
Trv. winogradskyi, Cfl. aurantiacus and Lpc. purpurea. Furthermore, the C-terminal region of
the LHC1α polypeptide of other phototrophic proteobacteria was shown to be post-
translationally processed (Bérard et al., 1986; Wiessner et al., 1990; Nagashima et al., 1994).
Therefore differences in the primary structure of this region, which could occur due to the
unusual length of LH1α polypeptides from strain 970 and a possible interference with the spatial
arrangement of the light harvesting complex, may not affect the absorption properties of the
resulting complex.
In contrast, the deletion of an amino acid between αHis0 and αTrp
+11 is found in only four
other species, one of them being Tch. tepidum that also exhibits a red shifted Qy absorption
maximum at 915 nm (Madigan, 2003). The formation of a Ca2+
binding site in this region of the
polypeptide is thought to be responsible for the absorption shift in this bacterium (Kimura et al.,
2008). Although pufA1 and pufA2 of strain 970 display this deletion as well, the Qy red shift
cannot be attributed solely to this region, because the same sequence pattern was also determined
for the two Trv. winogradskyi strains that do not exhibit a red-shifted Qy absorption. However,
sequence analysis of the LHC1 polypeptides from strain 970 identified additional candidate
amino acids that may cause the highly specific and extreme red shift of the Qy band in this
bacterium. One striking difference is the αHis+11
that follows αTrp+10
. This substitution
combined with the deletion between αHis0 and αTrp
+11 directly affects the interaction with the
BChl C31 acetyl group. Based on our modeling of the strain 970 α-polypeptide an interaction
Discussion
- 81 -
between αHis+11
and BChla is likely. Previous studies showed that the substitution of αTrp+11
with a histidine residue in Rbc. sphaeroides leads to a slight red shift in the Qy absorption
maximum (Sturgis et al., 1997). We therefore propose that the combination of the replacement
and the deletion of one amino acid leads to considerable conformational changes in the LHC1
structure of strain 970 causing the change in the Qy absorption.
Conspicuously no similarities could be found in the sequence comparison with LHC1
polypeptides isolated previously from Roseospirillum (Rss.) parvum, another purple sulfur
bacterium displaying a red shifted Qy absorption maximum at 909 nm (Tuschak et al., 2004). The
α-polypeptide from Rss. parvum harbors differences at the residues αCys+3
, αGly+5
and αHis+6
found in close proximity to the conserved histidine residue (αHis0). Additionally, the β-
polypeptide shows a unique residue βCys-4
and another change at the position βPhe+9
.
Comparative 3D-models indicate that αCys+3
, βCys-4
and βPhe+9
are in close proximity to the
BChla molecule. This comparison shows that effects on the Qy absorption can result from
different positions in the polypeptide sequence.
A sequence position that is exclusively shared between strain 970 and Tch. tepidum
ATCC43061T is the residue βTrp
-8, which was previously suggested to interact with BChla (Ma
et al., 2009). Indeed, our 3-D modeling of the β-polypeptide of strain 970 suggests that the
replacement of βPhe-8
by βTrp-8
results in hydrogen bonding to the acetyl carbonyl of BChla. In
combination, the changes involving the residues βTrp-8
and αHis+11
toghether with the deletion
of one amino acid may explain the red-shift of Qy in Tch. tepidum ATCC43061T and strain 970
compared to other bacteria including the two strains of Trv. winogradskyi and also Rss. parvum.
Discussion
- 82 -
Phylogeny of the unusual LHC1 in strain 970
The phylogenetic analyses indicate a monophyletic origin of the LHC1 polypeptides of strain
970, Trv. winogradskyi strains 06511 and DSM6702T, and Tch. tepidum ATCC43061
T. Based on
the phylogenetic branching pattern, amino acid substitutions leading to red-shifted Qy absorption
patterns could have accumulated gradually and started with a sequence similar to that found in
Trv. winogradskyi strains that display common spectral properties. All substitutions present in
the LHC1 sequence from Tch. tepidum ATCC43061T could also be found in strain 970.
Additional substitutions found solely in strain 970 could then have accumulated and caused the
extreme red shift of the Qy absorption toward 963 nm. In contrast to the pufBA phylogeny, our
analysis of 16S rRNA gene sequences as well as of pufLM sequences clearly indicated a more
distant phylogenetic relationship between Tch. tepidum ATCC43061T, and the closely related
strain 970 and Trv. winogradskyi strains. This might even reflect the different habitat of the
moderate thermophile Tch. tepidum. Horizontal gene transfer has previously been taken in
consideration to explain inconsistencies between phylogenies of puf and 16S rRNA gene
sequences (Nagashima et al., 1997). Due to the small sizes of the antenna polypeptides, however,
such sequence differences might also reflect mere statistical fluctuations (Nagashima et al.,
1996). Although Rss. parvum displays similar red-shifted Qy absorption to Tch. tepidum, it’s
distant phylogenetic relationship revealed in both analyses emphasizes the parallel evolution of
patterns involved in the light harvesting properties of purple sulfur bacteria. Comparative
genomics of the Tch. tepidum ATCC43061T, strain 970 and Trv. winogradskyi 06511 and
DSM6702T potentially will provide a deeper insight into the origin of the extreme red-shifted
light-harvesting complexes of strain 970.
The isolation of new types of anoxygenic phototrophs (such as Rss. parvum; Glaeser and
Overmann 1999) expressing light-harvesting complexes with absorption maxima above 900 nm
suggests that a selection of red-shifted light harvesting complexes has occurred in littoral
sediments. This can be attributed to the incontinuous water coverage of these sandy sediments,
which in contrast to pelagic habitats leads to an higher amount of far-red and near-infrared light
reaching the sediment. Therefore, additional efforts were made to identify new strains exerting
red-shifted absorption patterns. The search for new pufLM sequences in the diverse habitats of
Little Sippewissett Saltmarsh did not yield novel close relatives of strain 970. Most retrieved
Discussion
- 83 -
sequences (i.e. 8 clone types) clustered with Roseobacter species and one clone type with
Congergibacter litoralis DSM 17192. These proteobacteria are aerobic anoxygenic phototrophs
and usually exist in marine habitats, especially in nearshore waters. Another clone type showed
close relationship to Thiorhodococcus mannitoliphagus ATCC BAA-1228, a Gammaproteo-
bacterium initially isolated from an microbial mats located in an estuary on the White Sea coast
(Rabold et al., 2006), a similar habitat like the Sippewissett Saltmarsh. The last retrieved
sequence is closely related to bacteria belonging to the genus Halochromatium, which resembles
the halophilic species of the family Chromatiaceae. All these isolated sequences represent
species with no specific adaptation towards near infrared light absorption, indicating that the
adaptation to the 900-1000 nm wavelength region, be it by lateral gene transfer or independent
evolution of one lineage, may have occurred only rarely during the evolution of benthic
Chromatiaceae.
Discussion
- 84 -
The adaptation of Chlorobiaceae to growth at low light conditions
The detection of extreme low light intensities at depths where the green sulfur bacterium Chl.
phaeobacteroides BS1 was shown to grow with only light as energy source, has led to questions
about the molecular properties enabling this adaptation. Previous studies described physiological
features like the increased BChl e content and the presence of geranyl homologs of BChl e
(Manske et al., 2005), the extreme low light saturated growth rate (Overmann et al., 1992a) or
the low maintenance requirements (Marschall et al., 2010). The fact that cells cultivated at low
light intensities resemble increased adaptational features when compared to cells cultivated at
high light intensities enables most of these experimental approaches. In order to identify the
genetic determinants of this preadaptation, the transcriptomes of cultures grown under these two
different light intensities were compared in the present study. Additionally whole genome
comparison with the other currently available GSB genomes was used to identify unique features
of the BS1 genome.
While the chemocline of the Black Sea represents a unique marine habitat, in some lacustrine
environments chemoclines with low light conditions are also present. The identification of
another Chlorobi strain adapted to low light intensities in the chemocline of Lake Sakinaw
herefore opened new perspectives in investigating this trait. First measurements assessed the
BChl e content, distribution and activity pattern of this newly described bacterium in order to
compare the growth conditions in this lake to those of the Black Sea chemocline. Although the
chemocline of Lake Faro is not located at great depths, the presence of the same geranyl
homologs of BChl e as in BS1 was intriguing. The precise description of the green sulfur
bacterial community was therefore needed to reveal the possible link to the BS1 strain and also a
possible low light adaptation.
The Black Sea, as a well described model for past anoxic environments, enables also the use
of BS1 as a precise indicator in the investigation of sediments. The occurrence of the carotenoid
isorenieratene, commonly used as molecular marker for anoxic environments, was therefore
compared against the occurrence of fossil DNA of BS1 in sediments from the Black Sea and the
Mediterranean Sea. For this purpose, sediments which were previously described to have been
deposited under anoxic conditions and present sediments were investigated.
Discussion
- 85 -
Genes up-regulated under high light condition
The imposed light intensity of 3 µmol quanta·m-2
·s-1
represents the condition where the culture is
light saturated but shows no light inhibition (Manske et al., 2005). This condition was chosen for
comparison to low light intensities which resemble the in-situ situation in the chemocline.
Transcripts highly regulated under this high light intensity reveal which genes are becoming
unessential in conditions of low light availability and hereby lead to a more detailed description
of the low light adaptation of Chl. phaeobacteroides BS1. Many of the high regulated 135 genes
are part of major metabolic pathways or are part of an operon and will be discussed as distinctive
groups.
Nitrogen fixation. Like many other bacteria BS1 is able to fix nitrogen as a source for
biosynthetic needs. Genes involved in the nitrogen fixation are clustered in the nif-operon, which
is found to be down regulated under low light conditions. The positive transcriptional regulator
nifA (Cphamn1_1748) together with other 8 genes (Cphamn1_1751-58) of this operon are highly
transcribed only under high light availability. Because nitrogen fixation is an high energy
demanding process, exact control of its function and expression under limiting energy conditions
is mandatory for free living autotrophic bacteria. In most bacteria the presence of oxygen is the
major negative regulator for nitrogenase transcription and activity (Schmitz et al., 2002). But a
close linkage between nitrogenase regulation and ammonium availability and light intensity
could also be detected in the phototrophic purple bacterium Rhodobacter capsulatus (Masepohl
et al., 2002). Another two nitrogen regulatory proteins P-II (Cphamn1_0108, Cphamn1_1137)
are also similarly regulated and interestingly both are co-localized with two genes coding for an
ammonium transporter (Cphamn1_0107, Cphamn1_1138). Ammonium is then used in the
amidation with glutamate to form glutamine, reaction which is part of the metabolism of nitrogen
and is being catalyzed by the enzyme glutamine synthetase (Eisenberg et al., 1987). The genes
coding for this enzyme are also found to be up regulated in high light (Cphamn1_0953) together
with an transcriptional regulator form the AsnC family, which is an important regulatory system
of the amino acid metabolism and related processes (Kumarevel et al., 2008). While hydrogen is
produced along with ammonia as a product of nitrogen fixation, hydrogen utilization is typically
mediated by uptake hydrogenases that catalyze the oxidation of hydrogen (Rey et al., 2006). The
hydrogenase transfers electrons to ferredoxins and cytochromes, thus contributing to the
Discussion
- 86 -
recycling of electrons to nitrogenase (Willison et al., 1983). Therefore the up-regulation of 4
genes coding for the nickel-dependent hydrogenase (Cphamn1_1590-93) can directly be linked
to the up regulation of nitrogenase activity. The high number of regulated genes coding for many
proteins involved in nitrogen fixation is one of the facts which make this process energy
demanding. But more important is the fact that this process also needs reduced ferredoxins,
which are more scarcely produced under low light conditions and is first of all needed for the
reductive citric acid pathway. A negative control of this energy consuming processes is therefore
one of the features Chl. phaeobacteroides BS1 is regulating in order to adapt to low light
availability.
Molybdenum transport and Mo cofactor biosynthesis. Many enzymes like nitrogenase,
sulphite oxidase and arsenite oxidase require cofactors which have incorporated molybdenum in
their structure (Schwarz and Mendel, 2006). It is therefore not surprising that together with the
regulation of nitrogenase, a simultaneous regulation of its cofactor synthesis and therefore
molybdenum transport occurs. Genes responsible for the molybdenum transport are coding for
molybdenum and molybdate ABC transporter (Cphamn1_0451, 0453 respectively) and in
between these two a gene (Cphamn1_0452) coding for a TOBE domain-containing protein
responsible for the recognition of small ligands such as molybdenum were found to be
upregulated at high light. Molybdenum cofactor synthesis genes (Cphamn1_2359, 2361, 2362
and 2366) are clustered together with other up regulated genes. Two genes coding for
hypothetical proteins are found in close vicinity (Cphamn1_2358 and 2363) with the latter being
unique to BS1. In between cofactor synthesis genes there are also two genes coding for the
arsenite oxidase small and large subunit (Cphamn1_2364 and 2365), another enzyme requiring
molybdate cofactos as mentioned above. These data show clearly that all these genes showing
correlations in this metabolic pathway are also correlated in their regulation when being down
regulated at light conditions where the energy yield is low.
Phosphate transport. A big cluster of genes (Cphamn1_1225-1237) resembling an operon
coding for genes involved in phosphate uptake was found to be similarly regulated. The main
genes coding for an ABC type phosphate transporter are present twice in this operon. Two copies
of ATP-binding protein PstB (Cphamn1_1231, 1236) are flanking a tandem of inner membrane
subunit proteins PstC (Cphamn1_1232, 1234) and PstA (Cphamn1_1233, 1235). Additionally
there are two phosphate binding proteins (Cphamn1_1229, 1230) two phosphate uptake
Discussion
- 87 -
regulators PhoU (Cphamn1_1237, 1238). This genetic assembly can also be found in other
bacteria belonging to the Chlorobi phylum. Usually these transporters are multicomponent
systems typically composed of a periplasmic substrate-binding protein, one or two reciprocally
homologous integral inner-membrane proteins and one or two peripheral membrane ATP-
binding proteins that couple energy to the active transport system (Ames, 1986). The role of the
three 5’ flanking hypothetical proteins (Cphamn1_1226, Cphamn1_1227 and Cphamn1_1228)
which seem to be co-regulated is unknown and the latter gene was also detected as up-regulated
by cDNA-SSH. Homologs of these genes could be identified in three other Chlorobi (Chl.
limicola DSM 245T, Chl. phaeobacteroides DSM 266
T, and Prosthecochloris aestuarii DSM
271T). The last gene found to be cotranscribed with this cluster is coding for a glycotransferase
(Cphamn1_1225) which is involved in cell wall biogenesis, but the link to the genes involved in
phosphate transport is unknown and could represent just a coincidence. Other up regulated genes
that can be linked to phosphate uptake are Cphamn1_1536 coding for a phytase and
Cphamn1_0512 coding for a alkaline phosphatase. The phytase is a secreted enzyme which
hydrolyses phytate to release inorganic phosphate, while the latter represents a means for the
bacteria to generate free phosphate groups for uptake and use, which is supported by the fact that
alkaline phosphatase is usually produced by the bacteria only during phosphate starvation
(Horiuchi et al., 1959). As seen for the molybdenum transport, BS1 regulates some energy
demanding transport systems probably in order to save energy for more important metabolic
pathways.
Biotin synthesis. Another example of a highly regulated secondary metabolism pathway is
the biotin synthesis pathway. Like in 9 other Chlorobi genomes, genes coding for proteins
involved in biotin biosynthesis (Cphamn_2453-2459) are clustered in an operon which in our
experiments was shown to be co-regulated. Five of these genes (Cphamn1_2453, 2454, 2457,
2458 and 2459) code for enzymes involved in the second stage of biotin synthesis from primelate
(Lin and Cronan, 2011) while biosynthesis protein BioC (Cphamn1_2455) is involved in the
synthesis of primelate. The gene coding for a hypothetical protein has unknown functions and
has homologs also present in all nine Chlorobi genomes mentioned before. Biotin is an enzyme
cofactor indispensable for CO2 fixation and the down-regulation of the genes involved of its
metabolic pathway are congruent with the lower photosynthetic activity expected at these low
Discussion
- 88 -
light intensities. However, a second copy of biotin synthase BioB (Cphamn1_0208) was not
down-regulated, but the impact of this regulatory feature on biotin synthesis is still unclear.
Other up-regulated genes under high light conditions. Most of these regulated genes not
organized in bigger clusters or operons are involved in energy production or conversion
pathways. Two genes coding for subunits of the succinate dehydrogenase (Cecchini et al., 2002)
were found to be up-regulated, (i) succinate dehydrogenase and fumarate reductase iron-sulfur
protein (Cphamn1_0285) and (ii) a putative succinase dehydrogenase subunit C
(Cphamn1_0286). But other copies of genes involved in the assembly of the succinate
dehydrogenase enzyme (Cphamn1_0284, 1699, 2514, 2515 and 2516) show no transcriptional
regulation leading to the conclusion that only some additional copies are being regulated.
Another gene is coding for NADH dehydrogenase I subunit D (Cphamn1_1604), being the only
gene in the NADH dehydrogenase operon showing significant but low regulation. The
plastoquinol-plastocyanin reductase (Cphamn1_1987) is part of the cytochrome b6f complex and
involved in photosynthesis, but like above it represents only one significant but low regulated
subunit of a larger complex. A gene coding for a cytochrome c class I protein (Cphamn1_0009)
was also found to be down-regulated trough both used methods, Illumina sequencing and cDNA
SSH. It presumably codes for the sulfite dehydrogenase cytochrome subunit, being then also
involved in the photosynthesis pathway by providing the electron donors for the reductive CO2
cycle (inorganic reduced sulfur compounds) through sulfide oxidation. Another protein which
could be associated to these regulated genes is the cytochrome c assembly protein
(Cphamn1_2044), which is involved in the assembly of periplasmic c-type cytochromes.
Some of the up-regulated genes are involved in amino acid transport and metabolism like a
aminoacyl-histidine dipeptidase (Cphamn1_1387), a pyruvate carboxyltransferase
(Cphamn1_1747), and a gene (Cphamn1_1650) coding for a Na+/proline symporter. Others, like
the two copies of cobyrinic acid ac-diamide synthase (Cphamn1_0038 and 0681), are involved in
the biosynthesis of cobalamine (vitamin B12) which is a cofactor of enzymes including
isomerases, methyltransferases and dehalogenases. Genes involved in transport are the inorganic
ion transport Fe2+
transport system protein A (Cphamn1_0621) or the tripartite ATP-
independent periplasmic transporter with unknown function (Cphamn1_0426).
Discussion
- 89 -
Genes detected only by cDNA-SSH. Out of 9 protein coding ORF found to be differentially
expressed by cDNA-SSH 4 were also detected via transcriptome sequencing. Interestingly the
two genes coding for hypothetical proteins were detected also by transcriptome sequencing, and
one of them (Cphamn1_2363) being also unique to BS1 when compared to other Chlorobi. The
other five genes are also involved in major metabolic pathways, two proteins being involved in
the reductive citric acid cycle. The oxoglutarate ferredoxin oxidoreductase (Cphamn1_0326)
resembles the beta subunit of the enzyme catalyzing the carboxylation of succinyl-CoA to 2-
oxoglutarate. But because other three genes involved in this carboxylation step (Cphamn1_0327,
Cphamn1_1033 and Cphamn1_1034) showed no detectable change in their transcription, the
meaning of this positive hit remains inconclusive. The gene coding for ferredoxin
(Cphamn1_1091) was also found to be up-regulated, being the direct electron donor for CO2
fixation reactions in the reductive citric acid cycle. Another two genes are coding proteins which
are involved in the photosynthetic complex. While FMO-protein (Cphamn1_0841) is part of this
complex, resembling the base plate connecting the chlorosomes to the reaction center, the second
gene codes for the magnesium chelatase subunit H (Cphamn1_2207), a protein involved in the
bacteriochlorophyll biosynthesis. Again this gene coding for a enzyme subunit is only one of
several genes (Cphamn1_2205, Cphamn1_1048, Cphamn1_1047, and Cphamn1_1046) which
were not further detected as differentially transcribed. The last gene detected only by cDNA-SSH
dapD (Cphamn1_0020) is coding the 2,3,4,5-tetrahydropyridine-2-carboxylate N-
succinyltransferase involved in the lysine biosynthesis. In general, ORFs detected to be up
regulated at high light intensities by cDNA-SSH, are involved with pathways which are directly
coupled with the turnover of the increased energy available at high light intensities.
Discussion
- 90 -
Genes up-regulated under low light condition
Under low light condition (0.15 µmol quanta·m-2
·s-1
) the transcriptome of Chl. phaeobacteroides
BS1 still contains transcripts of a majority of the identified 2524 ORFs in the genome. In
comparison to cultures grown under higher light intensities (3 µmol quanta·m-2
·s-1
), 76 genes are
being up-regulated indicating potential relevance for the specific adaptation to low light
intensities.
General stress proteins. A group of 13 different up-regulated genes can be associated with
stress response. Proteins like the heat shock protein Hsp20 (Cphamn1_1706), chaperonine
GroEL (Cphamn1_0783) and molecular chaperone DnaK (Cphamn1_1707) have major impact
on refolding mature proteins unfolded by stress. These three genes do not show a very large
increase of transcripts with DnaK being 3.04-fold, Hsp20 2.63-fold and GroEL 1.72-fold up-
regulated. GroEL was shown to be slightly up regulated in cultures of Prochlorococcus marinus
MED4 cultivated at high light intensities (Pandhal et al., 2007). However the levels of these
transcripts remained high even after prolonged exposure to high light suggesting an importance
for cellular function maintenance and not only for stress response. The molecular chaperone
DnaK (Hsp70) requires ATP for refolding proteins (Glover and Lindquist, 1998) and Hsp20 a
small heat shock protein acts ATP-independent (Jakob and Buchner, 1994). Due to the genomic
neighborhood these two genes could be co-transcribed. Although their transcription is not highly
elevated, the accumulation of chaperones is of crucial importance for cellular function
maintenance. During low protein turnover misfolded proteins and modifications of proteins such
as carbonylation and illegitimate disulfite bond formation tend to accumulate (Nyström, 2004).
The availability of stress proteins which are refolding damaged proteins or initiate the proteolysis
are therefore of increased need. Other stress related genes are involved in DNA repair
mechanisms like the DNA mismatch endonuclease Vsr (Cphamn1_1412), which recognizes a
TG mismatched base pair, generated after spontaneous deamination of methylated cytosines, and
cleaves the phosphate backbone on the 5' side of the thymine (Tsutakawa et al., 1999). Also the
excinuclease ABC C subunit domain-containing protein (Cphamn1_1984) and two
uncharacterized CRISPR-associated proteins (Cphamn1_2160, Cphamn1_2334) are predicted to
be involved in DNA repair. The gene coding for purine nucleoside phosphorylase
(Cphamn1_1782) is also being up-regulated, which helps in the need for recovery of bases and
Discussion
- 91 -
nucleosides from degraded RNA and DNA. All these proteins with their ability to prolong
protein functionality or protect against damages are therefore directly involved in the
conservation of maintenance energy.
Transcriptional regulators. These proteins play a major role in modulating gene expression
and thus reacting to environmental changes. For the tradeoff between proliferation and
maintenance the sigma factor σS is thought to be the main regulator (Nystrom, 2003). A gene
coding for this regulator could not be found in the genomic sequence of Chl. phaeobacteroides
BS1. Nevertheless 4 different transcriptional regulators are found to be up-regulated under low
light condition. Two genes coding for sigma-24 regulators (Cphamn1_1095, Cphamn1_1366) are
believed to belong to the ECF subfamily involved in the response to extracytoplasmatic stimuli.
These alternative sigma factors were found to be transcribed constitutively in E. coli during
active growth and during starvation or the stationary phase (Sharma and Chatterji, 2010). Even if
not belonging to the essential housekeeping sigma factors in E. coli, the inactivation of the σ24
resulted in loss of viability (De Las Peñas et al., 1997). The up-regulation of σ24
in E. coli
coincided with the entry into stationary phase pinpointing the important role this sigma factor
plays during this phase (Costanzo and Ades, 2006). The transcription of σ24
is regulated by the
protein DskA and the small molecule (p)ppGpp, which represents the general signal for
starvation stress. In the BS1 transcriptome no up-regulation of the transcriptional regulator
TraR/DskA family (Cphman1_1886) could be detected under low light intensities. Another
regulator found to be up-regulated belongs to the MarR family (Cphamn1_1673) which are often
involved in the development of antibiotic resistance and oxidative stress agents (Alekshun and
Levy, 1999). The fourth gene codes for a putative anti-sigma regulatory factor, serine-protein
kinase (Cphamn1_1139) which in Bacillus subtilis controls the general stress regulon and is
activated by cell stresses such as stationary phase and heat shock (Voelker et al., 1996). The
most up-regulated factor in E. coli during starvation was σ38
which like σS
is absent in the
genomic sequence of Chl. phaeobacteroides BS1. Future experiments with cultures of BS1
grown at lower light intensities could bring more insight on transcriptional regulation under
adverse conditions.
Energy production. A group of genes involved in energy production and conversion were
found to be up-regulated under low light condition. The cytochrome B561 coding gene
(Cphamn1_2425) is closely related to the phsC thiosulfate reductase cytochrome b subunit. In

Discussion
- 92 -
Salmonella typhimurium thiosulfate reductase is involved in the production of hydrogen sulfate
from thiosulfate and is encoded by the phs-operon (Heinzinger et al., 1995). In seven other
genomes from bacteria belonging to the Chlorobi group and also various other sulfate-reducing
and some iron-oxidizing bacteria, a phsC homologous cytochrome B561 is present but two other
genes phsA and phsB of the phs-operon are missing or have not been identified based on
sequence comparisons. Instead all these bacteria have an uncharacterized cytochrome c family
protein coding gene clustering with the putative cytochrome B561 coding gene. This new genetic
environment therefore leads to the assumption of a different function as predicted for this
cytochrome B561. Cytochrome c from BS1 (Cphamn1_2426) has eight heme binding CxxCH
groups like the hydroxylamine oxidoreductase of Nitrosomonas europaea (Bertini et al., 2006) or
a octa-heme cytochrome c3 believed to be involved in thiosulfate reduction in Desulfovibrio
gigas (Sieker et al., 1986). Interestingly in both Chl. vibrioforme and Pelodictyon luteolum the
two up-regulated cytochrome genes group with a gene coding for a hppA membrane bound
proton translocating pyrophosphatase. This gene (Cphamn1_1101) was also found to be also
upregulated under low light conditions in Chl. phaeobacteroides BS1 thus raising the question of
a probable transcriptional co-regulation and the functional relation of these three genes.
Membrane bound proton-translocating pyrophosphatases (H+-PPase) couple inorganic phosphate
PPi energy with an electrochemical proton gradient across biological membranes (Serrano et al.,
2007). In Rhodospirillum rubrum H+-PPase appears to be transcriptionally induced in response
to a variety of conditions that constrain cell bioenergetics (López-Marqués et al., 2004). The
characterization of a Rhodospirillum rubrum H+-PPase mutant strain revealed the importance of
its presence under low light conditions (García-Contreras et al., 2004). It has been shown that
this enzyme is essential for the up-keep of an H+ gradient at conditions where the photosynthetic
electron transport chain is not sufficient. It has been further hypothesized that under low energy
conditions PPi-dependent H+ gradient produced by H
+-PPase might become the main energy
source (Nyrén and Strid, 1991). Further experiments using BS1 cultures could therefore lead to
more insights in an possible implication of these interesting genes in the energetic production
and conversion system of this green sulfur bacterium.
Other up-regulated genes. Despite the up-regulation of nitrogenase related genes only in
high light, a gene coding for the dinitrogenase iron-molybdenum cofactor biosynthesis protein
(Cphamn1_1076) is being up-regulated unter low light conditions. Enzymes requiring an iron-
Discussion
- 93 -
molybdenum cofactor can also be found in the sulfur metabolism, opening the possibility that
this detected gene is also involved in other pathways than nitrogen fixation. Another isolated hit
was a gene coding for the polysulphide reductase NrfD (Cphamn1_1865), but as the other 6
genes of the previously described nrf operon (Hussain et al., 1994) are missing, the function of
this isolated gene remains inconclusive. Other genes code for enzymes like the phosphoserine
phosphatase SerB (Cphamn1_0341) involved in the biosynthesis of serine from carbohydrates, or
the phosphoenolpyruvate-protein phosphotransferase (Cphamn1_0363) which is involved in
carbohydrate transport. Nonetheless for most of the up-regulated genes no functional description
could be found because of the classification as coding for hypothetical proteins. Through this
experiment many of the genes belonging to this category could for the first time be linked to a
physiological condition. More than 70% (19 out of 27) genes were found to be unique to the
genome of Chl. phaeobacteroides BS1 when compared to the genomes of other bacteria
belonging to the Chlorobi phylum. When compared to all sequenced genomes available at the
IMG database 6 of these genes were found to be unique, altogether revealing possible new genes
involved in this unequaled low light adaptation.
But not only differentially transcribed genes could open a new perspective to this
physiological feature. Also constitutively expressed genes with high abundance in low light
conditions harbor interesting features. Besides genes involved in chlorosomes structure,
photosynthesis, ribosomal structure, transcriptional regulation and posttranslational
modifications, genes coding for hypothetical proteins represent with 20 out of the 50 most
transcribed genes a high percentage of these constitutively expressed genes. These hypothetical
proteins therefore need to be of major importance during cell development not only under low
light conditions. The usage of Chl. phaeobacteroides BS1 as a model organism has the potential
of unraveling some of these poorly described features of bacterial genomes.
Discussion
- 94 -
Distribution of Chlorobiaceae in different chemoclines and their molecular markers in
marine sediments
The Black Sea represents a unique marine habitat and its deep situated chemocline resembles an
extreme low light habitat where Chl. phaeobacteroides BS1 is the only photosynthetic
bacterium. Although they are not situated as deep, in some lacustrine environments chemoclines
with low light conditions are also present due to higher absorption in the photic zone above it.
While brown coloured, BChl e containing Chlorobiaceae are more adapted to low light, the
occurrence of such bacterial strains in habitats similar to the Black Sea was therefore
investigated.
Chlorobiacea in Sakinaw Lake. In the chemocline of the meromictic fresh water fjord Lake
Sakinaw, BChl e was detected previously (T. Beatty, unpublished data) and light intensity
measurements indicated that low light conditions prevailed at these depths. Isolated 16S rRNA
nucleotide sequences indicate that the bacterium thriving at these depths is most related to Chl.
clathratiforme BU-1 (A Köhler, unpublished data). Since the concentration of photosynthetic
pigments found in green sulfur bacteria is maintained constant and at a maximum during light
limited growth (Montesinos et al., 1983), BChl e can serve as an indicator of green sulfur
bacterial biomass. The patterns of BChl e measured on two consecutive years indicate the
prevalence of a stable GSB population in the chemocline. The pigment distributions are
relatively similar although the highest amount measured in 2009 was 2m above the
corresponding depth in 2008. This difference of the peak amounts of BChl e may also reflect
different positions of the chemocline or different underwater light penetration occurring at the
time of sampling.
While the determination of biomass distribution clearly identifies the depth where this
bacterium mostly occurrs in the chemocline, no conclusions can be made upon the activity
pattern. The concentration of the internal transcribed spacer (ITS)-RNA has previously been
shown to reflect the activity of bacterial cells (Schmid et al., 2001). The occurrence of active
GSB in depths above 33 m is limited by higher O2 levels in the layers above the chemocline.
During sampling in May 2008 measured O2 concentrations dropped from 2 ml l-1
at 32 m to
0.1 ml l-1
at 33 m (Beatty T. and Gies E., personal communication). The activity patterns
measured for the 2009 samples correlate with light intensities showing high activity in regions
Discussion
- 95 -
with the highest light intensity reaching the chemocline. Although BChl e concentrations at 33 m
are much lower than at depths below, cells thriving at this level are more active due to increased
amount of available energy. Below this active layer light limitation occurs which is reflected in
the light intensity measurements performed in 2008, where light intensity dropped dramatically
from 0.029 µmol quanta m-2
s-1
at 36 m to 0.0002 µmol quanta m-2
s-1
at 38 m. This correlates
with peak BChl e amounts detected around 37 m, and also shows how cells thriving at these
depth try to adapt to the low light through accumulation of additional pigments. Nevertheless this
increased light limitation leads to a dramatically decreased activity below 36 m depth despite of
this high accumulation of photosynthetic pigments. The detection of low amounts of ITS
transcripts in depths were almost no pigments were detectable could be due to the different
sensitivity of the used methods.
Therefore, this Chlorobium strain represents another low light adapted bacterium thriving in
the chemocline of Lake Sakinaw. The light intensities reaching the active layer of this bacterium
were 0.05 µmol quanta m-2
s-1
, which is similar to light intensities in the Black Sea chemocline.
Chlorobiaceae in Faro Lake. In contrast to the chemoclines of Lake Sakinaw and the Black
Sea, Lake Faro harbours a chemocline at the lesser depth around 15m. Pigment measurements
indicated the presence of BChl e containing geranyl ester homologs (A Sacca, unpublished data)
which were identified also in the GSB strain Chl. phaeobacteroides BS1 present in the Black Sea
(Manske et al., 2005). GSB specific 16S rRNA PCR amplification and DGGE revealed the
presence of three distinct Chlorobi strains in the chemocline of Lake Faro. One of them was
identified as Chl. phaeobacteroides BS1, showing 100% identity in the 16S rRNA gene region.
These strains were shown to persist over a longer period of time with slight shifts of distribution
during the sampling period. While Chl. phaeovibroides DSM 265 dominates in samples taken in
May, Chl. phaeobacteroides BS1 is more abundant in samples taken July. Although the strain
Chl. phaeobacteroides BS1 was shown to be perfectly adapted to low light conditions in the
Black Sea, no correlation of its abundance with increasing depth in the chemocline of Lake Faro
can be observed. Eventual light intensity measurements, and an isolate of the observed strain
could give more insight on the distribution pattern observed. The availability of a second habitat
where this bacterial strain is present opens also the possibility to observe its adaptational
versatility and also the impact of competition from other Chlorobi strains.

Discussion
- 96 -
Distribution of GSB molecular markers in sediments. The pigment isorenieratene and his
degradation products have previously been used as an indicator of past water column anoxia
(Passier et al., 1999; Menzel et al., 2002). This correlation has been made on the assumption that
isorenieratene is a molecular marker for green sulfur bacteria, which thrive in an anoxic photic
environment. But carotenoids show a limited diversity which cannot provide a differentiation
between GSB representants displaying contrasting physiology and ecology. Previous
investigations have shed some doubts on this assumption, showing that isorenieratene could also
have originated from allochthonous sources (Coolen and Overmann, 2007). Using fossil DNA as
molecular marker, a higher diversity of GSB sequences present in the sapropel layers has been
identified, including mostly typical freshwater or brackish water species. Additionally, traces of
isorenieratene were identified in intermediate layers and in samples from the sediment surface,
but amounts were too low to enable firm interpretation.
In order to reconfirm these findings, several samples from the Mediterranean Sea were
investigated for their isorenieratene content. For this task a more sensitive method was chosen,
using mass spectrometry with a narrow mass range of 528.0-532.0 followed by two events of
collision induced dissociation, in order to exclusively identify isorenieratene amounts. Sediment
samples from the sapropel S1 (8.000 years old) and one sample from sapropel S4 (124.000 years
old) originate from stations spread around the Aegean Sea, East Mediterranean Basin and the
Marmara Sea. All these old samples show amounts of isorenieratene ranging from 343.2-63.7 ng
per g sediment. Lower but still relevant amounts of isorenieratene were identified samples from
the top layers (Z0) of sediments. These represent recently deposited sediments and the presence
of an extended water anoxia reaching to the photic zone can definitely be excluded in this case.
This finding reconfirms the assumption that deposited isorenieratene can originate from
allochthonous sources and shows the importance of the usage of fossil DNA markers when this
option is available.
The fossil DNA isolated from these samples was also investigated for the content of BS1
sequences. Sequences identical to BS1 sequences were detected in the upper sediment layers of
the Black Sea. But in the Black Sea samples, where it can certainly be assumed that BS1 is the
only green sulfur bacterium present in the chemocline (Manske et al., 2005), no correlation
between isorenieratene and DNA amounts can be observed. Samples from the Mediterranean Sea
S1 sapropel, which was deposited at approximatively at the same time when the inflow of
Discussion
- 97 -
Mediterranean water via the Bosporus has started to happen (Degens and Ross, 1972), also bear
sequences identical to BS1 genomic ITS sequence. It can be therefore be assumed that the green
sulfur bacteria present now in the chemocline of the Black Sea represent direct descendants of
the Mediterranean BS1 population. The fact that BS1 could also be detected in the S5 sapropel,
which is 172,000 years old, shows the persistency of this green sulfur bacterium in the
Mediterranean Basin.
The ITS sequences similar to BS1 retrieved from sapropel layers below the Mediterranean
Sea show minimal divergence by bearing only 1 altered base (two clones from station 599-S1) or
2 altered bases in the older sapropel S5 (567-S5). The investigation of the chemocline of Lake
Faro situated on Sicily near the Strait of Messina revealed the presence of 3 distinct Chlorobi
strains. One of these strains was identified as bearing identical 16S rDNA sequence as Chl.
phaeobacteroides BS1, with differences only in the ITS region. Five investigated clones were
bearing 3 transitional mutations with one clone with additional 2 transitional changes in the ITS
region, which were all different from the changes occurring in the fossil sequences from the
Mediterranean sapropels. This imposes that the BS1 strain present in Mediterranean Sea at the
deposition time of these sapropels shows closer relationship to present BS1 cultures from the
Black Sea. Therefore the BS1 strain found in Lake Faro represents a lineage which was
geographically isolated much earlier from the Black Sea lineage, as the time of the sapropel
deposition 172.000 years ago.
Nonetheless, the question arises how this strictly anaerobic photosynthetic bacterium can
survive and overcome periods during which no anoxic water body reaches the photic zone, case
which can be assumed for periods between sapropel deposition. The identification of Chl.
phaeobacteroides BS1 strain in the chemocline of Lake Faro, Sicily offers a simple and
interesting theory. This lake, which is located near and connected to the Strait of Messina
represents a niche where anaerobic bacteria thrive when conditions do not allow survival in the
open sea water body. From such niches recolonization easily can occur when conditions with
extended water body anoxia reaching the photic zone are reestablished. Considering the long
lasting occurrence and distribution of Chl. phaeobacteroides BS1 throughout various
investigated regions, predisposes this bacterium and its fossil DNA markers as suitable aid for
the reconstruction of the paleoceanography in the Mediterranean Sea Basin.
Discussion
- 98 -
Conclusions
Different aspects of adaptation towards the availability and quality of light were successfully
revealed during the course of this study. These two aspects were assessed through the analysis of
newly isolated bacterial strains, which showed physiological adaptation towards long
wavelengths of light and low light intensities. In order to gain additional information from
possible similar adaptations of other bacterial strains, natural samples originating from different
suitable locations were also successfully investigated.
The unusual absorption patterns found in several Gammaproteobacteria containing BChl a
was examined through sequencing of pufBA genes coding for the light harvesting antenna
proteins. This comparison of pufBA sequences revealed a monophyletic origin of the LHC1
polypeptides present in the bacterial species strain 970, Thr. winogradskyi and Tch. tepidum. For
the first time it could be shown, how a gradual accumulation of amino acid substitutions is
leading to an increasing red-shifted Qy absorption. The availability of such newly isolated strains
enables a more profound investigation of previously described features which were believed to
be responsible for its altered absorption spectrum. Nevertheless site directed mutagenesis
remains a powerful method for testing these substitutions and will certainly help understand how
these single features contribute to the changes in the absorption properties. Although 3D
modeling is very helpful for the visualization of pigment protein interaction, the lack of crystal
structures of LH1 polypeptides originating from Gammaproteobacteria hampers a precise
comparison. The assembled sequences revealed also that strain 970 harbors a new puf operon
architecture but transcriptional analysis showed that the second copy of pufBA has no further
implications on the absorption pattern. Additionally, the search for new pufLM sequences in the
diverse habitats of Little Sippewissett Saltmarsh did not yield novel close relatives of strain 970,
indicating that the adaptation to the 900-1000 nm wavelength region, be it by lateral gene
transfer or independent evolution of one lineage, may have occurred only rarely during the
evolution of benthic Chromatiaceae.
The more complex physiological aspects of adaptation towards low light availability were
assessed using three habitats where such conditions were identified. Available enrichment
cultures and complete genetic information from the extremely low light adapted bacterium Chl.
Discussion
- 99 -
phaeobacteroides BS1 facilitated whole transcriptome sequencing. The comparison of transcripts
present at two different light conditions revealed multiple genes with possible implications in the
low light adaptation. Furthermore the organization of multiple genes in operons and other co-
regulated genes which are regulated by photosynthetic activity represents another novel
information which could be retrieved from such data. The regulation of high energy demanding
metabolic pathways and of multiple gene copies enables an insight in the management of
transcripts in order to lower the maintenance energy. Although the implication of some poorly
characterized genes remains unclear some up-regulated genes reveal interesting findings. The
identification of genes with implication in the upkeep of an H+ gradient at conditions where the
photosynthetic electron transport chain is not sufficient together offer interesting candidates for
future investigations. Also the regulation of several stress proteins, which are crucial for
prolonged protein functionality under conditions of low protein turnover represent potential
candidates with implications in the poorly understood stress regulon during conditions of energy
conservation. Together with in silico subtractive hybridization, transcriptome analysis led to the
identification of multiple hypothetical proteins with possible implications for the adaptation
towards low light conditions. These uncharacterized proteins showed high abundance of
transcripts under both investigated conditions emphasizing their constitutive expression. In
general, the transcriptome retrieved from low light grown cultures, which resembles the in situ
conditions in the Black Sea chemocline, still contains transcripts of a majority of the predicted
2524 ORFs. Nonetheless, among most actively regulated transcripts many are coding for
hypothetical proteins, some of them even being unique to the genome of Chl. phaeobacteroides
BS1. This study therefore identified several interesting targets for future investigations of such
poorly described genomic regions.
The investigation of green sulfur bacterial strains in the chemoclines from Lake Sakinaw and
Faro revealed the versatility of adaptation in this group. Part of this versatility is based on the
advantage that chlorosomes can accumulate pigments without a higher demand for proteins,
which allow these bacteria to thrive at such low light intensities. The identification of a strain
closely related to Chl. clathratiforme BU-1 also shows that adaptation to very low light
intensities is not restricted only to Chl. phaeobacteroides BS1. Nonetheless, this bacterium
represents the best described low adapted strain so far, and the comparison with this newly
identified strain with similar adaptations but different location will help elucidate how Chlorobi
Discussion
- 100 -
strains can thrive under such conditions. In contrast to the chemoclines in the Black Sea and
Lake Sakinaw where only one photosynthetic species is present, three species belonging to the
GSB were found to coexist in Lake Faro. The identified close relationship between the two
strains of BS1 present in these two locations where different conditions prevail opens new
opportunities for the investigation of this unmatched adaptation to low light intensities.
Additionally, the distribution of molecular markers found in sediments from the Eastern
Mediterranean Sea and the Black Sea demonstrate the persistency of Chl. phaeobacteroides BS1
in this region. The usage of DNA as a molecular marker was shown to have clear advantages
over pigment analysis because of its higher diversity. Phylogenetic analysis of retrieved fossil
DNA enabled firm interpretation of the relationship and the distribution of the green sulfur
bacteria in past anoxic water environments. The great potential in the usage of Chl.
phaeobacteroides BS1 as model organism has therefore again been demonstrated, and future
studies including the newly described habitats can elucidate even more molecular determinants
of the adaptation of anoxygenic phototrophic bacteria to different light conditions.
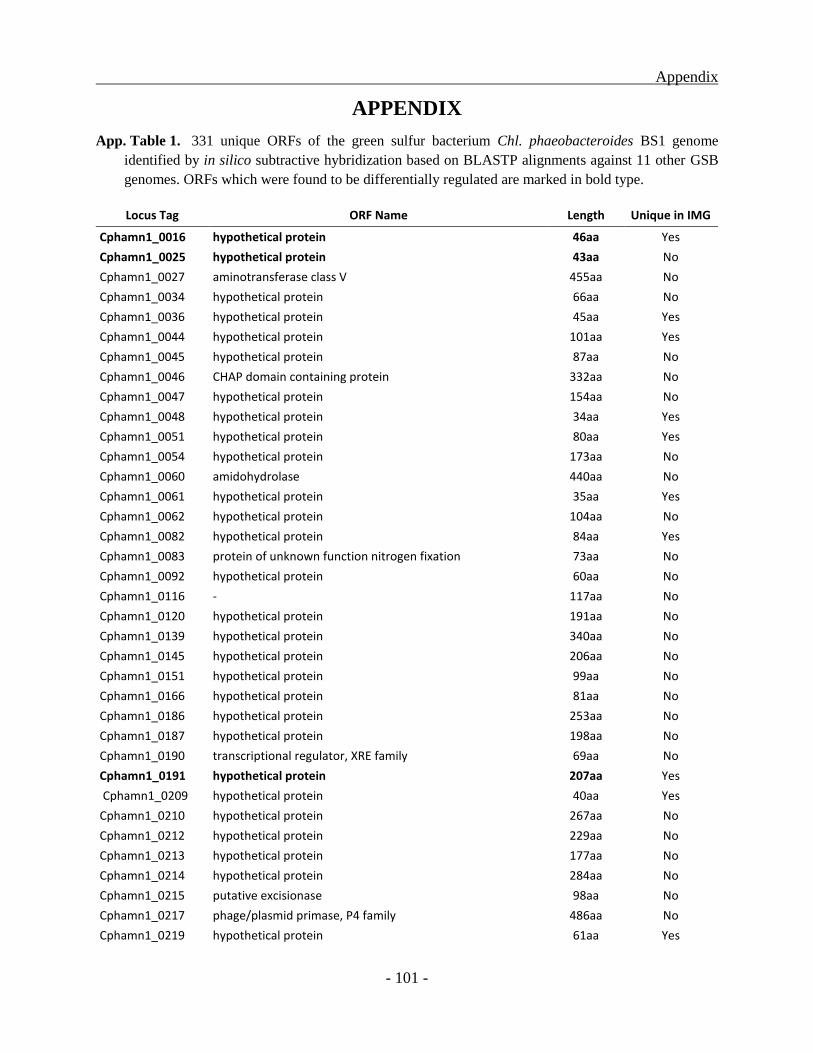
Appendix
- 101 -
APPENDIX
App. Table 1. 331 unique ORFs of the green sulfur bacterium Chl. phaeobacteroides BS1 genome
identified by in silico subtractive hybridization based on BLASTP alignments against 11 other GSB
genomes. ORFs which were found to be differentially regulated are marked in bold type.
Locus Tag ORF Name Length Unique in IMG
Cphamn1_0016 hypothetical protein 46aa Yes
Cphamn1_0025 hypothetical protein 43aa No
Cphamn1_0027 aminotransferase class V 455aa No
Cphamn1_0034 hypothetical protein 66aa No
Cphamn1_0036 hypothetical protein 45aa Yes
Cphamn1_0044 hypothetical protein 101aa Yes
Cphamn1_0045 hypothetical protein 87aa No
Cphamn1_0046 CHAP domain containing protein 332aa No
Cphamn1_0047 hypothetical protein 154aa No
Cphamn1_0048 hypothetical protein 34aa Yes
Cphamn1_0051 hypothetical protein 80aa Yes
Cphamn1_0054 hypothetical protein 173aa No
Cphamn1_0060 amidohydrolase 440aa No
Cphamn1_0061 hypothetical protein 35aa Yes
Cphamn1_0062 hypothetical protein 104aa No
Cphamn1_0082 hypothetical protein 84aa Yes
Cphamn1_0083 protein of unknown function nitrogen fixation 73aa No
Cphamn1_0092 hypothetical protein 60aa No
Cphamn1_0116 - 117aa No
Cphamn1_0120 hypothetical protein 191aa No
Cphamn1_0139 hypothetical protein 340aa No
Cphamn1_0145 hypothetical protein 206aa No
Cphamn1_0151 hypothetical protein 99aa No
Cphamn1_0166 hypothetical protein 81aa No
Cphamn1_0186 hypothetical protein 253aa No
Cphamn1_0187 hypothetical protein 198aa No
Cphamn1_0190 transcriptional regulator, XRE family 69aa No
Cphamn1_0191 hypothetical protein 207aa Yes
Cphamn1_0209 hypothetical protein 40aa Yes
Cphamn1_0210 hypothetical protein 267aa No
Cphamn1_0212 hypothetical protein 229aa No
Cphamn1_0213 hypothetical protein 177aa No
Cphamn1_0214 hypothetical protein 284aa No
Cphamn1_0215 putative excisionase 98aa No
Cphamn1_0217 phage/plasmid primase, P4 family 486aa No
Cphamn1_0219 hypothetical protein 61aa Yes

Appendix
- 102 -
Locus Tag ORF Name Length Unique in IMG
Cphamn1_0220 phage terminase, small subunit, P27 family
166aa No
Cphamn1_0221 hypothetical protein 34aa Yes
Cphamn1_0223 hypothetical protein 61aa No
Cphamn1_0227 hypothetical protein 154aa No
Cphamn1_0231 hypothetical protein 67aa No
Cphamn1_0232 PilT protein domain protein 135aa No
Cphamn1_0234 hypothetical protein 113aa No
Cphamn1_0235 hypothetical protein 50aa Yes
Cphamn1_0243 hypothetical protein 62aa No
Cphamn1_0244 DNA polymerase beta domain protein region 131aa No
Cphamn1_0245 protein of unknown function DUF86 141aa No
Cphamn1_0335 hypothetical protein 591aa No
Cphamn1_0336 Piwi domain protein 474aa No
Cphamn1_0370 lipopolysaccharide biosynthesis protein 334aa No
Cphamn1_0374 hypothetical protein 209aa No
Cphamn1_0375 glycosyl transferase group 1 383aa No
Cphamn1_0376 hypothetical protein 119aa No
Cphamn1_0379 hypothetical protein 179aa No
Cphamn1_0382 hypothetical protein 459aa No
Cphamn1_0385 NAD-dependent epimerase/dehydratase 677aa No
Cphamn1_0394 hypothetical protein 49aa No
Cphamn1_0399 hypothetical protein 70aa No
Cphamn1_0425 hypothetical protein 83aa Yes
Cphamn1_0450 hypothetical protein 39aa Yes
Cphamn1_0468 hypothetical protein 75aa Yes
Cphamn1_0471 NADH dehydrogenase subunit E (EC 1.6.5.3) (IMGterm) 195aa No
Cphamn1_0482 hypothetical protein 87aa No
Cphamn1_0483 - 112aa No
Cphamn1_0486 hypothetical protein 50aa Yes
Cphamn1_0491 hypothetical protein 40aa Yes
Cphamn1_0494 transposase, IS5 family, putative 498aa No
Cphamn1_0522 hypothetical protein 74aa Yes
Cphamn1_0526 hypothetical protein 261aa No
Cphamn1_0555 protein of unknown function DUF81 408aa No
Cphamn1_0556 conserved hypothetical cytosolic protein 88aa No
Cphamn1_0557 transcriptional regulator, XRE family 89aa No
Cphamn1_0561 hypothetical protein 44aa No
Cphamn1_0563 hypothetical protein 230aa No
Cphamn1_0564 hypothetical protein 58aa No
Cphamn1_0575 hypothetical protein 52aa Yes
Cphamn1_0613 Protein of unknown function DUF1810 168aa No
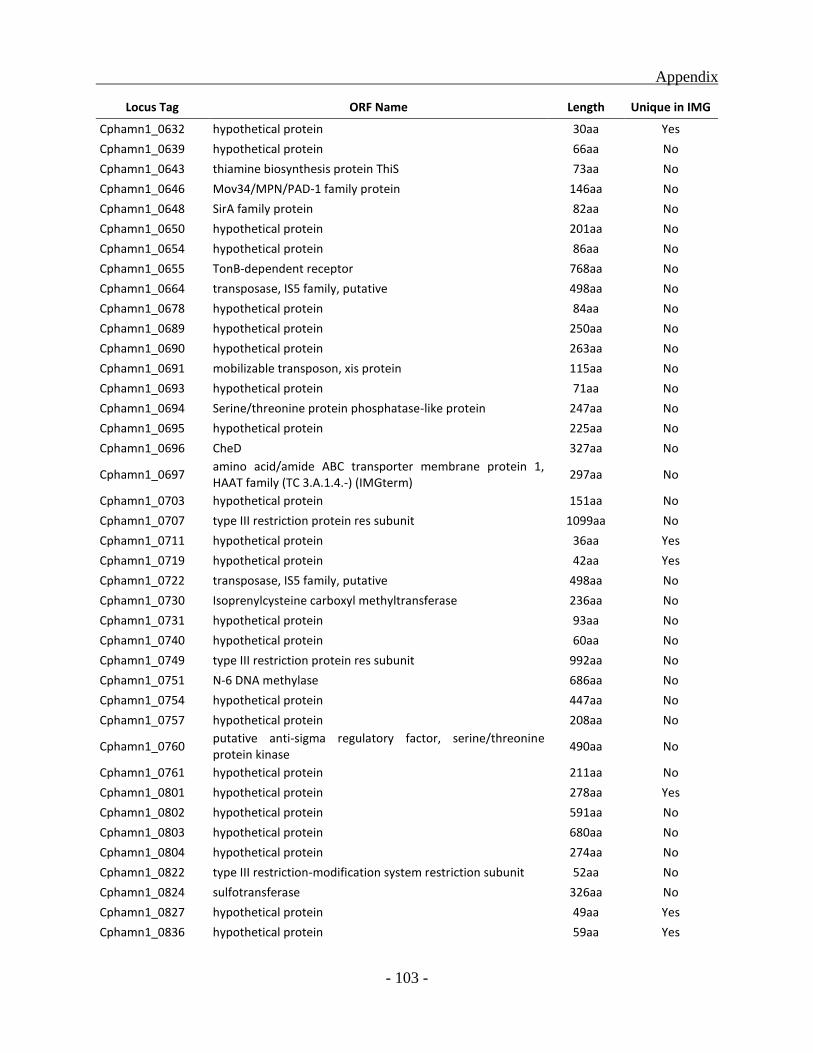
Appendix
- 103 -
Locus Tag ORF Name Length Unique in IMG
Cphamn1_0632 hypothetical protein 30aa Yes
Cphamn1_0639 hypothetical protein 66aa No
Cphamn1_0643 thiamine biosynthesis protein ThiS 73aa No
Cphamn1_0646 Mov34/MPN/PAD-1 family protein 146aa No
Cphamn1_0648 SirA family protein 82aa No
Cphamn1_0650 hypothetical protein 201aa No
Cphamn1_0654 hypothetical protein 86aa No
Cphamn1_0655 TonB-dependent receptor 768aa No
Cphamn1_0664 transposase, IS5 family, putative 498aa No
Cphamn1_0678 hypothetical protein 84aa No
Cphamn1_0689 hypothetical protein 250aa No
Cphamn1_0690 hypothetical protein 263aa No
Cphamn1_0691 mobilizable transposon, xis protein 115aa No
Cphamn1_0693 hypothetical protein 71aa No
Cphamn1_0694 Serine/threonine protein phosphatase-like protein 247aa No
Cphamn1_0695 hypothetical protein 225aa No
Cphamn1_0696 CheD 327aa No
Cphamn1_0697 amino acid/amide ABC transporter membrane protein 1, HAAT family (TC 3.A.1.4.-) (IMGterm)
297aa No
Cphamn1_0703 hypothetical protein 151aa No
Cphamn1_0707 type III restriction protein res subunit 1099aa No
Cphamn1_0711 hypothetical protein 36aa Yes
Cphamn1_0719 hypothetical protein 42aa Yes
Cphamn1_0722 transposase, IS5 family, putative 498aa No
Cphamn1_0730 Isoprenylcysteine carboxyl methyltransferase 236aa No
Cphamn1_0731 hypothetical protein 93aa No
Cphamn1_0740 hypothetical protein 60aa No
Cphamn1_0749 type III restriction protein res subunit 992aa No
Cphamn1_0751 N-6 DNA methylase 686aa No
Cphamn1_0754 hypothetical protein 447aa No
Cphamn1_0757 hypothetical protein 208aa No
Cphamn1_0760 putative anti-sigma regulatory factor, serine/threonine protein kinase
490aa No
Cphamn1_0761 hypothetical protein 211aa No
Cphamn1_0801 hypothetical protein 278aa Yes
Cphamn1_0802 hypothetical protein 591aa No
Cphamn1_0803 hypothetical protein 680aa No
Cphamn1_0804 hypothetical protein 274aa No
Cphamn1_0822 type III restriction-modification system restriction subunit 52aa No
Cphamn1_0824 sulfotransferase 326aa No
Cphamn1_0827 hypothetical protein 49aa Yes
Cphamn1_0836 hypothetical protein 59aa Yes
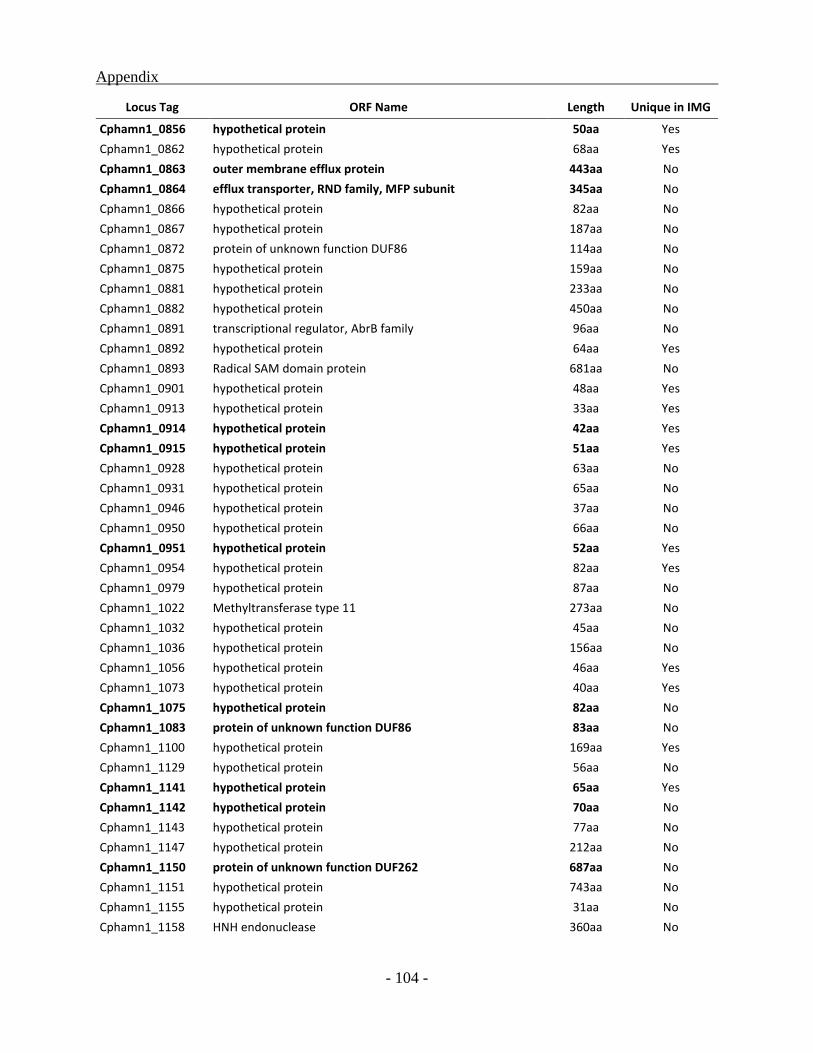
Appendix
- 104 -
Locus Tag ORF Name Length Unique in IMG
Cphamn1_0856 hypothetical protein 50aa Yes
Cphamn1_0862 hypothetical protein 68aa Yes
Cphamn1_0863 outer membrane efflux protein 443aa No
Cphamn1_0864 efflux transporter, RND family, MFP subunit 345aa No
Cphamn1_0866 hypothetical protein 82aa No
Cphamn1_0867 hypothetical protein 187aa No
Cphamn1_0872 protein of unknown function DUF86 114aa No
Cphamn1_0875 hypothetical protein 159aa No
Cphamn1_0881 hypothetical protein 233aa No
Cphamn1_0882 hypothetical protein 450aa No
Cphamn1_0891 transcriptional regulator, AbrB family 96aa No
Cphamn1_0892 hypothetical protein 64aa Yes
Cphamn1_0893 Radical SAM domain protein 681aa No
Cphamn1_0901 hypothetical protein 48aa Yes
Cphamn1_0913 hypothetical protein 33aa Yes
Cphamn1_0914 hypothetical protein 42aa Yes
Cphamn1_0915 hypothetical protein 51aa Yes
Cphamn1_0928 hypothetical protein 63aa No
Cphamn1_0931 hypothetical protein 65aa No
Cphamn1_0946 hypothetical protein 37aa No
Cphamn1_0950 hypothetical protein 66aa No
Cphamn1_0951 hypothetical protein 52aa Yes
Cphamn1_0954 hypothetical protein 82aa Yes
Cphamn1_0979 hypothetical protein 87aa No
Cphamn1_1022 Methyltransferase type 11 273aa No
Cphamn1_1032 hypothetical protein 45aa No
Cphamn1_1036 hypothetical protein 156aa No
Cphamn1_1056 hypothetical protein 46aa Yes
Cphamn1_1073 hypothetical protein 40aa Yes
Cphamn1_1075 hypothetical protein 82aa No
Cphamn1_1083 protein of unknown function DUF86 83aa No
Cphamn1_1100 hypothetical protein 169aa Yes
Cphamn1_1129 hypothetical protein 56aa No
Cphamn1_1141 hypothetical protein 65aa Yes
Cphamn1_1142 hypothetical protein 70aa No
Cphamn1_1143 hypothetical protein 77aa No
Cphamn1_1147 hypothetical protein 212aa No
Cphamn1_1150 protein of unknown function DUF262 687aa No
Cphamn1_1151 hypothetical protein 743aa No
Cphamn1_1155 hypothetical protein 31aa No
Cphamn1_1158 HNH endonuclease 360aa No
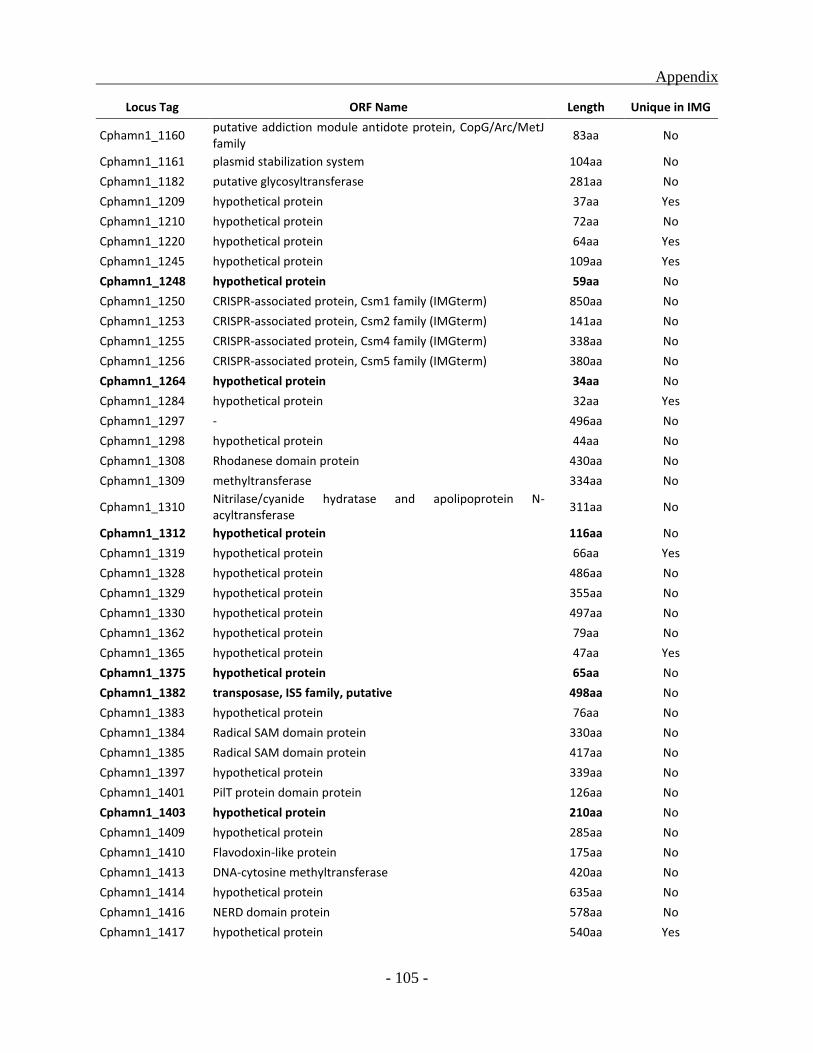
Appendix
- 105 -
Locus Tag ORF Name Length Unique in IMG
Cphamn1_1160 putative addiction module antidote protein, CopG/Arc/MetJ family
83aa No
Cphamn1_1161 plasmid stabilization system 104aa No
Cphamn1_1182 putative glycosyltransferase 281aa No
Cphamn1_1209 hypothetical protein 37aa Yes
Cphamn1_1210 hypothetical protein 72aa No
Cphamn1_1220 hypothetical protein 64aa Yes
Cphamn1_1245 hypothetical protein 109aa Yes
Cphamn1_1248 hypothetical protein 59aa No
Cphamn1_1250 CRISPR-associated protein, Csm1 family (IMGterm) 850aa No
Cphamn1_1253 CRISPR-associated protein, Csm2 family (IMGterm) 141aa No
Cphamn1_1255 CRISPR-associated protein, Csm4 family (IMGterm) 338aa No
Cphamn1_1256 CRISPR-associated protein, Csm5 family (IMGterm) 380aa No
Cphamn1_1264 hypothetical protein 34aa No
Cphamn1_1284 hypothetical protein 32aa Yes
Cphamn1_1297 - 496aa No
Cphamn1_1298 hypothetical protein 44aa No
Cphamn1_1308 Rhodanese domain protein 430aa No
Cphamn1_1309 methyltransferase 334aa No
Cphamn1_1310 Nitrilase/cyanide hydratase and apolipoprotein N-acyltransferase
311aa No
Cphamn1_1312 hypothetical protein 116aa No
Cphamn1_1319 hypothetical protein 66aa Yes
Cphamn1_1328 hypothetical protein 486aa No
Cphamn1_1329 hypothetical protein 355aa No
Cphamn1_1330 hypothetical protein 497aa No
Cphamn1_1362 hypothetical protein 79aa No
Cphamn1_1365 hypothetical protein 47aa Yes
Cphamn1_1375 hypothetical protein 65aa No
Cphamn1_1382 transposase, IS5 family, putative 498aa No
Cphamn1_1383 hypothetical protein 76aa No
Cphamn1_1384 Radical SAM domain protein 330aa No
Cphamn1_1385 Radical SAM domain protein 417aa No
Cphamn1_1397 hypothetical protein 339aa No
Cphamn1_1401 PilT protein domain protein 126aa No
Cphamn1_1403 hypothetical protein 210aa No
Cphamn1_1409 hypothetical protein 285aa No
Cphamn1_1410 Flavodoxin-like protein 175aa No
Cphamn1_1413 DNA-cytosine methyltransferase 420aa No
Cphamn1_1414 hypothetical protein 635aa No
Cphamn1_1416 NERD domain protein 578aa No
Cphamn1_1417 hypothetical protein 540aa Yes
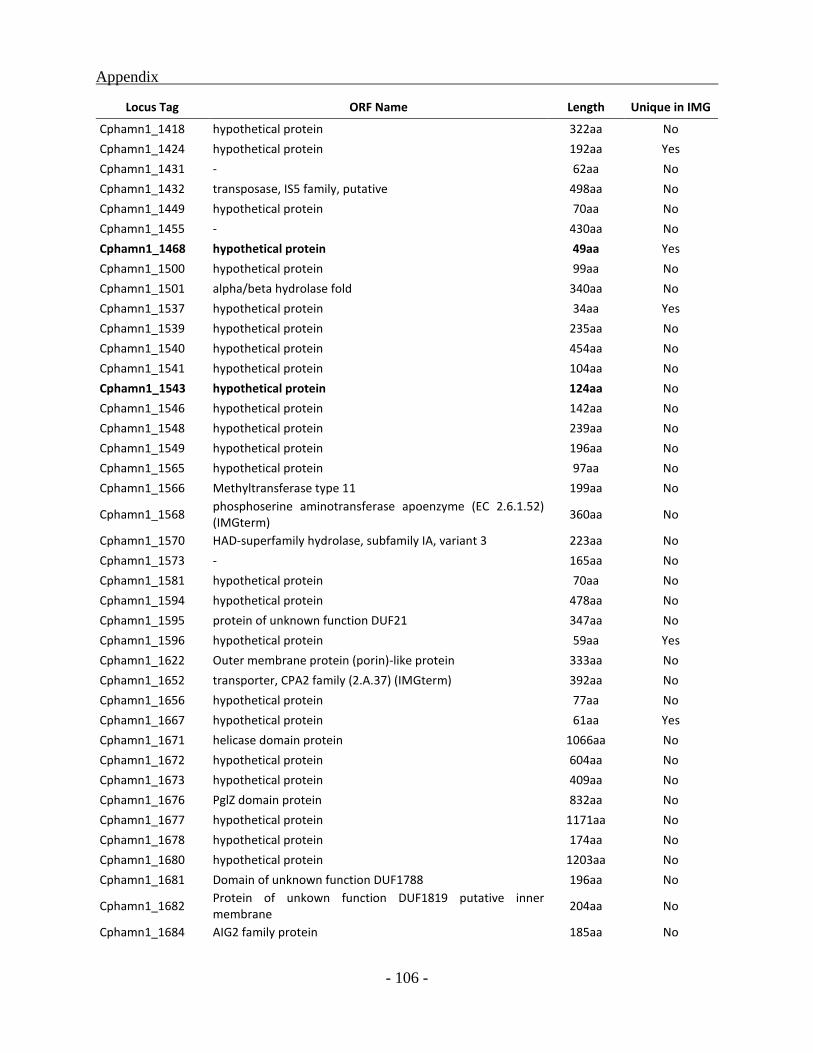
Appendix
- 106 -
Locus Tag ORF Name Length Unique in IMG
Cphamn1_1418 hypothetical protein 322aa No
Cphamn1_1424 hypothetical protein 192aa Yes
Cphamn1_1431 - 62aa No
Cphamn1_1432 transposase, IS5 family, putative 498aa No
Cphamn1_1449 hypothetical protein 70aa No
Cphamn1_1455 - 430aa No
Cphamn1_1468 hypothetical protein 49aa Yes
Cphamn1_1500 hypothetical protein 99aa No
Cphamn1_1501 alpha/beta hydrolase fold 340aa No
Cphamn1_1537 hypothetical protein 34aa Yes
Cphamn1_1539 hypothetical protein 235aa No
Cphamn1_1540 hypothetical protein 454aa No
Cphamn1_1541 hypothetical protein 104aa No
Cphamn1_1543 hypothetical protein 124aa No
Cphamn1_1546 hypothetical protein 142aa No
Cphamn1_1548 hypothetical protein 239aa No
Cphamn1_1549 hypothetical protein 196aa No
Cphamn1_1565 hypothetical protein 97aa No
Cphamn1_1566 Methyltransferase type 11 199aa No
Cphamn1_1568 phosphoserine aminotransferase apoenzyme (EC 2.6.1.52) (IMGterm)
360aa No
Cphamn1_1570 HAD-superfamily hydrolase, subfamily IA, variant 3 223aa No
Cphamn1_1573 - 165aa No
Cphamn1_1581 hypothetical protein 70aa No
Cphamn1_1594 hypothetical protein 478aa No
Cphamn1_1595 protein of unknown function DUF21 347aa No
Cphamn1_1596 hypothetical protein 59aa Yes
Cphamn1_1622 Outer membrane protein (porin)-like protein 333aa No
Cphamn1_1652 transporter, CPA2 family (2.A.37) (IMGterm) 392aa No
Cphamn1_1656 hypothetical protein 77aa No
Cphamn1_1667 hypothetical protein 61aa Yes
Cphamn1_1671 helicase domain protein 1066aa No
Cphamn1_1672 hypothetical protein 604aa No
Cphamn1_1673 hypothetical protein 409aa No
Cphamn1_1676 PglZ domain protein 832aa No
Cphamn1_1677 hypothetical protein 1171aa No
Cphamn1_1678 hypothetical protein 174aa No
Cphamn1_1680 hypothetical protein 1203aa No
Cphamn1_1681 Domain of unknown function DUF1788 196aa No
Cphamn1_1682 Protein of unkown function DUF1819 putative inner membrane
204aa No
Cphamn1_1684 AIG2 family protein 185aa No
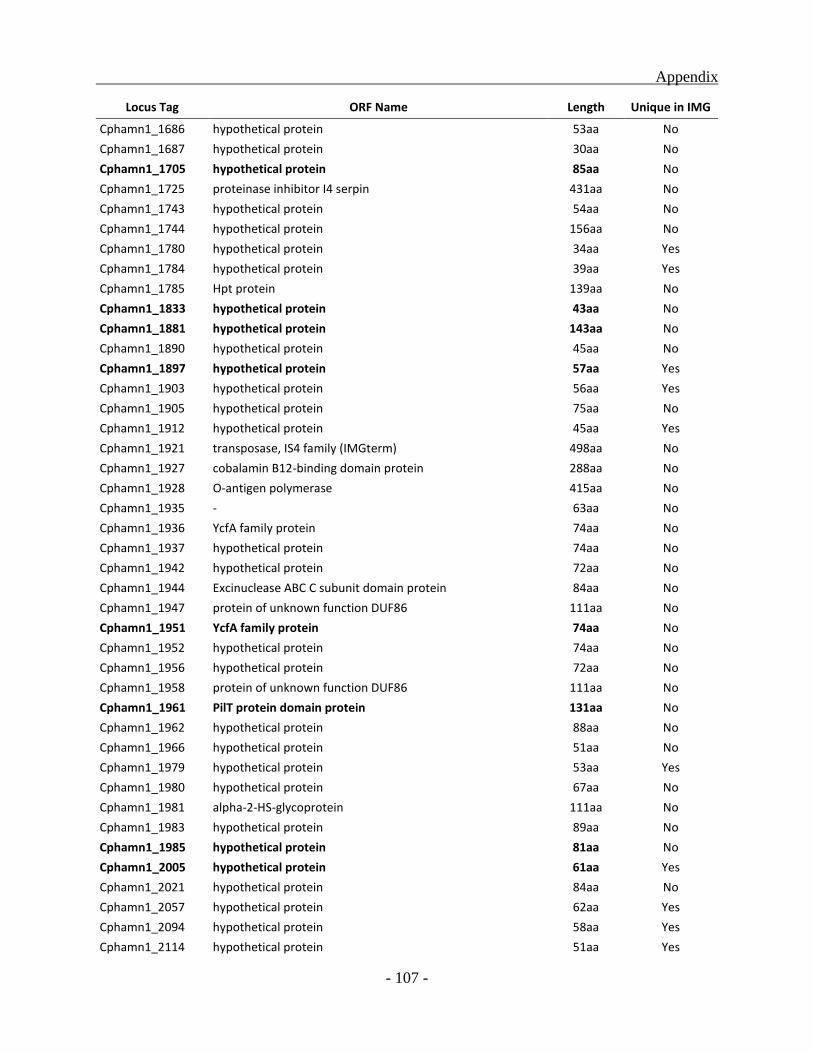
Appendix
- 107 -
Locus Tag ORF Name Length Unique in IMG
Cphamn1_1686 hypothetical protein 53aa No
Cphamn1_1687 hypothetical protein 30aa No
Cphamn1_1705 hypothetical protein 85aa No
Cphamn1_1725 proteinase inhibitor I4 serpin 431aa No
Cphamn1_1743 hypothetical protein 54aa No
Cphamn1_1744 hypothetical protein 156aa No
Cphamn1_1780 hypothetical protein 34aa Yes
Cphamn1_1784 hypothetical protein 39aa Yes
Cphamn1_1785 Hpt protein 139aa No
Cphamn1_1833 hypothetical protein 43aa No
Cphamn1_1881 hypothetical protein 143aa No
Cphamn1_1890 hypothetical protein 45aa No
Cphamn1_1897 hypothetical protein 57aa Yes
Cphamn1_1903 hypothetical protein 56aa Yes
Cphamn1_1905 hypothetical protein 75aa No
Cphamn1_1912 hypothetical protein 45aa Yes
Cphamn1_1921 transposase, IS4 family (IMGterm) 498aa No
Cphamn1_1927 cobalamin B12-binding domain protein 288aa No
Cphamn1_1928 O-antigen polymerase 415aa No
Cphamn1_1935 - 63aa No
Cphamn1_1936 YcfA family protein 74aa No
Cphamn1_1937 hypothetical protein 74aa No
Cphamn1_1942 hypothetical protein 72aa No
Cphamn1_1944 Excinuclease ABC C subunit domain protein 84aa No
Cphamn1_1947 protein of unknown function DUF86 111aa No
Cphamn1_1951 YcfA family protein 74aa No
Cphamn1_1952 hypothetical protein 74aa No
Cphamn1_1956 hypothetical protein 72aa No
Cphamn1_1958 protein of unknown function DUF86 111aa No
Cphamn1_1961 PilT protein domain protein 131aa No
Cphamn1_1962 hypothetical protein 88aa No
Cphamn1_1966 hypothetical protein 51aa No
Cphamn1_1979 hypothetical protein 53aa Yes
Cphamn1_1980 hypothetical protein 67aa No
Cphamn1_1981 alpha-2-HS-glycoprotein 111aa No
Cphamn1_1983 hypothetical protein 89aa No
Cphamn1_1985 hypothetical protein 81aa No
Cphamn1_2005 hypothetical protein 61aa Yes
Cphamn1_2021 hypothetical protein 84aa No
Cphamn1_2057 hypothetical protein 62aa Yes
Cphamn1_2094 hypothetical protein 58aa Yes
Cphamn1_2114 hypothetical protein 51aa Yes
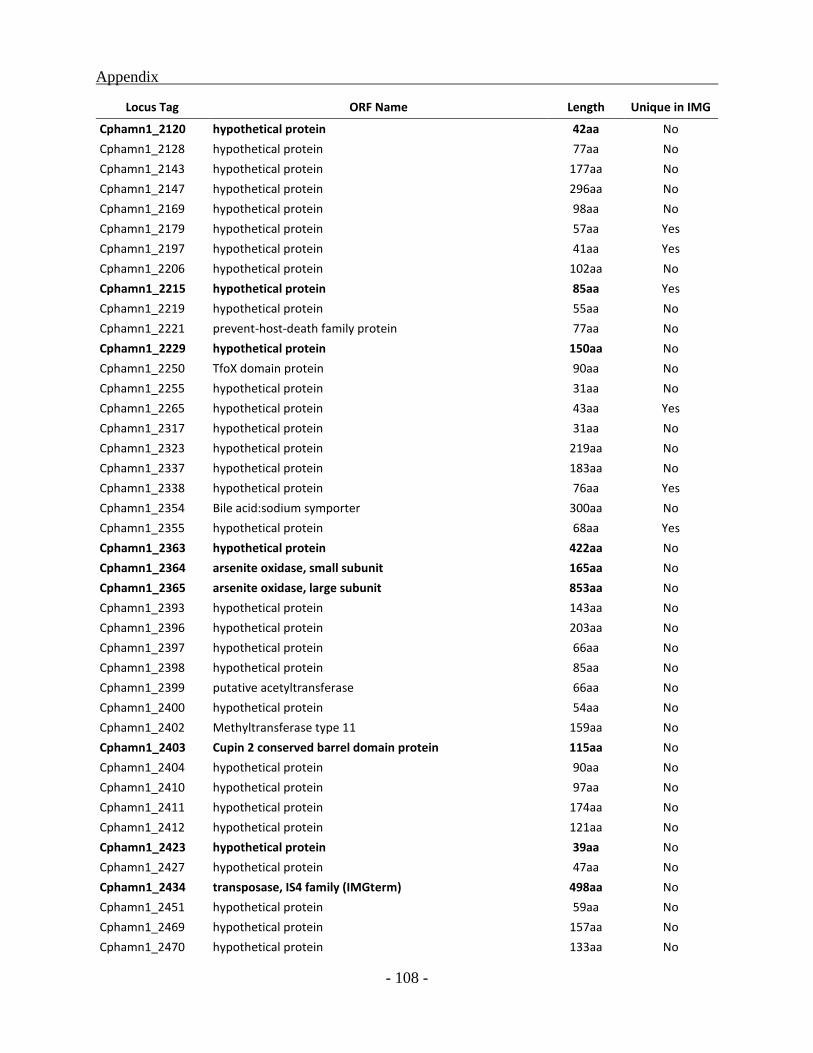
Appendix
- 108 -
Locus Tag ORF Name Length Unique in IMG
Cphamn1_2120 hypothetical protein 42aa No
Cphamn1_2128 hypothetical protein 77aa No
Cphamn1_2143 hypothetical protein 177aa No
Cphamn1_2147 hypothetical protein 296aa No
Cphamn1_2169 hypothetical protein 98aa No
Cphamn1_2179 hypothetical protein 57aa Yes
Cphamn1_2197 hypothetical protein 41aa Yes
Cphamn1_2206 hypothetical protein 102aa No
Cphamn1_2215 hypothetical protein 85aa Yes
Cphamn1_2219 hypothetical protein 55aa No
Cphamn1_2221 prevent-host-death family protein 77aa No
Cphamn1_2229 hypothetical protein 150aa No
Cphamn1_2250 TfoX domain protein 90aa No
Cphamn1_2255 hypothetical protein 31aa No
Cphamn1_2265 hypothetical protein 43aa Yes
Cphamn1_2317 hypothetical protein 31aa No
Cphamn1_2323 hypothetical protein 219aa No
Cphamn1_2337 hypothetical protein 183aa No
Cphamn1_2338 hypothetical protein 76aa Yes
Cphamn1_2354 Bile acid:sodium symporter 300aa No
Cphamn1_2355 hypothetical protein 68aa Yes
Cphamn1_2363 hypothetical protein 422aa No
Cphamn1_2364 arsenite oxidase, small subunit 165aa No
Cphamn1_2365 arsenite oxidase, large subunit 853aa No
Cphamn1_2393 hypothetical protein 143aa No
Cphamn1_2396 hypothetical protein 203aa No
Cphamn1_2397 hypothetical protein 66aa No
Cphamn1_2398 hypothetical protein 85aa No
Cphamn1_2399 putative acetyltransferase 66aa No
Cphamn1_2400 hypothetical protein 54aa No
Cphamn1_2402 Methyltransferase type 11 159aa No
Cphamn1_2403 Cupin 2 conserved barrel domain protein 115aa No
Cphamn1_2404 hypothetical protein 90aa No
Cphamn1_2410 hypothetical protein 97aa No
Cphamn1_2411 hypothetical protein 174aa No
Cphamn1_2412 hypothetical protein 121aa No
Cphamn1_2423 hypothetical protein 39aa No
Cphamn1_2427 hypothetical protein 47aa No
Cphamn1_2434 transposase, IS4 family (IMGterm) 498aa No
Cphamn1_2451 hypothetical protein 59aa No
Cphamn1_2469 hypothetical protein 157aa No
Cphamn1_2470 hypothetical protein 133aa No
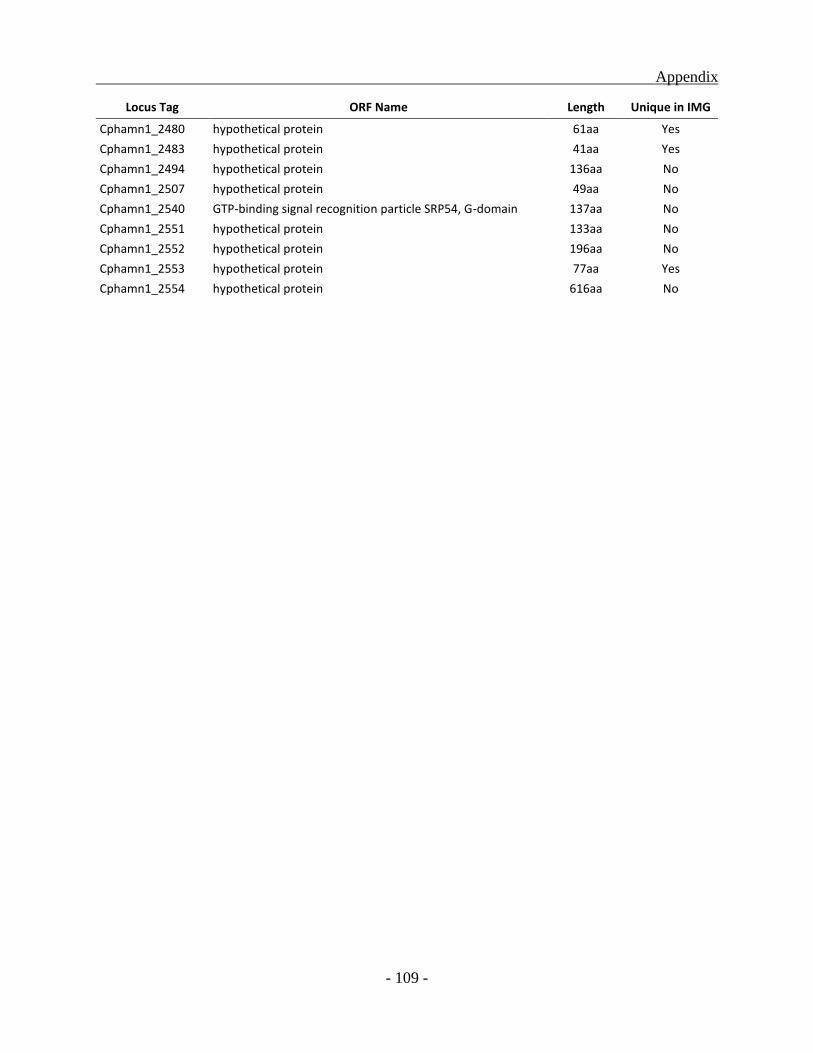
Appendix
- 109 -
Locus Tag ORF Name Length Unique in IMG
Cphamn1_2480 hypothetical protein 61aa Yes
Cphamn1_2483 hypothetical protein 41aa Yes
Cphamn1_2494 hypothetical protein 136aa No
Cphamn1_2507 hypothetical protein 49aa No
Cphamn1_2540 GTP-binding signal recognition particle SRP54, G-domain 137aa No
Cphamn1_2551 hypothetical protein 133aa No
Cphamn1_2552 hypothetical protein 196aa No
Cphamn1_2553 hypothetical protein 77aa Yes
Cphamn1_2554 hypothetical protein 616aa No
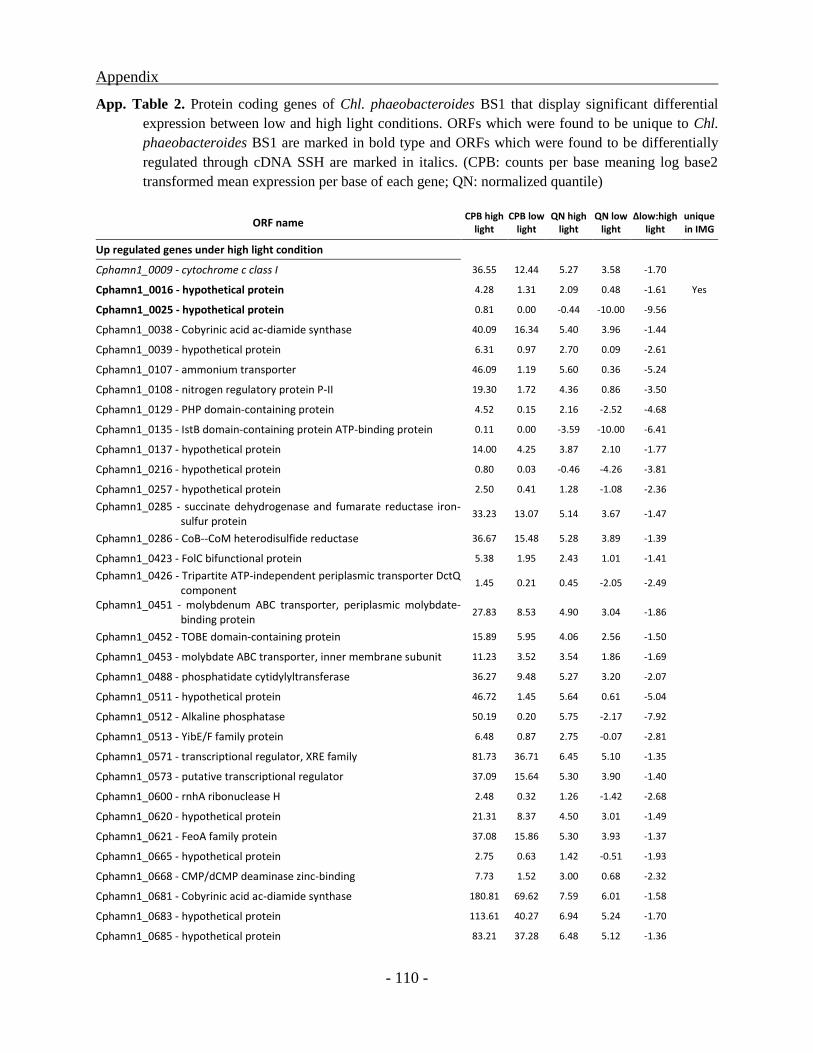
Appendix
- 110 -
App. Table 2. Protein coding genes of Chl. phaeobacteroides BS1 that display significant differential
expression between low and high light conditions. ORFs which were found to be unique to Chl.
phaeobacteroides BS1 are marked in bold type and ORFs which were found to be differentially
regulated through cDNA SSH are marked in italics. (CPB: counts per base meaning log base2
transformed mean expression per base of each gene; QN: normalized quantile)
ORF name CPB high
light CPB low
light QN high
light QN low
light Δlow:high
light unique in IMG
Up regulated genes under high light condition
Cphamn1_0009 - cytochrome c class I 36.55 12.44 5.27 3.58 -1.70
Cphamn1_0016 - hypothetical protein 4.28 1.31 2.09 0.48 -1.61 Yes
Cphamn1_0025 - hypothetical protein 0.81 0.00 -0.44 -10.00 -9.56
Cphamn1_0038 - Cobyrinic acid ac-diamide synthase 40.09 16.34 5.40 3.96 -1.44
Cphamn1_0039 - hypothetical protein 6.31 0.97 2.70 0.09 -2.61
Cphamn1_0107 - ammonium transporter 46.09 1.19 5.60 0.36 -5.24
Cphamn1_0108 - nitrogen regulatory protein P-II 19.30 1.72 4.36 0.86 -3.50
Cphamn1_0129 - PHP domain-containing protein 4.52 0.15 2.16 -2.52 -4.68
Cphamn1_0135 - IstB domain-containing protein ATP-binding protein 0.11 0.00 -3.59 -10.00 -6.41
Cphamn1_0137 - hypothetical protein 14.00 4.25 3.87 2.10 -1.77
Cphamn1_0216 - hypothetical protein 0.80 0.03 -0.46 -4.26 -3.81
Cphamn1_0257 - hypothetical protein 2.50 0.41 1.28 -1.08 -2.36
Cphamn1_0285 - succinate dehydrogenase and fumarate reductase iron-sulfur protein
33.23 13.07 5.14 3.67 -1.47
Cphamn1_0286 - CoB--CoM heterodisulfide reductase 36.67 15.48 5.28 3.89 -1.39
Cphamn1_0423 - FolC bifunctional protein 5.38 1.95 2.43 1.01 -1.41
Cphamn1_0426 - Tripartite ATP-independent periplasmic transporter DctQ component
1.45 0.21 0.45 -2.05 -2.49
Cphamn1_0451 - molybdenum ABC transporter, periplasmic molybdate-binding protein
27.83 8.53 4.90 3.04 -1.86
Cphamn1_0452 - TOBE domain-containing protein 15.89 5.95 4.06 2.56 -1.50
Cphamn1_0453 - molybdate ABC transporter, inner membrane subunit 11.23 3.52 3.54 1.86 -1.69
Cphamn1_0488 - phosphatidate cytidylyltransferase 36.27 9.48 5.27 3.20 -2.07
Cphamn1_0511 - hypothetical protein 46.72 1.45 5.64 0.61 -5.04
Cphamn1_0512 - Alkaline phosphatase 50.19 0.20 5.75 -2.17 -7.92
Cphamn1_0513 - YibE/F family protein 6.48 0.87 2.75 -0.07 -2.81
Cphamn1_0571 - transcriptional regulator, XRE family 81.73 36.71 6.45 5.10 -1.35
Cphamn1_0573 - putative transcriptional regulator 37.09 15.64 5.30 3.90 -1.40
Cphamn1_0600 - rnhA ribonuclease H 2.48 0.32 1.26 -1.42 -2.68
Cphamn1_0620 - hypothetical protein 21.31 8.37 4.50 3.01 -1.49
Cphamn1_0621 - FeoA family protein 37.08 15.86 5.30 3.93 -1.37
Cphamn1_0665 - hypothetical protein 2.75 0.63 1.42 -0.51 -1.93
Cphamn1_0668 - CMP/dCMP deaminase zinc-binding 7.73 1.52 3.00 0.68 -2.32
Cphamn1_0681 - Cobyrinic acid ac-diamide synthase 180.81 69.62 7.59 6.01 -1.58
Cphamn1_0683 - hypothetical protein 113.61 40.27 6.94 5.24 -1.70
Cphamn1_0685 - hypothetical protein 83.21 37.28 6.48 5.12 -1.36

Appendix
- 111 -
ORF name CPB high
light CPB low
light QN high
light QN low
light Δlow:high
light unique in IMG
Cphamn1_0856 - hypothetical protein 1.09 0.10 -0.01 -3.04 -3.02 Yes
Cphamn1_0863 - outer membrane efflux protein 8.21 0.14 3.08 -2.66 -5.74
Cphamn1_0864 - efflux transporter, RND family, MFP subunit 27.97 0.91 4.91 0.01 -4.90
Cphamn1_0865 - heavy metal efflux pump, CzcA family 2.61 0.44 1.34 -0.98 -2.32
Cphamn1_0888 - hypothetical protein 84.64 39.06 6.52 5.20 -1.32
Cphamn1_0889 - transcriptional regulator, XRE family 111.50 42.66 6.92 5.33 -1.59
Cphamn1_0914 - hypothetical protein 2.20 0.02 1.11 -4.80 -5.91 Yes
Cphamn1_0951 - hypothetical protein 1.69 0.27 0.69 -1.73 -2.42 Yes
Cphamn1_0952 - transcriptional regulator, AsnC family 107.11 14.48 6.84 3.80 -3.04
Cphamn1_0953 - glutamine synthetase catalytic region 169.78 21.80 7.49 4.36 -3.12
Cphamn1_1136 - hypothetical protein 82.28 8.89 6.46 3.11 -3.35
Cphamn1_1137 - nitrogen regulatory protein P-II 1169.64 83.62 10.29 6.28 -4.01
Cphamn1_1138 - ammonium transporter 298.49 4.92 8.31 2.31 -5.99
Cphamn1_1166 - UspA domain-containing protein 5.56 1.92 2.47 1.00 -1.47
Cphamn1_1212 - hypothetical protein 27.89 2.31 4.91 1.26 -3.65
Cphamn1_1213 - tRNA guanosine-2'-O-methyltransferase 26.14 4.00 4.81 2.02 -2.79
Cphamn1_1225 - phospholipid/glycerol acyltransferase 18.77 1.18 4.32 0.34 -3.98
Cphamn1_1226 - hypothetical protein 373.83 0.76 8.61 -0.26 -8.88
Cphamn1_1227 - hypothetical protein 84.47 0.67 6.50 -0.44 -6.94
Cphamn1_1228 - hypothetical protein 83.39 0.69 6.48 -0.41 -6.89
Cphamn1_1229 - phosphate binding protein 266.32 1.56 8.13 0.72 -7.41
Cphamn1_1230 - ABC-type phosphate transport system periplasmic component-like protein
264.84 2.60 8.11 1.42 -6.69
Cphamn1_1231 - phosphate ABC transporter, ATPase subunit 46.35 1.16 5.61 0.32 -5.29
Cphamn1_1232 - phosphate ABC transporter, inner membrane subunit PstC
4.31 0.32 2.10 -1.39 -3.48
Cphamn1_1233 - phosphate ABC transporter, inner membrane subunit PstA
6.13 0.39 2.65 -1.18 -3.82
Cphamn1_1234 - phosphate ABC transporter, inner membrane subunit PstC
6.06 1.00 2.62 0.13 -2.49
Cphamn1_1235 - phosphate ABC transporter, inner membrane subunit PstA
13.66 2.95 3.83 1.60 -2.23
Cphamn1_1237 - phosphate uptake regulator, PhoU 25.78 10.97 4.79 3.40 -1.39
Cphamn1_1271 - hypothetical protein 186.74 11.90 7.67 3.51 -4.15
Cphamn1_1312 - hypothetical protein 3.68 1.02 1.84 0.15 -1.68
Cphamn1_1387 - aminoacyl-histidine dipeptidase 4.26 0.74 2.08 -0.32 -2.40
Cphamn1_1389 - hypothetical protein 29.05 8.26 4.97 2.99 -1.98
Cphamn1_1390 - hypothetical protein 273.61 74.68 8.17 6.12 -2.05
Cphamn1_1391 - transcriptional regulator, ArsR family 323.63 95.84 8.44 6.48 -1.96
Cphamn1_1475 - hypothetical protein 61.50 3.27 6.03 1.75 -4.29
Cphamn1_1534 - Inorganic pyrophosphatase 10.33 1.18 3.42 0.35 -3.07
Cphamn1_1535 - TonB-dependent receptor 22.32 0.27 4.57 -1.67 -6.24
Cphamn1_1536 - phytase 22.92 10.10 4.62 3.28 -1.33
Cphamn1_1543 - hypothetical protein 4.99 0.75 2.31 -0.29 -2.60
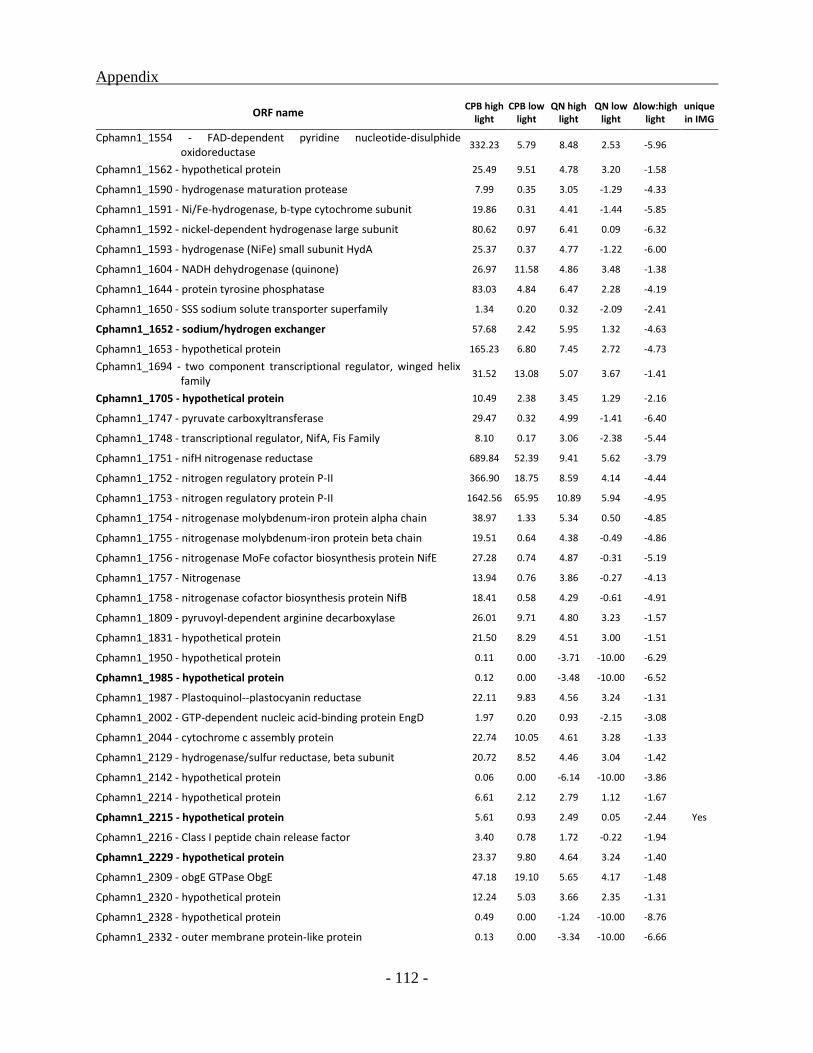
Appendix
- 112 -
ORF name CPB high
light CPB low
light QN high
light QN low
light Δlow:high
light unique in IMG
Cphamn1_1554 - FAD-dependent pyridine nucleotide-disulphide oxidoreductase
332.23 5.79 8.48 2.53 -5.96
Cphamn1_1562 - hypothetical protein 25.49 9.51 4.78 3.20 -1.58
Cphamn1_1590 - hydrogenase maturation protease 7.99 0.35 3.05 -1.29 -4.33
Cphamn1_1591 - Ni/Fe-hydrogenase, b-type cytochrome subunit 19.86 0.31 4.41 -1.44 -5.85
Cphamn1_1592 - nickel-dependent hydrogenase large subunit 80.62 0.97 6.41 0.09 -6.32
Cphamn1_1593 - hydrogenase (NiFe) small subunit HydA 25.37 0.37 4.77 -1.22 -6.00
Cphamn1_1604 - NADH dehydrogenase (quinone) 26.97 11.58 4.86 3.48 -1.38
Cphamn1_1644 - protein tyrosine phosphatase 83.03 4.84 6.47 2.28 -4.19
Cphamn1_1650 - SSS sodium solute transporter superfamily 1.34 0.20 0.32 -2.09 -2.41
Cphamn1_1652 - sodium/hydrogen exchanger 57.68 2.42 5.95 1.32 -4.63
Cphamn1_1653 - hypothetical protein 165.23 6.80 7.45 2.72 -4.73
Cphamn1_1694 - two component transcriptional regulator, winged helix family
31.52 13.08 5.07 3.67 -1.41
Cphamn1_1705 - hypothetical protein 10.49 2.38 3.45 1.29 -2.16
Cphamn1_1747 - pyruvate carboxyltransferase 29.47 0.32 4.99 -1.41 -6.40
Cphamn1_1748 - transcriptional regulator, NifA, Fis Family 8.10 0.17 3.06 -2.38 -5.44
Cphamn1_1751 - nifH nitrogenase reductase 689.84 52.39 9.41 5.62 -3.79
Cphamn1_1752 - nitrogen regulatory protein P-II 366.90 18.75 8.59 4.14 -4.44
Cphamn1_1753 - nitrogen regulatory protein P-II 1642.56 65.95 10.89 5.94 -4.95
Cphamn1_1754 - nitrogenase molybdenum-iron protein alpha chain 38.97 1.33 5.34 0.50 -4.85
Cphamn1_1755 - nitrogenase molybdenum-iron protein beta chain 19.51 0.64 4.38 -0.49 -4.86
Cphamn1_1756 - nitrogenase MoFe cofactor biosynthesis protein NifE 27.28 0.74 4.87 -0.31 -5.19
Cphamn1_1757 - Nitrogenase 13.94 0.76 3.86 -0.27 -4.13
Cphamn1_1758 - nitrogenase cofactor biosynthesis protein NifB 18.41 0.58 4.29 -0.61 -4.91
Cphamn1_1809 - pyruvoyl-dependent arginine decarboxylase 26.01 9.71 4.80 3.23 -1.57
Cphamn1_1831 - hypothetical protein 21.50 8.29 4.51 3.00 -1.51
Cphamn1_1950 - hypothetical protein 0.11 0.00 -3.71 -10.00 -6.29
Cphamn1_1985 - hypothetical protein 0.12 0.00 -3.48 -10.00 -6.52
Cphamn1_1987 - Plastoquinol--plastocyanin reductase 22.11 9.83 4.56 3.24 -1.31
Cphamn1_2002 - GTP-dependent nucleic acid-binding protein EngD 1.97 0.20 0.93 -2.15 -3.08
Cphamn1_2044 - cytochrome c assembly protein 22.74 10.05 4.61 3.28 -1.33
Cphamn1_2129 - hydrogenase/sulfur reductase, beta subunit 20.72 8.52 4.46 3.04 -1.42
Cphamn1_2142 - hypothetical protein 0.06 0.00 -6.14 -10.00 -3.86
Cphamn1_2214 - hypothetical protein 6.61 2.12 2.79 1.12 -1.67
Cphamn1_2215 - hypothetical protein 5.61 0.93 2.49 0.05 -2.44 Yes
Cphamn1_2216 - Class I peptide chain release factor 3.40 0.78 1.72 -0.22 -1.94
Cphamn1_2229 - hypothetical protein 23.37 9.80 4.64 3.24 -1.40
Cphamn1_2309 - obgE GTPase ObgE 47.18 19.10 5.65 4.17 -1.48
Cphamn1_2320 - hypothetical protein 12.24 5.03 3.66 2.35 -1.31
Cphamn1_2328 - hypothetical protein 0.49 0.00 -1.24 -10.00 -8.76
Cphamn1_2332 - outer membrane protein-like protein 0.13 0.00 -3.34 -10.00 -6.66
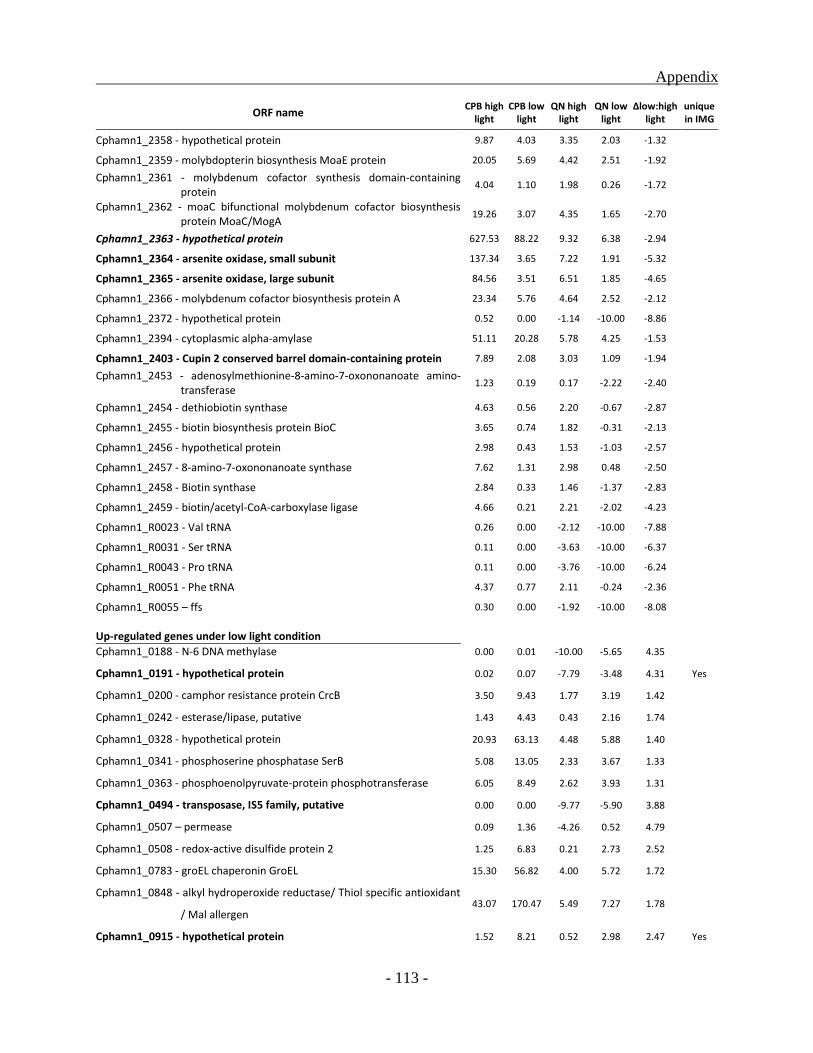
Appendix
- 113 -
ORF name CPB high
light CPB low
light QN high
light QN low
light Δlow:high
light unique in IMG
Cphamn1_2358 - hypothetical protein 9.87 4.03 3.35 2.03 -1.32
Cphamn1_2359 - molybdopterin biosynthesis MoaE protein 20.05 5.69 4.42 2.51 -1.92
Cphamn1_2361 - molybdenum cofactor synthesis domain-containing protein
4.04 1.10 1.98 0.26 -1.72
Cphamn1_2362 - moaC bifunctional molybdenum cofactor biosynthesis protein MoaC/MogA
19.26 3.07 4.35 1.65 -2.70
Cphamn1_2363 - hypothetical protein 627.53 88.22 9.32 6.38 -2.94
Cphamn1_2364 - arsenite oxidase, small subunit 137.34 3.65 7.22 1.91 -5.32
Cphamn1_2365 - arsenite oxidase, large subunit 84.56 3.51 6.51 1.85 -4.65
Cphamn1_2366 - molybdenum cofactor biosynthesis protein A 23.34 5.76 4.64 2.52 -2.12
Cphamn1_2372 - hypothetical protein 0.52 0.00 -1.14 -10.00 -8.86
Cphamn1_2394 - cytoplasmic alpha-amylase 51.11 20.28 5.78 4.25 -1.53
Cphamn1_2403 - Cupin 2 conserved barrel domain-containing protein 7.89 2.08 3.03 1.09 -1.94
Cphamn1_2453 - adenosylmethionine-8-amino-7-oxononanoate amino-transferase
1.23 0.19 0.17 -2.22 -2.40
Cphamn1_2454 - dethiobiotin synthase 4.63 0.56 2.20 -0.67 -2.87
Cphamn1_2455 - biotin biosynthesis protein BioC 3.65 0.74 1.82 -0.31 -2.13
Cphamn1_2456 - hypothetical protein 2.98 0.43 1.53 -1.03 -2.57
Cphamn1_2457 - 8-amino-7-oxononanoate synthase 7.62 1.31 2.98 0.48 -2.50
Cphamn1_2458 - Biotin synthase 2.84 0.33 1.46 -1.37 -2.83
Cphamn1_2459 - biotin/acetyl-CoA-carboxylase ligase 4.66 0.21 2.21 -2.02 -4.23
Cphamn1_R0023 - Val tRNA 0.26 0.00 -2.12 -10.00 -7.88
Cphamn1_R0031 - Ser tRNA 0.11 0.00 -3.63 -10.00 -6.37
Cphamn1_R0043 - Pro tRNA 0.11 0.00 -3.76 -10.00 -6.24
Cphamn1_R0051 - Phe tRNA 4.37 0.77 2.11 -0.24 -2.36
Cphamn1_R0055 – ffs 0.30 0.00 -1.92 -10.00 -8.08
Up-regulated genes under low light condition
Cphamn1_0188 - N-6 DNA methylase 0.00 0.01 -10.00 -5.65 4.35
Cphamn1_0191 - hypothetical protein 0.02 0.07 -7.79 -3.48 4.31 Yes
Cphamn1_0200 - camphor resistance protein CrcB 3.50 9.43 1.77 3.19 1.42
Cphamn1_0242 - esterase/lipase, putative 1.43 4.43 0.43 2.16 1.74
Cphamn1_0328 - hypothetical protein 20.93 63.13 4.48 5.88 1.40
Cphamn1_0341 - phosphoserine phosphatase SerB 5.08 13.05 2.33 3.67 1.33
Cphamn1_0363 - phosphoenolpyruvate-protein phosphotransferase 6.05 8.49 2.62 3.93 1.31
Cphamn1_0494 - transposase, IS5 family, putative 0.00 0.00 -9.77 -5.90 3.88
Cphamn1_0507 – permease 0.09 1.36 -4.26 0.52 4.79
Cphamn1_0508 - redox-active disulfide protein 2 1.25 6.83 0.21 2.73 2.52
Cphamn1_0783 - groEL chaperonin GroEL 15.30 56.82 4.00 5.72 1.72
Cphamn1_0848 - alkyl hydroperoxide reductase/ Thiol specific antioxidant
/ Mal allergen 43.07 170.47 5.49 7.27 1.78
Cphamn1_0915 - hypothetical protein 1.52 8.21 0.52 2.98 2.47 Yes
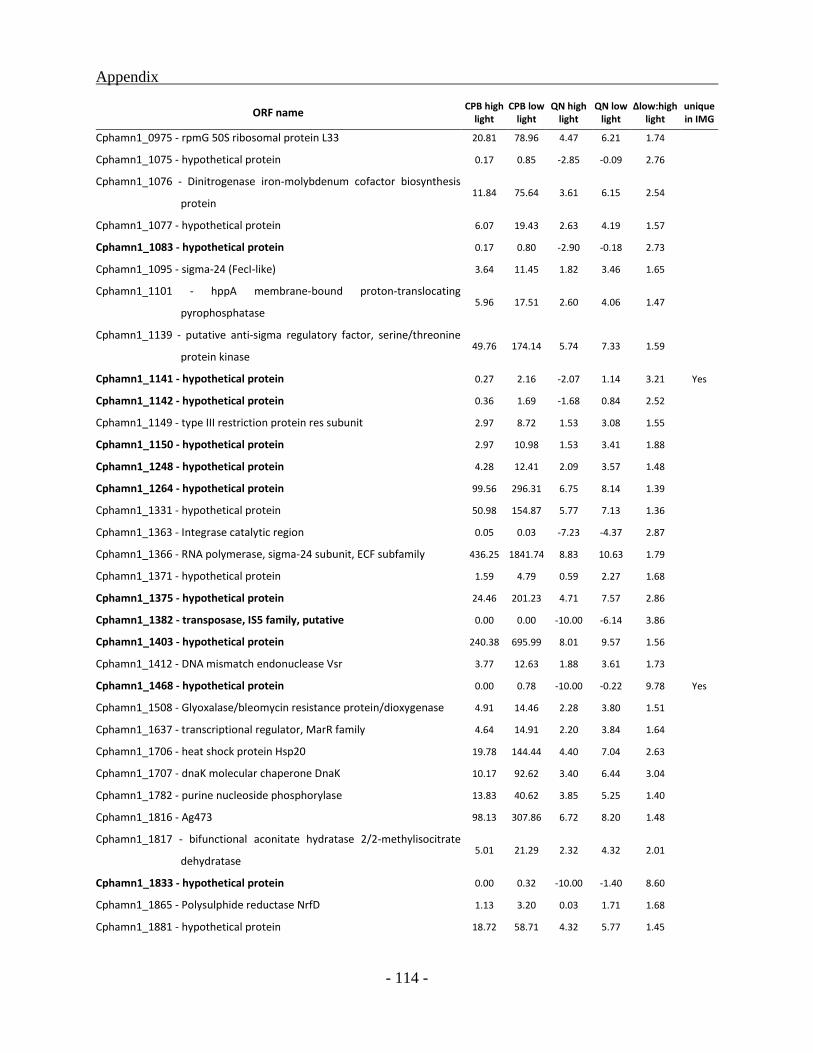
Appendix
- 114 -
ORF name CPB high
light CPB low
light QN high
light QN low
light Δlow:high
light unique in IMG
Cphamn1_0975 - rpmG 50S ribosomal protein L33 20.81 78.96 4.47 6.21 1.74
Cphamn1_1075 - hypothetical protein 0.17 0.85 -2.85 -0.09 2.76
Cphamn1_1076 - Dinitrogenase iron-molybdenum cofactor biosynthesis
protein 11.84 75.64 3.61 6.15 2.54
Cphamn1_1077 - hypothetical protein 6.07 19.43 2.63 4.19 1.57
Cphamn1_1083 - hypothetical protein 0.17 0.80 -2.90 -0.18 2.73
Cphamn1_1095 - sigma-24 (FecI-like) 3.64 11.45 1.82 3.46 1.65
Cphamn1_1101 - hppA membrane-bound proton-translocating
pyrophosphatase 5.96 17.51 2.60 4.06 1.47
Cphamn1_1139 - putative anti-sigma regulatory factor, serine/threonine
protein kinase 49.76 174.14 5.74 7.33 1.59
Cphamn1_1141 - hypothetical protein 0.27 2.16 -2.07 1.14 3.21 Yes
Cphamn1_1142 - hypothetical protein 0.36 1.69 -1.68 0.84 2.52
Cphamn1_1149 - type III restriction protein res subunit 2.97 8.72 1.53 3.08 1.55
Cphamn1_1150 - hypothetical protein 2.97 10.98 1.53 3.41 1.88
Cphamn1_1248 - hypothetical protein 4.28 12.41 2.09 3.57 1.48
Cphamn1_1264 - hypothetical protein 99.56 296.31 6.75 8.14 1.39
Cphamn1_1331 - hypothetical protein 50.98 154.87 5.77 7.13 1.36
Cphamn1_1363 - Integrase catalytic region 0.05 0.03 -7.23 -4.37 2.87
Cphamn1_1366 - RNA polymerase, sigma-24 subunit, ECF subfamily 436.25 1841.74 8.83 10.63 1.79
Cphamn1_1371 - hypothetical protein 1.59 4.79 0.59 2.27 1.68
Cphamn1_1375 - hypothetical protein 24.46 201.23 4.71 7.57 2.86
Cphamn1_1382 - transposase, IS5 family, putative 0.00 0.00 -10.00 -6.14 3.86
Cphamn1_1403 - hypothetical protein 240.38 695.99 8.01 9.57 1.56
Cphamn1_1412 - DNA mismatch endonuclease Vsr 3.77 12.63 1.88 3.61 1.73
Cphamn1_1468 - hypothetical protein 0.00 0.78 -10.00 -0.22 9.78 Yes
Cphamn1_1508 - Glyoxalase/bleomycin resistance protein/dioxygenase 4.91 14.46 2.28 3.80 1.51
Cphamn1_1637 - transcriptional regulator, MarR family 4.64 14.91 2.20 3.84 1.64
Cphamn1_1706 - heat shock protein Hsp20 19.78 144.44 4.40 7.04 2.63
Cphamn1_1707 - dnaK molecular chaperone DnaK 10.17 92.62 3.40 6.44 3.04
Cphamn1_1782 - purine nucleoside phosphorylase 13.83 40.62 3.85 5.25 1.40
Cphamn1_1816 - Ag473 98.13 307.86 6.72 8.20 1.48
Cphamn1_1817 - bifunctional aconitate hydratase 2/2-methylisocitrate
dehydratase 5.01 21.29 2.32 4.32 2.01
Cphamn1_1833 - hypothetical protein 0.00 0.32 -10.00 -1.40 8.60
Cphamn1_1865 - Polysulphide reductase NrfD 1.13 3.20 0.03 1.71 1.68
Cphamn1_1881 - hypothetical protein 18.72 58.71 4.32 5.77 1.45
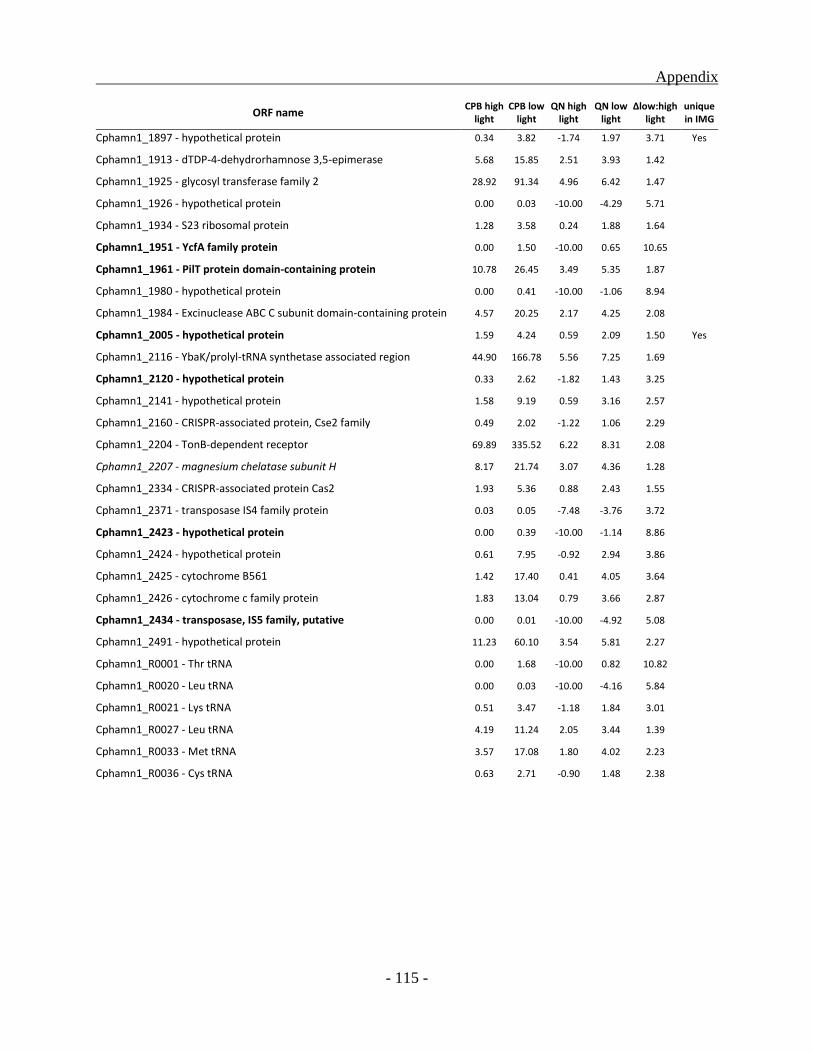
Appendix
- 115 -
ORF name CPB high
light CPB low
light QN high
light QN low
light Δlow:high
light unique in IMG
Cphamn1_1897 - hypothetical protein 0.34 3.82 -1.74 1.97 3.71 Yes
Cphamn1_1913 - dTDP-4-dehydrorhamnose 3,5-epimerase 5.68 15.85 2.51 3.93 1.42
Cphamn1_1925 - glycosyl transferase family 2 28.92 91.34 4.96 6.42 1.47
Cphamn1_1926 - hypothetical protein 0.00 0.03 -10.00 -4.29 5.71
Cphamn1_1934 - S23 ribosomal protein 1.28 3.58 0.24 1.88 1.64
Cphamn1_1951 - YcfA family protein 0.00 1.50 -10.00 0.65 10.65
Cphamn1_1961 - PilT protein domain-containing protein 10.78 26.45 3.49 5.35 1.87
Cphamn1_1980 - hypothetical protein 0.00 0.41 -10.00 -1.06 8.94
Cphamn1_1984 - Excinuclease ABC C subunit domain-containing protein 4.57 20.25 2.17 4.25 2.08
Cphamn1_2005 - hypothetical protein 1.59 4.24 0.59 2.09 1.50 Yes
Cphamn1_2116 - YbaK/prolyl-tRNA synthetase associated region 44.90 166.78 5.56 7.25 1.69
Cphamn1_2120 - hypothetical protein 0.33 2.62 -1.82 1.43 3.25
Cphamn1_2141 - hypothetical protein 1.58 9.19 0.59 3.16 2.57
Cphamn1_2160 - CRISPR-associated protein, Cse2 family 0.49 2.02 -1.22 1.06 2.29
Cphamn1_2204 - TonB-dependent receptor 69.89 335.52 6.22 8.31 2.08
Cphamn1_2207 - magnesium chelatase subunit H 8.17 21.74 3.07 4.36 1.28
Cphamn1_2334 - CRISPR-associated protein Cas2 1.93 5.36 0.88 2.43 1.55
Cphamn1_2371 - transposase IS4 family protein 0.03 0.05 -7.48 -3.76 3.72
Cphamn1_2423 - hypothetical protein 0.00 0.39 -10.00 -1.14 8.86
Cphamn1_2424 - hypothetical protein 0.61 7.95 -0.92 2.94 3.86
Cphamn1_2425 - cytochrome B561 1.42 17.40 0.41 4.05 3.64
Cphamn1_2426 - cytochrome c family protein 1.83 13.04 0.79 3.66 2.87
Cphamn1_2434 - transposase, IS5 family, putative 0.00 0.01 -10.00 -4.92 5.08
Cphamn1_2491 - hypothetical protein 11.23 60.10 3.54 5.81 2.27
Cphamn1_R0001 - Thr tRNA 0.00 1.68 -10.00 0.82 10.82
Cphamn1_R0020 - Leu tRNA 0.00 0.03 -10.00 -4.16 5.84
Cphamn1_R0021 - Lys tRNA 0.51 3.47 -1.18 1.84 3.01
Cphamn1_R0027 - Leu tRNA 4.19 11.24 2.05 3.44 1.39
Cphamn1_R0033 - Met tRNA 3.57 17.08 1.80 4.02 2.23
Cphamn1_R0036 - Cys tRNA 0.63 2.71 -0.90 1.48 2.38
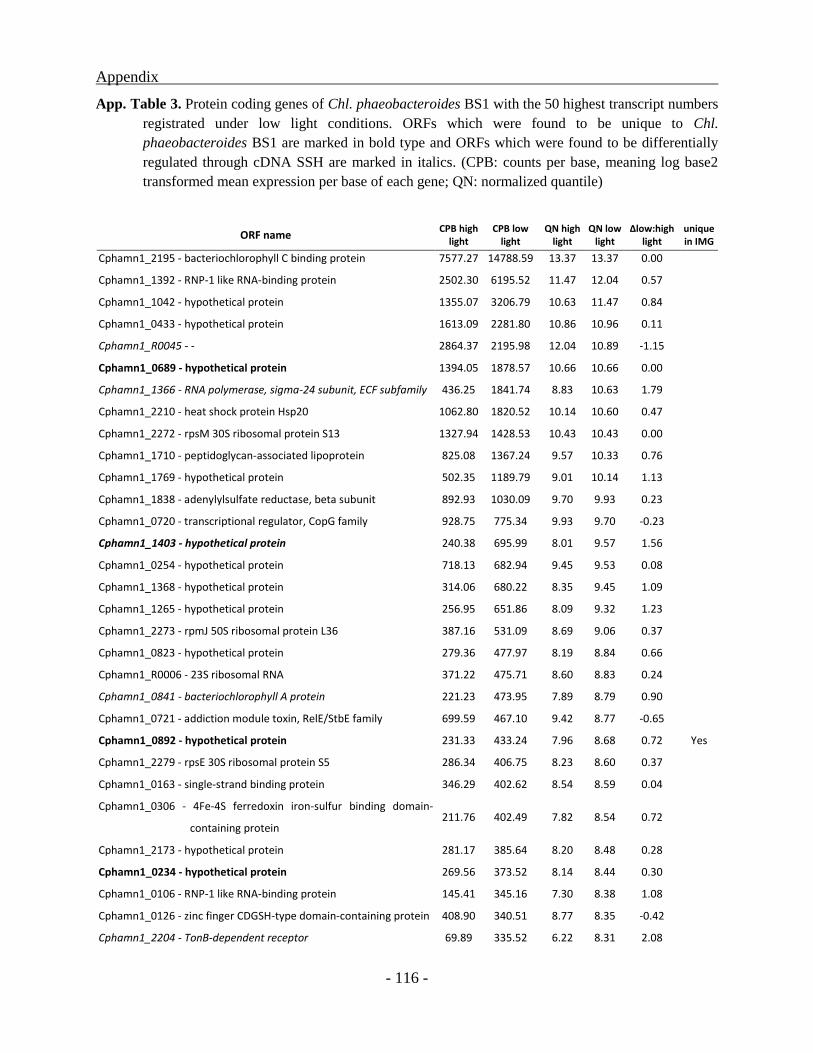
Appendix
- 116 -
App. Table 3. Protein coding genes of Chl. phaeobacteroides BS1 with the 50 highest transcript numbers
registrated under low light conditions. ORFs which were found to be unique to Chl.
phaeobacteroides BS1 are marked in bold type and ORFs which were found to be differentially
regulated through cDNA SSH are marked in italics. (CPB: counts per base, meaning log base2
transformed mean expression per base of each gene; QN: normalized quantile)
ORF name CPB high
light CPB low
light QN high
light QN low
light Δlow:high
light unique in IMG
Cphamn1_2195 - bacteriochlorophyll C binding protein 7577.27 14788.59 13.37 13.37 0.00
Cphamn1_1392 - RNP-1 like RNA-binding protein 2502.30 6195.52 11.47 12.04 0.57
Cphamn1_1042 - hypothetical protein 1355.07 3206.79 10.63 11.47 0.84
Cphamn1_0433 - hypothetical protein 1613.09 2281.80 10.86 10.96 0.11
Cphamn1_R0045 - - 2864.37 2195.98 12.04 10.89 -1.15
Cphamn1_0689 - hypothetical protein 1394.05 1878.57 10.66 10.66 0.00
Cphamn1_1366 - RNA polymerase, sigma-24 subunit, ECF subfamily 436.25 1841.74 8.83 10.63 1.79
Cphamn1_2210 - heat shock protein Hsp20 1062.80 1820.52 10.14 10.60 0.47
Cphamn1_2272 - rpsM 30S ribosomal protein S13 1327.94 1428.53 10.43 10.43 0.00
Cphamn1_1710 - peptidoglycan-associated lipoprotein 825.08 1367.24 9.57 10.33 0.76
Cphamn1_1769 - hypothetical protein 502.35 1189.79 9.01 10.14 1.13
Cphamn1_1838 - adenylylsulfate reductase, beta subunit 892.93 1030.09 9.70 9.93 0.23
Cphamn1_0720 - transcriptional regulator, CopG family 928.75 775.34 9.93 9.70 -0.23
Cphamn1_1403 - hypothetical protein 240.38 695.99 8.01 9.57 1.56
Cphamn1_0254 - hypothetical protein 718.13 682.94 9.45 9.53 0.08
Cphamn1_1368 - hypothetical protein 314.06 680.22 8.35 9.45 1.09
Cphamn1_1265 - hypothetical protein 256.95 651.86 8.09 9.32 1.23
Cphamn1_2273 - rpmJ 50S ribosomal protein L36 387.16 531.09 8.69 9.06 0.37
Cphamn1_0823 - hypothetical protein 279.36 477.97 8.19 8.84 0.66
Cphamn1_R0006 - 23S ribosomal RNA 371.22 475.71 8.60 8.83 0.24
Cphamn1_0841 - bacteriochlorophyll A protein 221.23 473.95 7.89 8.79 0.90
Cphamn1_0721 - addiction module toxin, RelE/StbE family 699.59 467.10 9.42 8.77 -0.65
Cphamn1_0892 - hypothetical protein 231.33 433.24 7.96 8.68 0.72 Yes
Cphamn1_2279 - rpsE 30S ribosomal protein S5 286.34 406.75 8.23 8.60 0.37
Cphamn1_0163 - single-strand binding protein 346.29 402.62 8.54 8.59 0.04
Cphamn1_0306 - 4Fe-4S ferredoxin iron-sulfur binding domain-
containing protein 211.76 402.49 7.82 8.54 0.72
Cphamn1_2173 - hypothetical protein 281.17 385.64 8.20 8.48 0.28
Cphamn1_0234 - hypothetical protein 269.56 373.52 8.14 8.44 0.30
Cphamn1_0106 - RNP-1 like RNA-binding protein 145.41 345.16 7.30 8.38 1.08
Cphamn1_0126 - zinc finger CDGSH-type domain-containing protein 408.90 340.51 8.77 8.35 -0.42
Cphamn1_2204 - TonB-dependent receptor 69.89 335.52 6.22 8.31 2.08
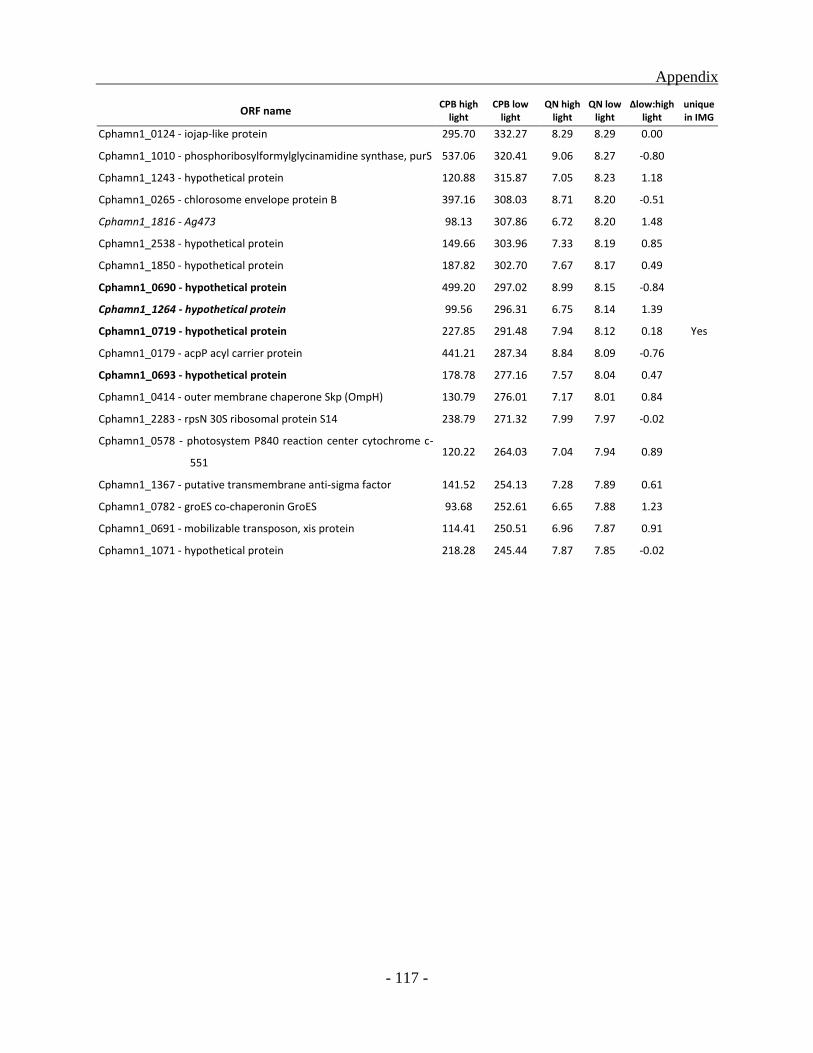
Appendix
- 117 -
ORF name CPB high
light CPB low
light QN high
light QN low
light Δlow:high
light unique in IMG
Cphamn1_0124 - iojap-like protein 295.70 332.27 8.29 8.29 0.00
Cphamn1_1010 - phosphoribosylformylglycinamidine synthase, purS 537.06 320.41 9.06 8.27 -0.80
Cphamn1_1243 - hypothetical protein 120.88 315.87 7.05 8.23 1.18
Cphamn1_0265 - chlorosome envelope protein B 397.16 308.03 8.71 8.20 -0.51
Cphamn1_1816 - Ag473 98.13 307.86 6.72 8.20 1.48
Cphamn1_2538 - hypothetical protein 149.66 303.96 7.33 8.19 0.85
Cphamn1_1850 - hypothetical protein 187.82 302.70 7.67 8.17 0.49
Cphamn1_0690 - hypothetical protein 499.20 297.02 8.99 8.15 -0.84
Cphamn1_1264 - hypothetical protein 99.56 296.31 6.75 8.14 1.39
Cphamn1_0719 - hypothetical protein 227.85 291.48 7.94 8.12 0.18 Yes
Cphamn1_0179 - acpP acyl carrier protein 441.21 287.34 8.84 8.09 -0.76
Cphamn1_0693 - hypothetical protein 178.78 277.16 7.57 8.04 0.47
Cphamn1_0414 - outer membrane chaperone Skp (OmpH) 130.79 276.01 7.17 8.01 0.84
Cphamn1_2283 - rpsN 30S ribosomal protein S14 238.79 271.32 7.99 7.97 -0.02
Cphamn1_0578 - photosystem P840 reaction center cytochrome c-
551 120.22 264.03 7.04 7.94 0.89
Cphamn1_1367 - putative transmembrane anti-sigma factor 141.52 254.13 7.28 7.89 0.61
Cphamn1_0782 - groES co-chaperonin GroES 93.68 252.61 6.65 7.88 1.23
Cphamn1_0691 - mobilizable transposon, xis protein 114.41 250.51 6.96 7.87 0.91
Cphamn1_1071 - hypothetical protein 218.28 245.44 7.87 7.85 -0.02

References
- 119 -
REFERENCES
Airs, R.L., Atkinson, J.E., and Keely, B.J. (2001). Development and application of a high
resolution liquid chromatographic method for the analysis of complex pigment distributions.
J Chromat 917, 167–177.
Alekshun, M.N., and Levy, S.B. (1999). The mar regulon: multiple resistance to antibiotics and
other toxic chemicals. Trends in Microbiology 7, 410–413.
Altschul, S.F., Madden, T.L., Schäffer, A.A., Zhang, J., Zhang, Z., Miller, W., and Lipman, D.J.
(1997). Gapped BLAST and PSI-BLAST: a new generation of protein database search
programs. Nucleic Acids Res 25, 3389–3402.
Ames, G.F.L. (1986). Bacterial Periplasmic Transport Systems: Structure, Mechanism, and
Evolution. Annu. Rev. Biochem. 55, 397–425.
Anbar, A.D., and Knoll, A.H. (2002). Proterozoic Ocean Chemistry and Evolution: A
Bioinorganic Bridge? Science 297, 1137–1142.
Arnold, K., Bordoli, L., Kopp, J., and Schwede, T. (2006). The SWISS-MODEL workspace: a
web-based environment for protein structure homology modelling. Bioinformatics 22, 195–
201.
Balch, W.E., Fox, G.E., Magrum, L.J., Woese, C.R., and Wolfe, R.S. (1979). Methanogens:
reevaluation of a unique biological group. Microbiol Rev 43, 260–296.
Beja, O., Suzuki, M.T., Heidelberg, J.F., Nelson, W.C., Preston, C.M., Hamada, T., Eisen, J.A.,
Fraser, C.M., and DeLong, E.F. (2002). Unsuspected diversity among marine aerobic
anoxygenic phototrophs. Nature 415, 630–633.
Bélanger, G., and Gingras, G. (1988). Structure and expression of the puf operon messenger
RNA in Rhodospirillum rubrum. J. Biol. Chem 263, 7639–7645.
Benson, D.A., Karsch-Mizrachi, I., Lipman, D.J., Ostell, J., and Wheeler, D.L. (2008). GenBank.
Nucleic Acids Res 36, D25–D30.
Bérard, J., Bélanger, G., Corriveau, P., and Gingras, G. (1986). Molecular cloning and sequence
of the B880 holochrome gene from Rhodospirillum rubrum. J. Biol. Chem 261, 82–87.
Berman, H.M., Westbrook, J., Feng, Z., Gilliland, G., Bhat, T.N., Weissig, H., Shindyalov, I.N.,
and Bourne, P.E. (2000). The Protein Data Bank. Nucleic Acids Res 28, 235–242.
Bertini, I., Cavallaro, G., and Rosato, A. (2006). Cytochrome c: Occurrence and Functions.
Chemical Reviews 106, 90–115.
References
- 120 -
Blankenship, R., and Matsuura, K. (2003). Antenna Complexes from Green photosynthetic
Bacteria. In Light-harvesting antennas in photosynthesis, B.R. Green, and W.W. Parson, eds.
(Springer), pp. 195–211.
Borrego, C.M., Arellano, J.B., Abella, C.A., Gillbro, T., and Garcia-Gil, J. (1999). The molar
extinction coefficient of bacteriochlorophyll e and the pigment stoichiometry in Chlorobium
phaeobacteroides. Photosynthesis Research 60, 257–264.
Brune, D.C. (1989). Sulfur oxidation by phototrophic bacteria. Biochim. Biophys. Acta 975,
189–221.
Bullard, J.H., Purdom, E., Hansen, K.D., and Dudoit, S. (2010). Evaluation of statistical methods
for normalization and differential expression in mRNA-Seq experiments. BMC
Bioinformatics 11, 94.
Bullough, P.A., Qian, P., and Hunter, C.N. (2008). Reaction Center-Light-Harvesting Core
Complexes of Purple Bacteria. In The Purple Phototrophic Bacteria, (Springer Netherlands),
pp. 155–179.
Bylina, E.J., Robles, S.J., and Youvan, D.C. (1988). Directed mutations affecting the putative
bacteriochlorophyll-binding sites in the light-harvesting I antenna of Rhodobacter capsulatus.
Isr. J. Chem. 28, 73–78.
Campbell, E.A., Korzheva, N., Mustaev, A., Murakami, K., Nair, S., Goldfarb, A., and Darst,
S.A. (2001). Structural Mechanism for Rifampicin Inhibition of Bacterial RNA Polymerase.
Cell 104, 901–912.
Cecchini, G., Schröder, I., Gunsalus, R.P., and Maklashina, E. (2002). Succinate dehydrogenase
and fumarate reductase from Escherichia coli. Biochimica et Biophysica Acta (BBA) -
Bioenergetics 1553, 140–157.
Chen, C.-Y.A., Beatty, J.T., Cohen, S.N., and Belasco, J.G. (1988). An intercistronic stem-loop
structure functions as an mRNA decay terminator necessary but insufficient for puf mRNA
stability. Cell 52, 609–619.
Chew, A.G.M., Frigaard, N.-U., and Bryant, D.A. (2007). Bacteriochlorophyllide c C-82 and C-
121 Methyltransferases Are Essential for Adaptation to Low Light in Chlorobaculum
tepidum. J Bacteriol. 189, 6176–6184.
Chomczynski, P., and Sacchi, N. (1987). Single-step method of RNA isolation by acid
guanidinium thiocyanate-phenol-chloroform extraction. Anal. Biochem 162, 156–159.
Cogdell, R.J., Howard, T.D., Isaacs, N.W., McLuskey, K., and Gardiner, A.T. (2002). Structural
factors which control the position of the Qy absorption band of bacteriochlorophyll a in
purple bacterial antenna complexes. PhotosyRes 74, 135–141.
Cogdell, R.J., Isaacs, N.W., Howard, T.D., McLuskey, K., Fraser, N.J., and Prince, S.M. (1999).
How photosynthetic bacteria harvest solar energy. J. Bacteriol 181, 3869–3879.
References
- 121 -
Conroy, M.J., Westerhuis, W.H.., Parkes-Loach, P.S., Loach, P.A., Hunter, C.N., and
Williamson, M.P. (2000). The solution structure of Rhodobacter sphaeroides LH1[beta]
reveals two helical domains separated by a more flexible region: structural consequences for
the LH1 complex. J Mol Biol 298, 83–94.
Coolen, M.J.L., and Overmann, J. (2000). Functional Exoenzymes as Indicators of Metabolically
Active Bacteria in 124,000-Year-Old Sapropel Layers of the Eastern Mediterranean Sea. Appl
Environ Microbiol 66, 2589–2598.
Coolen, M.J.L., and Overmann, J. (2007). 217 000-year-old DNA sequences of green sulfur
bacteria in Mediterranean sapropels and their implications for the reconstruction of the
paleoenvironment. Environ Microbiol 9, 238–249.
Costanzo, A., and Ades, S.E. (2006). Growth phase-dependent regulation of the extracytoplasmic
stress factor, sigmaE, by guanosine 3’,5’-bispyrophosphate (ppGpp). J. Bacteriol. 188, 4627–
4634.
Davis, C.M., Bustamante, P.L., Todd, J.B., Parkes-Loach, P.S., McGlynn, P., Olsen, J.D.,
McMaster, L., Hunter, C.N., and Loach, P.A. (1997). Evaluation of Structure−Function
Relationships in the Core Light-Harvesting Complex of Photosynthetic Bacteria by
Reconstitution with Mutant Polypeptides. Biochemistry 36, 3671–3679.
Degens, E.T., and Ross, D.A. (1972). Chronology of the Black Sea over the last 25,000 years.
Chemical Geology 10, 1–16.
Dietrich, G., Kalle, K., Krauss, W., and Siedler, G. (1975). Allgemeine Meereskunde (Berlin,
Stuttgart: Gebrüder Bornträger).
Eccles, J., and Honig, B. (1983). Charged amino acids as spectroscopic determinants for
chlorophyll in vivo. Proc. Natl. Acad. Sci. U.S.A 80, 4959–4962.
Ehretsmann, C.P., Carpousis, A.J., and Krisch, H.M. (1992). Specificity of Escherichia coli
endoribonuclease RNase E: in vivo and in vitro analysis of mutants in a bacteriophage T4
mRNA processing site. Genes & Development 6, 149–159.
Eisenberg, D., Almassy, R.J., Janson, C.A., Chapman, M.S., Suh, S.W., Cascio, D., and Smith,
W.W. (1987). Some evolutionary relationships of the primary biological catalysts glutamine
synthetase and RuBisCO. Cold Spring Harb Symp Quant Biol 52, 483–490.
Eisen, J.A., Nelson, K.E., Paulsen, I.T., Heidelberg, J.F., Wu, M., Dodson, R.J., Deboy, R.,
Gwinn, M.L., Nelson, W.C., Haft, D.H., et al. (2002). The complete genome sequence of
Chlorobium tepidum TLS, a photosynthetic, anaerobic, green-sulfur bacterium. Proc. Natl.
Acad. Sci. U.S.A 99, 9509–9514.
Emeis K.-C., Sakamoto T., Wehausen R., and Brumsack H.-J. (2000). The sapropel record of the
eastern Mediterranean Sea - results of Ocean Drilling Program Leg 160. Palaeogeography,
Palaeoclimatology, Palaeoecology 158, 371–395.
References
- 122 -
Frigaard, N.-U. (1997). Light-harvesting structures in green sulfur bacteria. Odense University.
Frigaard, N.-U., Chew, A.G.M., Li, H., Maresca, J.A., and Bryant, D.A. (2003). Chlorobium
tepidum: insights into the structure, physiology, and metabolism of a green sulfur bacterium
derived from the complete genome sequence. Photosyn. Res 78, 93–117.
Ganapathy, S., Oostergetel, G.T., Wawrzyniak, P.K., Reus, M., Gomez Maqueo Chew, A., Buda,
F., Boekema, E.J., Bryant, D.A., Holzwarth, A.R., and de Groot, H.J.M. (2009). Alternating
syn-anti bacteriochlorophylls form concentric helical nanotubes in chlorosomes. Proc. Natl.
Acad. Sci. U.S.A. 106, 8525–8530.
García-Contreras, R., Celis, H., and Romero, I. (2004). Importance of Rhodospirillum rubrum
H+-Pyrophosphatase under Low-Energy Conditions. Journal of Bacteriology 186, 6651–6655.
Garcia, D., Parot, P., Verméglio, A., and Madigan, M.T. (1986). The light-harvesting complexes
of a thermophilic purple sulfur photosynthetic bacterium Chromatium tepidum. Biochimica et
Biophysica Acta (BBA) - Bioenergetics 850, 390–395.
Garcia-Pichel, F. (1999). Cyanobacteria. In Encyclopedia of Microbiology, J. Lederberg, ed.
(San Diego: Academic Press)
Gates, D.M. (1965). Energy exchange in the biosphere (New York: Harper & Row).
Van Gemerden, H., and Mas, J. (1995). Ecology of phototrophic sulfur bacteria. In
Anoxygenic photosynthetic bacteria., R. Blankenship, M.T. Madigan, and C.E. Bauer, eds.
(Dordrecht, The Netherlands: Kluwer Academic Publishers), pp. 49–85.
Glaeser, J., and Overmann, J. (1999). Selective enrichment and characterization of
Roseospirillum parvum, gen. nov. and sp. nov., a new purple nonsulfur bacterium with
unusual light absorption properties. Arch Microbiol 171, 405–416.
Glaeser, J., Bañeras, L., Rütters, H., and Overmann, J. (2002). Novel bacteriochlorophyll e
structures and species-specific variability of pigment composition in green sulfur bacteria.
Arch Microbiol 177, 475–485.
Glover, J.R., and Lindquist, S. (1998). Hsp104, Hsp70, and Hsp40: a novel chaperone system
that rescues previously aggregated proteins. Cell 94, 73–82.
Gottschalk, G. (1986). Bacterial metabolism (Springer New York).
Gudowska-Nowak, E., Newton, M.D., and Fajer, J. (1990). Conformational and environmental
effects on bacteriochlorophyll optical spectra: correlations of calculated spectra with
structural results. The Journal of Physical Chemistry 94, 5795–5801.
Guex, N., and Peitsch, M.C. (1997). SWISS-MODEL and the Swiss-PdbViewer: an environment
for comparative protein modeling. Electrophoresis 18, 2714–2723.
References
- 123 -
Heinzinger, N.K., Fujimoto, S.Y., Clark, M.A., Moreno, M.S., and Barrett, E.L. (1995).
Sequence analysis of the phs operon in Salmonella typhimurium and the contribution of
thiosulfate reduction to anaerobic energy metabolism. J Bacteriol 177, 2813–2820.
Horiuchi, T., HORIUCHI, S., and MIZUNO, D. (1959). A Possible Negative Feedback
Phenomenon controlling Formation of Alkaline Phosphomonoesterase in Escherichia coli.
Nature 183, 1529–1530.
Hussain, H., Grove, J., Griffiths, L., Busby, S., and Cole, J. (1994). A seven-gene operon
essential for formate-dependent nitrite reduction to ammonia by enteric bacteria. Mol.
Microbiol. 12, 153–163.
Jakob, U., and Buchner, J. (1994). Assisting spontaneity: the role of Hsp90 and small Hsps as
molecular chaperones. Trends in Biochemical Sciences 19, 205–211.
Jensen, M.A., Webster, J.A., and Straus, N. (1993). Rapid identification of bacteria on the basis
of polymerase chain reaction-amplified ribosomal DNA spacer polymorphisms. Appl.
Environ. Microbiol. 59, 945–952.
Jiao, N., Zhang, R., and Zheng, Q. (2010). Coexistence of Two Different Photosynthetic Operons
in Citromicrobium bathyomarinum JL354 As Revealed by Whole-Genome Sequencing.
Journal of Bacteriology 192, 1169–1170.
Karrasch, S., Bullough, P.A., and Ghosh, R. (1995). The 8.5 A projection map of the light-
harvesting complex I from Rhodospirillum rubrum reveals a ring composed of 16 subunits.
EMBO J 14, 631–638.
Kimura, Y., Hirano, Y., Yu, L., Suzuki, H., Kobayashi, M., and Wang, Z. (2008). Calcium ions
are involved in the unusual red shift of the light-harvesting 1 Q(y) transition of the core
complex in thermophilic purple sulfur bacterium Thermochromatium tepidum. JBiolChem
283, 13867–13873.
Kirk, J.T.O. (1983). Light and Photosynthesis in Aquatic Ecosystems (Cambridge: Cambridge
University Press).
Klug, G. (1993). The role of mRNA degradation in the regulated expression of bacterial
photosynthesis genes. Mol. Microbiol 9, 1–7.
Klug, G., Adams, C.W., Belasco, J., Doerge, B., and Cohen, S.N. (1987). Biological
consequences of segmental alterations in mRNA stability: effects of deletion of the
intercistronic hairpin loop region of the Rhodobacter capsulatus puf operon. EMBO J 6,
3515–3520.
Koepke, J., Hu, X., Muenke, C., Schulten, K., and Michel, H. (1996). The crystal structure of the
light-harvesting complex II (B800-850) from Rhodospirillum molischianum. Structure 4, 581–
597.
References
- 124 -
Kumarevel, T., Nakano, N., Ponnuraj, K., Gopinath, S.C.B., Sakamoto, K., Shinkai, A., Kumar,
P.K.R., and Yokoyama, S. (2008). Crystal structure of glutamine receptor protein from
Sulfolobus tokodaii strain 7 in complex with its effector l-glutamine: implications of effector
binding in molecular association and DNA binding. Nucleic Acids Research 36, 4808–4820.
Lane, D.J. (1991). 16S/23S rRNA sequencing. In Nucleic Acid Techniques in Bacterial
Systematics, E. Stackebrandt, and M. Goodfellow, eds. (Chichester UK: John Wiley & Sons),
pp. 115–175.
Larkin, M.A., Blackshields, G., Brown, N.P., Chenna, R., McGettigan, P.A., McWilliam, H.,
Valentin, F., Wallace, I.M., Wilm, A., Lopez, R., et al. (2007). Clustal W and Clustal X
version 2.0. Bioinformatics 23, 2947–2948.
De Las Peñas, A., Connolly, L., and Gross, C.A. (1997). SigmaE is an essential sigma factor in
Escherichia coli. J. Bacteriol. 179, 6862–6864.
Lin, S., and Cronan, J.E. (2011). Closing in on complete pathways of biotin biosynthesis. Mol
Biosyst.
De Long, S.K., Kinney, K.A., and Kirisits, M.J. (2008). Prokaryotic Suppression Subtractive
Hybridization PCR cDNA Subtraction, a Targeted Method To Identify Differentially
Expressed Genes. Appl. Environ. Microbiol. 74, 225–232.
López-Marqués, R.L., Pérez-Castiñeira, J.R., Losada, M., and Serrano, A. (2004). Differential
Regulation of Soluble and Membrane-Bound Inorganic Pyrophosphatases in the
Photosynthetic Bacterium Rhodospirillum rubrum Provides Insights into Pyrophosphate-
Based Stress Bioenergetics. J Bacteriol 186, 5418–5426.
Ludwig, W., Strunk, O., Westram, R., Richter, L., Meier, H., Yadhukumar, Buchner, A., Lai, T.,
Steppi, S., Jobb, G., et al. (2004). ARB: a software environment for sequence data. Nucleic
Acids Research 32, 1363–1371.
Madigan, M.T. (1984). A Novel Photosynthetic Purple Bacterium Isolated from a Yellowstone
Hot Spring. Science 225, 313–315.
Madigan, M.T. (2003). Anoxygenic phototrophic bacteria from extreme environments. Photosyn.
Res 76, 157–171.
Ma, F., Kimura, Y., Yu, L., Wang, P., Ai, X., Wang, Z., and Zhang, J. (2009). Specific Ca2+-
binding motif in the LH1 complex from photosynthetic bacterium Thermochromatium
tepidum as revealed by optical spectroscopy and structural modeling. FEBS Journal 276,
1739–1749.
Manske, A.K., Glaeser, J., Kuypers, M.M.M., and Overmann, J. (2005). Physiology and
Phylogeny of Green Sulfur Bacteria Forming a Monospecific Phototrophic Assemblage at a
Depth of 100 Meters in the Black Sea. Appl Environ Microbiol 71, 8049–8060.
References
- 125 -
Manske, A.K., Henssge, U., Glaeser, J., and Overmann, J. (2008). Subfossil 16S rRNA Gene
Sequences of Green Sulfur Bacteria in the Black Sea and Their Implications for Past Photic
Zone Anoxia. Appl.Environ.Microbiol. 74, 624–632.
Maresca, J.A., Gomez Maqueo Chew, A., Ponsatí, M.R., Frigaard, N.-U., Ormerod, J.G., and
Bryant, D.A. (2004). The bchU gene of Chlorobium tepidum encodes the c-20
methyltransferase in bacteriochlorophyll c biosynthesis. J. Bacteriol 186, 2558–2566.
Marschall, E., Jogler, M., Hessge, U., and Overmann, J. (2010). Large-scale distribution and
activity patterns of an extremely low-light-adapted population of green sulfur bacteria in the
Black Sea. Environ. Microbiol 12, 1348–1362.
Masepohl, B., Drepper, T., Paschen, A., Gross, S., Pawlowski, A., Raabe, K., Riedel, K.-U., and
Klipp, W. (2002). Regulation of nitrogen fixation in the phototrophic purple bacterium
Rhodobacter capsulatus. J. Mol. Microbiol. Biotechnol 4, 243–248.
McLuskey, K., Prince, S.M., Cogdell, R.J., and Isaacs, N.W. (2001). The Crystallographic
Structure of the B800-820 LH3 Light-Harvesting Complex from the Purple Bacteria
Rhodopseudomonas acidophila Strain 7050. Biochemistry 40, 8783–8789.
Menzel, D., Hopmans, E.C., van Bergen, P.F., de Leeuw, J.W., and Sinninghe Damsté, J.S.
(2002). Development of photic zone euxinia in the eastern Mediterranean Basin during
deposition of Pliocene sapropels. Marine Geology 189, 215–226.
Montesinos, E., Guerrero, R., Abella, C., and Esteve, I. (1983). Ecology and Physiology of the
Competition for Light Between Chlorobium limicola and Chlorobium phaeobacteroides in
Natural Habitats. Appl. Environ. Microbiol. 46, 1007–1016.
Murray, J.W., Jannasch, H.W., Honjo, S., Anderson, R.F., Reeburgh, W.S., Top, Z., Friederich,
G.E., Codispoti, L.A., and Izdar, E. (1989). Unexpected changes in the oxic/anoxic interface
in the Black Sea. Nature 338, 411–413.
Muyzer, G., and Smalla, K. (1998). Application of denaturing gradient gel electrophoresis
(DGGE) and temperature gradient gel electrophoresis (TGGE) in microbial ecology. Antonie
Van Leeuwenhoek 73, 127–141.
Muyzer, G., Hottenträger, S., Teske, A., and Waver, C. (1995). Denaturing gradient gel
electrophoresis of PCR-amplified 16S rDNA - a new molecular approach to analyse the
genetic diversity of mixed microbial communities. In Molecular microbial ecology manual,
A.D.L. Akkermans, J.D. Van Elsas, and F.J. De Bruijn, eds. (Dordrecht, The Netherlands:
Kluwer), pp. 3.4.4.1–3.4.4.22.
Nagashima, K.V., Hiraishi, A., Shimada, K., and Matsuura, K. (1997). Horizontal transfer of
genes coding for the photosynthetic reaction centers of purple bacteria. J. Mol. Evol 45, 131–
136.
References
- 126 -
Nagashima, K.V., Matsuura, K., Ohyama, S., and Shimada, K. (1994). Primary structure and
transcription of genes encoding B870 and photosynthetic reaction center apoproteins from
Rubrivivax gelatinosus. J. Biol. Chem 269, 2477–2484.
Nagashima, K.V.P., Matsuura, K., and Shimada, K. (1996). The nucleotide sequence of the puf
operon from the purple photosynthetic bacterium, Rhodospirillum molischianum:
Comparative analyses of light-harvesting proteins and the cytochrome subunits associated
with the reaction centers. Photosynthesis Research 50, 61–70.
Nyrén, P., and Strid, Å. (1991). Hypothesis: the physiological role of the membrane‐bound
proton‐translocating pyrophosphatase in some phototrophic bacteria. FEMS Microbiology
Letters 77, 265–270.
Nystrom, T. (2003). Conditional senescence in bacteria: death of the immortals. Mol Microbiol
48, 17–23.
Nyström, T. (2004). Stationary-phase phzsiology. Annual Review of Microbiology 58, 161–181.
Ochman, H., Ayala, F.J., and Hartl, D.L. (1993). Use of polymerase chain reaction to amplify
segments outside boundaries of known sequences. Meth. Enzymol 218, 309–321.
Olsen, J.D., Sockalingum, G.D., Robert, B., and Hunter, C.N. (1994). Modification of a
hydrogen bond to a bacteriochlorophyll a molecule in the light-harvesting 1 antenna of
Rhodobacter sphaeroides. Proc Natl Acad Sci U S A 91, 7124–7128.
Olsen, J.D., Sturgis, J.N., Westerhuis, W.H.J., Fowler, G.J.S., Hunter, C.N., and Robert, B.
(1997). Site-Directed Modification of the Ligands to the Bacteriochlorophylls of the Light-
Harvesting LH1 and LH2 Complexes of Rhodobacter sphaeroides. Biochemistry 36, 12625–
12632.
Olson, J.M. (1998). Chlorophyll Organization and Function in Green Photosynthetic Bacteria.
Photochemistry and Photobiology 67, 61–75.
Overmann, J. (1997). Mahoney Lake: A case study of the eco-logical significance of
phototrophic sulfur bacteria. In Advances in Microbial Ecology, J. Jones, ed. (New York:
Plenum Press), pp. 251–288.
Overmann, J. (2008). Ecology of phototrophic sulfur bacteria. In Sulfur metabolism in
phototrophic organisms, R. Hell, C. Dahl, D. Knaff, and T. Leustek, eds. (Dordrecht, The
Netherlands: Springer), pp. 375–396.
Overmann, J., and Garcia-Pichel, F. (2000). The phototrophic way of life. In The Prokaryotes,
M. Dworkin, ed. (New York: Springer), pp. 32–85.
Overmann, J., Coolen, M.J., and Tuschak, C. (1999). Specific detection of different phylogenetic
groups of chemocline bacteria based on PCR and denaturing gradient gel electrophoresis of
16S rRNA gene fragments. Arch. Microbiol 172, 83–94.
References
- 127 -
Overmann, J., Cypionka, H., and Pfennig, N. (1992a). An Extremely Low-Light-Adapted
Phototrophic Sulfur Bacterium from the Black Sea. Limnology and Oceanography 37, 150–
155.
Overmann, J., Fischer, U., and Pfennig, N. (1992b). A new purple sulfur bacterium from saline
littoral sediments, Thiorhodovibrio winogradskyi gen. nov. and sp. nov. Archives of
Microbiology 157, 329–335.
Pandhal, J., Wright, P.C., and Biggs, C.A. (2007). A quantitative proteomic analysis of light
adaptation in a globally significant marine cyanobacterium Prochlorococcus marinus MED4.
J. Proteome Res 6, 996–1005.
Papiz, M.Z., Prince, S.M., Howard, T., Cogdell, R.J., and Isaacs, N.W. (2003). The structure and
thermal motion of the B800-850 LH2 complex from Rps.acidophila at 2.0A resolution and
100K: new structural features and functionally relevant motions. J. Mol. Biol 326, 1523–
1538.
Passier, H.F., Bosch, H.-J., Nijenhuis, I.A., Lourens, L.J., Bottcher, M.E., Leenders, A., Damste,
J.S.S., de Lange, G.J., and Leeuw, J.W. (1999). Sulphidic Mediterranean surface waters
during Pliocene sapropel formation. Nature 397, 146–149.
Permentier, H.P., Neerken, S., Overmann, J., and Amesz, J. (2001). A bacteriochlorophyll a
antenna complex from purple bacteria absorbing at 963 nm. Biochemistry 40, 5573–5578.
Pfennig, N. (1978). General physiology and ecology of photosynthetic bacteria. In The
Photosynthetic Bacteria, R. Clayton, and W. Sistrom, eds. (New York: Plenum Press), pp. 3–
18.
Pierson, B.K., Sands, V.M., and Frederick, J.L. (1990). Spectral Irradiance and Distribution of
Pigments in a Highly Layered Marine Microbial Mat. Appl Environ Microbiol 56, 2327–
2340.
Rabold, S., Gorlenko, V.M., and Imhoff, J.F. (2006). Thiorhodococcus mannitoliphagus sp. nov.,
a purple sulfur bacterium from the White Sea. International Journal of Systematic and
Evolutionary Microbiology 56, 1945–1951.
Rey, F.E., Oda, Y., and Harwood, C.S. (2006). Regulation of Uptake Hydrogenase and Effects of
Hydrogen Utilization on Gene Expression in Rhodopseudomonas palustris. J. Bacteriol. 188,
6143–6152.
Roszak, A.W., Howard, T.D., Southall, J., Gardiner, A.T., Law, C.J., Isaacs, N.W., and Cogdell,
R.J. (2003). Crystal Structure of the RC-LH1 Core Complex from Rhodopseudomonas
palustris. Science 302, 1969–1972.
Sambrook, J., and Russell, D.W. (2001). Molecular cloning: a laboratory manual (CSHL Press).
References
- 128 -
Schmid, M., Schmitz-Esser, S., Jetten, M., and Wagner, M. (2001). 16S-23S rDNA intergenic
spacer and 23S rDNA of anaerobic ammonium-oxidizing bacteria: implications for phylogeny
and in situ detection. Environ. Microbiol 3, 450–459.
Schmitz, R.A., Klopprogge, K., and Grabbe, R. (2002). Regulation of nitrogen fixation in
Klebsiella pneumoniae and Azotobacter vinelandii: NifL, transducing two environmental
signals to the nif transcriptional activator NifA. J. Mol. Microbiol. Biotechnol 4, 235–242.
Schwarz, G., and Mendel, R.R. (2006). Molybdenum cofactor biosynthesis and molybdenum
enzymes. Annu Rev Plant Biol 57, 623–647.
Serrano, A., Pérez-Castiñeira, J.R., Baltscheffsky, M., and Baltscheffsky, H. (2007). H+-PPases:
yesterday, today and tomorrow. IUBMB Life 59, 76–83.
Sharma, U.K., and Chatterji, D. (2010). Transcriptional switching in Escherichia coli during
stress and starvation by modulation of σ70 activity. FEMS Microbiology Reviews 34, 646–
657.
Siefert, E., and Pfennig, N. (1984). Convenient method to prepare neutral sulfide solution for
cultivation of phototrophic sulfur bacteria. Archives of Microbiology 139, 100–101.
Sieker, L.C., Jensen, L.H., and LeGall, J. (1986). Preliminary X-ray studies of the tetra-heme
cytochrome c3 and the octa-heme cytochrome c3 from Desulfovibrio gigas. FEBS Letters
209, 261–264.
Sinninghe Damste, J.S., Wakeham, S.G., Kohnen, M.E.L., Hayes, J.M., and de Leeuw, J.W.
(1993). A 6,000-year sedimentary molecular record of chemocline excursions in the Black
Sea. Nature 362, 827–829.
Sorokin, Y. (2002). The Black Sea. Ecology and oceanography (Leiden, The Netherlands:
Backhuys).
Stomp, M., Huisman, J., Stal, L.J., and Matthijs, H.C.P. (2007). Colorful niches of phototrophic
microorganisms shaped by vibrations of the water molecule. ISME J 1, 271–282.
Sturgis, J.N., Olsen, J.D., Robert, B., and Hunter, C.N. (1997). Functions of Conserved
Tryptophan Residues of the Core Light-Harvesting Complex of Rhodobacter sphaeroides.
Biochemistry 36, 2772–2778.
Tsutakawa, S.E., Jingami, H., and Morikawa, K. (1999). Recognition of a TG Mismatch: The
Crystal Structure of Very Short Patch Repair Endonuclease in Complex with a DNA Duplex.
Cell 99, 615–623.
Tuschak, C., Beatty, J., and Overmann, J. (2004). Photosynthesis Genes and LH1 Proteins of
Roseospirillum parvum 930I, a Purple Non-Sulfur Bacterium with Unusual Spectral
Properties. Photosynthesis Research 81, 181–199.
References
- 129 -
Tuschak, C., Leung, M., Beatty, J., and Overmann, J. (2005). The puf operon of the purple sulfur
bacterium Amoebobacter purpureus : structure, transcription and phylogenetic analysis. Arch
Microbiol 183, 431–443.
Voelker, U., Voelker, A., and Haldenwang, W.G. (1996). Reactivation of the Bacillus subtilis
anti-sigma B antagonist, RsbV, by stress- or starvation-induced phosphatase activities. J.
Bacteriol 178, 5456–5463.
Wang, Z.-Y., Gokan, K., Kobayashi, M., and Nozawa, T. (2005). Solution structures of the core
light-harvesting alpha and beta polypeptides from Rhodospirillum rubrum: implications for
the pigment-protein and protein-protein interactions. J. Mol. Biol 347, 465–477.
Widdel, F., Kohring, G.W., and Mayer, F. (1983). Studies on dissimilatory sulfate-reducing
bacteria that decompose fatty acids. III. Characterisation of the filamentous gliding
Desulfonema Limicola gen. nov., spec. nov., and Desulfonema magnum sp. nov. Arch.
Microbiol. 134, 286–293.
Wiessner, C., Dunger, I., and Michel, H. (1990). Structure and transcription of the genes
encoding the B1015 light-harvesting complex beta and alpha subunits and the photosynthetic
reaction center L, M, and cytochrome c subunits from Rhodopseudomonas viridis. J. Bacteriol
172, 2877–2887.
Willison, J.C., Jouanneau, Y., Colbeau, A., and Vignais, P.M. (1983). H2 metabolism in
photosynthetic bacteria and relationship to N2 fixation. Ann. Microbiol. (Paris) 134B, 115–
135.
Yutin, N., and Béjà, O. (2005). Putative novel photosynthetic reaction centre organizations in
marine aerobic anoxygenic photosynthetic bacteria: insights from metagenomics and
environmental genomics. Environ. Microbiol 7, 2027–2033.
Zuber, H., and Brunisholz, R. (1991). Structure and function of antenna polypeptides and
chlorophyll-protein complexes: Principles and variability. In Chlorophylls, H. Sheer, ed.
(Boca Raton, FL: CRC Press), pp. 627–703.
Zuber, H., and Cogdell, R. (1995). Structure and Organization of Purple Bacterial Antenna
Complexes. In Anoxygenic Photosynthetic Bacteria, R. Blankenship, ed. (Springer
Netherlands), pp. 315–348.
Zuker, M. (2003). Mfold web server for nucleic acid folding and hybridization prediction.
Nucleic Acids Research 31, 3406–3415.

- 130 -
Publications
Publications originating from this thesis
Rücker O, Köhler A, Behammer B, Sichau K, Overmann J. (2012). Puf operon sequences
and inferred structures of light-harvesting complexes of three closely related Chromatiaceae
exhibiting different absorption characteristics. Arch Microbiol, Vol. 194, Nr. 2, Page 123-134
- 131 -
Danksagung
Zuallererst möchte ich mich bei Herrn Prof. Dr. Jörg Overmann für die Bereitstellung dieses
spannenden Themas und natürlich für die hervorragende wissenschaftliche Betreuung bedanken.
Mein Dank gilt Herrn Prof. Dr. Tomas Hanson, Prof. Tom Beatty und Dr. Alessandro Sacca für
die professionelle und hilfreiche Zusammenarbeit bei diesen interessanten Projekten.
Großer Dank gilt der gesamten AGO für das freundschaftliche Arbeitsklima und die
immerwährende Hilfsbereitschaft. Ein Extra-Dankeschön möchte ich meinen Kollegen Mareike
Jogler und Johannes Müller für die gemeinsame WG-Zeit in Braunschweig, sowie Annemarie
Hütz und Roland Wenter für die super Zusammenarbeit im Labor und die vielen schönen
gemeinsamen Unternehmungen aussprechen.
Außerdem bedanke ich mich bei Carie Franz und Dr. Christian Jogler für den gemeinsamen Spaß
an der Forschung sowie für die zahlreichen Diskussionen über Mikrobiologie und darüber
hinaus.
Ganz besonders herzlich danke ich meiner Frau Ursula Rücker für ihre Geduld, ihr Verständnis
und ihre Einfühlsamkeit, die mir immer wieder neue Kraft gegeben hat.
Abschließend bedanke ich mich bei Hannelore Rücker, meiner Familie und meinen Freunden für
Ihre Unterstützung und dass sie an mich geglaubt haben.
- 132 -
Curriculum vitae
Name Ovidiu Ludwig Rücker
Date of birth 01.07.1978
Place of birth Timişoara, Romania
University education
since 09.2007 Ph.D thesis in the group of Prof. Dr. Jörg Overmann at the LMU Munich;
Professional experience
01.2006 – 10.2007 Scientific Assistant at the Center of Excellence for Fluorescent
Bioanalytics (KFB), University of Regensburg
University education
10.2004 – 09.2005 Diploma Thesis at the University of Regensburg: „Characterisation of
silencing-deficiant mutants of the green alga Chlamydomonas reinhardtii“
10.2003 – 04.2004 Research Project at the University of Uppsala, Sweden
10.1999 – 09.2005 Study of biology at the University of Regensburg (Diploma)
Specialization: microbiology, cell biology, botany
School education
1996 – 1998 Abitur at the Sophien-Gymnasium in Weimar
1993 – 1996 Secondary School „Lenau Lyzeum“ in Timisoara
1984 – 1992 Primary school „Scoala Generala Nr. 3“ in Timisoara