mobility models for systems evaluation a survey - the computer
TRANSCRIPT

Chapter 1
Mobility Models for SystemsEvaluationA Survey
Mirco Musolesi, Dartmouth College, USA
Cecilia Mascolo, University of Cambridge, UK
1.1 Introduction
Mobility models are used to simulate and evaluate the performance of mo-bile wireless systems and the algorithms and protocols at the basis of them.The definition of realistic mobility models is one of the most critical and, atthe same time, difficult aspects of the simulation of applications and systemsdesigned for mobile environments. There are essentially two possible types ofmobility patterns that can be used to evaluate mobile network protocols andalgorithms by means of simulations: traces and synthetic models [15]. Tracesare obtained by means of measurements of deployed systems and usually con-sist of logs of connectivity or location information, whereas synthetic modelsare mathematical models, such as sets of equations, which try to capture themovement of the devices.
Currently, there are very few and very recent public data repository oftraces capturing movement of people. Examples are GPS traces and Blue-tooth connectivity traces (i.e., traces containing the Bluetooth identifiers ofthe devices that have been in radio range of a device). For instance, re-searchers at the Intel Research Laboratory and the University of Cambridgedistributed Bluetooth devices to people, in order to collect data about humanmovements and study the characteristics of the colocation patterns amongpeople. These experiments were firstly conducted among students and re-searchers in Cambridge [17] and then among the participants of INFOCOM2005 [37]. Examples of similar projects are the Wireless Topology Discov-ery project at UCSD [57] and the campus-wide WiFi traffic measurementsthat have been carried out at Dartmouth College [31]. At this institution, aproject with the aim of creating a repository of publicly available traces forthe mobile networking community has also been started [46].
In general, synthetic models have been largely preferred [15]. The reasonsof this choice are many. First of all, as mentioned, the publicly availabletraces are limited. Telecommunication companies usually collect and ana-
1

lyze large sets of data but these are kept secret since they may represent asource of competitive advantage, for example, for investments and marketingchoices. Secondly, these traces are related to very specific scenarios (such ascampus environments) and it is currently difficult to generalize their validity.However, it is important to note that these data show surprising commonstatistical characteristics, such as the same distribution of the duration ofthe contacts and inter-contacts intervals1. Thirdly, the available traces donot allow for sensitivity analysis of the performance of algorithms, since thevalues of the parameters that characterize the simulation scenarios, such asthe distribution of the speed or the density of the hosts, cannot be varied.Finally, in some cases, it may be important to have a mathematical modelunderlying the movement of the hosts in simulations, in order to formallyanalyze its impact on the design of protocols and systems.
For these reasons, many mobility models for the generation of synthetictraces have been presented [15]. The most widely used of such models arebased on random individual movements; the simplest, the Random Walkmobility model (equivalent to Brownian motion), is used to represent purerandom movements of the entities of a system [23]. Another widely adoptedrandom model is the Random Way-Point mobility model [41], in which pausesare introduced between changes in direction or speed. More recently, a largenumber of more sophisticated random mobility models for ad hoc networkresearch have been presented [50, 39, 55].
However, all synthetic models are suspect because it is quite difficult toassess to what extent they map reality. It is not hard to see, even only withempirical observations, that the random mobility models generate behaviorthat is most unhuman-like. This analysis is confirmed by the examination ofthe available real traces [46]. As we will discuss later in this chapter, mobilitymodels based on random mechanisms generate traces that show properties(such as distributions of the duration of the contacts between the mobilenodes and the inter-contacts time between two subsequent connections) thatare different from those observed in real scenarios2.
1 We define contact duration as the time interval during which two devices are in radiorange. We define inter-contacts time as the time interval between two contacts. Theseindicators are particularly important in ad hoc networking and, in particular, in delaytolerant mobile ad hoc networks [59, 29], since inter-contacts times define the frequencyand the probability of being in contact with the recipient of a message or a potentialmessage carrier in a given time period.2 However, as we will discuss in Section 1.4, Karagiannis et alii in [43] demonstrate thatthe inter-contacts time distributions generated by means of classic random mobility modelssuch as the Random Way-Point model show properties that can also be observed in realtraces such as power-law behavior in a certain range of values and an exponential tail aftera characteristic time. Power-law distributions are characterized by the following form:
P (x) = x−k
with k ≥ 0. A power-law distribution is also called scale-free since it remains unchangedto within a multiplicative factor under a re-scaling of the independent variable x [66].
2

An alternative approach to the problem of modeling human mobility isdesigning synthetic models starting from real traces. The challenge is to cap-ture and model the key statistical properties of the traces in order to be ableto reproduce and, possibly, to generalize them providing sets of realistic inputdata for simulators. The first examples of this kind of models are [35, 88],in which the authors considered, respectively, the movement traces collectedfrom a campus scenario and direct empirical observations of pedestrians indowntown Osaka as a basis of the design of their models. Many refined modelshave been presented in the last years such as [38, 53, 101, 45]. A key researcharea is the analysis and mathematical characterization of the available traces.The goal is to derive the fundamental properties of human mobility and con-nectivity. In fact, connectivity models derived from the analysis of the traceshave also been proposed [14, 103]. Finally, another promising approach isthe application of social network theory results to the design of mobilitymodels, since mobile devices are carried by humans and, therefore, the re-sulting mobility and connectivity patterns are strongly influenced by humanrelationships [61].
This paper is organized as follows: in Section 1.2 we outline the mostsignificant examples of synthetic mobility models, whereas in Section 1.3we present the recent research efforts in exploiting traces to build realisticmobility models. Then, in Section 1.4 we discuss some key results in humanmobility modeling from an analytical point view. In Section 1.5 we presentan overview of the concepts at the basis of the design of mobility modelsbased on social networks. The design of connectivity models is discussedin Section 1.6. Section 1.7 provides a brief overview of the available toolsfor protocol simulations and mobile systems testing. Finally, a roadmap forfuture research in the field of mobility modeling is outlined in Section 1.8.
1.2 Purely Synthetic Models
We firstly consider the class of purely random synthetic mobility models. Weoutline the main characteristics of these models and the most recent relevantresults about the analytical characterization of such models. In [15] Camp,Boleng and Davids provide an excellent survey of the most relevant andpopular random synthetic mobility models used in ad hoc network research.
1.2.1 Random Walk Mobility Model
The simplest mobility model is the Random Walk mobility model [23, 62],also called Brownian motion; it is a widely used model to represent purelyrandom movements of the entities of a system in various disciplines from
3

physics to meteorology. However, it cannot be considered as a suitable modelto simulate wireless environments, since human movements do not presentthe continuous changes of direction that characterize this mobility model.
1.2.2 Random Way-Point Mobility Model
Another example of random mobility model is the Random Way-Point mobil-ity model [41]. This can be considered as an extension of the Random Walkmobility model, with the addition of pauses between changes in direction orspeed. However, also in this case, the realism of the model in terms of geo-graphical movement is far from being realistic. First of all, the initial place-ment of the nodes in the network does not mirror any real-world situation3.The model also suffers from the fact that the nodes concentrate in the middleof the area if we consider a bounded area. A possible solution is to assumespherical or toroidal surfaces, but clearly these geometrical abstractions areutterly unrealistic. An additional problem is related to the stationarity of themodel (i.e., the variance of the characteristics of the model over time). Thismodel suffers from the fact that the transient (i.e., non-stationary) regimemay last for a very long time. One method for avoiding such a bias is toremove the initial part of the simulations in order to avoid the transientregime. However, this does not guarantee that the simulation has reacheda stationary regime, since the time that is necessary to reach a stationaryregime may be longer than the duration of the simulation itself. Finally, ithas also been shown that the model also exhibits speed decay over time [99].A partial solution to this problem have been proposed in [100].
In [50, 51], the authors present a generalization of the Random Walk andRandom Way-Point mobility models that they call Random Trip model. Theauthors introduce a technique to sample the initial simulation state fromthe stationary regime (a methodology that is usually called perfect simula-
tion) based on Palm Calculus [49] in order to solve the problem of reachingtime-stationarity. Perfect simulation for the Random Way-Point model wasoriginally proposed by Navidi and Camp in [63].
The analytical properties of the Random Way-Point model have been an-alyzed in several works from different perspectives such as the stationary dis-tribution of nodes [9, 10], the node spatial distribution [75] and the evolutionof the distribution of the nodes by means of partial differential equations [26].
3 As discussed in the introduction, this position has been disputed in [43]. We will presentmore details about this current discussion in the community in Section 1.4.
4

1.2.3 Other Synthetic Single Node Mobility Models
Starting from the Random Walk and Random Way-Point models, many varia-tions have been proposed. The common characteristic of this class of modelsis that the movements of the nodes are independent from each other andthat the movements are based on random distributions. Notable examplesinclude the Random Direction mobility model [62], the Gauss-Markov mo-bility model [54] and the Smooth Random mobility model [8]. The choice ofthese mobility models is usually driven by the need of using a model that iseasily mathematically tractable.
Other random mobility models were designed with the goal of reproducingmovements in a urban space. The movements of the nodes are constrainedby the topology of streets and their associated maximum speed. Examples ofthis class of models are the City section [15], the Freeway and the Manhattanmodels [4]. These models are particularly useful for applications of ad hocmobile networking technologies to vehicular settings.
1.2.4 Synthetic Group Mobility Models
These models and similar existing ones are used to represent the movementsof single mobile nodes, however, in some situations the behavior of mobilehosts that move together, such as platoons of soldiers, group of students orcolleagues and so on need to be modeled. For these reasons, group mobilitymodels have been devised such as the Reference Group mobility model [34],the Reference Velocity Group mobility model [95] and the Structured Groupmobility model [12]. These models are based on a set of equations that linkthe movements of a node to the positions of a subset of the other nodes ofthe network. These models are useful to reproduce scenarios characterizedby the presence of clusters of people, however, the generated movements donot map those observed in the real worlds since the groups move randomlyin the simulation space. The membership mechanisms are also usually hard-wired and single nodes cannot join other groups during the simulation time.Recently, Piorkowski et alii propose a synthetic model called HeterogeneousRandom Walk [74] that is able to reproduce the presence of clusters thatare observed in real-world traces. The goal of this model is to have a math-ematically tractable model to study and explain the emergence of clusterednetworks.
5

1.2.5 Modeling Obstacles
Another key issue is the modeling of obstacles (such as buildings and walls)in simulation scenarios. This problem is highly intertwined with the defini-tion of realistic radio propagation models [80]. This is an open research areaand very few solutions have been proposed. The most remarkable solutionis probably [39], where the authors present a technique for the creation ofmore realistic mobility models that include the presence of obstacles. Thespecification of obstacles is based on the use of Voronoi graphs in order toderive the possible pathways in the simulation space. The approach proposedby the authors is general and can be applied to other mobility models.
1.3 Trace-based Mobility Models
In recent years, many researchers have tried to refine existing models in orderto make them more realistic by exploiting the available mobility traces [46].The key underlying idea of these models is the exploitation of available mea-surements such as connectivity logs to generate synthetic traces that arecharacterized by the same statistical properties of the real ones.
Various pioneering measurement studies have been conducted both ininfrastructure-based and infrastructure-less environments since the first wire-less networks have been deployed. Extensive measurements about the usageof the early deployed Wireless Local Area Networks (WLANs) have beenconducted, for instance, in [87], in [5], and in [6]. A detailed analysis of theusage of the WLAN of the Dartmouth College campus is presented in [31].
The first examples of mobility models are based on traces of WLAN cam-pus usage. In [88] a mobility model based on real data from the campusWLAN at ETH in Zurich is presented. The authors use a simulation area di-vided into squares and derive the probability of transitions between adjacentsquares from the data of the access points. Also in this case, the session du-ration data follow a power-law distribution. This approach can be consideredas a refined version of the Weighted Way-Point mobility model [11, 35]. Theauthors of this model represent the probability of user movements betweendifferent areas of the USC campus by means of a Markov model. The modelis extracted from data collected from user surveys (i.e, the users were askedto keep a diary of their movements for one month).
The Model T and it evolution, the Model T++, proposed in [38] and [53]generate traces also mirroring the spatial registration patterns of user move-ments inside a campus WLAN (i.e., the connections to the access pointsspread in the campus area). The authors define the concept of popularitygradient between different access points and its influence on users’ move-ments. This model is evaluated using traces from Dartmouth College. In [101]another model extracted from real traces based on the study of probability
6

of transitions between different locations is presented. The evaluation of themodel is essentially based on the matching of the geographical movementsand density of users, rather than on the analysis of the patterns of connec-tivity among them.
A mobility model based on the extraction of user mobility characteristicsfrom the wireless network traces of the Dartmouth College WLAN is pre-sented in [45]. The authors define popular regions in the campus and char-acterize the transitions among these areas by means of a Markovian model.Another key finding of the authors is the fact that pause time and speedfollow log-normal distributions. These models only represent the transitionsbetween five and sixth locations respectively. The data present characteris-tics, similar to [45], that evidently differ from those generated by means ofclassic synthetic random mobility models. In [76] Resta and Santi present amodel of user movement between access points driven by the quality of ser-vice perceived by the users themselves. This approach is very generic and itis composed of different models that allow for the simulation of user mobility,network traffic, underlying wireless technology and quality of service.
Another interesting model representing the movement inside downtownOsaka is discussed in [55]: the authors reproduce the movements of pedestri-ans by analyzing the characteristics of the crowd in subsequent instants oftime and maps of the city using an empirical methodology, without relyingon any wireless measurements.
With respect to mobility models for vehicular networks, a large amountof traces mapping the movements of vehicles in cities and in highways arecollected by the traffic authorities but they are not publicly available also forsecurity reasons. Starting from these traces and from empirical observations,several models have been recently presented. Examples include the modelproposed by Saha and Johnson [79] extracted from the TIGER traces [90],GrooveSim [56] and STRAW [19].
Finally, a model for the generation of the inter-contacts time duration be-tween buses derived from the log traces of the DieselNet is presented in [103].We note that this is not a mobility model, but a connectivity model, i.e., itis used to represent topological and not geographical information over time.We will discuss these models in detail in Section 1.6.
1.4 Characterization and Analytical Models of Human
Connectivity
A number of pioneering works [87, 5, 6, 31] have been focussed on traces inorder to gain insight about human mobility patterns. A key study in this areais the work on connectivity patterns presented by Chaintreau et alii in [18]which illustrates the fundamental insight that contacts duration and inter-contacts time between individuals can be represented by means of power-law
7

distributions and that these patterns may be used to develop more efficientopportunistic protocols.
The work confirms the results of other studies conducted at Dartmouth [31],UCSD [57] and University of Toronto [86]. At the same time, it is interestingto note that these observed connectivity patterns are at odds with those thatcan be extracted from random mobility models that show an exponentialdecay of inter-contacts time intervals [83]. In a previous work [37], similarconnectivity patterns have also been observed among the participants of IN-FOCOM’05.
Recently, Karagiannis, Le Boudec and Vojnovic in [43] offered a novelperspective to the problem of the approximation of these distributions. Theauthors consider 6 sets of traces and derive several analytical results thatcan be summarized as follows. First of all, the authors verify the power-lawdecay of inter-contacts time CCDF between mobile devices. Secondly, theydemonstrate that beyond a characteristic time of about 12 hours the CCDFexhibits exponential decay. This is the major novel contribution, especiallywith respect to the findings presented in [18]. Thirdly, they present an ana-lytical framework demonstrating that mobility models such as the RandomWay-Point model should not be abandoned since they are able to representpower-law decay of inter-contact time with an exponential tail after this char-acteristic time. Finally, they show that the return time of mobile nodes tothe same location can be modeled by means of a function composed of ascale-free distribution for a certain range between 0 and a characteristic timewith an exponential tail.
Connectivity patterns have been studied by the authors of the aforemen-tioned Model T [38] and Model T++ [53]. The main result of these studies isthat user registration patterns exhibit a distinct hierarchy, and that WLANaccess points (APs) can be clustered based on registration patterns. Clustersize distributions, intra-cluster transition probabilities and trace lengths arehighly skewed and can be modeled by a heavy-tailed Weibull distribution witha good degree of approximation. The fraction of popular APs in a cluster, asa function of cluster size, can be modeled by exponential distributions.
The spatio-temporal correlation in the user registration patterns has alsobeen investigated in [52]. The mobility patterns are modeled using a semi-Markov process by means of the transition probability matrix. The authorsestimate the long-term wireless network usage among different access points.By comparing the steady-state distributions of semi-Markov models basedon trace data collected at different time scales, they characterize the degreeof correlation in time and location. The analysis is founded on the logs fromDartmouth College [47]. An analysis of the periodic properties of the move-ments between access points using Fourier transforms is presented in [44].
Rhee et alii proposed a possible modelization of human movement bymeans of Levy flights [77] but the analysis show that this approximation isvalid only considering a coarse-grained geographical scale. Recently, Gonza-lez et alii [28] present the analysis of the movements of 100.000 mobile phone
8

users by analyzing their registration patterns. According to this study humantrajectories show a high degree of temporal and spatial regularity; each userusually move between a few highly frequented locations. They also disprovethe theory that a pure Levy flights model can be used to represent humantrajectories, since random jumps typical of this model are not observed intheir traces.
We would also like to mention briefly the considerable amount of workdone by mathematical biologists in modeling animal movements [89]. Oneof the most interesting studies is that about animal foraging behavior. Itwas believed that the movement of animals for foraging can be modeled bymeans of Levy flights; many different species have been studied includingalbatrosses [93], deer [94] and grey seals [2]. Levy flights are random walkscharacterized by step lengths extracted from probability distributions withheavy tails: the result is that sequences of short steps are followed by rare longsteps. However, in a study published on Nature in 2007 [22], by reanalyzingthe data about albatrosses, the authors conclude that the movement can bemodeled with gamma distributions with an exponential decay and not bymeans of a Levy flights model.
1.5 Social Network based Mobility Models
In this section we discuss a recent development of mobility modeling [61], i.e.,the introduction of social networking concepts as a basis of the representationof people movements. These models are usually trace based, i.e., they aregenerally founded or evaluated by means of real traces. The modeling ofthese relationships and their implications to human mobility is of paramountimportance to test protocols and systems that exploit the underlying socialstructure, such as socially-aware delay tolerant forwarding protocols [21, 20].
Social network mobility models are based on a simple observation. In mo-bile networks, devices are usually carried by humans, so the movement ofsuch devices is necessarily based on human decisions and social behavior. Akey characteristic is the presence of clusters that are usually dependent onthe relationships among the members of the social group. In order to capturethis type of behavior, mobility models dependent on the structure of the re-lationships among people carrying the devices have been defined. However,existing group mobility models fail to capture this social dimension [15]4.
4 These mobility models can also be used to test other types of networks. Within theemerging field of sensor networks, mobile hosts are not necessarily carried directly byhumans. However, sensor networks are usually embedded in artifacts and vehicles (such ascars, planes or clothing) or are spread across a geographical area (such as environmentalsensors). In the former case, the movements of the sensors embedded in cars or in airplanes,for instance, are not random but are dependent on the movements of the carriers; in thelatter, movement is not generally a major issue.
9

1.5.1 Social Network Models
In recent years, social networks have been investigated in considerable detail,both in sociology [97] and in other areas, most notably mathematics andphysics [1]. Various types of networks (such as the Internet, the World WideWeb and biological networks) have been studied by researchers especially inthe statistical physics community. Theoretical models have been developedto reproduce the properties of these networks, such as the so-called smallworlds model proposed in [98] or various scale-free models [65, 92]. Excellentreviews of the recent advances in complex and social networks analysis canbe found in [1] and [65].
As discussed in [68], social networks appear to be fundamentally differentfrom other types of networked systems. In particular, even if social networkspresent typical small-worlds behavior in terms of the average distance be-tween pairs of individuals (the so-called average path length), they show agreater level of clustering. In [68] the authors observe that the level of clus-tering seen in many non-social systems is no greater than in those generatedusing pure random models. Instead in social networks, clustering appearsto be far greater than in networks based on stochastic models. The authorssuggest that this is strictly related to the fact that humans usually organizethemselves into communities. Examples of social networks used for these stud-ies are rather diverse and include, for instance, networks of coauthorships ofscientists [64] and the actors in films with Kevin Bacon [98].
1.5.2 The Community Based Mobility Model
In [60] the authors propose the Community based mobility model, founded onsocial network theory5. A key input of the mobility model is the social networkthat links the individuals carrying the mobile devices in order to generaterealistic synthetic network structures [98]. The model allows collections ofhosts to be grouped together in a way that is based on social relationshipsamong the individuals. This grouping is only then mapped to a topographicalspace, with topography biased by the strength of social ties. The movementsof the hosts are also driven by the social relationships among them. The modelalso allows for the definition of different types of relationships during a certainperiod of time (i.e., a day or a week). For instance, it might be important tobe able to describe that in the morning and in the afternoon of weekdays,relationships at the workplace are more important than friendships and familyone, whereas the opposite is true during the evenings and weekends.
The model is evaluated by means of real mobility traces provided by theIntel Research Laboratory [82]; the authors show that the model provides
5 This model can be considered an evolution of the basic model initially proposed in [58].
10
0.76
0.640.32 0.67
0.57
0.54
0.83
0.69
0.41
0.84
0.610.65
A B
C D E
F
0.45
H I
L
G
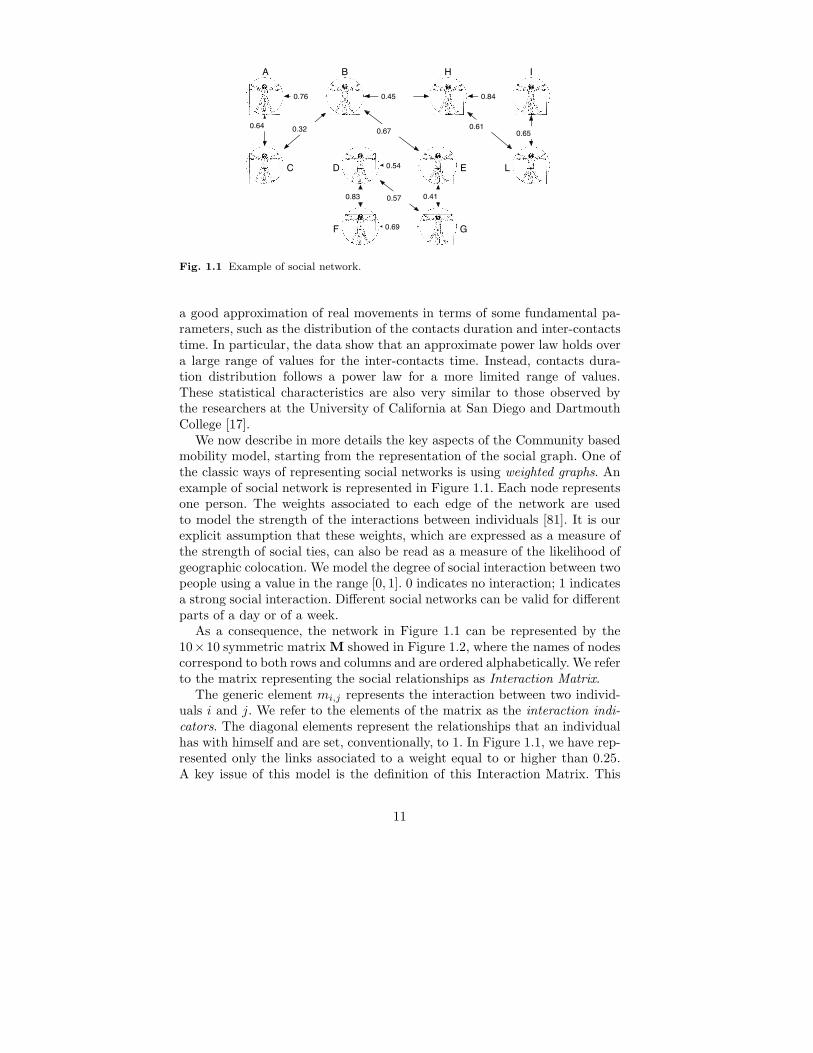
Fig. 1.1 Example of social network.
a good approximation of real movements in terms of some fundamental pa-rameters, such as the distribution of the contacts duration and inter-contactstime. In particular, the data show that an approximate power law holds overa large range of values for the inter-contacts time. Instead, contacts dura-tion distribution follows a power law for a more limited range of values.These statistical characteristics are also very similar to those observed bythe researchers at the University of California at San Diego and DartmouthCollege [17].
We now describe in more details the key aspects of the Community basedmobility model, starting from the representation of the social graph. One ofthe classic ways of representing social networks is using weighted graphs. Anexample of social network is represented in Figure 1.1. Each node representsone person. The weights associated to each edge of the network are usedto model the strength of the interactions between individuals [81]. It is ourexplicit assumption that these weights, which are expressed as a measure ofthe strength of social ties, can also be read as a measure of the likelihood ofgeographic colocation. We model the degree of social interaction between twopeople using a value in the range [0, 1]. 0 indicates no interaction; 1 indicatesa strong social interaction. Different social networks can be valid for differentparts of a day or of a week.
As a consequence, the network in Figure 1.1 can be represented by the10×10 symmetric matrix M showed in Figure 1.2, where the names of nodescorrespond to both rows and columns and are ordered alphabetically. We referto the matrix representing the social relationships as Interaction Matrix.
The generic element mi,j represents the interaction between two individ-uals i and j. We refer to the elements of the matrix as the interaction indi-
cators. The diagonal elements represent the relationships that an individualhas with himself and are set, conventionally, to 1. In Figure 1.1, we have rep-resented only the links associated to a weight equal to or higher than 0.25.A key issue of this model is the definition of this Interaction Matrix. This
11

M =
2
6
6
6
6
6
6
6
6
6
6
6
6
6
6
4
1 0.76 0.64 0.11 0.05 0 0 0.12 0.15 00.76 1 0.32 0 0.67 0.13 0.23 0.43 0 0.050.64 0.32 1 0.13 0.24 0 0 0.15 0 00.11 0 0.13 1 0.54 0.83 0.57 0 0 00.05 0.67 0.24 0.54 1 0.2 0.41 0.2 0.23 00 0.13 0 0.83 0.2 1 0.69 0.15 0 00 0.23 0 0.57 0.41 0.69 1 0.18 0 0.12
0.12 0.43 0.15 0 0.2 0.15 0.18 1 0.84 0.610.15 0 0 0 0.23 0 0 0.84 1 0.650 0.05 0 0 0 0 0.12 0.61 0.65 1
3
7
7
7
7
7
7
7
7
7
7
7
7
7
7
5
Fig. 1.2 Example of an Interaction Matrix representing a simple social network.
C =
2
6
6
6
6
6
6
6
6
6
6
6
6
6
6
4
1 1 1 0 0 0 0 0 0 01 1 1 0 1 0 0 1 0 01 1 1 0 0 0 0 0 0 00 0 0 1 1 1 1 0 0 00 1 0 1 1 0 1 0 0 00 0 0 1 0 1 1 0 0 00 0 0 1 1 1 1 0 0 00 1 0 0 0 0 0 1 1 10 0 0 0 0 0 0 1 1 10 0 0 0 0 0 0 1 1 1
3
7
7
7
7
7
7
7
7
7
7
7
7
7
7
5
Fig. 1.3 Example of a Connectivity Matrix representing a simple social network.
is clearly a simplified model of human relationships. The definition of theseweights is an open research area also in sociology [97].
The Interaction Matrix is also used to generate a Connectivity Matrix.From matrix M we generate a binary matrix C where a 1 is placed as anentry cij if and only if mi,j is greater than a specific threshold t (i.e., 0.25).The Connectivity Matrix extracted by the Interaction Matrix in Figure 1.2is showed in Figure 1.3. The idea behind this is that we have an interaction
threshold above which we say that two people are interacting as they have astrong relationship.
The Interaction Matrix (and, consequently, the Connectivity Matrix) canbe derived by available data (for example, from a sociological investigation) orusing mathematical models that are able to reproduce characteristics of realsocial networks. The default implementation of the model uses the so-calledCaveman model [98] for the generation of synthetic social networks withrealistic characteristics (i.e, high clustering and low average path length).However, this is a customizable aspect and, if there are insights on the typeof scenarios to be tested, a user-defined matrix can be used as input.
The simulation scenario is established by mapping groups of hosts to cer-tain areas in the geographical space. After the definition of the social graphdescribed above, groups, i.e., the highly connected set of nodes in the graph,need to be isolated. The authors use the algorithm proposed in [67] to de-tect the presence of community structures in social networks represented by
12

matrices, like the Connectivity Matrix that we have defined in the previoussection. This algorithm is based on the calculation of the so-called between-
ness of edges. This provides a measure of the centrality of nodes.In order to illustrate this process, let us now consider the social network in
Figure 1.1. Three communities (that can be represented by sets of hosts) aredetected by running the algorithm: C1 = {A, B, C}, C2 = {D, E, F, G} andC3 = {H, I, L}. Now that the communities are identified given the matrix,they need to be associated with locations.
After the communities are identified, each of them is randomly associatedto a specific location (i.e., a square) on a grid6. We use the symbol Sp,q toindicate a square in position p, q. The number of rows and columns are inputsof the mobility model.
Going back to the example, in Figure 1.4 we show how the communitieswe have identified can be placed on a 3x4 grid (the dimension of the gridis configurable by the user and influences the density of the nodes in eachsquare). The three communities C1, C2, C3 are placed respectively in thegrid in the squares Sa,2, Sc,2 and Sb,4. Each node of a certain community isplaced in randomly selected positions inside the assigned square.
As described in the previous section, a host is initially positioned in acertain square in the grid. Then, in order to drive movement, a goal is assignedto the host. More formally, we say that a host i is associated to a square Sp,q
if its goal is inside Sp,q. Note that host i is not necessarily always positionedinside the square Sp,q, despite this association (see below).
The goal is simply a point on the grid which acts as final destination ofmovement like in the Random Way-Point model, with the exception that theselection of the goal is not as random. When the model is initially established,the goal of each host is randomly chosen inside the square associated to itscommunity (i.e, the first goals of all the hosts of the community C1 will bechosen inside the square Sa,2).
When a goal is reached, the new goal is chosen according to the follow-ing mechanism. A certain number of hosts (zero or more) are associated toeach square Sp,q at time t. Each square (i.e., place) exerts a certain social
attractivity to a certain host. The social attractivity of a square is a measureof its importance in terms of the social relationships for the host taken intoconsideration. The social importance is calculated by evaluating the strengthof the relationships with the hosts that are moving towards that particularsquare (i.e., with the hosts that have a current goal inside that particularsquare). More formally, given CSp,q
(i.e., the set of the hosts associated tosquare Sp,q), we define social attractivity of that square towards the host i
SAp,qi, as follows:
6 A non random association to the particular areas of the simulation area can be devised,for example by deciding pre-defined areas of interest corresponding for instance to realgeographical space. However, this aspect is orthogonal to the mechanisms at the basis ofthis model.
13

SAp,qi=
∑
j∈CSp,q
mi,j
w(1.1)
where w is the cardinality of CSp,q(i.e., the number of hosts associated to the
square Sp,q). In other words, the social attractivity of a square in position(p, q) towards a host i is defined as the sum of the interaction indicators thatrepresent the relationships between i and the other hosts that belong to thatparticular square, normalized by the total number of hosts associated to thatsquare. If w = 0 (i.e., the square is empty), the value of SAp,qi
is set to 0.The mobility model allows for two alternative mechanisms for the selection
of the next goal that are described, a deterministic one based on the selectionof the square that exerts the highest attractivity and a probabilistic one basedon probability of selection of a goal in a certain square proportional to theirattractivities. Using the first one, the goals are chosen only inside the squaresassociated to the community, whereas with the second, the hosts may alsorandomly select their goals in other squares of the simulation area, with acertain non zero probability. In other words, the second mechanism allowsfor the selection of the destinations not only based on social relationshipsadding more realism to the model. According to this mechanism, the newgoal is randomly chosen inside the square characterized by the highest socialattractivity; it may be again inside the same square or in a different one.New goals are chosen inside the same area when the input social network iscomposed by loosely connected communities (in this case, hosts associatedwith different communities have, in average, weak relationships between eachothers). On the other hand, a host may be attracted to a different square,when it has strong relationships with both communities. From a graph theorypoint of view, this means that the host is located between two (or more)clusters of nodes in the social network7.
An alternative mechanism is based on a selection of the next goal pro-portional to the attractivity of each square. In other words, we assign aprobability P (s = Sp,qi
) of selecting the square Sp,qias follows:
P (s = Sp,qi) =
SAp,qi+ d
∑p×q
j=1(SAp,qj
+ d)(1.2)
where d is a random value greater than 1 in order to ensure that the proba-bility of selecting a goal in a square is always non zero8.
The parameter d can be used to increase the randomness of the model inthe process of selection of the new goal. This may be exploited to increase
7 This is usually the case of hosts characterized by a relatively high betweenness that, bydefinition, means that they are located between two (or more) communities.8 The role of d is similar to the damping factor used in the calculation of the GooglePageRank [13]. In fact, the transitions between squares can also be similarly representedusing a Markov Chain model with P (s = Sp,qi
) as probability of transitions between states(squares).
14

1
a
b
c
2 3 4
A B
C
D
F
E
G
H
L
I
Fig. 1.4 Example of initial simulation configuration.
the realism of the generated scenario, since in real situations, humans alsomove to areas without people or for reasons not related to their social sphere.
1.5.3 Other Social Network based Mobility Models
Another notable example of mobility model founded on the social relation-ships between the individuals carrying the mobile devices is presented in [32].This work is based on assumptions similar to [60], but it is considerably morelimited in scope. Hosts are statically assigned to a particular group duringthe initial configuration process, whereas [60] accounts for movement betweengroups. Moreover, the authors claim that mobile ad hoc networks are scale-free, but the typical properties of scale-free networks are not considered inthe design of the model presented by the authors. The scale-free distributionof mobile ad hoc networks is still not proven in general, since very limitedmeasurements are available and it is worth noting that the scale-free proper-ties are strictly dependent on the movements of hosts and, therefore, they aredependent on the actual application scenarios [27]. The idea of using com-munities to represent group movements in an infrastructured WiFi networkhas also been exploited in [85] and in its time-variant extension presentedin [36]. More specifically, this model preserves two fundamental characteris-tics, the skewed location visiting preferences and the periodical re-appearanceof nodes in the same location. Recently, Ekman et alii propose a model basedon the daily activities of the users (and group of users) and their movementsbetween place of interests in a city map [24].
15

1.6 From Mobility to Connectivity Models
Another class of models for mobile networking research is that of connectiv-ity models, that focusses on the evolution of the emergent connectivity graphthat is changing over time as nodes move. Topological properties are funda-mental for analyzing, for example, the performance of protocols and systemswhere (intermittent) connectivity plays an essential role such as protocolsfor delay tolerant networks or solutions for bandwidth provision in WLANs.This is a very open area and very few models have been proposed. Most ofthem are based on the analysis of the available connectivity traces, i.e. fromlogs of Bluetooth contacts or WLANs registration patterns.
In [14] the authors propose the Connectivity Trace Generator (CTG).This work differs from previous approaches in that probability distributionsdescribing the patterns of colocation of mobile users (in terms of contact du-ration and inter-contacts time) are exploited for the first time as direct inputs
of a synthetic traces generation tool. More specifically, the input parametersof this component are the relevant parameters of the connectivity model,namely: number of nodes, the contacts duration (i.e., the time interval inwhich two devices are in radio range) and inter-contact time (i.e., the timeinterval between two contacts), and node degree (i.e., number of neighbors)distributions.
All these distributions can be extracted by measurements of connectiv-ity on real traces. The key steps of the proposed simulation framework aredepicted in Figure 1.5. The input of the CTG is a set of real traces. Theseare processed by a trace analyzer to generate the parameters describing userconnectivity required by the tool. These are essentially the coefficients ofthe curves used to approximate the distributions of the inter-contacts times,contacts durations and link degrees characterizing the social graph of thecontacts among the users. This is a graph of the potential contacts betweenpair of nodes, i.e., an edge between two nodes exists if there is a probabilitydifferent from zero that these two nodes will meet in a specified time intervalequal to the simulation duration. This graph is also built from the traces.Additionally, a range of variations for the parameters is provided in input.
The process of generation is based on the selection of the desired numberof hosts and on the construction of a connectivity graph of all the potentialcontacts of each host. In other words, we map each host to a node of thegraph and we link a pair of nodes with an edge if the two hosts can potentiallyget in contact. The connectivity graph is then used to unfold a number ofconnection links between users for each time instant. In other words, weuse the connectivity graph as a basis for a time-varying graph of instant
connectivity for each instant t. In these time-varying graphs (one for eachtime instant), each link is either active if the two hosts are colocated, or isnot present if the two are not.
Each link is activated and de-activated according to the distributions of thecontacts duration and inter-contacts time. Let us consider an example. Each
16

Real traces
Trace Analyser
Trace generator
CTG
Range Variation
Connectivity traces (Test cases)
SimulatorProtocol/ Application
Experimental results
Fig. 1.5 Connectivity Trace Generator.
pair at the beginning is initially disconnected. Let us consider the connectivitypattern between two hosts A and B. At the beginning, the model generates aninitial disconnection time (an “inter-contacts time”) sampled from the inter-contacts time distribution. Let us assume that this is equal to 15 seconds.Then after 15 seconds, the model has to generate a colocation time from thedistribution of the contacts duration. Let us assume that this is equal to 30seconds. An edge between A and B is activated for 30 seconds to representthe colocation of the hosts A and B between the instants 15s and 45s. Inother words, the edge will be present in the graph for the next 30 secondsand then removed. Then the model generates another value, this time fromthe distribution of the inter-contacts time, for example 4 minutes. After 4minutes, the link between A and B is re-activated for a duration time that isagain generated from the distribution of the contacts duration interval andso on.
17

This process is completely automated and implemented by the trace gen-erator component that produces traces containing the events of connectionsand disconnections for each pair of nodes of the simulation scenario and thetime of each event. These traces can be used as test cases for the testing ofopportunistic mobile systems [25].
As a concrete case study, the authors used the log session traces of thecampus WLAN of Dartmouth College [47], to obtain empirical distributionsfor residence time, colocation and degree distribution of the nodes. Thesetraces were used in conjunction with an original model developed by theauthors that aims at representing the properties of the colocation of twousers as a function of the probability for a user of being in a specific placefor a given period of time. Two hosts were considered colocated if they wereregistered to the same access point.
As we said, the design of connectivity models is still an open researcharea; to the best of our knowledge, the other existing proposal is the positionpaper by Nykvist and Phanse [72]. With respect to vehicular networks mod-eling, the only existing example of connectivity models is that of the busesof the DieselNet project [103] discussed in Section 1.3. Another recent workanalyzing the connectivity properties of a bus transportation system is [33].
1.7 Testing Tools and Mobility Modeling
The first step of any performance evaluation exercise based on simulations isthe choice of the simulator tool. Various network simulators are available forthe evaluation of protocols and systems of mobile networks; the most popularare ns-2 [70] with the so-called Monarch extension [42] (and the upcomingnew version ns-3 [71]), Glomosim [102] and Opnet [73]. Another class of toolsfor simulation of generic complex systems (not only computer systems, butalso economic, biological, industrial, etc.) are the so-called discrete-event sim-
ulators. These tools only provide primitives for the concurrent execution ofmultiple entities and communication among them usually by means of mes-sage passing based paradigms. OMNeT++ [91] and Parsec [3] are examplesof this class of simulators.
These tools generally receive in input traces with different formats usuallyin the form of a series of triplets that specify when the change of direction hasto take place, the next goal (that defines the direction of the host) and thenode speed. Unfortunately, there is no standard format for this kind of thesetraces. More in general, no standards have been defined also for measurementtraces both of movements represented by means of geographical positions orconnectivity traces (such as those collected by means of Bluetooth or ZigBeeradio devices).
The results of simulations performed by means of different simulators mayshow significant differences; this fact may be explained by the various model-
18

ing techniques and assumptions and by the different levels of details offeredby these simulators. In [16] the authors show and discuss the divergent resultsobtained by using OPNET Modeler, ns-2 and Glomosim. Other problems canbe related to the methodology followed by the researchers and, unfortunately,this has caused a decreasing confidence in simulation results to evaluate theperformance of protocols and systems: this is motivated by the apparentissues in terms of scientific standards of some of the existing published pa-pers [48]. With respect to mobility modeling, the use of unrealistic mobilitymodels or the absence of a meaningful number of runs to achieve a sufficientstatistical validity of the results has contributed to this lack of confidence.It is interesting to note that there is a clear problem of achieving statisticalvalidity when a limited set of traces is used to evaluate an algorithm or aprotocol. More specifically, in presence of a limited set of nodes and/or ofa limited duration of the traces, there is a critical issue of generality. Forthis reason we believe that tools like the CTG that allows the researchers tovary the parameters describing the mobility patterns distributions in orderto explore their impact are needed.
There is also a growing interest in approaches for testing mobile systemsand applications (see for instance [84]). Most of these approaches, however,concentrate on testing aspects related to context awareness (see, for exam-ple, [96]). Mobility and connectivity can be considered as context elements;however, these tools do not provide specific support for modeling these es-sential aspects of this class of systems.
The CTG presented in Section 1.6 provides automatic generation of con-nectivity test cases in order to evaluate the performance of communicationprotocols and applications in opportunistic mobile systems. The approach al-lows flexible performance testing of new protocols and applications. Indeed,when a system is being prototyped, usage patterns logs could be collectedthrough a small scale trial. The connectivity traces could then be analyzedand, using the methodology proposed by the authors of the CTG, a simulationon a larger scale could be carried, using larger synthetic traces by a highernumber of hosts or different colocation or inter-contacts time distributions.
A tool for the generation of traces for vehicular networking simulations ispresented in [7]. The model allows for the generation of traces that reproducesteady-state random trips on real road topology from the Swiss GeographicInformation System (GIS).
However, there are no comprehensive solutions for the verification of mo-bile systems; for example the CTG lacks a metric for coverage criteria of thegenerated test cases. An investigation along these lines for a similar prob-lem has been presented in [78]: the authors of the CTG leave the issue ofevaluating coverage conditions open for future work.
19
1.8 Summary and Outlook
In this survey, we have presented a description of the state of the art in mobil-ity modeling, considering different classes of synthetic and trace-based mod-els. We have also discussed the analytical models that have been developedto understand human movements. Finally, we have presented the concepts atthe basis of the design of mobility models based on social networks. We nowpresent a summary of the open research challenges in this area, outlining aresearch agenda for the mobile networking and systems community in thisarea. The research challenges can be summarized as follows:Specificity of Available Models The available traces describe very spe-cific situations like campuses or conference environments and, for this reason,it is difficult to generalize the results obtained using the traces directly or themobility models derived from the analysis of these traces. With high prob-ability, different types of mobility patterns characterize specific applicationscenarios, both in terms of contacts distribution and scale of movements inthe geographical space. The main research challenge resides in the identifica-tion of the common features of human mobility and the characterization ofthe specificity of a set of deployment scenarios. This problem will be tackledmore and more effectively with the increasing availability of mobility tracesextracted from heterogeneous environments.Mobility Models vs Connectivity Models In this survey, we have intro-duced and discussed the concept of connectivity models. This kind of modelsare not alternative but complementary to the existing models. In fact, mo-bility models (i.e., containing information about the locations of the nodes)are necessary for testing several classes of protocols and applications such asgeocasting protocols [40] or location-aware applications [30]. An open prob-lem is how to integrate the use of connectivity and mobility models in aneffective way to characterize human mobility. Connectivity models can bederived by mobility models but the former represent a much more powerfultool for the statistical characterization of colocation patterns. These mod-els are very useful for designing and evaluating protocols and systems wherethese aspects are fundamental such as in the case of performance evaluationof delay tolerant protocols or wireless peer-to-peer systems (for example toevaluate the available transmission bandwidth among a set of hosts). As formobility models, further investigations are needed to characterize commonproperties of human connectivity and distinct features of specific applicationenvironments. Another open issue is the characterization of the interactionbetween human movement and the surrounding environment: more specifi-cally, the influence of the geographical features of the simulation spaces suchas the presence of obstacles (e.g., buildings, hills, green areas) on humanconnectivity and mobility patterns has not been studied yet.Benchmarks for Protocol and System Evaluation Unfortunately, thechoice of values for parameters of simulations for mobile (in particular, adhoc) networks research is extremely variable. In fact, the ad hoc and delay
20

tolerant research communities lack of consistent scenarios to validate and tobenchmark the different solutions. As cited previously, in [48] Kurkoswski,Camp and Colagrosso reported an analysis of the performance evaluation ofpapers published at MobiHoc from 2000 to 2005, showing evident flaws of alarge number of works from a scientific point of view in terms of simulationmethodology. The community should define a common set of mobility tracesthat should be used to verify the performance of protocols. A possible ideais to define a series of sets of traces for different classes of application sce-narios such as dense networks, urban environments and sparse networks, forinstance for the evaluation of delay tolerant networking protocols or Blue-tooth based systems. This can be seen as a medium term goal, given alsothe limited amount of available traces. However, following the introductionof more powerful and, at the same time, affordable devices such as phonesequipped with GPS units and Bluetooth, we believe that the amount of avail-able information will increase hugely in the next few years.Tools There is a very limited number of available tools, in particular opensource and free, for academic and industrial testing of mobile applications.With respect to mobility modeling, there is a concrete need of network emu-lators that are able to simulate connectivity based on an underlying mobilitymodel (or directly on traces). An interesting example of this kind of systemsis [69]. Another very useful class of systems for performance evaluation stud-ies are emulators based on virtualization techniques on a single machine fortesting multiple instances of mobile applications by means of virtual commu-nication interfaces (such as Bluetooth or ZigBee) and infrastructure-based(such as based on access points or GPRS), also providing radio propagationmodels.Standardization of the Trace Formats Unfortunately, the availabletraces (see, for example, those stored in the CRAWDAD repository [46])do not follow a common standard and scripts are needed to convert themto the various formats in order to be processed by the different simulators.The mobile networking and systems community should allow for commonstandards in order to promote an easy data exchange among researchers forcross-comparisons, also for the establishment of benchmarks for the commu-nity, as it happens in other fields of computer science.
21


References
1. R. Albert and A.-L. Barabasi. Statistical mechanics of complex networks. Review ofModern Physics, 74:47–97, 2002.
2. D. Austin, W. D. Bowen, and J. I. McMillan. Intraspecific variation in movementpatterns: modeling individual behaviour in a large marine predator. Oikos, 105(1):15–30, 2004.
3. R. Bagrodia, R. Meyer, R. Takai, Y. Chen, X. Zeng, J. Martin, B. Park, and H. Song.A parallel simulation environment for complex systems. IEEE Computer, pages 77–85, October 1998.
4. F. Bai, N. Sadagopan, and A. Helmy. IMPORTANT: A framework to systematicallyanalyze the Impact of Mobility on Performance of RouTing protocols for AdhocNeTworks. In INFOCOM’03, 2003.
5. A. Balachandran, G. M. Voelker, P. Bahl, and P. V. Rangan. Characterizing userbehavior and network performance in a public wireless LAN. In Proceedings of SIG-METRICS’02, pages 195–205, New York, NY, USA, 2002. ACM Press.
6. M. Balazinska and P. Castro. Characterizing Mobility and Network Usage in a Cor-porate Wireless Local-Area Network. In 1st International Conference on MobileSystems, Applications, and Services (MobiSys’03), San Francisco, CA, May 2003.
7. R. Baumann, F. Legendre, and P. Sommer. Generic Mobility Simulation Framework(GMSF). In Proceedings of First ACM SIGMOBILE International Workshop onMobility Models for Networking Research (MobilityModels’08), Hong Kong S. A. R.,China, May 2008.
8. C. Bettstetter. Smooth is better than sharp: a random mobility model for simulationof wireless networks. In Proceedings of MSWIM’01, pages 19–27, New York, NY,USA, 2001. ACM.
9. C. Bettstetter, H. Hartenstein, and X. Perez-Costa. Stochastic properties of therandom waypoint mobility model. Wireless Networks (Special Issue on Modelingand Analysis of Mobile Networks), 10(5):555–567, 2004.
10. C. Bettstetter, G. Resta, and P. Santi. The Node Distribution of the Random Way-point Mobility Model for Wireless Ad Hoc Networks. IEEE Transactions on MobileComputing, 2(3):257–269, 2003.
11. D. Bhattacharjee, A. Rao, C. Shah, M. Shah, and A. Helmy. Empirical modeling ofcampus-wide pedestrian mobility observations on the USC campus. In Proceedings ofVehicular Technology Conference, 2004 (VTC2004-Fall). 2004 IEEE 60th, volume 4,pages 2887–2891, 2004.
12. K. Blakely and B. Lowekamp. A structured group mobility model for the simulationof mobile ad hoc networks. In Proceedings of MobiWac’04, pages 111–118, New York,NY, USA, 2004. ACM.
23

13. S. Brin and L. Page. The anatomy of a large-scale hypertextual web search engine. InProceedings of the 7th International Conference on World Wide Web, pages 107–117,April 1998.
14. R. Calegari, M. Musolesi, F. Raimondi, and C. Mascolo. CTG: A Connectivity TraceGenerator for Testing the Performance of Opportunistic Mobile Systems. In Proceed-ings of the European Software Engineering Conference and the International ACMSIGSOFT Symposium on the Foundations of Software Engineering (ESEC/FSE07),Dubrovnik, Croatia, September 2007. ACM Press.
15. T. Camp, J. Boleng, and V. Davies. A survey of mobility models for ad hoc networkresearch. Wireless Communication and Mobile Computing Special Issue on MobileAd Hoc Networking: Research, Trends and Applications, 2(5):483–502, 2002.
16. D. Cavin, Y. Sasson, and A. Schiper. On the Accuracy of MANET Simulators. InProceedings of the Workshop on Principles of Mobile Computing (POMC’02), pages38–43, October 2002.
17. A. Chaintreau, P. Hui, J. Crowcroft, C. Diot, R. Gass, and J. Scott. Pocket Switched
Networks: Real-world mobility and its consequences for opportunistic forwarding.Technical Report UCAM-CL-TR-617, University of Cambridge, Computer Labora-tory, February 2005.
18. A. Chaintreau, P. Hui, J. Crowcroft, C. Diot, R. Gass, and J. Scott. Impact of hu-man mobility on opportunistic forwarding algorithms. IEEE Transactions on MobileComputing, 6(6):606–620, 2007.
19. D. R. Choffnes and F. E. Bustamante. An integrated mobility and traffic model forvehicular wireless networks. In Proceedings of VANET’05, pages 69–78, New York,NY, USA, 2005. ACM.
20. P. Costa, C. Mascolo, M. Musolesi, and G. P. Picco. Socially-aware routing forpublish-subscribe in delay-tolerant mobile ad hoc networks. IEEE Journal on SelectedAreas in Communications, 26(5):748–760, June 2008.
21. E. M. Daly and M. Haahr. Social network analysis for routing in disconnected delay-tolerant MANETs. In Proceedings of MobiHoc’07, pages 32–40, New York, NY, USA,2007. ACM.
22. A. M. Edwards, R. A. Phillips, N. W. Watkins, M. P. Freeman, E. J. Murphy,V. Afanasyev, S. V. Buldyrev, M. G. E. da Luz, E. P. Raposo, H. E. Stanley, andG. M. Viswanathan. Revisiting Levy flight search patterns of wandering albatrosses,bumblebees and deer. Nature, (449):1044–1048, October 2005.
23. A. Einstein. Investigations on the Theory of the Brownian Movement. Dover Publi-cations, 1956.
24. F. Ekman, A. Keranen, J. Karvo, and J. Ott. Working Day Movement Model. InProceedings of First ACM SIGMOBILE International Workshop on Mobility Modelsfor Networking Research (MobilityModels’08), Hong Kong S. A. R., China, May 2008.
25. K. Fall. A delay-tolerant network architecture for challenged internets. In Proceedingsof SIGCOMM’03, August 2003.
26. M. Garetto and E. Leonardi. Analysis of random mobility models with PDE’s. InProceedings of MobiHoc’06, pages 73–84, New York, NY, USA, 2006. ACM.
27. I. Glauche, W. Krause, R. Sollacher, and M. Greiner. Continuum percolation ofwireless ad hoc communication networks. Physica A, 325:577–600, 2003.
28. M. C. Gonzalez, C. A. Hidalgo, and A.-L. Barabasi. Understanding individual humanmobility patterns. Nature, 453(7196):779–782, 2008.
29. K. Harras, K. Almeroth, and E. Belding-Royer. Delay Tolerant Mobile Networks(DTMNs): Controlled Flooding Schemes in Sparse Mobile Networks. In IFIP Net-working 2005, pages 1180–1192, May 2005.
30. M. Hazas, J. Scott, and J. Krumm. Location-aware computing comes of age. Com-puter, 37(2):95–97, February 2004.
31. T. Henderson, D. Kotz, and I. Abyzov. The changing usage of a mature campus-widewireless network. In Proceedings of MobiCom’04, pages 187–201, New York, NY,USA, 2004. ACM Press.
24

32. K. Hermann. Modeling the sociological aspect of mobility in ad hoc networks. InProceedings of MSWiM’03, pages 128–129, San Diego, California, USA, September2003.
33. I. W. H. Ho, K. K. Leung, J. W. Polak, and R. Mangharam. Node connectivity invehicular ad hoc networks with structured mobility. In Proceedings of the 32nd IEEE
Conference on Local Computer Networks (LCN’07), pages 635–642, Washington, DC,USA, 2007. IEEE Computer Society.
34. X. Hong, M. Gerla, G. Pei, and C.-C. Chiang. A group mobility model for ad hocnetworks. In Proceedings of the 2nd International Workshop on Modeling Analysisand Simulation of Wireless and Mobile Systems (MSWiM’99), pages 53–60, 1999.
35. W. Hsu, K. Merchant, H. Shu, C. Hsu, and A. Helmy. Weighted Waypoint MobilityModel and its Impact on Ad Hoc Networks. ACM Mobile Computer CommunicationsReview (MC2R), pages 59–63, January 2005.
36. W. Hsu, T. Spyropoulos, K. Psounis, and A. Helmy. Modeling time-variant usermobility in wireless mobile networks. Proceedings of INFOCOM’07, pages 758–766,May 2007.
37. P. Hui, A. Chaintreau, J. Scott, R. Gass, J. Crowcroft, and C. Diot. Pockets SwitchedNetworks and Human Mobility in Conference Environments. In Proceedings of ACMSIGCOMM’05 Workshops, pages 244–251, August 2005.
38. R. Jain, D. Lelescu, and M. Balakrishnan. Model T: an empirical model for userregistration patterns in a campus wireless LAN. In Proceedings of MobiCom’05,pages 170–184, New York, NY, USA, 2005. ACM.
39. A. Jardosh, E. M. Belding-Royer, K. C. Almeroth, and S. Suri. Real world Envi-ronment Models for Mobile Ad hoc Networks. IEEE Journal on Special Areas inCommunications - Special Issue on Wireless Ad hoc Networks, 23(3), March 2005.
40. X. Jiang and T. Camp. A review of geocasting protocols for a mobile ad hoc network.In Proceedings of the Grace Hopper Celebration (GHC 2002), 2002.
41. D. B. Johnson and D. A. Maltz. Dynamic Source Routing in ad hoc wireless network.In T. Imielinski and H. Korth, editors, Mobile Computing, chapter 5, pages 153–181.Kluwer Academics Publisher, 1996.
42. D. B. Johnson and D. A. Maltz. Protocols for adaptive wireless and mobile network-ing. IEEE Personal Communications, 3(1):34–42, February 1996.
43. T. Karagiannis, J.-Y. L. Boudec, and M. Vojnovic. Power law and exponential decay
of inter contact times between mobile devices. In Proceedings of MobiCom’07, pages183–194, New York, NY, USA, 2007. ACM.
44. M. Kim and D. Kotz. Periodic properties of user mobility and access-point popularity.Journal of Personal and Ubiquitous Computing, 11(6), August 2007.
45. M. Kim, D. Kotz, and S. Kim. Extracting a mobility model from real user traces. InProceedings of IEEE INFOCOM’06, April 2006 2006.
46. D. Kotz and T. Henderson. CRAWDAD: A Community Resource for Archiving Wire-less Data at Dartmouth. IEEE Pervasive Computing, 4(4):12–14, October-December2005.
47. D. Kotz, T. Henderson, and I. Abyzov. CRAWDAD trace dart-mouth/campus/movement/01 04 (v. 2005-03-08). Downloaded fromhttp://crawdad.cs.dartmouth.edu/, March 2005.
48. S. Kurkowski, T. Camp, and M. Colagrosso. MANET Simulation Studies: the In-credibles. SIGMOBILE Mobile Computing and Communications Review, 9(4):50–61,2005.
49. J.-Y. Le Boudec. Understanding the simulation of mobility models with Palm calcu-lus. Performance Evaluation, 64(2):126–147, 2007.
50. J.-Y. Le Boudec and M. Vojnovic. Perfect simulation and stationarity of a class ofmobility models. In Proceedings of IEEE INFOCOM’05, pages 72–79, March 2005.
51. J.-Y. Le Boudec and M. Vojnovic. The random trip model: stability, station-ary regime, and perfect simulation. IEEE/ACM Transactions on Networking,14(6):1153–1166, 2006.
25

52. J.-K. Lee and J. C. Hou. Modeling steady-state and transient behaviors of usermobility: formulation, analysis, and application. In Proceeding of MobiHoc’06, pages85–96, New York, NY, USA, 2006. ACM.
53. D. Lelescu, U. C. Kozat, R. Jain, and M. Balakrishnan. Model T++:: an empiricaljoint space-time registration model. In Proceedings of MobiHoc’06, pages 61–72, NewYork, NY, USA, 2006. ACM Press.
54. B. Liang and Z. J. Haas. Predictive distance-based mobility management for multi-dimensional pcs networks. IEEE/ACM Transactions on Networking, 11(5):718–732,2003.
55. K. Maeda, K. Sato, K. Konishi, A. Yamasaki, A. Uchiyama, H. Yamaguchi, K. Ya-sumotoy, and T. Higashino. Getting urban pedestrian flow from simple observa-
tion: Realistic mobility generation in wireless network simulation. In Proceedings ofMSWiM’05, pages 151–158, September 2005.
56. R. Mangharam, D. S. Weller, D. D. Stancil, R. Rajkumar, and J. S. Parikh.GrooveSim: a topography-accurate simulator for geographic routing in vehicular net-works. In Proceedings of VANET’05, pages 59–68, New York, NY, USA, 2005. ACMPress.
57. M. McNett and G. M. Voelker. Access and Mobility of Wireless PDA User. MobileComputing Communications Review, 9(2):40–55, April 2005.
58. M. Musolesi, S. Hailes, and C. Mascolo. An ad hoc mobility model founded on socialnetwork theory. In Proceedings of the 7th ACM international symposium on Mod-eling, analysis and simulation of wireless and mobile systems. ACM Press, October2004.
59. M. Musolesi, S. Hailes, and C. Mascolo. Adaptive routing for intermittently connectedmobile ad hoc networks. In Proceedings of WoWMoM’05. Taormina, Italy. IEEEpress, June 2005.
60. M. Musolesi and C. Mascolo. A community based mobility model for ad hoc networkresearch. In Proceedings of the 2nd ACM/SIGMOBILE International Workshop onMulti-hop Ad Hoc Networks: from theory to reality (REALMAN’06). ACM Press,May 2006.
61. M. Musolesi and C. Mascolo. Designing mobility models based on social networktheory. ACM SIGMOBILE Mobile Computing and Communication Review, 11(3),July 2007.
62. P. Nain, D. Towsley, B. Liu, and Z. Liu. Properties of random direction models. InProceedings of INFOCOM’05, March 2005.
63. W. Navidi and T. Camp. Stationary distributions for the random waypoint mobilitymodel. IEEE Transactions on Mobile Computing, 3(1):99–108, 2004.
64. M. E. J. Newman. The Structure of Scientific Collaboration Networks. In Proceedingsof the National Academy of Science, volume 98, pages 404–409, 2001.
65. M. E. J. Newman. The structure and function of complex networks. SIAM Review,19(1):1–42, 2003.
66. M. E. J. Newman. Power laws, Pareto distributions and Zipf’s law. ContemporaryPhysics, 46:323, 2005.
67. M. E. J. Newman and M. Girvan. Finding and evaluating community structure innetworks. Physical Review E, 69, February 2004.
68. M. E. J. Newman and J. Park. Why Social Networks are Different from Other Typesof Networks. Physical Review E, 68, 2003.
69. E. Nordstrom, P. Gunningberg, and H. Lundgren. A testbed and methodology for ex-perimental evaluation of wireless mobile ad hoc networks. In Proceedings of the FirstInternational Conference on Testbeds and Research Infrastructures for the DEvelop-ment of NeTworks and COMmunities (TRIDENTCOM’05), pages 100–109, Wash-ington, DC, USA, 2005. IEEE Computer Society.
70. The ns-2 Project. http://www.isi.edu/nsnam/ns/, 2008.71. The ns-3 Project. http://www.nsnam.org/, 2008.
26

72. J. Nykvist and K. Phanse. Modeling connectivity in mobile ad-hoc network envi-ronments. In Proceedings of the 6th Scandinavian Workshop on Wireless Ad-hocNetworks (ADHOC’06), 2006.
73. OPNET Technologies Inc. Opnet modeler, 2004.74. M. Piorkowski, N. Sarafijanovic-Djukic, and M. Grossglauser. On Clustering Phe-
nomenon in Partitioned Mobile Networks. In Proceedings of First ACM SIGMOBILEInternational Workshop on Mobility Models for Networking Research (MobilityMod-els’08), Hong Kong S. A. R., China, May 2008.
75. G. Resta and P. Santi. An analysis of the node spatial distribution of the randomwaypoint mobility model for ad hoc networks. In Proceedings of POMC’02, pages44–50, New York, NY, USA, 2002. ACM.
76. G. Resta and P. Santi. The QoS-RWP mobility and user behavior model for publicarea wireless networks. In Proceedings of the 9th ACM international symposiumon Modeling analysis and simulation of wireless and mobile systems (MSWiM’06),pages 375–384, New York, NY, USA, October 2006. ACM Press.
77. I. Rhee, M. Shin, S. Hong, K. Lee, and S. Chong. On the Levy-walk Nature of HumanMobility. In Proceedings of INFOCOM’08, Arizona, USA, 2008.
78. M. J. Rutherford, A. Carzaniga, and A. L. Wolf. Simulation-based test adequacycriteria for distributed systems. In Proceedings of the 14th ACM SIGSOFT interna-tional symposium on Foundations of software engineering (FSE-14), pages 231–241,New York, NY, USA, 2006. ACM Press.
79. A. K. Saha and D. B. Johnson. Modeling mobility for vehicular ad-hoc networks. InProceedings of VANET’04, pages 91–92, New York, NY, USA, 2004. ACM.
80. T. K. Sarkar, M. C. Wicks, M. Salazar-Palma, and R. J. Bonneau. A survey ofvarious propagation models for mobile communication. Smart Antennas, pages 239–307, 2004.
81. J. Scott. Social Networks Analysis: A Handbook. Sage Publications, London, UnitedKingdom, second edition, 2000.
82. J. Scott, R. Gass, J. Crowcroft, P. Hui, C. Diot, and A. Chaintreau.CRAWDAD data set cambridge/haggle (v. 2006-01-31). Downloaded fromhttp://crawdad.cs.dartmouth.edu/cambridge/haggle, Jan. 2006.
83. G. Sharma and R. R. Mazumdar. Scaling laws for capacity and delay in wireless adhoc networks with random mobility. In IEEE International Conference on Commu-nications (ICC’04), pages 3869– 3873, June 2004.
84. T. Sohn, W. G. Griswold, J. Scott, A. LaMarca, Y. Chawathe, I. E. Smith, andM. Y. Chen. Experiences with Place Lab: an open source toolkit for location-awarecomputing. In Proceedings of ICSE’06, pages 462–471. ACM Press, 2006.
85. T. Spyropoulos, K. Psounis, and C. S. Raghavendra. Performance analysis ofmobility-assisted routing. In Proceedings of MobiHoc’06, pages 49–60, New York,NY, USA, 2006. ACM.
86. J. Su, A. Chin, A. Popivanova, A. Goel, and E. de Lara. User mobility for oppor-tunistic ad-hoc networking. In Proceedings of the Sixth IEEE Workshop on MobileComputing Systems and Applications (WMCSA’04), pages 41–50, Washington, DC,USA, 2004. IEEE Computer Society.
87. D. Tang and M. Baker. Analysis of a local-area wireless network. In Proceedings ofMobiCom’00, pages 1–10, New York, NY, USA, 2000. ACM Press.
88. C. Tuduce and T. Gross. A Mobility Model Based on WLAN Traces and its Valida-tion. In Proceedings of INFOCOM’05, pages 19–24, March 2005.
89. P. Turchin. Measuring and Modeling Population Redistribution in Animals andPlants. Sinauer Associates, 1998.
90. U.S. Census Bureau. Tiger, tiger/line and tiger-related products. Available athttp://www.census.gov/geo/www/tiger/.
91. A. Varga. The OMNeT++ discrete event simulation system. In Proceedings of theEuropean Simulation Multiconference (ESM’01), Prague, June 2001.
27

92. A. Vasquez, R. Pastor-Satorras, and A. Vespignani. Large-scale topological and dy-namical properties of the Internet. Physical Review E, 67, 2003.
93. G. M. Viswanathan, V. Afanasyev, S. V. Buldyrev, E. J. Murphy, P. A. Prince,and H. E. Stanley. Levy flight search patterns of wandering albatrosses. Nature,(381):413–415, May 1996.
94. G. M. Viswanathan, S. V. Buldyrev, S. Havlin, M. G. E. da Luz, E. P. Raposo, andH. E. Stanley. Optimizing the success of random searches. Nature, 401(6756):911–914,1999.
95. K. Wang and B. Li. Group mobility and partition prediction in wireless ad-hocnetworks. Proceedings of ICC’02, 2:1017–1021, 2002.
96. Z. Wang, S. Elbaum, and D. Rosenblum. Automated generation of context-aware
tests. In Proceedings of ICSE’07. ACM Press, 2007.97. S. Wasserman, K. Faust, and D. Iacobucci. Social Network Analysis : Methods and
Applications (Structural Analysis in the Social Sciences). Cambridge UniversityPress, November 1994.
98. D. J. Watts. Small Worlds The Dynamics of Networks between Order and Random-ness. Princeton Studies on Complexity. Princeton University Press, 1999.
99. J. Yoon, M. Liu, and B. Noble. Random waypoint considered harmful. In Proceedingsof INFOCOM’03, 2003.
100. J. Yoon, M. Liu, and B. Noble. Sound mobility models. In Proceedings of Mobi-Com’03, pages 205–216, New York, NY, USA, 2003. ACM.
101. J. Yoon, B. D. Noble, M. Liu, and M. Kim. Building realistic mobility models fromcoarse-grained traces. In Proceedings of MobiSys’06, pages 177–190, New York, NY,USA, 2006. ACM Press.
102. X. Zeng, R. Bagrodia, and M. Gerla. GloMoSim: a library for parallel simulationof large-scale wireless networks. In Proceedings of the 12th Workshop on Paralleland distributed simulation (PADS’98), pages 154–161, Washington, DC, USA, 1998.IEEE Computer Society.
103. X. Zhang, J. Kurose, B. N. Levine, D. Towsley, and H. Zhang. Study of a bus-baseddisruption-tolerant network: mobility modeling and impact on routing. In Proceedingsof MobiCom’07, pages 195–206, New York, NY, USA, 2007. ACM.
28