mmr 2008 a new approach to mpfm performance r1 issued files/mmr 2008, a new approach... ·...
TRANSCRIPT

A New Approach to MPFM Performance Assessment in Heavy Oil, Martin Basil, SOLV Ltd, MMR May 2008, Galveston, Tx 111
A New Approach to MPFM Performance Assessment in Heavy Oil
by
Martin Basil, S0LV LimitedGordon Stobie, ConocoPhillips
Winsor Letton, Letton-Hall Group
May 2008, Galveston, Texas

A New Approach to MPFM Performance Assessment in Heavy Oil, Martin Basil, SOLV Ltd, MMR May 2008, Galveston, Tx 222
Overview• MPFM performance is assessed with a model using:
– physical characteristics of the sensors– fluid properties– operating conditions– published information in the public domain
• High Viscosity Heavy Oil application– Fiscal MPFM measurement required due to project economics– Tight emulsion, high viscosity100 to 4,000 cP with entrained gas– 0% to 60% WLR, 0% to 60% GVF, 3kbpd to 25kbpd liquid– Dual Gamma Venturi MPFM– Venturi with low RN < 2,000 that required a Cd correction
• Benefits of using performance model:– evaluate MPFM requirements early in project development– assess feasibility before main funding commitments are made– avoids costly, time consuming tests and wasteful duplication of tests– independent and transparent means of verification of vendors claims

A New Approach to MPFM Performance Assessment in Heavy Oil, Martin Basil, SOLV Ltd, MMR May 2008, Galveston, Tx 3
I did not have…….
Don’t believe everything you are told ☺

A New Approach to MPFM Performance Assessment in Heavy Oil, Martin Basil, SOLV Ltd, MMR May 2008, Galveston, Tx 44
The Application• A process facility nearby had the capability to
process Heavy Oil fluids and export through to a common pipeline with an existing LACT unit
• Cost of process plant for measurement of Heavy Oil with a LACT unit was prohibitive and wasteful
• Parties exposed due to different ownership• Existing facility production is fifteen times greater
than the Heavy Oil so relative exposure is lower• Fiscal Heavy Oil MPFM measurement was acceptable
with the appropriate tariffs to the Pipeline Entrants, Royalty Owners and the Regulatory Authorities

A New Approach to MPFM Performance Assessment in Heavy Oil, Martin Basil, SOLV Ltd, MMR May 2008, Galveston, Tx 55
Fluid Properties & Conditions
Fluid Properties•GVF 0% to 60% No phase slip•WLR 0% to 60% No phase slip•Flow regime slugging•Liquid regime tight emulsion (due to ESP’s)•Gas regime entrained (bubbles in emulsion•Oil gravity 19 to 21 APIº (925 to 940 kg/m3)•Prod. Water 63.5 to 65.0 lb/cf (1010 to 1040 kg/m3) •Gas SG 0.67 to 0.69 (0.83 to 0.86 kg/m3)•Viscosity 50 to 10,000 cP (due to emulsion)•Reynolds No. 100 to 20,000 (dependant on Venturi)Operating Conditions•Temperature 59 to 121 ºF (15 to 50 ºC)•Pressure 150 to 300 psig (10 to 20 barg)

A New Approach to MPFM Performance Assessment in Heavy Oil, Martin Basil, SOLV Ltd, MMR May 2008, Galveston, Tx 66
Heavy Oil Measurement

A New Approach to MPFM Performance Assessment in Heavy Oil, Martin Basil, SOLV Ltd, MMR May 2008, Galveston, Tx 77
MPFM Model• Dual Gamma
– High Energy– Low Energy– GVF– WLR– Mixture Density
• Venturi Mass Flow Rate– Measures Mass Flow Rate– Differential Pressure– Static Pressure– Temperature– Blind Tee mixer
• Oil Standard Volume
DP
P
TBlind Tee
Dual GammaDetector
Venturi
Multi Phase Flow Meter
Source Low EnergyHigh Energy
LinePressure
LineTemperature
Differential Pressure

A New Approach to MPFM Performance Assessment in Heavy Oil, Martin Basil, SOLV Ltd, MMR May 2008, Galveston, Tx 88
MPFM Module Uncertainty1. Instrument Uncertainty - DP, P, T by RSS
2. Line and Standard Conditions - API thermal and compressibility and AGA8 gas compressibility and water density from salinity all by MCS
3. Dual Gamma – GVF, WLR and mixture density from oil, gas and produced water actual density and mass attenuation from Low and High Energy EPR and measurement count by MCS
4. Venturi – Mass flow from mixture density and ISO5167-4 by RSS and MCS
5. Cd Correction – Venturi RN used to find Cd from table with uncertainty from curve fit deviation

A New Approach to MPFM Performance Assessment in Heavy Oil, Martin Basil, SOLV Ltd, MMR May 2008, Galveston, Tx 999
Knowing and Unknowing
1. There are known known's - there are things we know that we know.
2. There are known unknowns - that is to say that there are things we now know we don’t know.
3. But there are also unknown unknowns - the things we do not know we don't know.

A New Approach to MPFM Performance Assessment in Heavy Oil, Martin Basil, SOLV Ltd, MMR May 2008, Galveston, Tx 1010
Known’s and Unknown's1. Sensor Measurement Uncertainty - generally well understood
by the equipment vendors and quantifiable. Known’s
2. Fluid Property Uncertainty – fluid properties, flow regime and flow rate are changeable and difficult to quantity in real time which can be mitigated by regular sampling. Somewhat Unknown.
3. Empirical Relationship Uncertainty –found in calculation methods such as the Venturi Coefficient of Discharge Cd at low Reynolds Number and are often overlooked. Unknown's
4. Calculation Method Uncertainty– uncertainty can be magnified or diminished when measurements, fluid variables and constants are combined by calculation and there may be uncertainty in some calculation methods. These can be quantified by sensitivity analysis and with MCS. Known’s

A New Approach to MPFM Performance Assessment in Heavy Oil, Martin Basil, SOLV Ltd, MMR May 2008, Galveston, Tx 1111
Dual Gamma Module (1)The detector has a low energy and high energy detection level which is expressed as:
Nle Nle0 ex− μleo ρo⋅ αo⋅ μlew ρw⋅ αw⋅+ μleg ρg⋅ αg⋅+( )⋅
⋅ Low energy
High energyNhe Nhe0 e
x− μheo ρo⋅ αo⋅ μhew ρw⋅ αw⋅+ μheg ρg⋅ αg⋅+( )⋅⋅
The equations can be represented in terms of linear attenuation constants for each energy:
Kle
lnNleNle0
⎛⎜⎝
⎞⎟⎠
x−μleo ρo⋅ αo⋅ μlew ρw⋅ αw⋅+ μleg ρg⋅ αg⋅+
Khe
lnNheNhe0
⎛⎜⎝
⎞⎟⎠
x−μheo ρo⋅ αo⋅ μhew ρw⋅ αw⋅+ μheg ρg⋅ αg⋅+
The sum of the phase fractions is unity:
αo αw+ αg+ 1
A New Approach to MPFM Performance Assessment in Heavy Oil, Martin Basil, SOLV Ltd, MMR May 2008, Galveston, Tx 1212
Dual Gamma Module (2)
• With the sum of the phase fractions (unity), Kle and Khe, each phase fraction can be found
• Kle and Khe can be found by calibration for each phase and the EPR for each energy level.
• Kle and Khe can be found from linear attenuation constants for each compound for each phase. NIST data was used here with reservoir data in the absence of samples and a MPFM.
• GVF, WLR and Mixture Density are found from each phase fraction and density at line conditions.
• Line conditions are found in a separate module.

A New Approach to MPFM Performance Assessment in Heavy Oil, Martin Basil, SOLV Ltd, MMR May 2008, Galveston, Tx 1313
Dual Gamma Module (3)Dual Energy Gamma Densitometer - MCS UncertaintyConstants and UncertaintiesMixture Name Units Minimum MaximumGas Volume Fraction GVF %gas/mix 0.0% 60.0%Water Liquid Ratio WLR %wtr/liq 0.0% 60.0%Density Name Units Value Uncertainty BiasGas density Rhog kg/m3 14.98 4.41% 0.00Oil density Rhoo kg/m3 923.7 1.00% 30.00Water density Rhow kg/m3 1027.3 1.00% 30.00Gamma Detector Name Units Value Uncertainty BiasPath length x m 0.052 0.010% 0.00000Low Energy Name Units Value Uncertainty BiasEPR Count Rate Nle0 Hz 24,109.7 1.46 0.00EPR Ave. Period tle0 Sec 43,200EPR Samples Sle0 1Measurement Count mtle Hz 0.00Measured Ave. Period tle Sec 40Measured Samples Sle 1Gas attenuation Muleg m2/kg 0.025830400 0.50% 0.0000000Oil attenuation Muleo m2/kg 0.024967800 0.50% 0.0000000Water attenuation Mulew m2/kg 0.037914000 0.50% 0.0000000High Energy Name Units Value Uncertainty BiasEPR Count Rate Nhe0 Hz 12,541.4 1.06 0.00EPR Ave. Period the0 Sec 43,200EPR Samples She0 1Measurement Count mthe Hz 0.00Measured Ave. Period the Sec 40Measured Samples Sle 1Gas attenuation Muheg m2/kg 0.018003700 0.50% 0.0000000Oil attenuation Muheo m2/kg 0.017045900 0.50% 0.0000000Water attenuation Muhew m2/kg 0.017131700 0.50% 0.0000000
Input to the MCS includes bias
Bias in the results is found from the difference between the MCS result mean, with, and without, bias
Uncertainty is found from the distribution of the MCS results

A New Approach to MPFM Performance Assessment in Heavy Oil, Martin Basil, SOLV Ltd, MMR May 2008, Galveston, Tx 1414
Dual Gamma Module (4)
0%12%
24%36%
48%60%
0%
12%
24%
36%
48%
60%
0.8%
0.9%
1.0%
1.1%
1.2%
1.3%
1.4%
1.5%
Mixture DensityUncertainty +/-%
%WLR
%GVF
0%
12%
24%
36%
48%
60%
0.0%12.0%
24.0%36.0%
48.0%60.0%
1.00%
1.50%
2.00%
2.50%
3.00%
Water Liquid RatioUncertainty +/-%WLR
%WLR
%GVF
0%12%
24%36%
48%60%
0%12%
24%36%
48%60%
0.50%
0.52%
0.54%
0.56%
0.58%
0.60%
0.62%
0.64%
0.66%
0.68%
0.70%
Gas Volume FractionUncertainty +/-%GVF
%WLR%GVF

A New Approach to MPFM Performance Assessment in Heavy Oil, Martin Basil, SOLV Ltd, MMR May 2008, Galveston, Tx 1515
Fluid Conditions Module
Fluid Quantity Name Unit Value UncertaintyConditions Temperature Tmix ℉ 78.0
℃ 25.56 0.45Pressure Pmix psig 250.00
barg 17.042 0.76Oil Gravity APIoil ºAPI 20.6
Standard Density ρsoil kg/m3 929.39Vapour Pressure Pvap psig 10.00
barg 0.68Thermal Correction Ctloil factor 0.992877Pressure correction Cploil factor 1.001022volume correct. VCFoil factor 0.993891actual density ρaoil kg/m3 923.71standard volume correction factor 0.993891 0.10% 0.99399971
Water standard density ρswtr kg/m3 1,030.030salinity kg/kg 0.0429196actual density ρawtr kg/m3 1,027.319standard volume correction factor 0.997368 0.10% 0.997866191
Gas standard density ρsgas kg/m3 0.83107actual density ρagas kg/m3 14.985dyn. viscosity μgas cP @60℉ 0.015kin. viscosity νgas cSt 1.00102
AGA8 Gas Density
Line Conditions Measurement Uncertainty Trial ValuesTemperature deg C 25.56 0.450 25.43Pressure bara 18.05 0.755 18.40
Gas Composition Compostion mol% Normalised mol%
Component Uncertainty %
Uncertainty mol% Trials Normalised
TrialsNitrogen mol% 0.720 0.720 1.00% 0.0072 0.7185 0.7174Carbon Dioxide mol% 1.360 1.360 1.00% 0.0136 1.3676 1.3655Methane mol% 85.330 85.330 2.00% 1.7066 85.4663 85.3403Ethane mol% 6.150 6.150 1.00% 0.0615 6.1468 6.1377Propane mol% 3.810 3.810 1.00% 0.0381 3.8206 3.8150n-Butane mol% 2.020 2.020 1.00% 0.0202 2.0175 2.0145i-Butane mol% 0.000 0.000 1.00% 0.0000 0.0000 0.0000n-Pentane mol% 0.580 0.580 1.00% 0.0058 0.5807 0.5799i-Pentane mol% 0.000 0.000 1.00% 0.0000 0.0000 0.0000n-Hexane mol% 0.030 0.030 1.00% 0.0003 0.0297 0.0297n-Heptane mol% 0.000 0.000 1.00% 0.0000 0.0000 0.0000n-Octane mol% 0.000 0.000 0.00% 0.0000 0.0000 0.0000n-Nonane mol% 0.000 0.000 0.00% 0.0000 0.0000 0.0000n-Decane mol% 0.000 0.000 0.00% 0.0000 0.0000 0.0000Total mol% 100.000 100.00 100.15 100.00
Normalised True Result Method Uncertainty MCS Mean MCS Uncertainty Trials with
Method Trials
Line Density Kg/m3 (AGA8) 14.98 0.10% 14.98 4.41% 15.29 15.29
Standard Density Kg/m3 (AGA8) 0.8311 0.10% 0.83 0.34% 0.8310 0.8310
Line/Standard 18.03 18.02 4.40% 18.40 18.40

A New Approach to MPFM Performance Assessment in Heavy Oil, Martin Basil, SOLV Ltd, MMR May 2008, Galveston, Tx 1616
Venturi Overview
• Mixture Actual Volume Flow rate uses Mixture Density from the Dual Gamma Module and ISO5167-4 for the Venturi. Uncertainty is found by RSS and MCS
• Venturi Coefficient of Discharge Cd at low Reynolds Number is found from a look-up table.
• Oil Actual Volume Flow is found fromQvoil = Qvmix x (1-GVF) x (1-WLR)
• Oil Standard Volume Flow rate is found from the API thermal and compressibility correctionsQsvoil = Qvoil x Ctloil x Cploil
A New Approach to MPFM Performance Assessment in Heavy Oil, Martin Basil, SOLV Ltd, MMR May 2008, Galveston, Tx 1717
Viscosity• Emulsion Viscosity was found from a
laboratory study reservoir fluids by shearing the fluids in a mixture at various rates to simulate the action of the ESP’s to find the viscosity over the expected temperature range
• The following slides show variation in the viscosity dead crude with temperature and the variation of an emulsion of live crude with WLR and temperature

A New Approach to MPFM Performance Assessment in Heavy Oil, Martin Basil, SOLV Ltd, MMR May 2008, Galveston, Tx 1818
Heavy Crude ViscosityViscosity of Heavy Crude vs Temperature
0
100
200
300
400
500
600
0 5 10 15 20 25 30 35 40 45 50
Temperature (°C)
Vis
cosi
ty (c
P)
Dead - Shear Rate = 30 1/sDead - Shear Rate = 100 1/sDead - Shear Rate = 300 1/sLive - Shear Rate = 30 1/sLive - Shear Rate = 100 1/sLive - Shear Rate = 300 1/s

A New Approach to MPFM Performance Assessment in Heavy Oil, Martin Basil, SOLV Ltd, MMR May 2008, Galveston, Tx 1919
Emulsion ViscosityViscosity of Live Emulsions at 100 1/s
0
2,000
4,000
6,000
8,000
10,000
12,000
0 10 20 30 40 50 60
Emulsion (% Brine Content)
Vis
cosi
ty (c
P)
40 °F60 °F80 °F100 °F120 °F
Live Crude was ~250 psig at 40°F

A New Approach to MPFM Performance Assessment in Heavy Oil, Martin Basil, SOLV Ltd, MMR May 2008, Galveston, Tx 2020
Kinematic Viscosity
0%12%24%36%48%60%
0%
24%
48%0
500
1,000
1,500
2,000
2,500
3,000
3,500
Kinematic Viscosity cSt
%WLR
%GVF
• Kinematic Viscosityincreases with increasing WLR due to the emulsion and with GVF due to density decrease

A New Approach to MPFM Performance Assessment in Heavy Oil, Martin Basil, SOLV Ltd, MMR May 2008, Galveston, Tx 2121
Reynolds Number
0%
12%
24%
36%
48%
60%
0%12%
24%36%
48%60%
0
5,000
10,000
15,000
20,000
25,000
Reynolds NumberRn
%WLR
%GVF
• Reynolds Numberdecreases with kinematic viscosity

A New Approach to MPFM Performance Assessment in Heavy Oil, Martin Basil, SOLV Ltd, MMR May 2008, Galveston, Tx 2222
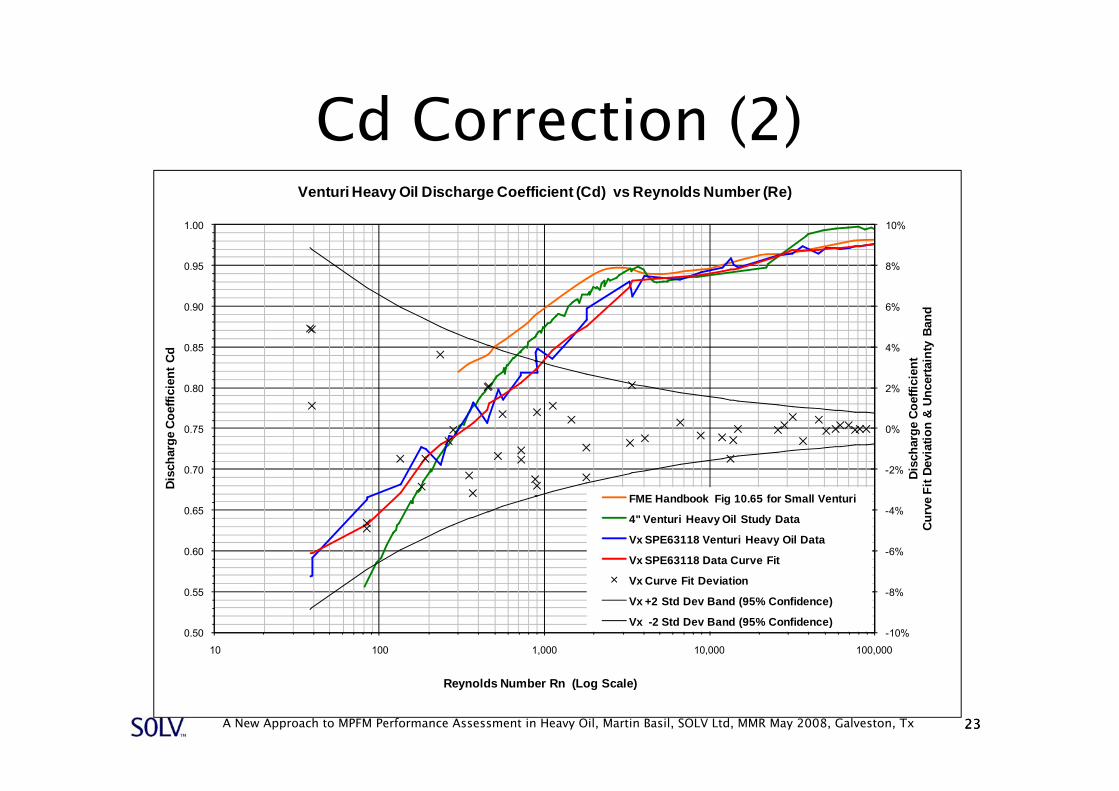
Cd Correction (1)• Cd is found from a curve fit of Reynolds Number to
Cd from Heavy Oil paper SPE63118• Curve Fit of SPE63118 agrees well with a recent
Heavy Oil Venturi study and is similar to the FME Handbook with the hip in the same place
• Uncertainty of SPE63118 was found from the standard deviation of the curve fit deviation with the original data. May not be representative but the in the absence of other information this has to suffice
A New Approach to MPFM Performance Assessment in Heavy Oil, Martin Basil, SOLV Ltd, MMR May 2008, Galveston, Tx 2323
Cd Correction (2)
-10%
-8%
-6%
-4%
-2%
0%
2%
4%
6%
8%
10%
0.50
0.55
0.60
0.65
0.70
0.75
0.80
0.85
0.90
0.95
1.00
10 100 1,000 10,000 100,000
Disc
harg
e Co
effic
ient
Curv
e Fi
t Dev
iatio
n &
Unce
rtain
ty B
and
Disc
harg
e Co
effic
ient
Cd
Reynolds Number Rn (Log Scale)
Venturi Heavy Oil Discharge Coefficient (Cd) vs Reynolds Number (Re)
FME Handbook Fig 10.65 for Small Venturi
4" Venturi Heavy Oil Study Data
Vx SPE63118 Venturi Heavy Oil Data
Vx SPE63118 Data Curve Fit
Vx Curve Fit Deviation
Vx +2 Std Dev Band (95% Confidence)
Vx -2 Std Dev Band (95% Confidence)

A New Approach to MPFM Performance Assessment in Heavy Oil, Martin Basil, SOLV Ltd, MMR May 2008, Galveston, Tx 2424
Oil Standard Volume Uncertainty
0%12%24%36%48%60%
0%12%
24%36%
48%
60%
2%
3%
3%
4%
4%
5%
5%
6%
6%
Discharge CoeffcientUncertainty +/-%
%WLR
%GVF
0%12%
24%36%
48%60%
0%12%
24%
36%
48%
60%
2%
3%
3%
4%
4%
5%
5%
6%
6%
Venturi Mass FlowUncertainty +/-%
%WLR
%GVF
0%12%
24%36%
48%60%
0%12%
24%36%
48%60%
0%
1%
2%
3%
4%
5%
6%
7%
8%
9%
Crude Oil Standard Volume Flow Measurement
Uncertainty +/-%
%WLR%GVF
0%
12%
24%
36%
48%
60%
0%12%
24%36%
48%60%
0
5,000
10,000
15,000
20,000
25,000
Reynolds NumberRn
%WLR
%GVF0%12%24%36%48%60%
0%12%
24%36%
48%
60%
0
500
1,000
1,500
2,000
2,500
3,000
3,500
Kinematic Viscosity cSt
%WLR
%GVF
Viscosity
Cd
CdUncertainty
VenturiMass
0% 12% 24% 36% 48% 60%0%
12%
24%36%
48%60%
0.7000
0.7500
0.8000
0.8500
0.9000
0.9500
1.0000
Discharge Coeffcient
%WLR
%GVF
Rn

A New Approach to MPFM Performance Assessment in Heavy Oil, Martin Basil, SOLV Ltd, MMR May 2008, Galveston, Tx 2525
Case 1Description Units Measurement Uncertainty BiasMeter Type 52mmGamma Count Sample Rate Seconds 40Liquid Line Flow Rate bpd 20,000Gas Standard Density SG 0.68 0.0023 lb/cf 0 lb/cf
Oil Standard Density APIº 20.6 0.58 lb/cf 1.87 lb/cf
Water Standard Density lb/cf 64.30 0.32 lb/cf 1.87 lb/cf
Temperature ℉ 78 0.45
Pressure psig 250.00 0.76
Emulsion Viscosity %WLR cP0% 121.00
12% 198.00 24% 361.00 36% 698.00 48% 1,806.00 60% 3,299.00
Results Units GVF=0%, WLR = 0%
GVF=60%, WLR=0%
GVF=0%, WLR=60%
GVF=60%, WLR=60%
Oil Standard Volume Observed stbpd 20,011 20,022 8,032 7,918
Oil Standard Volume Uncertainty % 2.7% 2.8% 7.1% 7.6%
Oil Standard Volume Bias % -0.1% -0.1% -0.4% -0.4%
GVF Observed %GVF -3.3% 58.7% -3.1% 58.8%
GVF Uncertainty %GVF 0.6% 0.5% 0.7% 0.5%
GVF Bias %GVF 3.3% 1.3% 3.1% 1.2%
WLR Observed %WLR 0.0% 0.0% 59.9% 59.9%
WLR Uncertianty %WLR 1.0% 2.0% 1.5% 2.7%
WLR Bias %WLR 0.0% 0.0% 0.1% 0.1%
Mixture Density Observed kg/m3 953.52 390.40 1,015.81 415.30
Mixture Density Uncertainty % 1.1% 1.4% 0.9% 1.2%
Mixture Density Bias % -3.1% -3.1% -2.9% -2.9%
Mixture Mass Flow Observed kg/s 34.19 35.02 36.49 37.32
DP Observed mbar 1515 3690 3108 5356
Viscosity Observed cSt 131 53 3346 1339
Reynolds Number Observed 3459 21374 135 846
Discharge Coefficient Observed 0.932 0.955 0.672 0.819
Discharge Coefficient Uncertainty % 2.164% 1.242% 5.960% 3.367%
ResultsDP 1.5 to 5.5 bar
Qm 34 to 37 kg/s
Visc 53 to 3,346 cSt
Rn 135 to 21,374
Cd 0.67 to 0.93
UCd 1.2 to 6% OMV
Qsv 7.9 to 20 kstbpd
UQsv 2.7 to 7.6% OMV

A New Approach to MPFM Performance Assessment in Heavy Oil, Martin Basil, SOLV Ltd, MMR May 2008, Galveston, Tx 2626
Oil Standard Volume Uncertainty
0%
12%
24%
36%48%
60%
0%12%
24%36%
48%60%
0%
1%
2%
3%
4%
5%
6%
7%
8%
Crude Oil Standard Volume Flow Measurement
Uncertainty +/-%
%WLR%GVF
7.00%-8.00%
6.00%-7.00%
5.00%-6.00%
4.00%-5.00%
3.00%-4.00%
2.00%-3.00%
1.00%-2.00%
0.00%-1.00%

A New Approach to MPFM Performance Assessment in Heavy Oil, Martin Basil, SOLV Ltd, MMR May 2008, Galveston, Tx 2727
Conclusions (1)• Oil Standard Volume Uncertainty
– ±3%OMV within ± 0.5%OMV agreement between analysis and the stated uncertainty for 0 to 12%WLR and 0 to 60%GVF
– The stated uncertainty did not allow for low Cd. Once this was included the worst case difference dropped from ±5.5%OMV to ±3%OMV
– Confirmed analysis as a means of verification– Uncertainty at >12%WLR increased due to high
viscosity so temperature will be kept as high as possible by plant operation

A New Approach to MPFM Performance Assessment in Heavy Oil, Martin Basil, SOLV Ltd, MMR May 2008, Galveston, Tx 2828
Conclusions (2)• Benefits of Analytical Performance
– Use early in a project before committing funds– Independent verification with physical properties– Lower cost and shorter timescale than testing– Transparency improves confidence in MPFM’s– A greater range of scenarios can be examined– Model may be used throughout field life
• Future Developments– Use all available RN vs Cd characterisation data– Add a slip model, not required for Heavy Oil– Link mass attenuation to automatically calculate

A New Approach to MPFM Performance Assessment in Heavy Oil, Martin Basil, SOLV Ltd, MMR May 2008, Galveston, Tx 2929
Thanks to…
• Co-authors Gordon Stobie & Chip Letton
• Andrew Hall for his assistance with mass attenuation factors

A New Approach to MPFM Performance Assessment in Heavy Oil, Martin Basil, SOLV Ltd, MMR May 2008, Galveston, Tx 3030
Questions?