microarray technology - computer science … 9 steps in a microarray experiment basic steps are the...
TRANSCRIPT
1
Lecture 1Introduction to Microarray
TechnologyStat 697K, CS 691K,
Microbio 690K
2
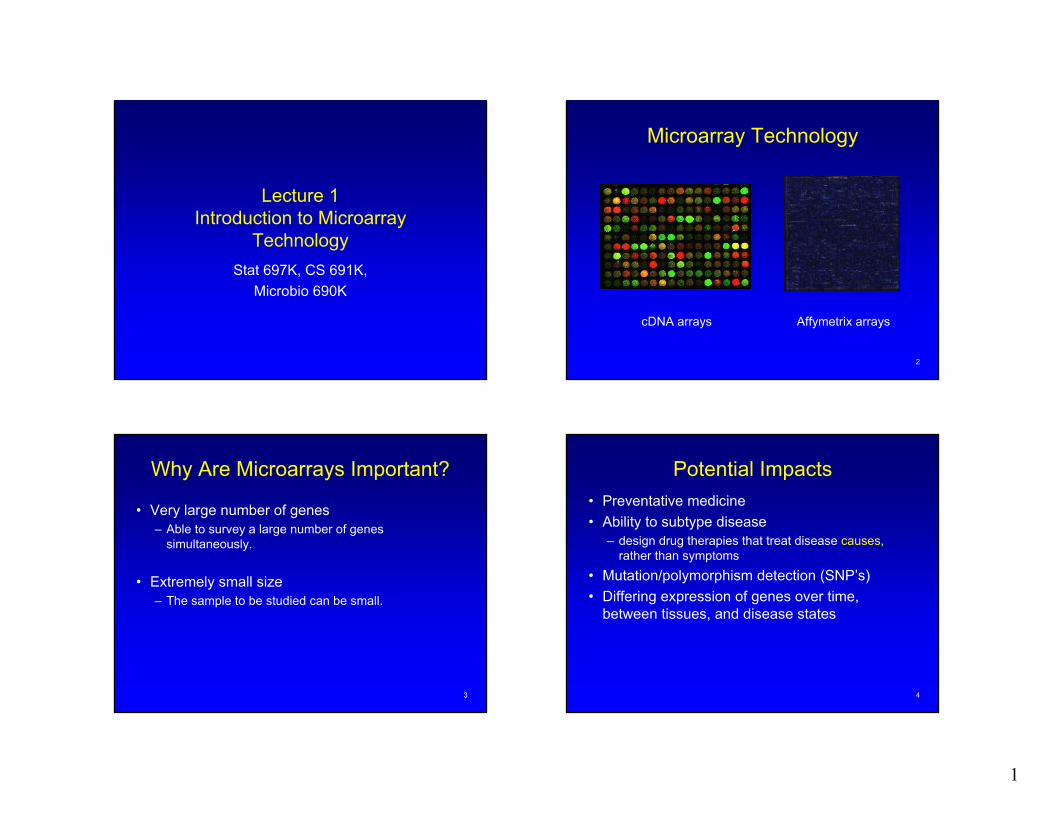
Microarray Technology
cDNA arrays Affymetrix arrays
3
Why Are Microarrays Important?
• Very large number of genes– Able to survey a large number of genes
simultaneously.
• Extremely small size– The sample to be studied can be small.
4
Potential Impacts• Preventative medicine• Ability to subtype disease
– design drug therapies that treat disease causes, rather than symptoms
• Mutation/polymorphism detection (SNP’s)• Differing expression of genes over time,
between tissues, and disease states
2
5
Application Examples• Same organism, different tissue (brain vs skin)• Same tissue, different condition (tumor vs non-tumor)• Same tissue, different organism (wild-type vs knock-out)• Time course experiments (cell cycle, development)• Different experimental conditions (glucose vs. lactose)
6
Two Most Common Types of Microarrays
cDNA and Affymetrix arrays
Technology differs in:• How DNA sequences are placed on slides
– spotting vs. photolithography • photolithography: oligonucleotides are built base-by-base on
the array surface. Makes use of semiconductor technologies. • Length of DNA sequences that are placed on
slides– complete gene sequences vs. series of fragments
7
cDNA Arrays• also called spotted arrays• size: standard glass slide• entire gene sequence is on slide• robotic spotting of gene sequences onto slide• from Pat Brown’s Lab at Stanford
Spotting area = 72 mm x 22 mm
Slide dimension = 76 mm x 25 mm x 1 mm (3 x 1 x .04 inches)(standard glass slide)
8
Affymetrix Arrays• also called oligonucleotide arrays• size: 1.28 cm x 1.28 cm (0.5 inch x 0.5 inch)• multiple short pieces of sequence per gene on slide• photolithography to place sequences onto slide base by
base• from company Affymetrix
Source: Affymetrix Inc.
3
9
Steps in a Microarray ExperimentBasic steps are the same for each type of array:
1) DNA complementary to genes of interest is laid out on array at defined positions
2) DNA from experimental samples is placed over the array; complementary DNA binds
3) Presence of bound DNA is detected by fluorescence following laser excitation
10
Gene Expression• Each cell contains a complete set of DNA. • Only a fraction of genes are used (or
“expressed”) in any particular cell at any given time. – for example, genes specific to liver cells are not
expressed in brain cells.
11
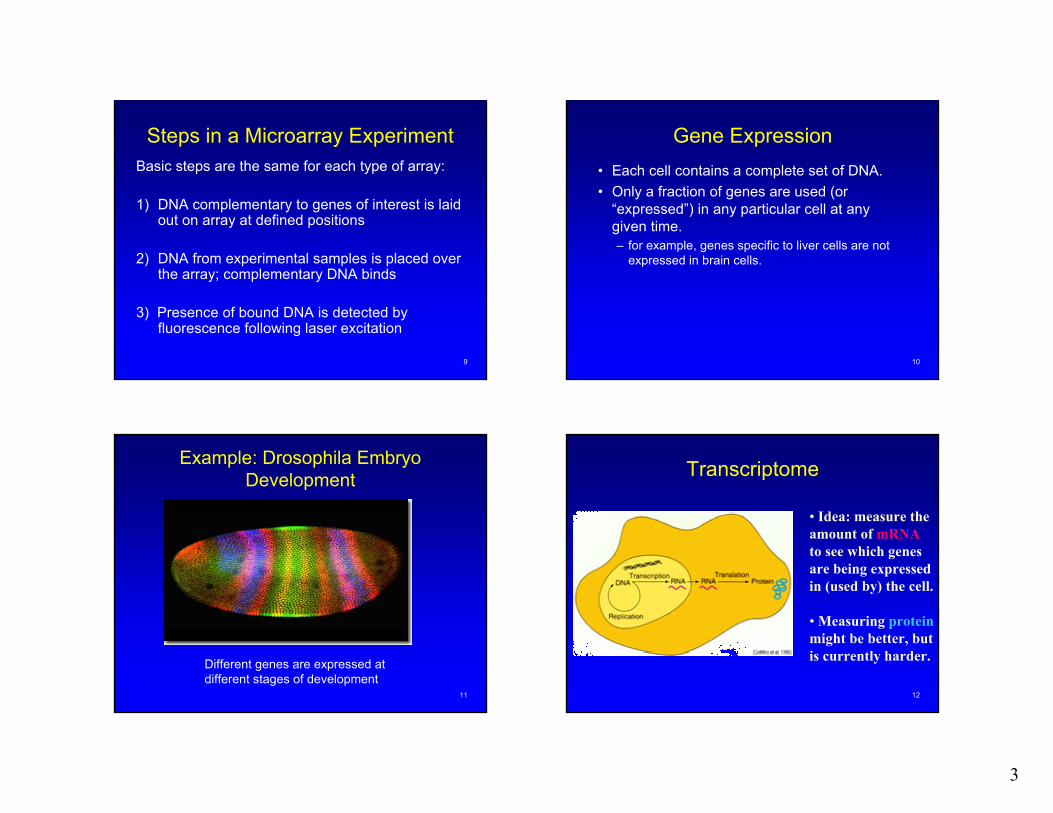
Example: Drosophila Embryo Development
Different genes are expressed at different stages of development
12
• Idea: measure the amount of mRNAto see which genes are being expressedin (used by) the cell.
• Measuring proteinmight be better, but is currently harder.
Transcriptome

4
13
Transcription
• Information contained within the DNA is transcribed into messenger RNA (mRNA) molecules.
• We study the kinds and amounts of mRNA produced by a cell to learn which genes are expressed in certain conditions.
• Gene expression is a highly complex and tightly regulated mechanism. Both an “on/off” switch and a “volume control”.
14
Methods to Measure mRNA Abundance
• Northern blotting is the traditional method. Considered the gold standard, but it is done gene by gene and very time consuming– low throughput
• Expression profiling using microarray data, although noisy, can provide expression information on many thousands of genes in parallel– high throughput
15
Microarrays
• DNA microarray technology relies on the hybridization properties of nucleic acids to monitor mRNA abundance on a genomic scale in different types of cells.
• “Microarrays can be used as a new kind of microscope that allows us to observe a genome’s gene expression program” ---Pat Brown.
16
cDNA Microarrays
5
17
Definitions
• Probe: DNA sequences spotted on the array, immobile substrate.
• Target: Nucleic acid samples hybridized to the array, mobile substrate.
(Some researchers use the exact opposite terminology, i.e. target is immobile, probe is mobile)
18
Overview
• A robot precisely applies tiny droplets containing functional DNA to glass slides
• Researchers then attach fluorescent labels to DNA from the cell they are studying
• The labeled samples are allowed to bind to complementary DNA strands on the slides
• The slides are put into a scanning microscope that can measure the brightness of each fluorescent spot
• Brightness reveals how much of a specific DNA fragment is present, an indicator of how active it is
19
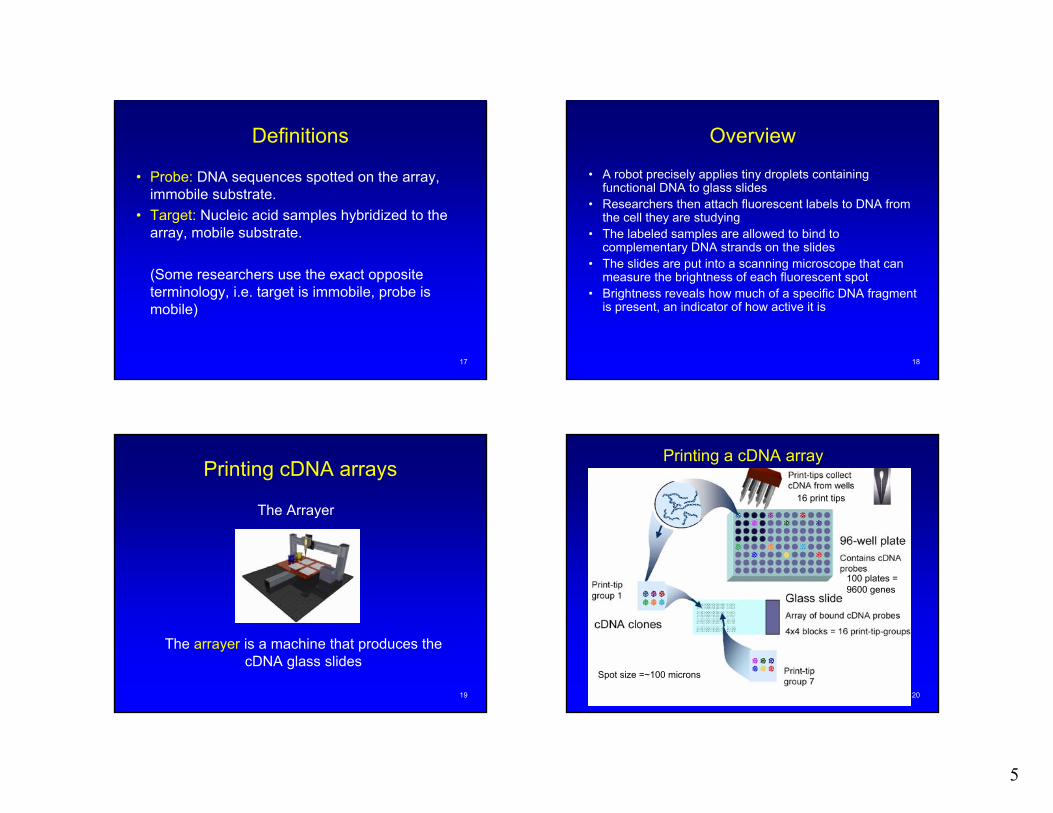
Printing cDNA arrays
The arrayer is a machine that produces the cDNA glass slides
The Arrayer
20
Spot size =~100 microns
Printing a cDNA array
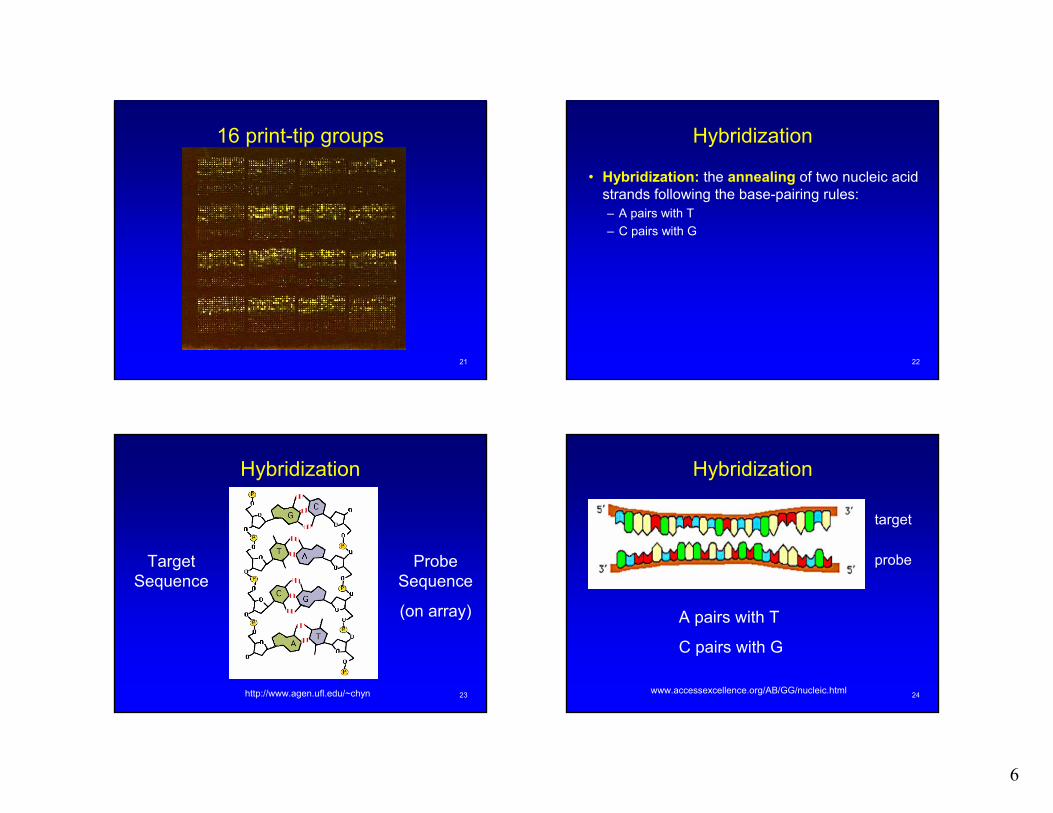
16 print tips
100 plates = 9600 genes
6
21
16 print-tip groups
22
Hybridization
• Hybridization: the annealing of two nucleic acid strands following the base-pairing rules: – A pairs with T – C pairs with G
23
Hybridization
Target Sequence
Probe Sequence
(on array)
http://www.agen.ufl.edu/~chyn 24
Hybridization
probe
target
A pairs with T
C pairs with G
www.accessexcellence.org/AB/GG/nucleic.html

7
25
Sample Preparation• Prepare two samples for hybridization to the array:
– An experiment and control sample, i.e. tumor and normal tissue
• mRNA is extracted from samples and reverse transcribed into cDNA– makes it more stable
• During reverse transcription, a fluorescent dye is incorporated into the newly formed cDNA
• Control sample is labeled with a green fluorescent dye called Cy3
• Experiment sample is labeled with a red fluorescent dye called Cy5
• The samples are mixed and hybridized to the slide
26
Scanning• The slide is scanned twice
– Once to measure red intensity– Once to measure green intensity
• The images are overlayed to produce one image(more details in next lecture on image analysis)
27
Microarray Steps
28
Expression Measurement • Two-dye design: measure comparative
expression level by competitive hybridization• The ratio of the red and green fluorescent
intensities for each spot is measured• The intensities indicate the relative abundance
of expression of the red and green-labeled samples, for each gene
8
29
Measurement
M = logR/G = logR - logG• M<0: gene is over-expressed in green-labeled
sample compared to red-labeled sample. • M=0: gene is equally expressed in both
samples.• M>0: gene is over-expressed in red-labeled
sample compared to green-labeled sample.
30
cDNA Microarray
• Two-dye design: measure comparative expression level by competitive hybridization
• Advantage– Relatively inexpensive – Flexibility of custom-made array
• Disadvantage– More variability
31
Advantages of cDNA Arrays• Do not require full sequence information • Inexpensive hardware• Easy to design and print custom arrays
– species of interest• Simultaneous two-color hybridization• Low cost per chip• Replicate experiments are feasible
32
Disadvantages of cDNA Arrays• Relatively large amount of RNA required• Cross-hybridization between spots• Chip manufacture is labor intensive• Laboratory set-up is expensive• Highly specialized equipment is required• High reagent costs (Taq, fluros)• More variability• Difficult to compare results across different
experiments
9
33
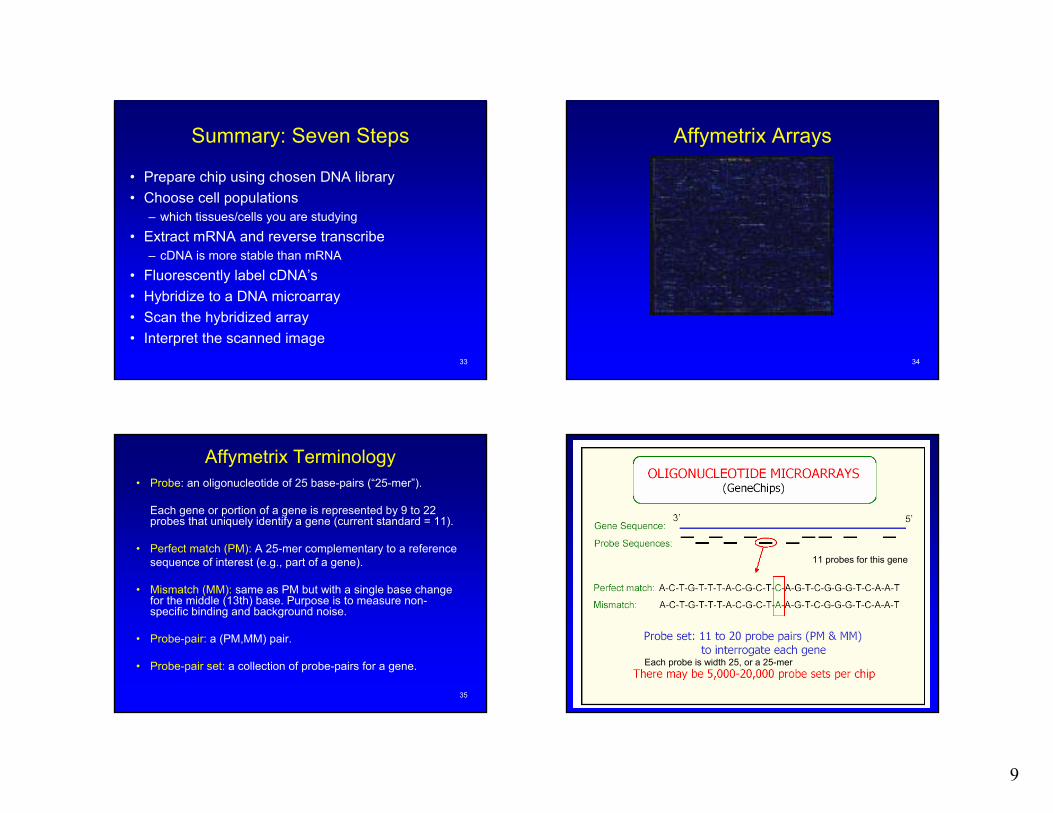
Summary: Seven Steps
• Prepare chip using chosen DNA library• Choose cell populations
– which tissues/cells you are studying• Extract mRNA and reverse transcribe
– cDNA is more stable than mRNA• Fluorescently label cDNA’s• Hybridize to a DNA microarray• Scan the hybridized array• Interpret the scanned image
34
Affymetrix Arrays
35
Affymetrix Terminology• Probe: an oligonucleotide of 25 base-pairs (“25-mer”).
Each gene or portion of a gene is represented by 9 to 22 probes that uniquely identify a gene (current standard = 11).
• Perfect match (PM): A 25-mer complementary to a referencesequence of interest (e.g., part of a gene).
• Mismatch (MM): same as PM but with a single base change for the middle (13th) base. Purpose is to measure non-specific binding and background noise.
• Probe-pair: a (PM,MM) pair.
• Probe-pair set: a collection of probe-pairs for a gene.
36
Each probe is width 25, or a 25-mer
11 probes for this gene

10
37Source: Affymetrix Inc.
- One cell for each probe; 500,000 cells on each chip
- Millions of copies of a probe sequence in each cell
38
Probe Creation and Selection• Probes are selected to have little cross-reactivity with
other genes, so that non-specific hybridization will be minimized
• Probe cells are square-shaped features on the chip containing millions of copies of a single 25-mer probe.
• The probes are synthesized in situ, using photolithography and combinatorial chemistry– similar to semiconductor technology– very fast
• Some non-specific hybridization will occur– to combat this, MM values are subtracted from PM
(more detail in later lectures)
39
Sample Preparation• Only one sample is hybridized to each array • Steps in sample preparation
– Extract mRNA from cells– Use reverse transcription to turn mRNA into cDNA– Transcribe cDNA to cRNA while incorporating a biotin
label
40
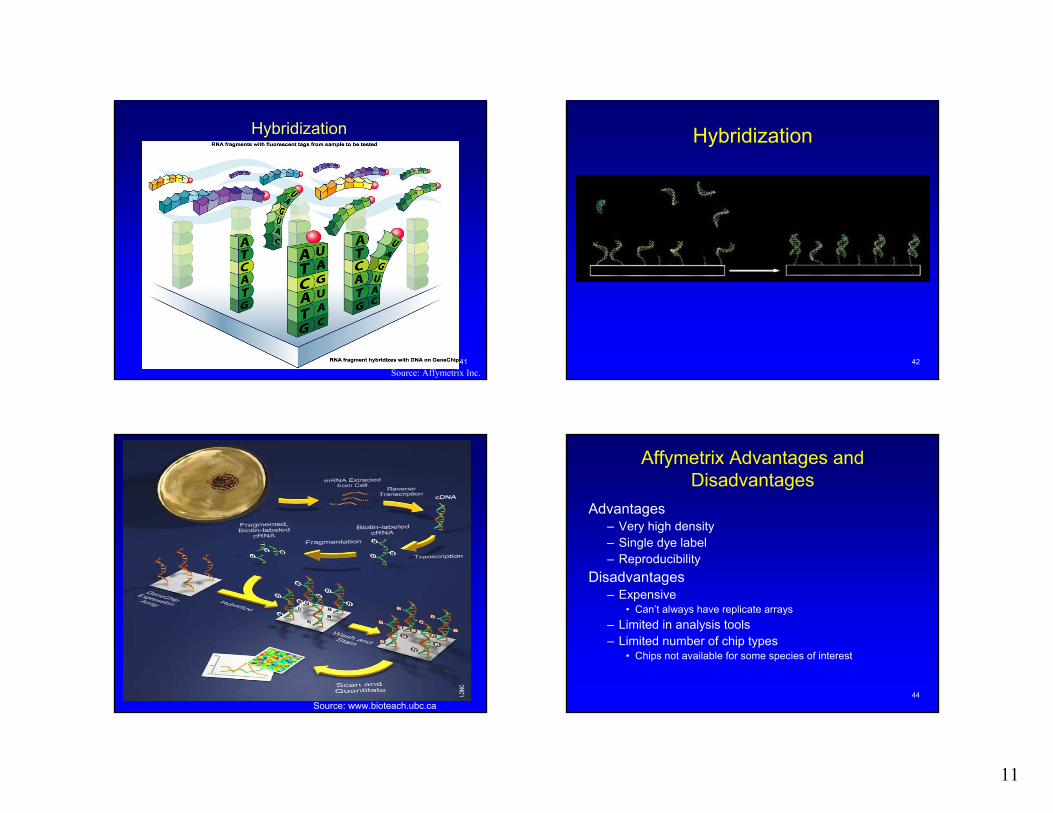
Hybridize, Stain, Scan• The biotin-labeled sample is hybridized to the
chip• The chip is washed and stained
– stained to help visualize the hybridization • The chip is scanned using an array scanner
11
41Source: Affymetrix Inc.
Hybridization
42
Hybridization
43Source: www.bioteach.ubc.ca
44
Affymetrix Advantages and Disadvantages
Advantages– Very high density – Single dye label– Reproducibility
Disadvantages– Expensive
• Can’t always have replicate arrays– Limited in analysis tools– Limited number of chip types
• Chips not available for some species of interest
12
45
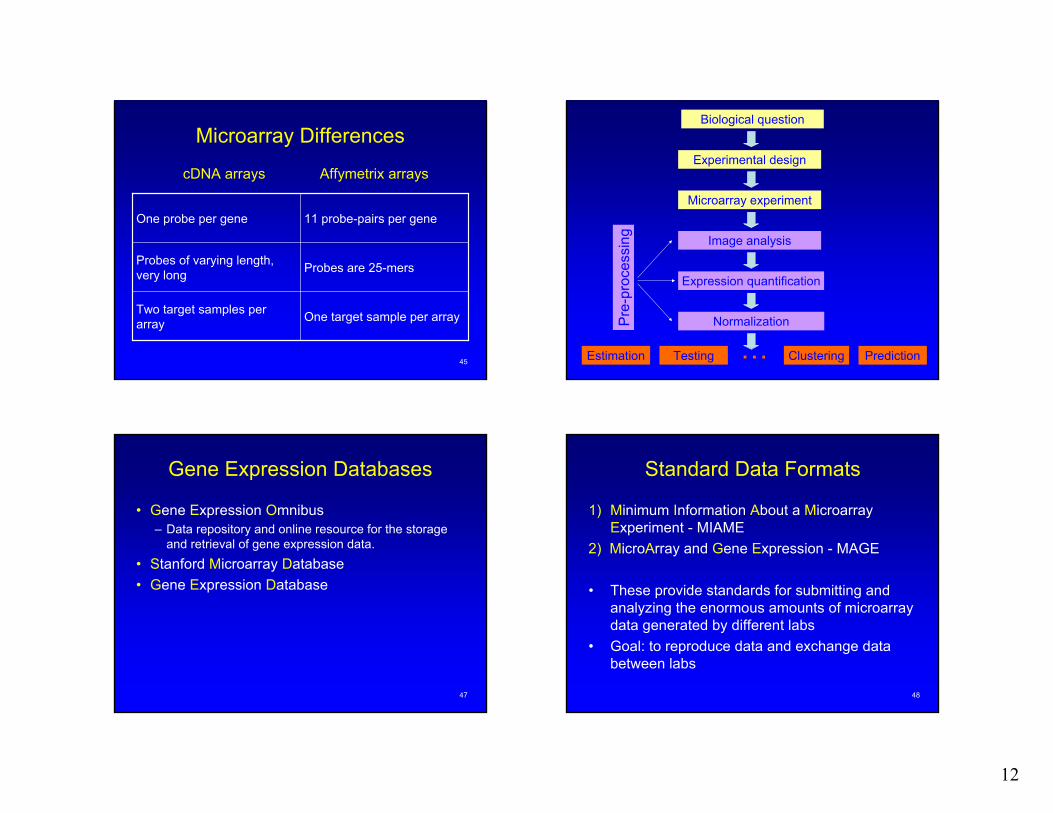
Microarray Differences
One target sample per arrayTwo target samples per array
Probes are 25-mersProbes of varying length, very long
11 probe-pairs per geneOne probe per gene
cDNA arrays Affymetrix arrays
46
Biological question
Experimental design
Microarray experiment
Image analysis
Expression quantification
Normalization
Estimation Testing Clustering Prediction…
Pre
-pro
cess
ing
47
Gene Expression Databases
• Gene Expression Omnibus– Data repository and online resource for the storage
and retrieval of gene expression data.• Stanford Microarray Database• Gene Expression Database
48
Standard Data Formats
1) Minimum Information About a Microarray Experiment - MIAME
2) MicroArray and Gene Expression - MAGE
• These provide standards for submitting and analyzing the enormous amounts of microarray data generated by different labs
• Goal: to reproduce data and exchange data between labs
13
49
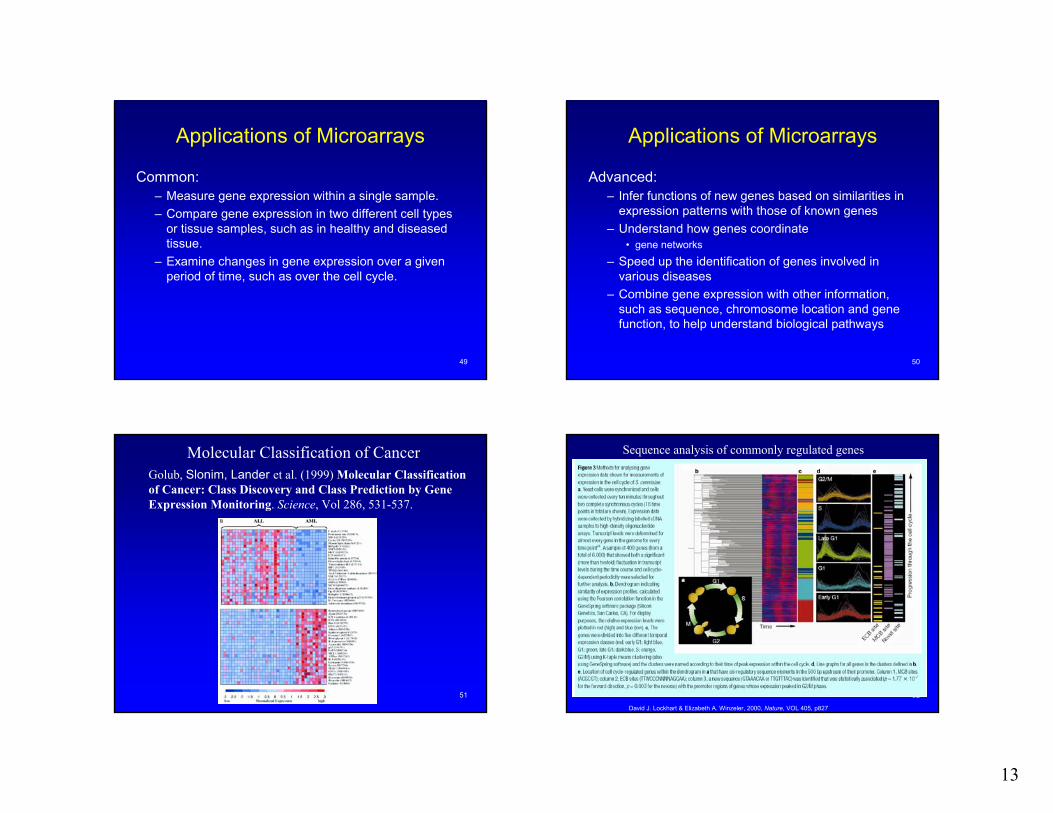
Applications of Microarrays
Common:– Measure gene expression within a single sample.– Compare gene expression in two different cell types
or tissue samples, such as in healthy and diseased tissue.
– Examine changes in gene expression over a given period of time, such as over the cell cycle.
50
Applications of Microarrays
Advanced:– Infer functions of new genes based on similarities in
expression patterns with those of known genes– Understand how genes coordinate
• gene networks
– Speed up the identification of genes involved in various diseases
– Combine gene expression with other information, such as sequence, chromosome location and gene function, to help understand biological pathways
51
Golub, Slonim, Lander et al. (1999) Molecular Classification of Cancer: Class Discovery and Class Prediction by Gene Expression Monitoring. Science, Vol 286, 531-537.
Molecular Classification of Cancer
52
David J. Lockhart & Elizabeth A. Winzeler, 2000, Nature, VOL 405, p827
Sequence analysis of commonly regulated genes
14
53
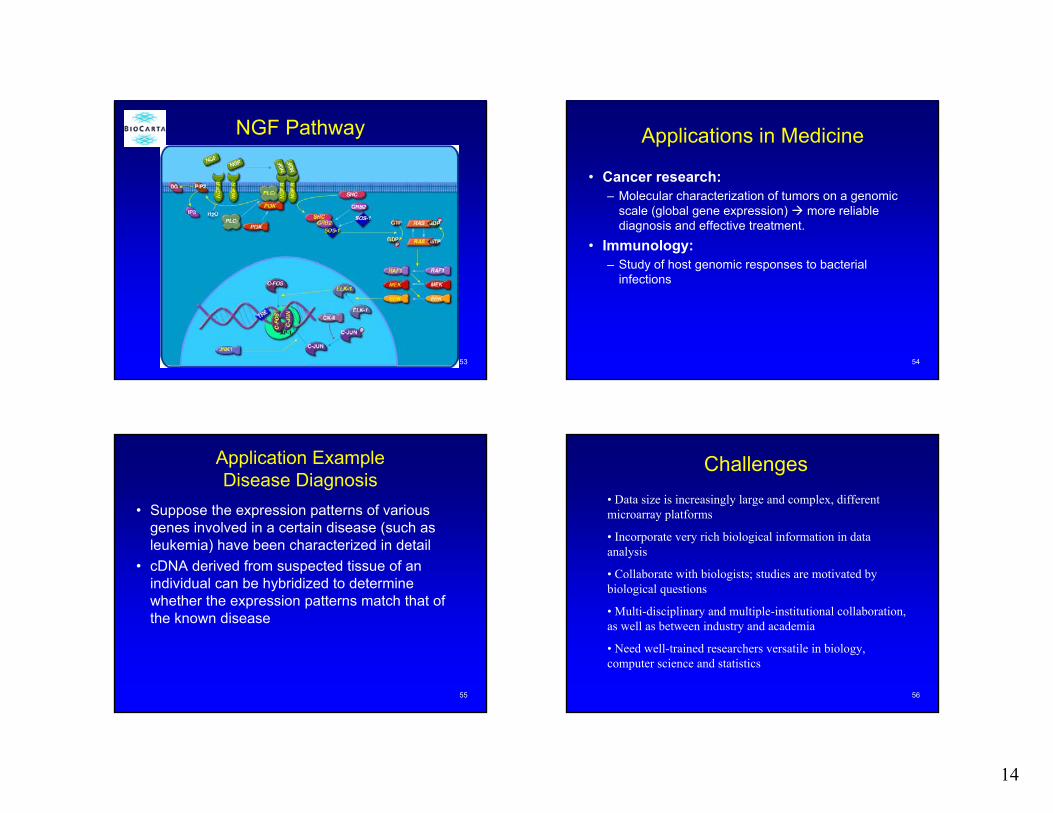
NGF Pathway
54
Applications in Medicine
• Cancer research:– Molecular characterization of tumors on a genomic
scale (global gene expression) more reliable diagnosis and effective treatment.
• Immunology:– Study of host genomic responses to bacterial
infections
55
Application Example Disease Diagnosis
• Suppose the expression patterns of various genes involved in a certain disease (such as leukemia) have been characterized in detail
• cDNA derived from suspected tissue of an individual can be hybridized to determine whether the expression patterns match that of the known disease
56
Challenges• Data size is increasingly large and complex, different microarray platforms
• Incorporate very rich biological information in data analysis
• Collaborate with biologists; studies are motivated by biological questions
• Multi-disciplinary and multiple-institutional collaboration, as well as between industry and academia
• Need well-trained researchers versatile in biology, computer science and statistics
15
57
Statistics Tutorial
• http://www.wadsworth.org/resnres/bioinfo/tut1/By Charles Lawrence and Jun S. Liu
58
cDNA References• Schena M, Shalon D, Davis R, Brown P (1995) Quantitative
monitoring of gene expression patterns with a complementary DNA microarray. Science 270 467-470.
• DeRisi JL, Iyer VR, Brown PO (1997) Exploring the metabolic and genetic control of gene expression on a genomic scale. Science 278 680-686.
• Southern EM (2000) DNA microarrays. History and overview. Methods Mol Biol 170 1-15.
• Hardiman G (2002) Microarray technologies – an overview. Pharmacogenomics 3(3) 293-297.
• Nature Genetics – Chipping Forecast – devoted to microarrays (Volume 21 supplement 1-60, 1999).
59
Affymetrix Reference
• Lockhart et al. (1996) Expression monitoring by hybridization to high-density oligonucleotide arrays. Nature Biotechnology 14 1675-1680.
60
Credits
• Steve Qin• Jun Liu• Wing Wong• Sandrine Dudoit• Robert Gentleman• Rafael Irizarry• Yee Hwa Yang• Terry Speed• Emile F. Nuwaysir
• Rebecca Fry• Jeff Townsend• Leona Samson• Alan Robinson• Heather Harrington• Eduardo D. Sontag
These slides are based in large part on lectures by Steve Qin, University of Michigan, with generous permission.