biovlab-microarray: microarray data analysis in virtual environment
DESCRIPTION
BioVLAB-Microarray: Microarray Data Analysis in Virtual Environment. Youngik Yang, Jong Youl Choi, Kwangmin Choi, Marlon Pierce, Dennis Gannon, and Sun Kim School of Informatics Indiana University. CONTENTS. Introduction Approach Related Works Microarray technology System Architecture - PowerPoint PPT PresentationTRANSCRIPT

BioVLAB-Microarray: Microarray Data Analysis in Virtual Environment
Youngik Yang, Jong Youl Choi, Kwangmin Choi, Marlon Pierce,
Dennis Gannon, and Sun Kim
School of Informatics Indiana University

CONTENTS
• Introduction• Approach• Related Works• Microarray technology• System Architecture• Experiments• Conclusion• Demo

INTRODUCTION
• Analysis of high throughput microarray experiment• Performing microarray analysis is a demanding task
for biologists and small research labs• Computing infrastructure issue
– Computationally intensive– Nontrivial to integrate various bioinformatics applications
• Exploratory data analysis issue– Multiple tasks in a single batch– Repetitive execution

APPROACH
• On-demand computing resources• A suite of microarray analysis applications• Reconfigurable GUI workflow composer can alleviate
technical burden– Well defined workflow can be repetitively used
• Web portal• Reusable, reconfigurable, high-level workflow
execution workbench powered by computing clouds for microarray gene expression analyses

RELATED WORKS
• Efficient and user-friendly workflow composers and execution engine– SIBIOS, BioWBI, KDE Bioscience
• Distributed and heterogeneous computing resources + Workflow system– Taverna, Triana, Kepler, GNARE, RENCI-Bioportal

MICROARRAY TECHNOLOGY• A subset of genes is expressed
corresponding to environmental changes and its changing needs
• Dynamics of cell activity• Measure gene expression levels of
hundreds of thousands of genes within a cell
• Usage– Function prediction: Guilt by association– Interaction: Co-expression of genes in
transcription networks reveals how they interact.
– Drug discovery: Identify genes related to certain disease and detect effectiveness of new drugs
Source: www.liv.ac.uk/lmf/about_microarrays.htm

RESEARCH GOALS• Gene expression analysis
– Search for similar patterns of genes• Similar patterns of gene may reveal the function of a gene with unknown function
– Extraction of differentially expressed genes• Statistical evaluation
– Clustering• Protein function prediction• Genes with similar expression may need to be studied as a group
– Component analysis• Hidden structure of expression patterns may be revealed
• Expression network analysis– Expose hidden structures– Protein-protein interaction (PPI) network analysis
• Central issue: key role in understanding how a cellular system works• Modularity in structure in a network may reflect higher-level functional organization of
cellular components

MICROARRAY ANALYSIS COMMON TASK
• Output of a task can plugged into another task• Repeat the same set of tasks with small
changes of parameters

SYSTEM ARCHITECTURE
• Workflow composer and execution engine• Application services• Web portal
Web PortalWeb Portal
Application Services
Application Services
Workflow Composer & Execution
Workflow Composer & Execution
Execute
Manage Data Create

WORKFLOW COMPOSER & EXECUTION ENGINE
• Introduced in the scientific communities to execute a batch of multiple tasks
• Enables repetitive tasks easily• Directed acyclic graph
– Node: application to execute• Starting node: input• End node: output
– Edge: a flow of data
InputInput
OutputOutput
Task ATask A Task BTask B
Task CTask C

XBaya
• GUI Workflow composer and execution engine• Developed at IU• Drag-and-drop compose from workbench• Monitor status of workflow execution
Application Information Panel
Application Information Panel
Monitor PanelMonitor Panel
Workbench PanelWorkbench Panel Workflow
Composer Panel
Workflow Composer Panel
Drag-and-dropDrag-and-drop

APPLICATION SERVICES
• Interoperability among applications can be achieved by Application Services
• Generic Service Toolkit (Gfac)– Gfac converts command-line bioinformatics application
into a web service
• On-demand computing resources – Amazon Elastic Computing Cloud (EC2)
• Remote storage services– Amazon Simple Storage Services (S3) – Microsoft Application-Based Storage

BioVLAB APPLICATIONDEVELOPMENT PROCEDURE
• Develop a command line app.• Develop a command line app.
• Install the app. in Amazon EC2• Let the app. store any output to
Amazon S3 / Microsoft Application-Based Storage
• Make a virtual machine image• Register the app. by using Gfac
• Install the app. in Amazon EC2• Let the app. store any output to
Amazon S3 / Microsoft Application-Based Storage
• Make a virtual machine image• Register the app. by using Gfac
• Instantiate EC2 and run the app. by using XBaya
• Instantiate EC2 and run the app. by using XBaya (Gfac user manual)
Gfac Registration formGfac Registration form

WEB PORTAL
• Adiministrator– Management of
registered applications by Gfac registry portlet
– User management and access control
• User– access of stored data
• Built by Open Grid Computing Environments (OGCE)

ANALYSIS RESOURCES
• R: statistical learning• Bioconductor: microarray analysis• Data acquisition: NCBI GEO Microarray DB• Similar expression pattern: correlation• Differentially expressed gene: limma package• Clustering: K-means, hierarchical clustering, QT clustering,
biclustering, Self organizing map (SOM)• Component Analysis: principal component analysis (PCA) and
Independent component analysis (ICA)• Network: Database of Interacting Proteins (DIP), Perl Graph
package and GraphViz

EXPERIMENT
• Data set: GDS38– Remotely retrieved from the NCBI GEO database– Time-series gene expression data to observe cell
cycle in Saccharomyces cerevisiae yeast genome.– 7680 spots in each 16 samples– Each sample was taken every 7 minutes as cell
went through cell cycle.
• Expression analysis• PPI network analysis

EXPERIMENTS

CONCLUSION
• Microarray data analysis in virtual environment
• Coupling computing clouds and GUI workflow engine
• Effective system design for small research labs

FUTURE WORKS
• Integration of more packages and analyses• A system of great flexibility
– Integrate various high throughput data• Microarray, mass spectronomy, massively parallel
sequencing, etc
– Integrate various computing resources• Clouds, grid, and multi-core PCs
– Integrate various public resources• NCBI, KEGG, PDB, etc

SCREEN SHOTS
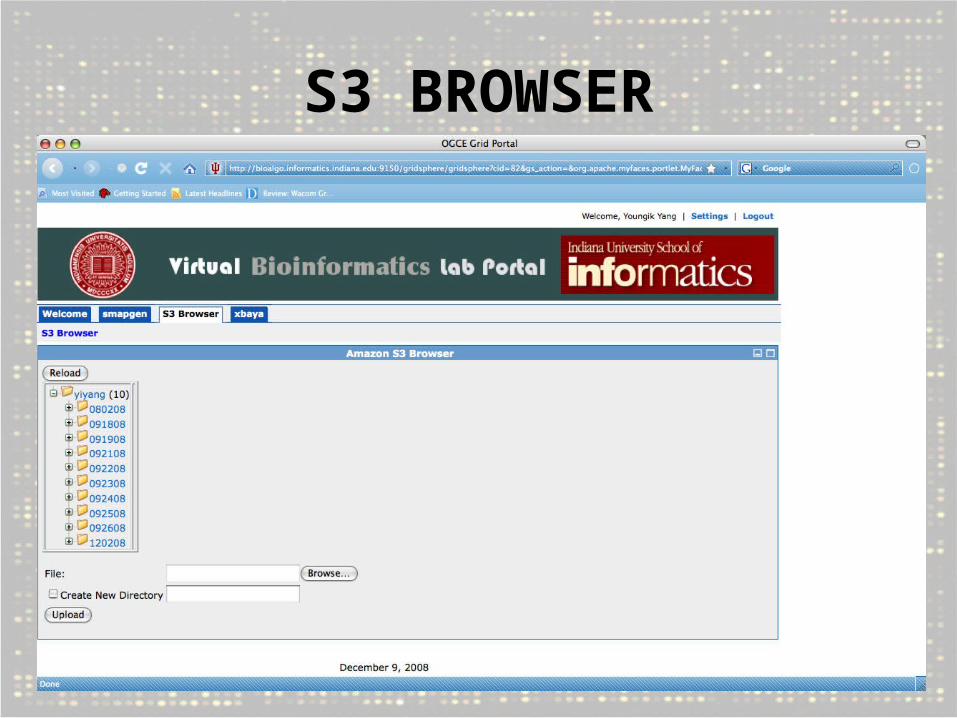
S3 BROWSER

EC2 ACTIVE INSTANCE
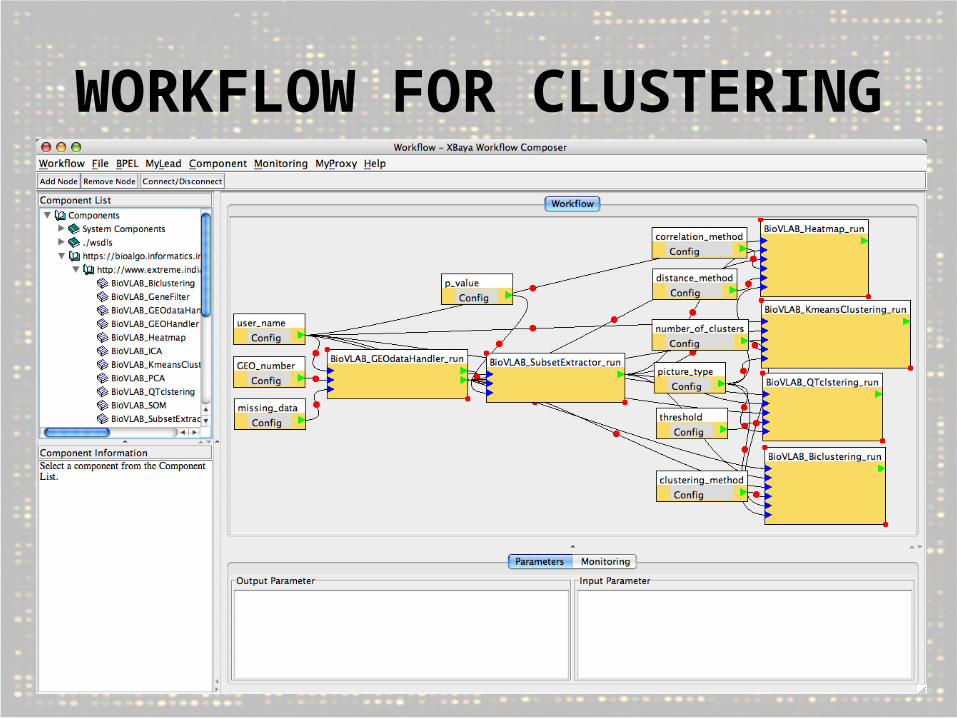
WORKFLOW FOR CLUSTERING

INPUT PARAMETERS

WORKFLOW EXECUTION

DATA ACQUISITION

SUBSET EXTRACTION

CLUSTERINGS
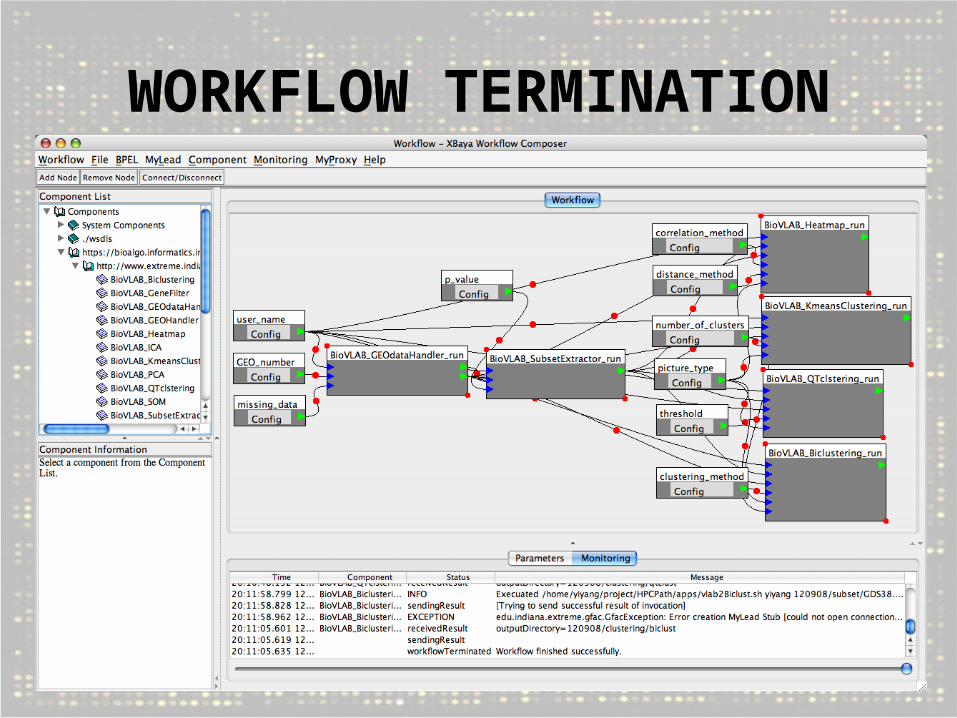
WORKFLOW TERMINATION

EXPERIMENT RESULT

DOWNLOAD FILE

HEATMAP FOR K-MEANS CLUSTERING

ACKNOWLEDGEMENT
• The work is partially supported by NSF MCB 0731950 and a MetaCyt Microbial Systems Biology grant from Lilly Foundations.
• Extreme Computing Group at IU – Suresh Marru, Srinath Perera, and Chathura
Herath

Thank You