mesophilic and thermophilic anaerobic digestion of source-sorted organic wastes: effect of ammonia...
TRANSCRIPT
ORIGINAL PAPER
C. Gallert á J. Winter
Mesophilic and thermophilic anaerobic digestionof source-sorted organic wastes: effect of ammoniaon glucose degradation and methane production
Received: 26 March 1997 / Received revision: 13 May 1997 /Accepted: 19 May 1997
Abstract The wet organic fraction of household wasteswas digested anaerobically at 37 °C and 55 °C. At bothtemperatures the volatile solids loading was increasedfrom 1 g l)1 day)1 to 9.65 g l)1 day)1, by reducing thenominal hydraulic retention time from 93 days to19 days. The volatile solids removal in the reactors atboth temperatures for the same loading rates was in asimilar range and was still 65% at 19 days hydraulicretention time. Although more biogas was produced inthe thermophilic reactor, the energy conservation inmethane was slightly lower, because of a lower methanecontent, compared to the biogas of the mesophilic re-actor. The slightly lower amount of energy conserved inthe methane of the thermophilic digester was presum-ably balanced by the hydrogen that escaped into the gasphase and thus was no longer available for methano-genesis. In the thermophilic process, 1.4 g/l ammoniawas released, whereas in the mesophilic process only 1 g/lammonia was generated, presumably from proteindegradation. Inhibition studies of methane productionand glucose fermentation revealed a Ki (50%) of 3 g/land 3.7 g/l ammonia (equivalent to 0.22 g/l and 0.28 g/lfree NH3) at 37 °C and a Ki (50%) of 3.5 g/l and 3.4 g/lammonia (equivalent to 0.69 g/l and 0.68 g/l free NH3)at 55 °C. This indicated that the thermophilic ¯oratolerated at least twice as much of free NH3 than themesophilic ¯ora and, furthermore, that the thermophilic¯ora was able to degrade more protein. The apparentammonia concentrations in the mesophilic and in thethermophilic biowaste reactor were low enough not toinhibit glucose fermentation and methane productionof either process signi®cantly, but may have been highenough to inhibit protein degradation. The data indi-
cated either that the mesophilic and thermophilicprotein degraders revealed a di�erent sensitivity to-wards free ammonia or that the mesophilic populationcontained less versatile protein degraders, leaving moreprotein undegraded.
Introduction
Anaerobic fermentation of the organic fraction of wastesis a suitable method to reduce both volume and mass fordeposition in sanitary land®lls. Approximately 33% ofhousehold wastes (annual amount 70±140 kg/in-habitant; LuÈ bben 1994) can be separated as bioorganicwet waste. The residual semi-dry fraction (67%) may bedisposed of either in sanitary land®lls or be incinerated,leading to an increased caloric energy output per massunit, because of its decreased water content. Biologicaltreatment of the wet organic fraction can be performedeither in the presence of air (composting) or in the ab-sence of air (biogas fermentation, sometimes in accu-rately, called anaerobic composting). In 1996,composting plants with a total capacity of 2.4 ´ 106
tonnes bioorganic wastes were in operation in Germany,whereas the total capacity for anaerobic fermentationwas only 0.19 ´ 106 tonnes (Biehler and Nuding 1996).
Anaerobic fermentation signi®cantly reduces thetotal mass of wastes, generates solid or liquid fertilizerand yields energy. It can be maintained at psychrophilic(12±16 °C, e.g. in land®lls, swamps or sediments),mesophilic (35±37 °C, e.g. in the rumen and in anaerobicdigester) and thermophilic conditions (55±60 °C; e.g. inanaerobic digesters or geothermally heated ecosystems).Disadvantages of thermophilic anaerobic fermentationare the reduced process stability and reduced dewateringproperties of the fermented sludge and the requirementfor large amounts of energy for heating, whereas thethermal destruction of pathogenic bacteria at elevatedtemperatures was considered a big advantage (Steinerand Kandler 1983; Winter and Temper 1987). Theslightly higher rates of hydrolysis and fermentation
Appl Microbiol Biotechnol (1997) 48: 405±410 Ó Springer-Verlag 1997
C. Gallert (&) á J. WinterInstitut fuÈ r Ingenieurbiologie und Biotechnologie des Abwassers,UniversitaÈ t Karlsruhe, Am Fasanengarten,D-76131 Karlsruhe, GermanyTel.: 0721/608 3274Fax: 0721/694826e-mail: [email protected]
under thermophilic conditions have not led to a highermethane yield. Hashimoto et al. (1981) reported nosigni®cant change in the total methane yield fromorganic matter for fermentation temperatures rangingfrom 30 °C to 60 °C.
Compared to mesophilic fermentation conditions, athigher temperatures the pH increased through a re-duced solubility of carbon dioxide, leading to a higherproportion of free ammonia. Ammonia is generatedduring anaerobic degradation of urea or proteins.Livestock manure from pork and poultry containsabout 4 g N/l (Angelidaki and Ahring 1991), that fromcattle about 1.5 g N/l (Angelidaki and Ahring 1993). Inthe organic fraction of household waste the organicnitrogen that was released as ammonia during anaero-bic fermentation amounted to 2.15 g N/l (Jager et al.1989). Free ammonia may be inhibitory for anaerobicfermentation and may be toxic for methanogenicbacteria (Angelidaki and Ahring 1993). InhibitoryNH3 concentrations under mesophilic conditions of80±150 mg N/l at a pH of 7.5 have been reported(Koster and Lettinga 1984; Braun et al. 1981). Underthermophilic conditions at a pH of 7.2±7.3, for ace-ticlastic methanogens, inhibitory concentrations of freeammonia of 3.5 g/l NH4-N/l (250 mg/l NH3-N) werefound and, for hydrogenolytic methanogens, 7 g/lNH4-N/l (500 mg/l NH3-N) (Angelidaki and Ahring1993; Borja et al. 1996).
In this study, we compare the fermentation of the wetorganic fraction of household wastes in laboratory scalereactors under meso- and thermophilic conditions,concentrating on the conversion of organic nitrogen intoammonia and inhibition of carbon removal by ammo-nia.
Materials and methods
Source of wet organic waste
The bioorganic fraction of household wastes was manually sorted,moistened with tap water (250 ml/kg waste) and homogenized withan Ultraturrax homogenizer. The homogenate was divided betweenplastic bottles and frozen until required for anaerobic fermentation.Each batch of homogenized waste slurry was analysed and theresults are shown in Table 1. For the experiments described here,four di�erent batches were thoroughly mixed and the analyticalparameters of the mixture separately determined (Table 1).
Continuous anaerobic fermentation experimentsin biogas reactors
Two reactors (glass columns, inner diameter 10 cm, total height80 cm, liquid height 60 cm) with a working volume of 4.8 l wereused for anaerobic fermentation of biowaste. To maintain homo-geneity, biowaste slurry and fermentation gas (ratio approximately1:1) were withdrawn from the surface of the liquid and recirculatedinto the bottom part of the reactor with a pump (recirculation rate20/h). The temperature of 37 °C (mesophilic reactor) or 55 °C(thermophilic reactor) was maintained by circulating water from awater-bath heater (B. Braun, Melsungen) through a water jacketsurrounding the reactors. The reactors were fed batchwise with
fresh waste once a day. To maintain process stability at 19 dayshydraulic retention time (tHR) the feed had to be added at 12-hintervals twice a day. Biogas production was measured continu-ously with a gas meter (Ritter, Hanau) and the pH was controlledon-line with a pH electrode (WTW, Weilheim) inserted into therecirculation line.
Initially the reactors were ®lled with anaerobic sludge from themunicipal sewage treatment plant of Regensburg (Germany). Afteran adaptation time of 2 weeks at 37 °C (mesophilic reactor) and55 °C (thermophilic reactor), 240-ml aliquots were replaced by a1:1 mixture of fresh sewage sludge and biowaste slurry. Gas pro-duction, pH and fatty acids were monitored. When the gas pro-duction ceased and the pH reached 7.4, 240 ml digester content wasagain replaced, this time by only biowaste slurry. When the gasproduction ceased again, a fed-batch feeding once per day tomaintain an initial tHR of 93 days was started. After process sta-bilization, the tHR in both reactors was reduced stepwise andconcomitantly the loading was increased, as indicated later.
Batch digestion experiments in serum bottles
The e�uent of the mesophilic and the thermophilic biowaste re-actor was centrifuged in a WKF-50-K centrifuge (Gesellschaft fuÈ relektrophysikalischen Apparatebau, Brandau) at 830 g for 10 minto separate most of the solid waste particles (about 80%) from thesuspended biomass. The supernatant fraction contained the sus-pended bacteria and the small-particulate sludge ¯ocs, includingmost of the Methanosarcina sp., as judged from microscopy with aphase-contrast ¯uorescence microscope. It was used as an inoculumfor testing the e�ect of ammonia on glucose fermentation andmethanogenic activity during anaerobic fermentation by the me-sophilic and thermophilic biowaste ¯ora.
Batch experiments were performed in 120-ml serum bottles,supplemented with 45 ml potassium phosphate bu�er (50 mM,pH 7.8), 4.5 mM glucose and 5 ml bacterial inoculum. All experi-ments were prepared in an anaerobic chamber (Coy, Ann Arbor,Mich. USA). Colourless resazurin guaranteed a redox potential ofless than )350 mV. Di�erent ammonia or NaCl concentrationswere obtained by addition of the respective portions of a concen-trated NH4Cl or NaCl solution, made oxygen-free by heating un-der vacuum and regassing with nitrogen. Assays without additionof ammonia or with addition of NaCl were run as controls. Eachexperiment was done in duplicate.
Analytical methods
Standard procedures (Deutsche Einheitsverfahren zur Wasser-,Abwasser und Schlammuntersuchung 1983) were used to determinetotal solids, volatile solids, alkalinity, Kjeldahl nitrogen and am-monia. The chemical oxygen demand (COD) was measured after
Table 1 Carbon and nitrogen parameters of di�erent batches ofhomogenized biowaste. Minimum and maximum values di�eredbecause of the di�erent compositions and moisture contents of theinput material. COD chemical O2 demand, DOC dissolved organicC, TKN total Kjeldahl N
Parameter Minimum Maximum Mixturefor expt.
CODtotal (g/l) 118 215 176CODdiss (g/l) 46 93 71CODdiss/CODtot (%) 38 42 40DOC (g/l) 16 37 25Total solids (g/l) 139 200 184Volatile solids (g/l) 121 178 172TKN (mg/l) 1650 4040 3107NH�4 (mg/l) 175 349 260pH 4 5.5 5.3
406
oxidation of the organic material in the homogenized sample withpotassium dichromate/sulphuric acid according to Wolf andNordmann (1977). The dissolved proportion of the COD and thedissolved organic carbon were measured after ®ltration (pore size0.45 lm) of samples. The dissolved organic carbon was analysed byinfrared spectroscopy with a Tocor 2 carbon analyser (Maihak,Hamburg).
The methane content of the biogas and volatile fatty acids weredetermined by gas chromatography. For measurement of methane,a Packard model 427 gas chromatograph with a thermoconduc-tivity detector and nitrogen as the carrier and reference gas, at a¯ow rate of 10 ml/min, was used. For isothermal separation ofgases at 30 °C, a Poropack N (80±100 mesh; Sigma, Deisenhofen)Te¯on column (1.8 m length, inner diameter 1.5 mm) was used.Detector and injector temperatures were set at 100 °C.
Volatile fatty acids were analysed with a Packard model 437 gaschromatograph and an automatic liquid sampler, model 911(Chrompack, Frankfurt). The gas chromatograph was equippedwith a ¯ame ionization detector, supplied with H2 (30 ml/min) andoxygen (300 ml/min). Detector and injector temperatures were setat 210 °C and the oven was heated to 180 °C. Fatty acids wereseparated on a 2-m Te¯on column (1.5 mm inner diameter), ®lledwith Chromosorb C101 (80±100 mesh; Sigma, Deisenhofen).Samples were acidi®ed with phosphoric acid (5%) and clari®ed bycentrifugation before injection. The concentration of ammonia�NH3 �NH�4 � in the samples was determined with a colorimetrictest from Merck Co. (Merck, 1974). In the test system ammoniaions form indolphenol blue with salicylate and hypochlorite ions,which can be quanti®ed spectrophotometrically at 655 nm in aconcentration range of 0.03±1 mg/l NH�4 . The concentration offree ammonia (NH3-N) was calculated according to Anthonisen etal. (1976):
NH3-N � NH�4 -N� 10pH
Kb=Kw � 10pHKb=Kw � e�6344=273�T �
where N concentrations are in mg/l and T is in °C.Glucose was measured photometrically according to Lever
(1972) as p-hydroxybenzoic acid hydrazide at 410 nm. The rela-tionship was linear for a concentration range of 0±250 mg/l.
The theoretical quantity of methane and carbon dioxide pro-duced under anaerobic conditions was calculated from the C/H/O/N ratio of the slurry according to Buswell and Mueller (1952), asmodi®ed by Richards et al. (1991):
CnHaObNc � �nÿ 0:25aÿ 0:5b� 1:75c�H2O
! �0:5n� 0:125aÿ 0:25bÿ 0:375c�CH4
� �0:5nÿ 0:125a� 0:25bÿ 0:625c�CO2
� cNH�4 � cHCOÿ3
Results
Biowaste fermentation at mesophilicand thermophilic temperatures
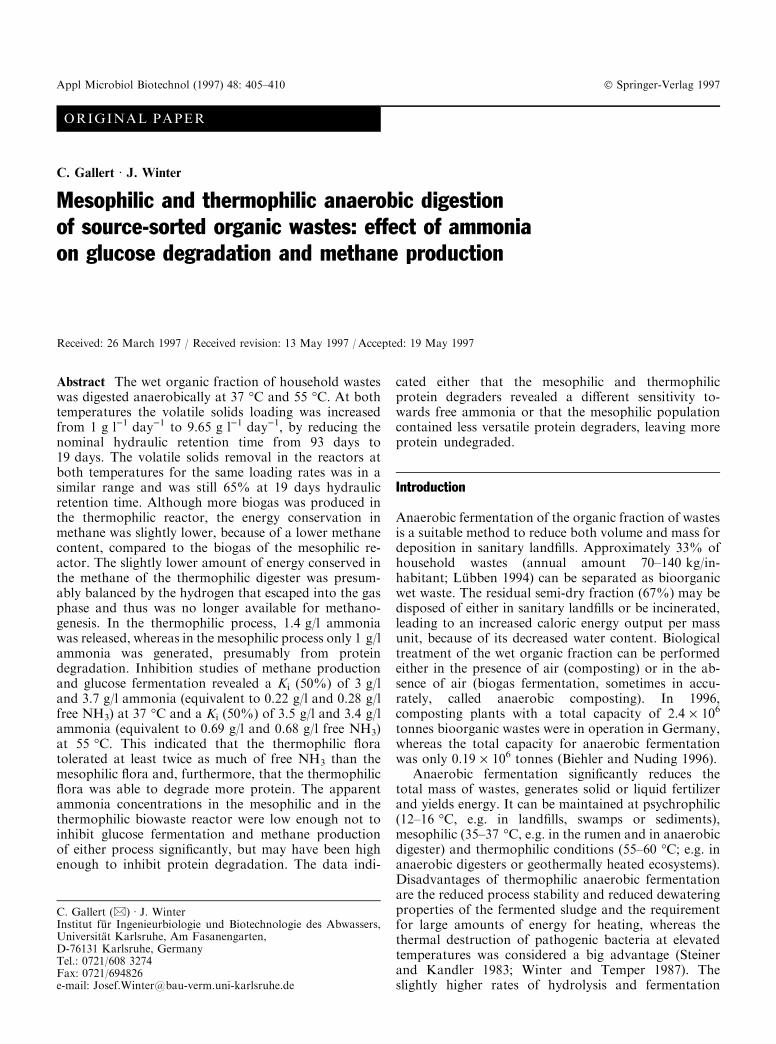
Digested sewage sludge from the anaerobic reactor ofthe city of Regensburg was acclimated to biowaste di-gestion at 37 °C and 55 °C beginning with an apparenttHR of 93-days as mentioned. In the mesophilic reactorthe COD removal e�ciency during stepwise reduction ofthe tHR to 80, 60 and 50 days was around 85% (Fig. 1a).When tHR was further reduced to 19 days, equivalent toa space loading of 9.65 g COD l)1 day)1, the COD-re-moval e�ciency decreased to 64%. In the thermophilicreactor the COD-removal e�ciency was 95% at a tHR of
93 days. During stepwise reduction of the retention timeto 19 days, equivalent to an increase of the space loadingto 9.65 g volatile solids l)1 day)1, the COD removaldecreased steadily from 95% to 67% (Fig. 1b). Thebiogas production increased from 0.3 l l)1 day)1 at 93days tHR to 5.3 (37 °C) or 5.6 (55 °C) l l)1 day)1 at 19days tHR (Fig. 1a, b). With every stepwise reduction oftHR below 50 days, propionate accumulated, reaching10 mM on some days in the mesophilic reactor, whereasthe thermophilic reactor tended to accumulate acetateup to 40 mM, before steady-state conditions, with lessthan 1 mM propionate or 4 mM acetate, were achievedagain. The reactor performance of anaerobic biowastefermentation at 37 °C and 55 °C at tHR = 19 days issummarized in Table 2. At a COD loading of9.65 g l)1 day)1 63% or 67% of the COD was degradedat 37 °C or 55 °C and the volatile solids reduction was64% and 65% respectively. Although the gas productionper litre of reactor volume and per day was apparentlyslightly higher in the thermophilic reactor, because of areduced solubility of CO2 at the higher temperature, intotal little more methane was produced in the mesophilicreactor. This was due to a methane content of the biogasof 67% in the reactor run at 37 °C but only 59% in the
Fig. 1a,b E�ciency of mesophilic (a) and thermophilic (b) biowastefermentation at increasing loading rates. A portion of the content ofeach fermenter was manually replaced once per day with freshbiowaste to maintain the respective loading rate/hydraulic retentiontime (tHR ). Biogas production and chemical O2 demand (COD)removal were determined. r Loading rate (VS volatile solids),n COD removal, Ð hydraulic retention time, m biogas production
407
reactor run at 55 °C (Table 2). The total energy releaseby gases in both reactors may have been identical,however, since the gas of the thermophilic reactor con-tained some hydrogen (not quanti®ed). The ammoniacontent of the e�uent of the thermophilic reactor wasnotably higher, indicating that apparently more proteinwas degraded at 55 °C than at 37 °C.
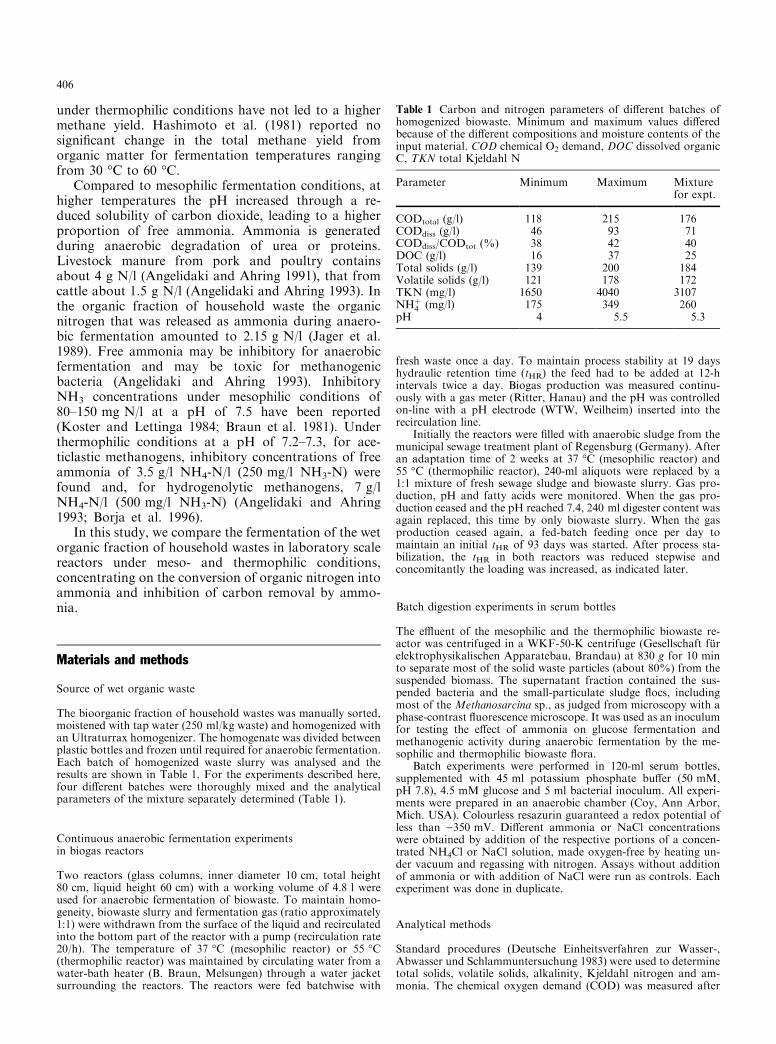
The pH of the mesophilic and thermophilic reactorsduring one feeding cycle at tHR = 22 days is shown inFig. 2. Within 1 h after addition of the biowaste slurry,preacidi®ed to a pH of pH 5.3, the pH of the reactorcontent dropped from 7.5 to 6.75 and slowly increasedagain to 7.4/7.5 within 24 h. Due to the sharply de-creasing pH after sludge addition, the CO2 content ofthe biogas increased in the ®rst hours after feeding anddropped later on, resulting in an average methane con-tent for the biogas collected during one feeding cycle of67% in the mesophilic reactor and 59% in the thermo-philic reactor. The alkalinity (Ks for a pH change from7.5 to 6.5) was 17 mmol/l in the mesophilic reactorand 25.6 mmol/l in the thermophilic reactor. In both
reactors the bu�er capacity was too small to avoidacidi®cation after substrate addition (Fig. 2).
Ammonia inhibition of the biogas process at 37 °Cand 55 °C
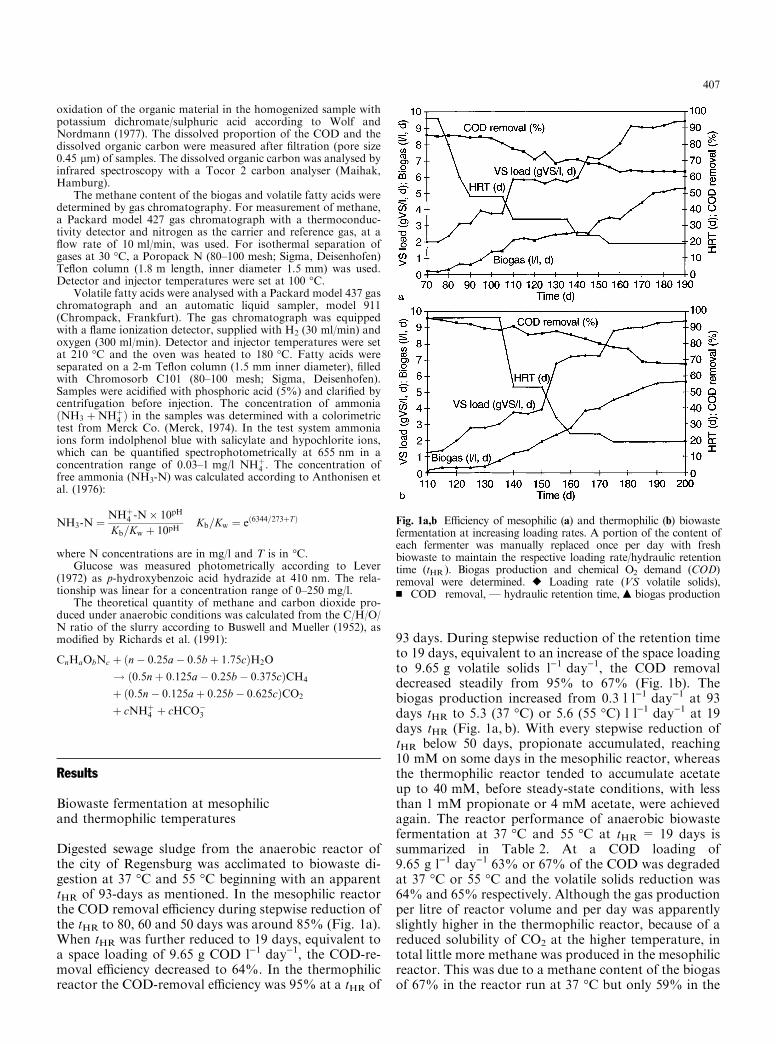
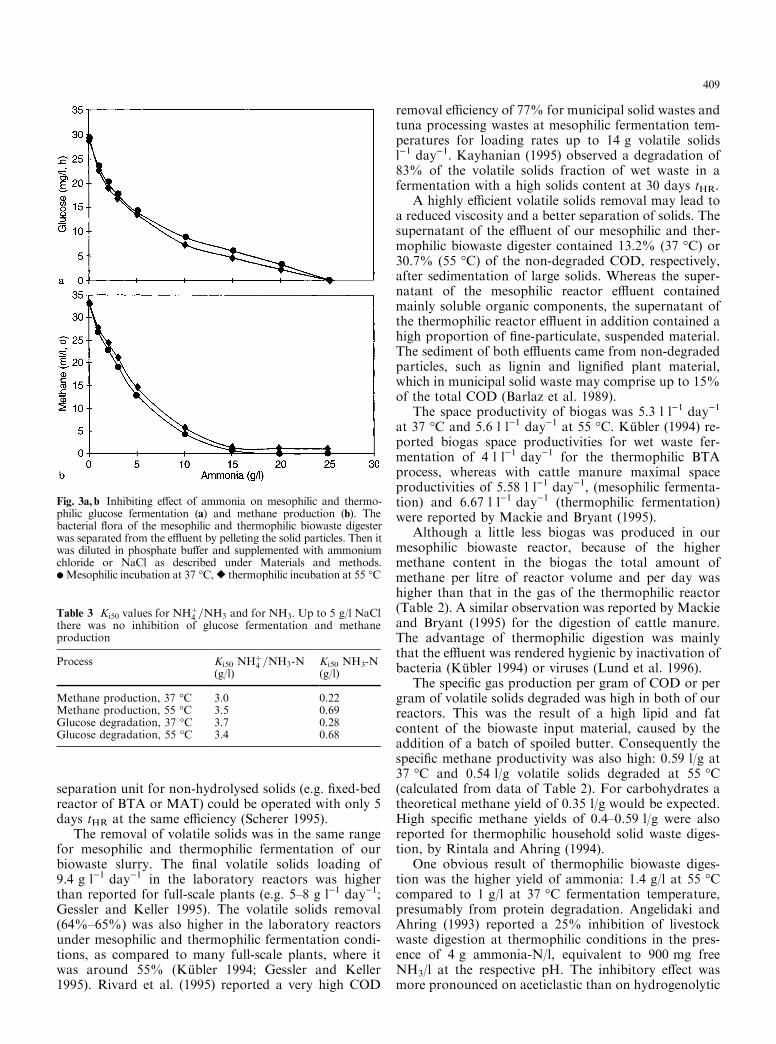
Each 5-ml sample of a bacterial suspension frommesophically and thermophically fermented biowasteslurry, containing mainly the bacteria and some ®ne-particulate material, with a dry weight content of 11 g/lin total (prepared as described in Materials and meth-ods), was suspended in 45 ml phosphate bu�er(50 mmol/l, pH 7.8, containing 4.5 mmol/l glucose) andsupplemented with 0±35 g/l NH4Cl or NaCl. Glucosedegradation rates were determined for the time spannecessary for 80%±90% degradation of the initialamount and are shown in Fig. 3a. With increasingconcentration of ammonia, glucose degradation wasslightly more inhibited at 55 °C than at 37 °C. The Ki50
for ammonia-N was 3.7 g/l at 37 °C (=0.28 g NH3-N)and 3.4 g/l at 55 °C (=0.68 g NH3-N). The Ki50 wassimilarly determined for methane production (Fig. 3b).A 50% inhibition was seen at 3.0 g/l ammonia-N(=0.22 g/l NH3-N) in the mesophilic reactor and at3.5 g ammonia-N (=0.69 g/l NH3-N) in the thermo-philic reactor (Table 3). In the presence of 5 g/l NaCl,glucose degradation and methane production were notsigni®cantly in¯uenced, whereas in the presence of 15 g/lNaCl or more, methane was no longer produced, pre-sumably because of the high salinity.
Discussion
Manually fractionated biowaste was digested at 37 °Cand 55 °C in a one-stage recirculated suspension reactorat a minimal tHR of 19 days, equivalent to a volatilesolids loading of 9.4 g l)1 day)1. Similar short retentiontimes for less concentrated biowastes were applied forthe single-stage processes of WABIO, Bio-Stab or Ko-mpogas reactors, whereas the methane reactor in pro-cesses with a separate hydrolysis reactor and a
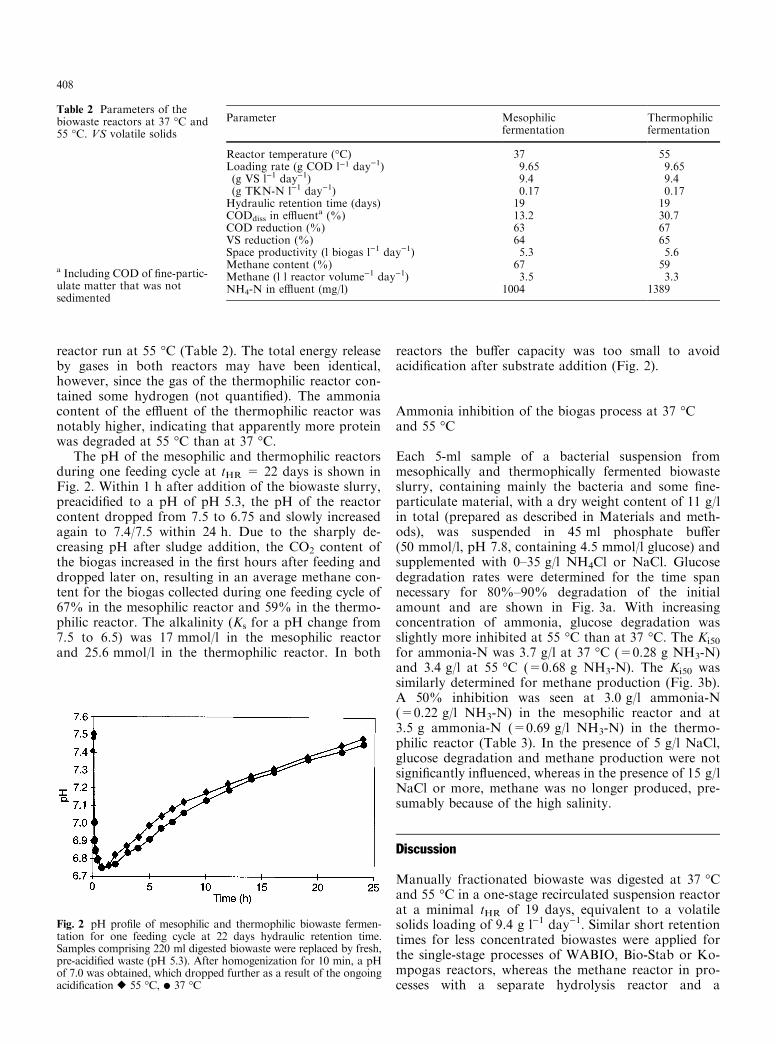
Table 2 Parameters of thebiowaste reactors at 37 °C and55 °C. VS volatile solids
a Including COD of ®ne-partic-ulate matter that was notsedimented
Parameter Mesophilicfermentation
Thermophilicfermentation
Reactor temperature (°C) 37 55Loading rate (g COD l)1 day)1) 9.65 9.65(g VS l)1 day)1) 9.4 9.4(g TKN-N l)1 day)1) 0.17 0.17Hydraulic retention time (days) 19 19CODdiss in e�uenta (%) 13.2 30.7COD reduction (%) 63 67VS reduction (%) 64 65Space productivity (l biogas l)1 day)1) 5.3 5.6Methane content (%) 67 59Methane (l l reactor volume)1 day)1) 3.5 3.3NH4-N in e�uent (mg/l) 1004 1389
Fig. 2 pH pro®le of mesophilic and thermophilic biowaste fermen-tation for one feeding cycle at 22 days hydraulic retention time.Samples comprising 220 ml digested biowaste were replaced by fresh,pre-acidi®ed waste (pH 5.3). After homogenization for 10 min, a pHof 7.0 was obtained, which dropped further as a result of the ongoingacidi®cation r 55 °C, d 37 °C
408
separation unit for non-hydrolysed solids (e.g. ®xed-bedreactor of BTA or MAT) could be operated with only 5days tHR at the same e�ciency (Scherer 1995).
The removal of volatile solids was in the same rangefor mesophilic and thermophilic fermentation of ourbiowaste slurry. The ®nal volatile solids loading of9.4 g l)1 day)1 in the laboratory reactors was higherthan reported for full-scale plants (e.g. 5±8 g l)1 day)1;Gessler and Keller 1995). The volatile solids removal(64%±65%) was also higher in the laboratory reactorsunder mesophilic and thermophilic fermentation condi-tions, as compared to many full-scale plants, where itwas around 55% (KuÈ bler 1994; Gessler and Keller1995). Rivard et al. (1995) reported a very high COD
removal e�ciency of 77% for municipal solid wastes andtuna processing wastes at mesophilic fermentation tem-peratures for loading rates up to 14 g volatile solidsl)1 day)1. Kayhanian (1995) observed a degradation of83% of the volatile solids fraction of wet waste in afermentation with a high solids content at 30 days tHR.
A highly e�cient volatile solids removal may lead toa reduced viscosity and a better separation of solids. Thesupernatant of the e�uent of our mesophilic and ther-mophilic biowaste digester contained 13.2% (37 °C) or30.7% (55 °C) of the non-degraded COD, respectively,after sedimentation of large solids. Whereas the super-natant of the mesophilic reactor e�uent containedmainly soluble organic components, the supernatant ofthe thermophilic reactor e�uent in addition contained ahigh proportion of ®ne-particulate, suspended material.The sediment of both e�uents came from non-degradedparticles, such as lignin and ligni®ed plant material,which in municipal solid waste may comprise up to 15%of the total COD (Barlaz et al. 1989).
The space productivity of biogas was 5.3 l l)1 day)1
at 37 °C and 5.6 l l)1 day)1 at 55 °C. KuÈ bler (1994) re-ported biogas space productivities for wet waste fer-mentation of 4 l l)1 day)1 for the thermophilic BTAprocess, whereas with cattle manure maximal spaceproductivities of 5.58 l l)1 day)1, (mesophilic fermenta-tion) and 6.67 l l)1 day)1 (thermophilic fermentation)were reported by Mackie and Bryant (1995).
Although a little less biogas was produced in ourmesophilic biowaste reactor, because of the highermethane content in the biogas the total amount ofmethane per litre of reactor volume and per day washigher than that in the gas of the thermophilic reactor(Table 2). A similar observation was reported by Mackieand Bryant (1995) for the digestion of cattle manure.The advantage of thermophilic digestion was mainlythat the e�uent was rendered hygienic by inactivation ofbacteria (KuÈ bler 1994) or viruses (Lund et al. 1996).
The speci®c gas production per gram of COD or pergram of volatile solids degraded was high in both of ourreactors. This was the result of a high lipid and fatcontent of the biowaste input material, caused by theaddition of a batch of spoiled butter. Consequently thespeci®c methane productivity was also high: 0.59 l/g at37 °C and 0.54 l/g volatile solids degraded at 55 °C(calculated from data of Table 2). For carbohydrates atheoretical methane yield of 0.35 l/g would be expected.High speci®c methane yields of 0.4±0.59 l/g were alsoreported for thermophilic household solid waste diges-tion, by Rintala and Ahring (1994).
One obvious result of thermophilic biowaste diges-tion was the higher yield of ammonia: 1.4 g/l at 55 °Ccompared to 1 g/l at 37 °C fermentation temperature,presumably from protein degradation. Angelidaki andAhring (1993) reported a 25% inhibition of livestockwaste digestion at thermophilic conditions in the pres-ence of 4 g ammonia-N/l, equivalent to 900 mg freeNH3/l at the respective pH. The inhibitory e�ect wasmore pronounced on aceticlastic than on hydrogenolytic
Fig. 3a, b Inhibiting e�ect of ammonia on mesophilic and thermo-philic glucose fermentation (a) and methane production (b). Thebacterial ¯ora of the mesophilic and thermophilic biowaste digesterwas separated from the e�uent by pelleting the solid particles. Then itwas diluted in phosphate bu�er and supplemented with ammoniumchloride or NaCl as described under Materials and methods.d Mesophilic incubation at 37 °C, r thermophilic incubation at 55 °C
Table 3 Ki50 values for NH�4 =NH3 and for NH3. Up to 5 g/l NaCl
there was no inhibition of glucose fermentation and methaneproduction
Process Ki50 NH�4 =NH3-N
(g/l)Ki50 NH3-N(g/l)
Methane production, 37 °C 3.0 0.22Methane production, 55 °C 3.5 0.69Glucose degradation, 37 °C 3.7 0.28Glucose degradation, 55 °C 3.4 0.68
409
methanogens. Adaptation from 4 g to 6 g N/l required atime span of 6 months. We observed a 50% inhibition at37 °C and 55 °C by 3±3.7 g ammonia/l for glucose fer-mentation and methanogenesis as well. The inhibitorye�ect was presumably due to the free permeability ofNH3 through the cell membrane. At the actual pH of 7.6in the reactors, 0.22±0.28 g free NH3/l caused a 50%inhibition of mesophilic glucose fermentation andmethane production, whereas 0.68±0.69 g free NH3/lcaused a 50% inhibition of both processes at 55 °C.
In the mesophilic reactor in the presence of 1 g totalammonia at a pH of 7.6 the NH3 concentration wascalculated to be around 0.03 g and, in the thermophilicreactor at 1.4 g total ammonia, around 0.126 g/l. Thesefree ammonia concentrations were too low to in¯uencemethanogenesis signi®cantly. On the other hand, fromthe total Kjeldahl N of the biowaste during mesophilicdigestion, only about 1/3, and during thermophilic di-gestion about 1/2, was converted to ammonia. If this isnot a speci®c phenomenon of the mesophilic and ther-mophilic population in our reactors, it may indicate thatprotein degradation is inhibited by free ammonia, with ahigher sensitivity at mesophilic than at thermophilicreactor temperatures.
Acknowledgement We thank Martin StuÈ tzel for his experimentalinput during the preparation of his diploma thesis.
References
Angelidaki I, Ahring BK (1991) Ammonia inhibition during an-aerobic thermophilic degradation of animal waste. In: Verach-tert H, Verstraete W (eds) Proceedings of the InternationalSymposium on Environmental Biotechnology, Royal FlemishSociety of Engineers, 22±25 April 1991, vol 2 pp 389±392
Angelidaki I, Ahring BK (1993) Thermophilic anaerobic digestionof livestock waste: the e�ect of ammonia. Appl MicrobiolBiotechnol 38: 560±564
Angelidaki I, Ahring BK (1994) Anaerobic thermophilic digestionof manure at di�erent ammonia loads: e�ect of temperature.Water Res 28: 727±731
Anthonisen AC, Loehr RC, Prakasam TBS, Srinath EG (1976)Inhibition of nitri®cation by ammonia and nitrous acid. JWater Pollut Control Fed 48: 835±849
Barlaz MA, Schaefer DM, Ham RK (1989) Bacterial populationdevelopment and chemical characteristics of refuse decompo-sition in a simulated sanitary land®ll. Appl Environ Microbiol55: 55±65
Biehler MJ, Nuding R (1996) Vergleich verschiedener Verfahrenzur Verwertung von Bio- und GruÈ nabfaÈ llen auf kommunalerEbene. Abfallwirtschaftsjournal 9: 28±38
Borja R, Sanchez E, Weiland P (1996) In¯uence of ammoniaconcentration on thermophilic anaerobic digestion of cattle
manure in up¯ow anaerobic sludge blanket (UASB) reactors.Process Biochem 31: 477±484
Braun R, Huber P, Meyrath J (1981) Ammonia toxicity in liquidpiggery manure digestion. Biotechnol Lett 3: 159±164
Buswell AM, Mueller HF (1952) Mechanics of methane fermen-tation. J Ind Eng Chem 44: 550
Deutsche Einheitsverfahren zur Wasser-, Abwasser- undSchlammuntersuchung (1979±1983), VCH VerlagsgesellschaftWeinheim
Gessler G, Keller K (1995) Vergleich verschiedener Verfahren zurVergaÈ rung von Bioabfall. Abfallwirtschaftsjournal 7: 377±382
Hashimoto AG, Varel VH, Chen YR (1981) Ultimate methaneyield from beef cattle manure: e�ect of temperature, constitu-ents, antibiotics and manure age. Agric Waste 3: 241±256
Jager J, Burth M, Ho�meyer P, Messerschmidt K, Steiner M,Wiegel U (1989) BiomuÈ llsammlung und -kompostierung.VeroÈ �entlichungen der Ingenieursgemeinschaft TechnischerUmweltschutz. Verlag Dr. J. H. Jager, Berlin
Kayhanian M (1995) Biodegradation of the organic fraction ofmunicipal solid waste in a high-solids anaerobic digester. WasteManage Res 13: 123±136
Koster IW, Lettinga G (1984) The in¯uence of ammonia-nitrogenon the speci®c activity of pelletized methanogenic sludge. AgricWaste 9: 205±216
KuÈ bler H (1994) Versuch zur thermophilen Faulung von kom-munalem Bioabfall. MuÈ ll Abfall 8: 478±488
Lever M (1972) A new reaction for colorimetric determination ofcarbohydrates. Anal Biochem 47: 273±279
LuÈ bben S (1994) Organische AbfaÈ lle in einer Groûstadt-Mengenund VerwertungsmoÈ glichkeiten. In: H MaÈ rkl, R Stegmann (eds)Anaerobe Behandlung von festen und ¯uÈ ssigen RuÈ ckstaÈ nden.Dechema Monogr 130: 207±230
Lund B, Jensen VF, Have P, Ahring BK (1996) Inactivation ofvirus during anaerobic digestion of manure in laboratory scalebiogas reactors. Antonie van Leeuwenhoek 69: 25±31
Mackie RI, Bryant MP (1995) Anaerobic digestion of cattle wasteat mesophilic and thermophilic temperatures. Appl MicrobiolBiotechnol 43: 346±350
Merck E (1974) Die chemische Untersuchung von Wassser. 13.Au¯age, Darmstadt
Richards BK, Cummings RJ, White TE, Jewell WJ (1991) Methodsfor kinetic analysis of methane fermentation in high solidsbiomass digestors. Biomass Bioenergy 1: 65±73
Rintala JA, Ahring BK (1994) Thermophilic anaerobic digestion ofsource-sorted household solid waste: the e�ects of enzyme ad-ditions. Appl Microbiol Biotechnol 40: 916±919
Rivard CJ, Rodriguez JB, Nagle NJ, Self JR, Kay BD, SoltanpourPN, Nieves RA (1995) Anaerobic digestion of municipal solidwaste. Appl Biochem Biotechnol 51/52: 125±135
Scherer PA (1995) Stand der Technik zur VergaÈ rung fester Ab-fallsto�e: Umweltaspekte, Prinzipien und Varianten.Abfallwirtschaftsjournal 6: 385±410
Steiner A, Kandler O (1983) Anaerober Abbau von Schlacht-hofabwaÈ ssern. In: Anaerobe Abwasser- und Schlammbehand-lung-Biogastechnologie. MuÈ nchener BeitraÈ ge zur Abwasser-,Fischerei- und Fluûbiologie Band 36: 193±212. Oldenbourg,MuÈ nchen
Winter J, Temper U (1987) Mikrobiologie der anaerobenAbwasserreinigung. Abwassertech Abfalltech Recycl 38: 14±21
Wolf P, Nordmann W (1977) Eine Feldmethode fuÈ r die Messungdes CSB von Abwasser. Korrespondenz Abwasser 24: 277±279
410