quantitative ecology of psychrophilic, mesophilic...
TRANSCRIPT

Quantitative ecology of psychrophilic,mesophilic and thermophilic microorganisms
in thermic, mesic and frigid soils
Item Type text; Thesis-Reproduction (electronic)
Authors Gamble, Sherry Lee, 1948-
Publisher The University of Arizona.
Rights Copyright © is held by the author. Digital access to this materialis made possible by the University Libraries, University of Arizona.Further transmission, reproduction or presentation (such aspublic display or performance) of protected items is prohibitedexcept with permission of the author.
Download date 04/08/2018 10:17:23
Link to Item http://hdl.handle.net/10150/554939

QUANTITATIVE ECOLOGY OF PSYCHROPHILIC, MESOPHILIC
AND THERMOPHILIC MICROORGANISMS IN
THERMIC, MESIC AND FRIGID SOILS
by
Sherry Lee Gamble
A Thesis Submitted to the Faculty of the
DEPARTMENT OF MICROBIOLOGY AND MEDICAL TECHNOLOGY
In Partial Fulfillment of the Requirements For the Degree of
MASTER OF SCIENCE WITH A MAJOR IN MICROBIOLOGY
In the Graduate College
' THE UNIVERSITY OF ARIZONA
19 7 5

STATEMENT BY AUTHOR
This thesis has been submitted in partial fulfillment of requirements for an advanced degree at The University of Arizona and is deposited in the University Library to be made available to borrowers under rules of the Library,
Brief quotations from this thesis are allowable without special permission, provided that accurate acknowledgment of source is made. Requests for permission for extended quotation from or reproduction of this manuscript in whole or in part may be granted by the head of the major department or the Dean of the Graduate College when in his judgment the proposed use of the material is in the interests of scholarship, In all other instances, however, permission must be obtained from the author.
SIGNED:
APPROVAL BY THESIS DIRECTOR
This thesis has been approved on the date shown below:
N. A. SINCLAIR\ Associate Professor of
Microbiology and Medical Technology

ACKNOWLEDGMENTS
My husband, Terry, deserves most of the credit for this thesis.
He kept me happy, sane, and on the path, I wish to thank Dr. N, A,
Sinclair for his thoughtful consideration of my questions and desire.
In addition, I would like to thank Dr. L. M, Kelley for his
assistance on the computer program.

TABLE OF CONTENTS
Page
LIST OF TABLES............................... . v
LIST OF ILLUSTRATIONS , ......... . . ......... vi
ABSTRACT..................... . . . . . . vii
INTRODUCTION........... , , . . . . . . . . . , . . ....... 1
MATERIALS AND METHODS......... 10
Materials . . . . . . . . ........... 10Methods , . ....... ............... . . ........... 10
Culture Conditions ........... 11Fsyehrophile Election . . . . . . . . . . . ........... 13Temperature and Soil Response Studies of
Isolated Actinomycetes . . . . . . . . . . . . . . . . 13Statistical Analysis . . . . . . . . . . . . . . . . . . . 14
RESULTS ....... . . . . . . . . . . . . . . . . . . . . . . . . 16
Evaluation of Primary Isolation Media . . . . . . . . . . . . 16Distribution of Bacteria9 Actinomycetes, and Fungi in
* Relation to Environmental Factors . . . . . . . . . . . . 16Temporal Fluctuation.of Microbial Numbers . . . . . . . . . . 21Isolation of Psychrophiles and Thermophiles . . . . . . . . . 23Variation Among Elevation Levels and Numbers and
Types of Microorganisms...................... 25Actinomycetes . . 25Statistical Analysis . . . . . . . . . . . . . . . . . . . . . 31
DISCUSSION................... . . . . . 36
LITERATURE CITED 42
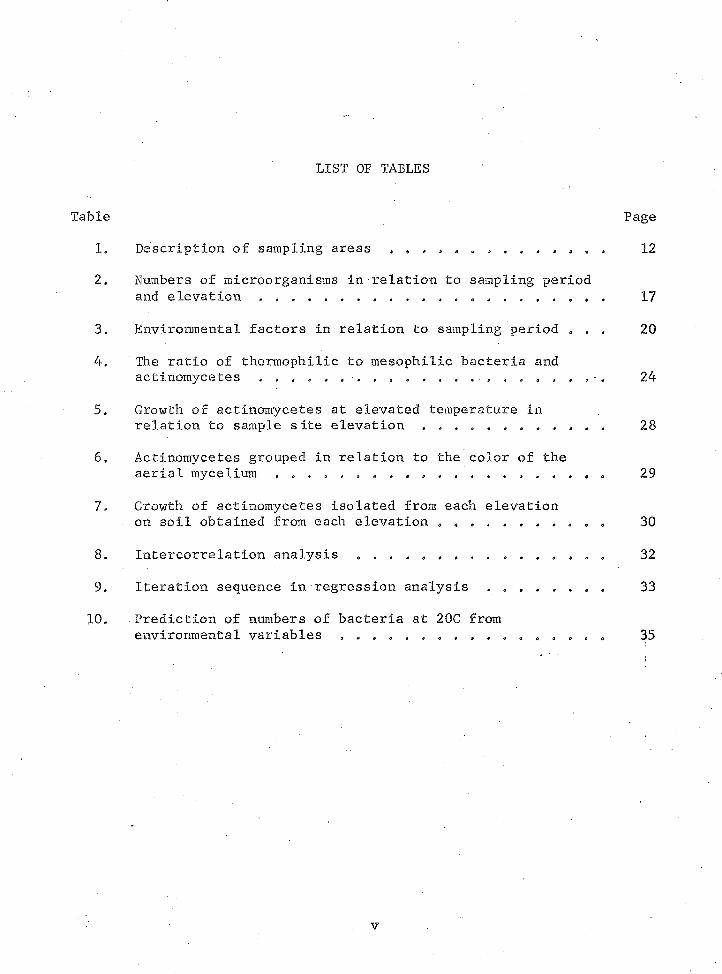
LIST OF TABLES
Table Page
1, Description of sampling areas 12
2* Numbers of microorganisms in relation to sampling periodand elevation 17
3, Environmental factors in relation to sampling period , . . 20
4, The ratio of thermophilic to mesophilic bacteria andactinomycetes . . . . . . . . . . . . . . . 24
5, Growth of actinomycetes at elevated temperature inrelation to sample site elevation * .............. . . 28
6, Actinomycetes grouped in relation to the color of theaerial mycelium , ............ 29
7, Growth of actinomycetes isolated from each elevationon soil obtained from each elevation * . . ........... 30
8* Intercorrelation analysis . ........ 32
9, Iteration sequence in regression analysis . .......... . 33
10, Prediction of numbers of bacteria at 20C fromenvironmental variables ....... . . . . ......... 35
v

LIST OF ILLUSTRATIONS
Figure Page
1* Number of bacteria (at 20C from 8200 feet)3 soil moisture, temperature and rainfall in relation to monthly sampling periods . . ......................* . 22
2, Numbers of bacteria, actinomycetes and furtgi inrelation to elevation . ......... * .......... 26
vi

ABSTRACT
Soil samples were taken from five different elevations in the
Santa- Catalina mountain range to assess the affect of environmental
factors on microbial numbers. The relative numbers of psychrophiles,
mesophiles, and thermophiles were determined for three classes of
microbes3 bacteria, actinomycetes, and fungi. Soil moisture was found
to have the most effect on microbial numbers, Temperature response
studies were also explored with 150 actinomycete isolates.

INTRODUCTION
Soil is populated by many organisms including animals and micro
organisms. The latter are of considerable importance in the mineraliza
tion of organic matter. Soil environment controls to a great extent
microbial growth and relative numbers of different microorganisms, For
instance3 fungi are dominant in many acidic forest soils, while bacteria
predominate in more neutral to alkaline soils and in waterlogged muds.
Actinomycetes are seldom numerically dominant (10).
Three important environmental factors which affect microbial
populations are soil moisture, soil temperature, and soil reaction, or
pH. The soil moisture regime is the keystone in the complex of inter
locking soil physical factors. Soil water contains many solutes includ
ing minerals, organic substances and gases which form the liquid nutrient
medium for microorganisms, Soil water is subject to extreme fluctua
tions causing the concentration of its solutes to change, thus affecting
microbial habitats. Osmotic gradients and soil aeration also depend on
moisture (10), Shameemullah, Parkinson and Burges (26) suggested that
soil moisture content was probably the most important factor controlling
microbiological activity.in pinewood soils, Seifert (24, 25) also
demonstrated that moisture affected the numbers of bacteria in soil to
the greatest degree. Temperature had little effect. Soil moisture has
in addition beeti shown by other investigators to be the most important
factor determining microbial numbers in soil (4, 5, 6, 7, 11, 20, 28, 35)»
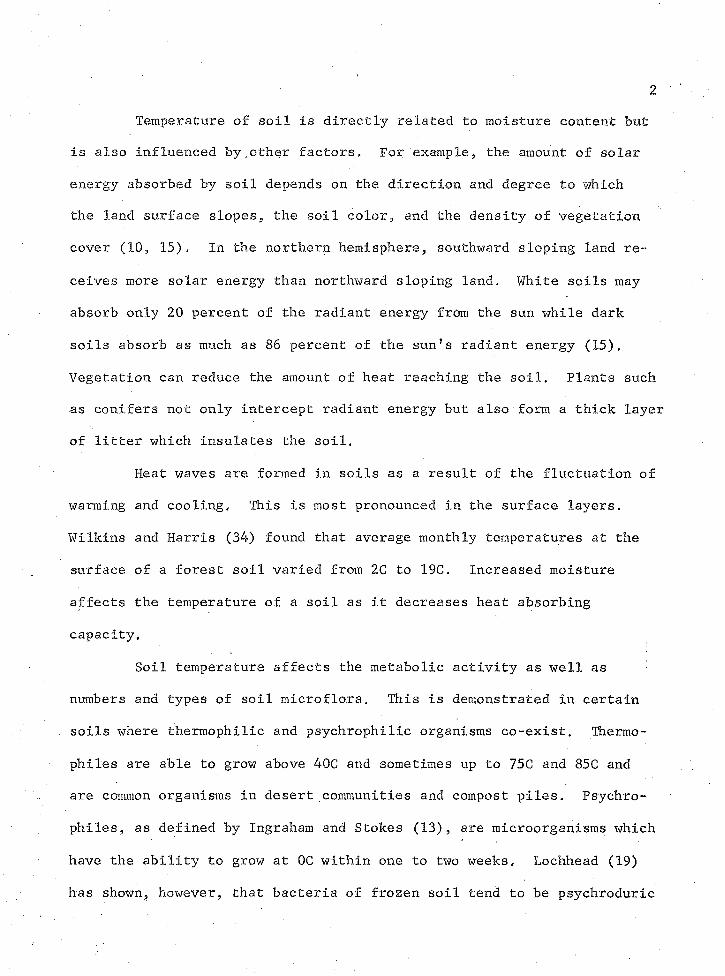
2Temperature of soil is directly related to moisture content but
is also influenced by.other factors. For example* the amount of solar
energy absorbed by soil depends on the direction and degree to which
the land surface slopes* the soil color* and the density of vegetation
cover (10, 15), In the northern hemisphere* southward sloping land re
ceives more solar energy than northward sloping land. White soils may
absorb only 20 percent of the radiant energy from the sun while dark soils absorb as much as 86 percent of the sun’s radiant energy (15),
Vegetation can reduce the amount of heat reaching the soil. Plants such
as conifers not only intercept radiant energy but also form a thick layer
of litter which insulates the soil.
Heat waves are formed in soils as a result of the fluctuation of
warming and cooling. This is most pronounced in the surface layers,
Wilkins and Harris (34) found that average monthly temperatures at the
surface of a forest soil varied from 2C to 19C, Increased moisture
affects the temperature of a soil as it decreases heat absorbing
capacity.
Soil temperature affects the metabolic activity as well as
numbers and types of soil microflora. This is demonstrated in certain
soils where thermophilic and psychrophilic organisms co-exist. Thermo-
philes are able to grow above 40C and sometimes up to 75C and 85C and
are common organisms in desert communities and compost piles. Psychro-
philes* as defined by Ingraham and Stokes (13), are microorganisms which
have the ability to grow at 0C within one to two weeks^ Lochhead (19)
has shown* however* that bacteria of frozen soil tend to be psychroduric

rather than psychrophilic. In contrast, Stokes and Redmond (27) main
tain that psychrophiles are ubiquitous. They found that psych.rophiles
made up 86 percent of the bacterial population in uncultivated soil near Pullman, Washington, Less than one percent of the population was com
posed of thermophiles. They found that uncultivated soil differed
markedly from garden and cultivated soil. Cultivation appears to favor
mesophilic growth while psychrophilic bacteria appear to be the pre
dominant bacterial flora in uncultivated soils. Larkin (16) studied the
distribution of psychrophiles in a more temperate climate. Numbers of
psychrophilic bacteria were determined in samples of Louisiana soil,
mud, and water. He found no psychrophiles in the summer. In winter he
found psychrophiles present in water and mud but not .in soil.
The pH of a soil is determined by a number of factors, including
the concentration of salts and carbon dioxide in the soil solutions and
the exchangeable cations present. As these factors fluctuate in time
and space, so does the pH of the soil, usually within the limits of one
to two units (10), As water moves through a soil, bases tend to be
leached out and replaced by hydrogen ions. Thus constant leaching leads
to the formation of an acid soil. These changes can affect the chemical
properties of soil by altering the solubility of certain substances. In
acid soils toxicity to microbes could occur if the solubility of aluminum,
nickel, and other components increased while nutrients such as calcium
and phosphorous compounds solubilized and washed away. Alkaline soils
are formed under arid conditions. The light rainfall is insufficient to
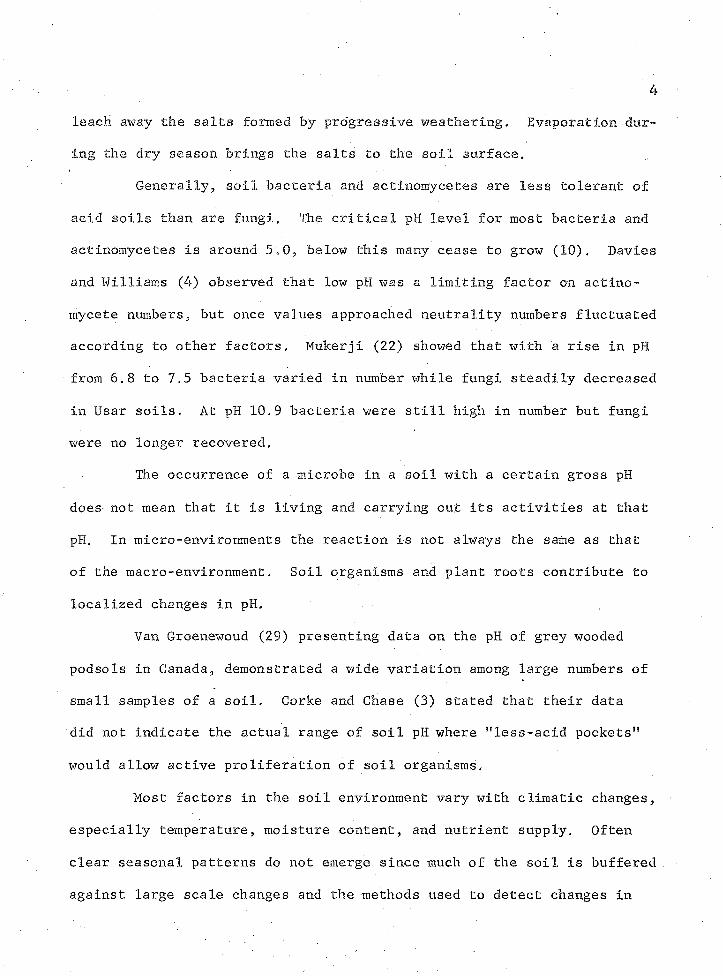
leach away the salts formed by progressive weathering. Evaporation dur
ing the dry season brings the salts to the soil surface.
Generally, soil bacteria and actinomycetes are less tolerant of
acid soils than are fungi. The critical pH level for most bacteria and
actinomycetes is around 5,0, below this many cease to grow (10), Davies
and Williams (4) observed that low pH was a limiting factor on actino-
mycete numbers, but once values approached neutrality numbers fluctuated
according to other factors. Makerji (22) showed that with a rise in pH
from 6.8 to 7.5 bacteria varied in number while fungi steadily decreased
in Usar soils. At pH 10,9 bacteria were still high in number but fungi
were no longer recovered.
The occurrence of a microbe in a soil with a certain gross pH
does not mean that it is living and carrying out its activities at that
pH. In micro-environments the reaction is not always the same as that
of the macro-environment. Soil organisms and. plant roots contribute to
localized changes in pH.
Van Groenewoud (29) presenting data on the pH of grey wooded
podsols in Canada, demonstrated a wide variation, among large numbers of
small samples of a soil. Corke and Chase (3) stated that their data
did not indicate the actual range of soil pH where "less-acid pockets"
would allow active proliferation of soil organisms.
Most factors in the soil environment vary with climatic changes,
especially temperature, moisture content, and nutrient supply. Often
clear seasonal patterns do not emerge since much of the soil is buffered
against large scale changes and the methods used to detect changes in

microbial numbers are not sensitive to small scale fluctuations. In
soils subjected to extreme climatic conditions5 such as long periods of drought which occur regularly every year, clear seasonal changes in the
microflora have been detected (10),Waksman (31) in studying cultivated and uncultivated loams in
■New Jersey, found different bacterial population maxima in each soil at
different times during a year. He stated that moisture and temperature
have a bearing upon bacterial numbers, but these changes in numbers can
not be completely explained. Other non-seasonal factors such as soil
type, vegetation, condition of organic matter of soil, and soil pH have
to be considered to explain changes in the soil. Waksman suggests that
seasonal variation does not exist due to the variation of these factors.
Hiltner and Sttiraer (as cited by Waksman [31]) found that seasonal vari
ation of soil temperature had relatively little influence upon bacterial
numbers which rose and fell in summer along with the water content of
the soil. Davies and Williams (4) indicated that little could be con
cluded concerning the seasonal fluctuation of the actinomycete population
since the variation was not statistically significant between temporally
separated samples and spatially separated samples taken at the same time.
Hattori (12) states that the numbers of microbes vary daily and annually
but remain comparatively stable.
Burges (2) maintains a seasonal variation in numbers and types of
microorganisms exists, particularly in forest soils of cool temperate
climates. Numbers of microorganisms corresponded with a raise in nitro
gen content. He found, for example, an increase in bacterial numbers
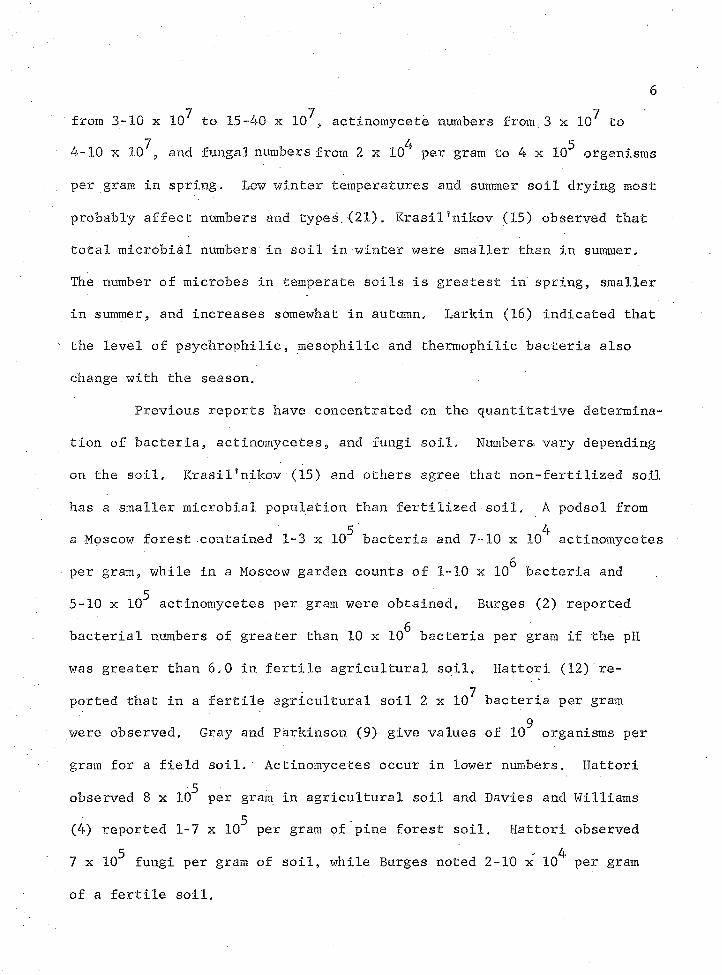
7 7 7from 3-10 x 10 to 15-40 x 10 , actinonrycete numbers from 3 x 10 to
4-10 x 10̂ , and fungal numbers from 2 x 10̂ per gram to 4 x 10~* organisms
per gram in spring. Low winter temperatures and summer soil drying most
probably affect numbers and types.(21)» Krasil?nikov (15) observed that
total microbial numbers' in soil in winter were smaller than in summer.
The number of microbes in temperate soils is greatest in spring, smaller
in summer, and increases somewhat in autumn, Larkin (16) indicated that
the level of psychrophilic, mesophilic and thermophilic bacteria also
change with the season.
Previous reports have concentrated on the quantitative determina
tion of bacteria, actinomycetes, and fungi soil. Numbers vary depending
on the soil, Krasil'nikov (15) and others agree that non-fertilized soil
has a smaller microbial population than fertilized soil, A podsol from5 4a Moscow forest contained 1-3 x 10 bacteria and 7-10 x 10 actinomycetes
per gram, while in a Moscow garden counts of 1-10 x 10̂ bacteria and 55-10 x 10 actinomycetes per gram were obtained. Burges (2) reported
bacterial numbers of greater than 10 x 10̂ bacteria per gram if the pH
was greater than 6,0 in fertile agricultural soil, Hattori (12) re-7ported that in a fertile agricultural soil 2 x 10 bacteria per gram
9were observed. Gray and Parkinson (9) give values of 10 organisms per
gram for a field soil. Actinomycetes occur in lower numbers, Hattori 5observed 8 x 10 per gram in agricultural soil and Davies and Williams
5(4) reported 1-7 x 10 per gram of pine forest soil. Hattori observed5 ' 47 x 10 fungi per gram of soil, while Burges noted 2-10 x 10 per gram
of a fertile soil.
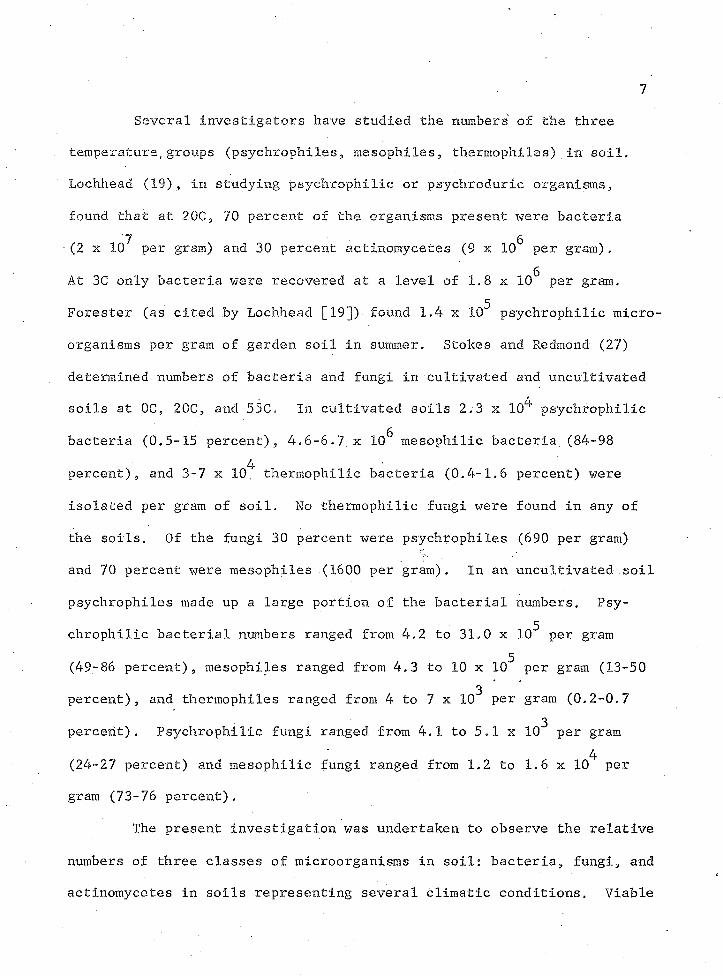
Several investigators have studied the numbers' of the three
temperature,groups (psychrophiles, mesophiles, thermophiles) in soil.
Lochhead■(19), in studying psychrophilic or psychroduric organisms9found that at 20C, 70 percent of the organisms present were bacteria
7 6(2 x 10 per gram) and 30 percent actinomycetes (9 x 10 per gram).
At 3C only bacteria were recovered at a level of 1,8 x 10̂ per gram.
Forester (as cited by Lochhead [19]) found 1,4 x 10“* psychrophilic micro
organisms per gram of garden soil in summer, Stokes and Redmond (27)
determined numbers of bacteria and fungi in cultivated and uncultivated
soils at 0C, 20C, and 55C, In cultivated soils 2,3 x 10^ psychrophilic
bacteria (0.5-15 percent), 4.6-6.7 x 10̂ rnesophilic bacteria. (84-984 -percent), and 3-7 x 10. thermophilic bacteria (0.4-1,6 percent) were
isolated per gram of soil. No thermophilic fungi were found in any of
the soils. Of the fungi 30 percent were psychrophiles (690 per gram)
and 70 percent were mesophiles (1600 per gram). In an uncultivated soil
psychrophiles made up a large portion of the bacterial numbers, Psy-5chrophilic bacterial numbers ranged from 4.2 to 31.0 x 10 per gram
5(49-86 percent), mesophiles ranged from 4.3 to 10 x 10 per gram (13-503percent), and thermophiles ranged from 4 to 7 x 10 per gram (0.2-0.7
3percent). Psychrophilic fungi ranged from 4.1 to 5.1 x 10 per gram
(24-27 percent) and rnesophilic fungi ranged from 1,2 to 1.6 x 10‘ per gram (73-76 percent).
The present investigation was undertaken to observe the relative
numbers of three classes of microorganisms in soil: bacteria, fungi, and
actinomycetes in soils representing several climatic conditions. Viable
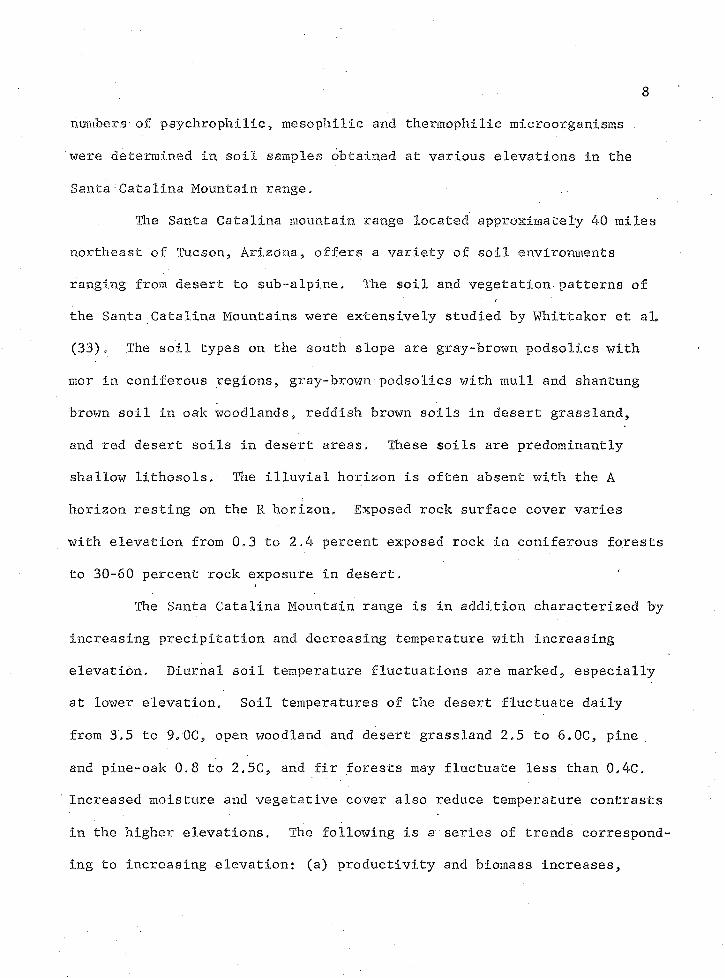
numbers of psychrophilic, mesophilic .-and thermophilic microorganisms
were determined in soil samples obtained at various elevations in the
Santa Catalina Mountain range.
The Santa Catalina mountain range located approximately 40 miles
northeast 'of Tucson, Arizona, offers a variety of soil environments
ranging from desert to sub-alpine. The soil and vegetation patterns of
the Santa Catalina Mountains were extensively studied by Whittaker et al
(33), The soil types"on the south slope are gray-brown podsolics with
mor in coniferous regions, gray-brown podsolics with mull and shantung
brown soil in oak woodlands, reddish brown soils in desert grassland,
and red desert soils in desert areas. These soils are predominantly
shallow lithosols. The illuvial horizon is often absent.with the A
horizon resting on the R horizon. Exposed rock surface cover varies
with elevation from 0,3 to 2,4 percent exposed rock in coniferous forests
to 30-60 percent rock exposure in desert.
The Santa Catalina Mountain range is in addition characterized by
increasing precipitation and decreasing temperature with increasing
elevation. Diurnal soil temperature fluctuations are marked, especially
at lower elevation. Soil temperatures of the desert fluctuate daily
from 3,5 to 9.0C, open woodland and desert grassland 2.5 to 6.QC, pine
and pine-oak 0.8 to 2,5C, and fir forests may fluctuate less than 0,4C.
Increased moisture and vegetative cover also reduce temperature contrasts
in the higher elevations. The following is a series of trends correspond
ing to increasing elevation: (a) productivity and biomass increases.

9(b) vegetation coverage increases -(30-50 percent in deserts to 100 per
cent in fir forests), (c) nitrogen content increases, and (d) soil pH
decreases (33),
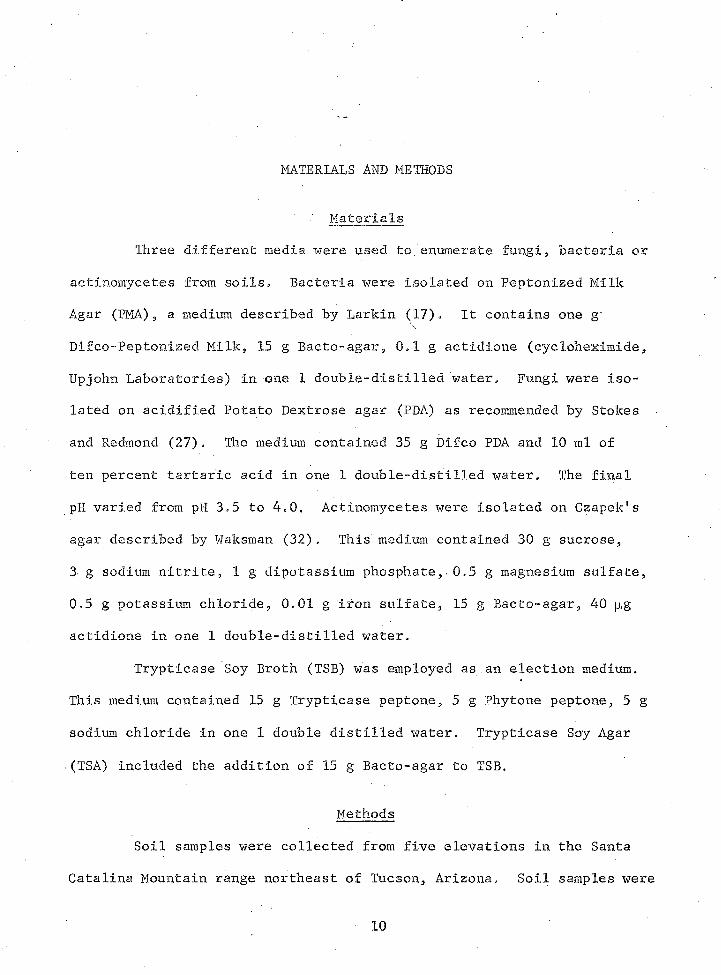
MATERIALS AND METHODS
Materials
Three different media were used to.enumerate fungi5 bacteria or actinomycetes from soils. Bacteria were isolated on Peptonized Milk
Agar (PMA) «, a medium described by Larkin (17). It contains one g'
DifCo-Peptonized Milk, 15 g Bacto-agar, 0.1 g actidione (cycloheximide,
Upjohn Laboratories) in one 1 double-distilled water. Fungi were iso
lated on acidified Potato Dextrose agar (PDA) as recommended by Stokes
and Redmond (27), The medium contained 35 g Difco PDA and 10 ml of
ten percent tartaric acid in one 1 double-distilled water. The final
pH varied from pH 3.5 to 4,0. Actinomycetes were isolated on CzapelV s
agar described by Waksman (32), This medium contained 30 g sucrose,
3 g sodium nitrite, 1 g dipotassium phosphate, 0.5 g magnesium sulfate, 0.5 g potassium chloride, 0.01 g iron sulfate, 15 g Bacto-agar, 40 p,g
actidione in one 1 double-distilled water.
Trypticase Soy Broth (TSB) was employed as.an election medium.
This medium contained 15 g Trypticase peptone, 5 g Phytone peptone, 5 g
sodium chloride in one 1 double distilled water. Trypticase Soy Agar
(TSA) included the addition of 15 g Bacto-agar to TSB.
Methods
Soil samples were collected from five elevations in the Santa
Catalina Mountain range northeast of Tucson, Arizona, Soil samples were
10

11taken beginning September 1973 arid every two months thereafter for one
year. The elevations, soil type, and surrounding vegetation are de
scribed in Table 1, •
Prior to sampling, surface litter was removed at each site.
Approximately 300 g of soil were taken from shaded areas at three loca
tions within a four square foot area using an ethanol-flamed spatula.
The soil samples were placed in labelled plastic bags and processed
within six hours in the laboratory. At each sample site the temperature
of the soil (surface 5 cm) and the air was taken and the general weather
conditions were observed.
In the laboratory the three soil samples from one site were
sifted together through a sieve with a one mm square mesh. From the
sifted material three separate aliquots (1-3 g) were weighed in pre
weighed aluminum pans and dried 24 hours at 105C in order to determine
soil moisture and dry weight, Soil pH was measured with a Coleman
metrion IV pH meter using a 1:1 soil-water suspension (1).
Numbers of viable microorganisms were determined as follows: 10 g
of soil were measured and added to a Waring blendor which contained 90 ml
sterile distilled water, agitated 15 sec to break particulate material,
and was further diluted serially. Three soil dilutions, in triplicate,
were either pour plated or spread plated. The above procedure was re
peated for samples from each site.
Culture Conditions
-Numbers of psychrophiles, mesophiles, and thermophiles were
determined as follows: For psychrophiles, triplicate plates were

Table X» Description of sampling;areas.
Elevation Vegetation Type Shade Provided By . Soil Type*
1. 3500 ft. Desert Shrub Cercidium microphyllum (Yellow Palo Verde)
gravelly sandy loam9 arid
2. 4300 ft. Oak Woodland Quercus oblongifolia (Mexican Blue Oak)
gravelly sandy loam̂ arid ■
3. 5400 ft. Pinyon-Juniper Quercus arizonica (Arizona White Oak)
loamy9 medium textured semi- arid to mesic
4. 7000 ft. Ponderosa Pine Pinus ponderosa var. arisonica (Ponderosa Pine)
stony sandy loam, mesic
5. 8200 ft. Mixed Conifer Quercus gambelii (Gamble Oak) Pseudofcsuga taxifolia (Douglas Fir)
loamy, moderately fine textured, frigid
* Data from USDA Soil Conservation Service (23),

incubated for 14 days at QC; for mesophiles3 4 to 5 days at 20C; and
for thermophlies3 2 days at 50G, This.followed the convention of Stokes
and Redmond (27), All colonies isolated at OC represented psychrophil.es
and colonies isolated at 5GC represented thermophiles. Numbers of
mesophiles were determined by subtracting the OC count from the 20C
count,
Psychrophile Election - - .
No psychrophiles were recovered during the sampling period from
soil suspensions plated on solid media. Therefore psychrophile election
with a liquid culture was employed. Duplicate, one gram, soil samples
from each of the five sites plus one additional sample from 9,000 ft were inoculated into 9 ml of TSB and incubated at OC for two months.
Samples were removed from the broth (every two weeks), plated on TSA and
incubated for two weeks at OC. Ten gram soil samples were added to 50 ml
of TSB in flasks and incubated at 0C, Samples were removed from the
broth enrichment and plated on TSA plates every two weeks and incubated
at OC for two weeks»
Temperature and Soil Response Studies -of Isolated Actinomycetes
The effect of temperature on the growth of actinomycetes was
investigated. Isolated colonies from enumeration plates were transferred
onto Czapek?s media to obtain pure cultures. Pure cultures were trans
ferred to slants of Csapekfs medium and stored at 20C. Stock cultures
were transferred once a month.

14Cardinal growth temperatures of each isolate were determined on
Csapek3s medium and TSA3 at seven different temperatures: 4, 15, 20, 25, 37, 45, and 55C, Cultures at each temperature were examined grossly and
microscopically for changes in colony and cell appearance, sporulation,
and pigment production. The isolates grew equally well on Czapek*s and
TSA media.
The response of actinomycetes to different soils was observed.
This was a qualitative test to observe growth of actinomycetes on soil
from each of the sampling sites,' Soil-water (equal amounts of each)
pastes were prepared using soils from each site and placed.in petri
dishes. The pastes were then overlayed with 1.5 percent agar in water
or Czapek*s salts (no sucrose) in 1.5 percent agar or Czapekis complete
media in 1,5 percent agar. Actinomycetes isolated from each of the five
study sites were inoculated onto plates of soil from each site.
Statistical Analysis
A computerized regression analysis was performed using environ
mental factors and organism numbers as variables. The multiple-*
regression model involves a single criterion variable which is predicted
from a set of predictor variables, yielding a multiple-correlation
coefficient. The square of the multiple-correlation coefficient may be
interpreted as the proportion of the variance of the criterion variable
that is explained by the predictors. The solution of a
multiple-correlation problem involves the determination of a set of
weights, one for each predictor variable, which can be applied to each

15
subject’s set of predictor scores to yield a series of composite pre
dicted criterion scores. The equation used to compute a subject’s
criterion score may be expressed as:
where
Y = predicted criterion score
B = raw score weight
V = raw score for a predictor variable
RC = regression constant (30) .

RESULTS
Evaluation-of Primary Isolation Media
Both media used to determine actinomycete and bacterial popula
tions contained the antibiotic actidione. This antifungal agent effec
tively inhibited the growth of fungi on Czapek7s (18) and PMA agar plates,
Larkin (17) showed PMA to be superior to TSA and soil extract agar for
bacterial enumeration. CzapelVs. medium is a synthetic medium, providing
reproducible results, Actinomycete enumeration is enhanced as the
microorganisms produce a typical colony morphology.
Potato Dextrose Agar acidified with tartaric acid was used to
enumerate fungi. With the exception of an occasional bacterial colony
only fungal colonies were found to grow on this medium. Spreading of
fungal colonies on PDA was largely inhibited by the low acidity.
Distribution of Bacteria, Actinomycetes,and,Fungi in Relation to Environmental Factors
Table 2 shows the distribution of bacteria, actinomycetes, and
fungi found at each elevation. , At 20C the numbers of fungi varied from
104 to 106 organisms per gram, actinomycetes 10~* to 10̂ organisms per6 8gram, and bacteria 10 to 10 organisms per gram depending on the condi
tions of the soil. These values correspond to numbers of organisms
determined by other investigators.
16

Table 2. Numbers of microorganisms in relation to sampling period and elevation.
Numbers of Organisms per Gram Dry SoilMonth U .L V. V U -LU11
(feet) Bacteria Actinomycetes FungiOC 20C 50C OC 20C 50C OC 20C 50C
September 3500 - 1.6xl07 4.2xl05 - 1.2xl07 2.9xl05 •" 4.9x10^ -4300 8.2xl06 - . *“ 5.5xl06 — - 5.2x10 r -5400 1.5xl07 5.OxlQ3 - 1.3xl07 - 1.5xl05 -7000 2.3xl06 - - 6.9xl05 - » 1.2xl06 -8200 - 2.2xl07 2.0xl05 - 2.2xl07 2.6xl04 - 8.4xl05 -
November 3500 - 1.8xl07 1.IxlO8 - 2.4xl05 1,IxlO6 - 3.4xl044300 - 1.5xl07 8.9xl04 . “ 4.IxlO3 2.9xl04 - 1.8xl055400 - 1.3xl07 7.3xl03 - 2.1xlG6 4.IxlO2 - 4.8xl047000 2.5xl06 - 1.6xl05 «. - 7.0xl05 -8200 1.9xl07 1.2xl05 - 2.6xl05 - - l.lxlO5 -
January 3500 _ • 6.2xl07 1.6xl06 2.IxlO6 58.1x10 8.1x10° 1.2xl044300 - 1.6xl07 1.6xl06 4.3xl06 3.3xlQ4 - 7.OxlO45400 - 1.IxlO8 1.5xl05 - 3.7xl07 3.9xl02 - 1.2xl067000 - 4.9xl07 3.8xl02 - 2.2xl05 - - 9.2xl05 «.8200 - l.OxlO8 l.lxlO5 - 1.9xl06 — - 5.8xl05 -
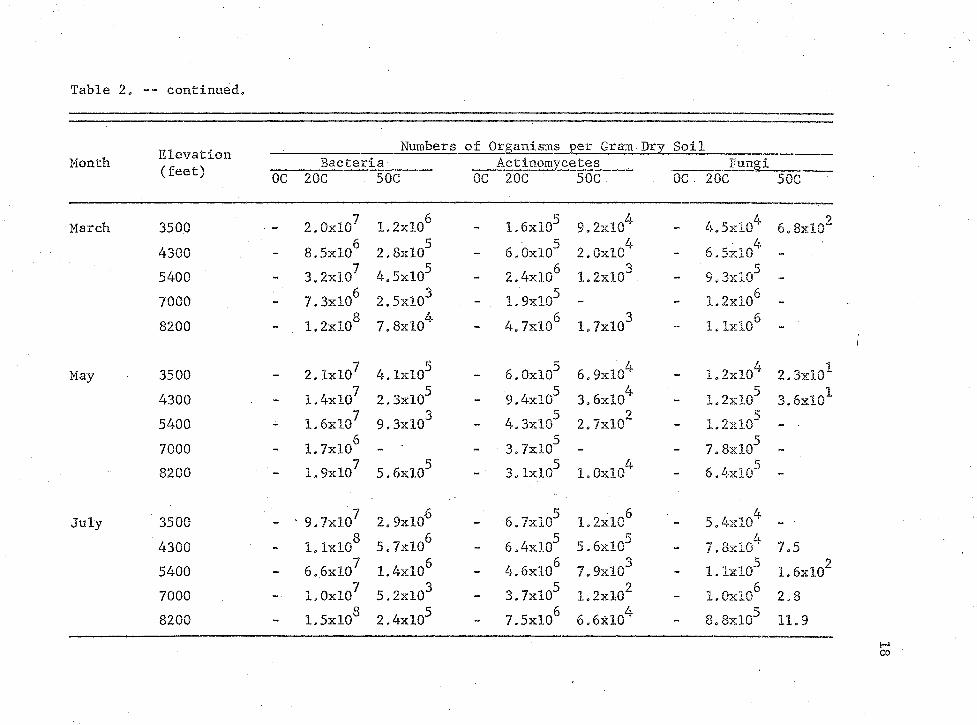
Table 2» -- continued.
Elevation(feet)
Numbers of Organisms per Gram Dry SoilMonth Bacteria Actinomycetes Fungi
OC 20C 50C OC 20C 500 OC 20C 50C
March 3500 • — 2.OkIO7 1.2xl06 - 1.6xl05 9.2xl04 - 4.5xl04 6.8xl024300 - 8.5xl06 2.8x10"* 6.0xl05 2.OxlO4 - 6.5x10^ «5400 - 3.2xl07 4.5xl05 - 2.4xl08 1.2xl03 - 9.3xl05 -7000 - 7,3xl06 2.5xl03 - 1.9xl05 - - 1.2xl068200 - 1.2xl08 7.8xl04 - 4.7xl06 1.7xl03 - 1.IxlO6
May 3500 1 - 2.IxlO7 4.1xl05 6.OxlO5 6.9xl04 - 1.2xl04 2.3x10^4300 - 1.4xl07
72.3xl05
3- 9.4xl03
53.6xl04
2- 1.2x10̂
53.6X101
5400 - 1.6x10 9.3x10 - 4.3x10 2.7x10 - 1.2x10 - •7000 - 1.7x10^ - - 3.7xl05 - - 7.8xl058200 1.9xl07 5.6xl05 ' - ' 3.IxlO5 1.OxlO4 - 6.4xl03 -
July 3500 • 9.7xl07 2.9xl06 We» 6.7xl05 1.2xl06 5,4x10"4300 - l.lxlO8 5.7xl06 “ 6.4xl03 5.6xl03 - 7.8xl04 7,55400 - 6.6xl07 1.4xl08 4.6xl08 7.9xl03 - 1.IxlO5 1.6xl027000 ■*# -
71.0x10 5.2xl03 3.7xl05 1.2xl02 - 1.0x10° 2.88200 1.5xl08 2.4xl05 7.5xl06 6.6xl04 _ S.SxlO3 11.9

19Frequently a greater number of organisms was recovered in January
and July. Thermophilic and mesophilic bacteria exhibited prominent
peaks. Tills was most likely due to the increase in soil moisture. The
March readings were often high because of spring thaw producing more
available water and nutrients, Mesophilic actinomycetes showed peaks in
January and July similar to bacteria. Thermophilic actinomycetes showed
one prominent peak in July. Even though January provided available
water the low temperatures inhibited growth. Mesophilic fungi did not
seem to rely on the presence of soil moisture as the bacteria and actino
mycetes did. March produced peaks most likely due to spring thaw and
availability of nutrients„ The peaks in March occurred only at the
upper elevations where there was snow cover. The two lower elevations
had no snow or rain in March and therefore no increase in numbers
occurred.
At the 7000 foot elevation where the soil does not support good
growth it is interesting to note that thermophilic fungi and actinomy
cetes were isolated only at one time when soil moisture and warm tempera
tures were greatest in July. Thermophilic bacteria were recovered only
in January, March, and July when water and nutrients were readily avail
able.
At the upper elevations fewer numbers of thermophiles were iso
lated, This was particularly true of the actinomycetes as July numbers
show an increase when both temperature and moisture increased.
Table 3 shows soil moisture, soil pH, and soil and air
temperature. Soil moisture appeared to have the most effect on numbers
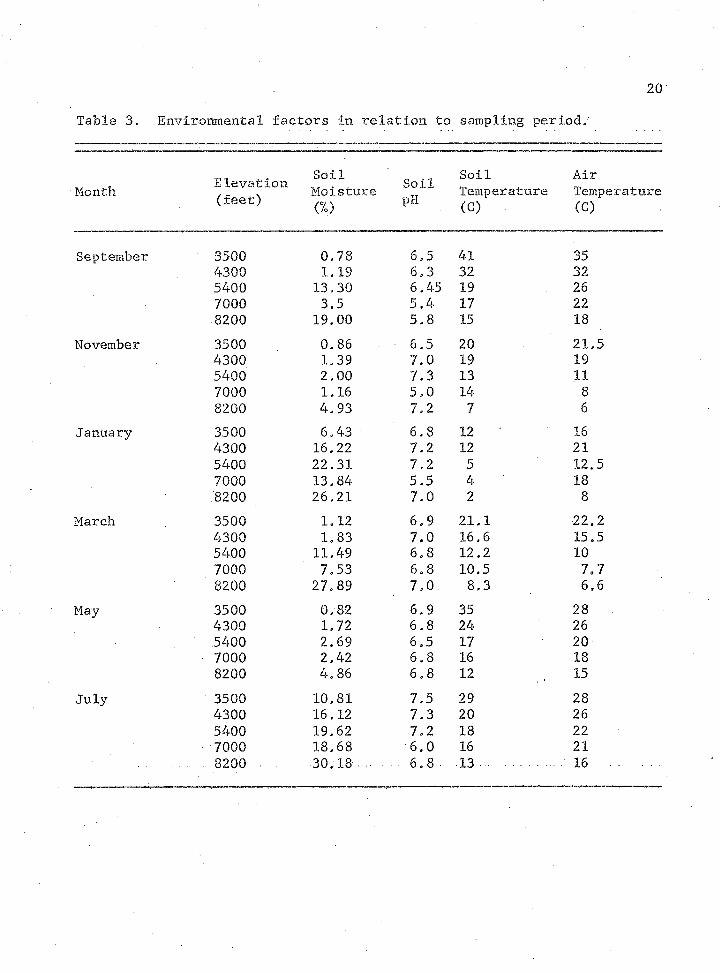
20
Table 3. Environmental factors in relation to sampling period,'
Elevation Soil Soil AirMonth . . Moisture Temperature Temperature
<£eet> (%) PH (C) . (C)
September 3500 0.78 6,5 41 354300 1.19 6.3 32 325400 13,30 6.45 19 267000 3.5 5.4 17 228200 19.00 5.8 15 18
November 3500 0,86 6.5 20 21,54300 1.39 7,0 19 195400 2.00 7.3 13 117000 1.16 5,0 14 88200 4.93 7.2 7 6
January 3500 6.43 6,8 12 164300 16.22 7.2 12 215400 22.31 7.2 5 12,57000 13.84 5.5 4 18.8200 26.21 7.0 2 8
March 3500 1.12 6.9 21.1 22.24300 1.83 7.0 16.6 15.55400 11.49 6.8 12.2 107000 7.53 6.8 10.5 7.78200 27.89 7,0. 8,3 6.6
May 3500 0.82 6.9 35 284300 1.72 6.8 24 265400 2.69 6.5 17 207000 2,42 6.8 16 188200 4.86 6.8 12 15
July 3500 10.81 7.5 29 284300 16.12 7.3 20 265400 19.62 7.2 18 227000 18.68 6.0 16 21
. 8200 ■ 30.18 . . . . 6.8 13 .. 16

of microorganisms/ The greatest percentage of soil moisture was recorded
in January and July which is reflected in the increased numbers of
microbes isolated. Soil pH changed no more than two units for all
samples. These units were near optimal growth values. Soil and air
temperature reflected seasonal changes. The incubator temperature how
ever had a more visual effect on soil microbial numbers than environ
mental temperatures. Soil taken from periods of extremes in temperatures
such as January and July» produced more colonies at 20C than soil taken
from periods of more optimal temperatures.
Temporal Fluctuation of Microbial Numbers
With each season a significant difference in bacterial, antino
my cete , and fungal numbers was observed as shown in Table 2, Seasonal
variations are a result of environmental changes and moisture appears to
have the most effect on numbers and types of microbes. Figure 1 shows
the relationship between bacteria isolated at 20C from soil at 8200 feet
and rainfall, temperature, and soil moisture. Rainfall data was ob
tained from a U,S. Forest Service ranger station located at 7900 feet.
Snow cover occurred from November through March, The melting snow in
March was most likely responsible for elevated soil moisture and a
possible increase in available nutrients, thus contributing to the
higher bacterial counts, since there was little rainfall recorded for
the area during this period. It can be seen that the bacterial count is
a reflection of soil moisture which depends for the most part on the
amount of rainfall. For example, in January and July the bacterial

Rai
nfal
l So
il M
oist
ure
Log
Viab
le
Bac
teri
a/
Tem
per
atu
re
(Inc
hes)
(%
) Gr
am
Dry
Soil
(C)
22
Figure 1
10 '
5-
8.0-
7.0
20 -
1 o -
3-
2-
1973 19 74S a m p l i n g P er io d s ( M o n t h )
Number of bacteria (at 20°C from 8200 feet), soil moisture, temperature and rainfall in relation to monthly sampling periods.
23counts were the highest as was soil moisture and rainfall greatest.
Numbers were lowest in November and May when there was no rainfall.
Isolation of Psychrophiles and Thermophiles
Psychrophilic organisms were isolated during, the. first two
sample periods. However, the small incubator used for OC incubation
was found to be unreliable. Subsequently, plates of each of the three
media were incubated in a larger incubator with a better temperature
control system. No psychrophiles were isolated from serially diluted
soil samples irrespective of site.
Psychrophiles were isolated however, but only by elective culture.
For example, following a six week incubation period at OC, growth did
occur in tubes of TSB inoculated with one gram of soil taken at the
5400 ft, 8200 ft, and 9000 ft sampling sites. By definition these
organisms would not be psychrophilic but psychroduric. Growth did
occur within two weeks at 0C from a ten gram soil sample inoculated into
TSB, According to Ingraham and Stokes (13) the latter are most likely
psychrophiles. Upon subculture growth occurred within eight days at 0C,
Gram stains revealed that the organisms were gram negative rods. This
demonstrated that psychrophilic microorganisms were present but in
numbers too low to be detected by conventional direct plate count '
methods.
Thermophilic bacteria and actinomycetes were relatively common.
However, thermophilic fungi were isolated only when the temperature of
incubation was lowered from 55C to 50C after the November sampling
period and then only occasionally. Table 4 indicates the ratio of

Table 4, The ratio of thermophilic to mesophilic bacteria and actinomycetes.
Elevation Month (feet)
BacteriaRatio*
Ac t inomycete s . Ratio S;
,, Elevation . Month (feet)
BacteriaRatio
Ac tinomycete s Ratio .
3500 2.5 2.2 March 3500 5.47 36.24300 _ * * 4300 3.18 3.35400 .03 - 5400 1.36 .057000 - - 7000 .038200 .89 - 8200 .06 .04
3500 5.76 121.8 May 3500 1.92 10.34300 .59 6.6. 4300 1.56 3.75400 .06 .02 5400 .06 .067000 - - 7000 -8200 . 63 - 8200 2.87 3.3
3500 2.52 27.8 July 3500 3.12 152.74300 9.1 .76 4300 4.83 88.65400 .14 .01 5400 2.18 ■ .177000 .001 - 7000 .05 .038200 .11 - ' 8200 1.57 .87
* Ratio of thermophiles to mesophiles.
** No thermophiles were isolated.
ro
25
thermophilic to mesophilie bacteria and actinomycetes isolated at each
sampling site. Generally, the ratio of thermophilic to mesophilic
organisms decreased as elevation increased. Thermophilic.actinomycetes
represented a significant portion of the population isolated, at times
outnumbering mesophilic actinomycetes. For example, at the lowest ele
vation, 3500 ft, there is a significant thermophilic actinomycete popu
lation. In November and July thermophilic actinomycetes outnumbered
mesophilic actinomycetes. The number of thermophilic actinomycetes
dropped considerably with increased elevation.
Variation Among Elevation Levels and Numbers and Types of Microorganisms
Data in Figure 2 show trends among elevations and numbers and
types of microorganisms indicating that soil characteristics may be im
portant factors. Numbers of mesophilic fungi increased with elevation
and were highest at the 7000 ft site. Numbers of bacteria and actino
mycetes were lowest at this elevation. At 7000 ft the pH of the soil
was consistently lower than the other four elevations, ranging from pH
5.0 to pH 6.8, while the pH varied from 6.3 to 7.5 at the other levels.
Thermophilic bacteria showed a more pronounced reaction to soil condi
tions as compared to mesophilic bacteria. Thermophilic actinomycetes
decreased with elevation as was shown previously (Table 4).
Ac tinomycetes
One hundred fifty actinomycete isolates were obtained from soil
samples collected at the various elevations. Cardinal growth tempera
tures were determined for each isolate. No psychrophilic actinomycetes

Log
Ave
rag
e N
um
ber
V
iab
le
Cel
ls
/Gra
m
Dry
So
il
/ Ye
ar26
8.0 Mesophi les T h e r mo phi I
7.0
6.0
vwv
Sam pling S i t e
Figure 2. Numbers of bacteria, actinomycetes and fungi in relation toelevation.-" Bacteria •-------- Actinomycetes *- - -Fungi .......

27were isolated. None of the aetinomycetes grew below 4C nor above 60C.
Mesophilic aetinomycetes grew from 15C to 37C with an optimum of 20C to
25C. Thermotolerant species grew from 20C to 50C with an optimal
temperature of 37C to 45C. Table 5 lists the numbers of aetinomycetes
capable of growth either at 2GC or 50C or both as correlated with eleva
tion. Very few of these organisms would be classified as thermophiles
by Emerson and Cooney (8) as most of those that grow at 50C also had the
capability of growth at 2GC. Those aetinomycetes able to grow at both
20C and 50C would be classified thermotolerant.
The aetinomycetes were grouped according to color of the aerial
mycelium. Table 6 lists several of the more common groups. Listed also
are the predominant temperature responses and elevations of the individur
a Is within each group, The grey shaded species.are thermotolerant and
were generally found at the lower elevations. The species exhibiting
brighter and more varied colors were mesophilic and often found at the
higher elevations. This suggests that pigment production may be
temperature sensitive.
An effort was.made to determine if the soil from each elevation
contained some factor that would prevent growth of organisms isolated
from elevations other than the soil being tested. Table 7 shows the
results of these experiments, The data are probably a reflection of
soil type and not elevation. Growth is poor at the 7000 ft level where
the soil is more acidic and sandy. An actinomycete from 7000 ft was the
only isolate to grow. Soil from 5400 ft supported the best growth of all
the isolated aetinomycetes. Why growth on soil from 8200 ft was poor is

28Table 5, Growth of actinomycetes"at elevated temperature in relation
to sample site elevation.
Elevation(feet)
Total Number of Isolates
Number of Incubation
Isolates Growing at . Temperature of;
20C 50C 20 and 50C
3500 49 45* 40* 45**
4300 27 27 3 3
5400 30 30 17 17
7000 12 12 0 0
8200 19 19 1 1
* Numbers of isolates of the total isolates obtained from each sample site, showing growth at each respective temperature,
** Numbers of isolates capable of growth at both 20C and 50C»
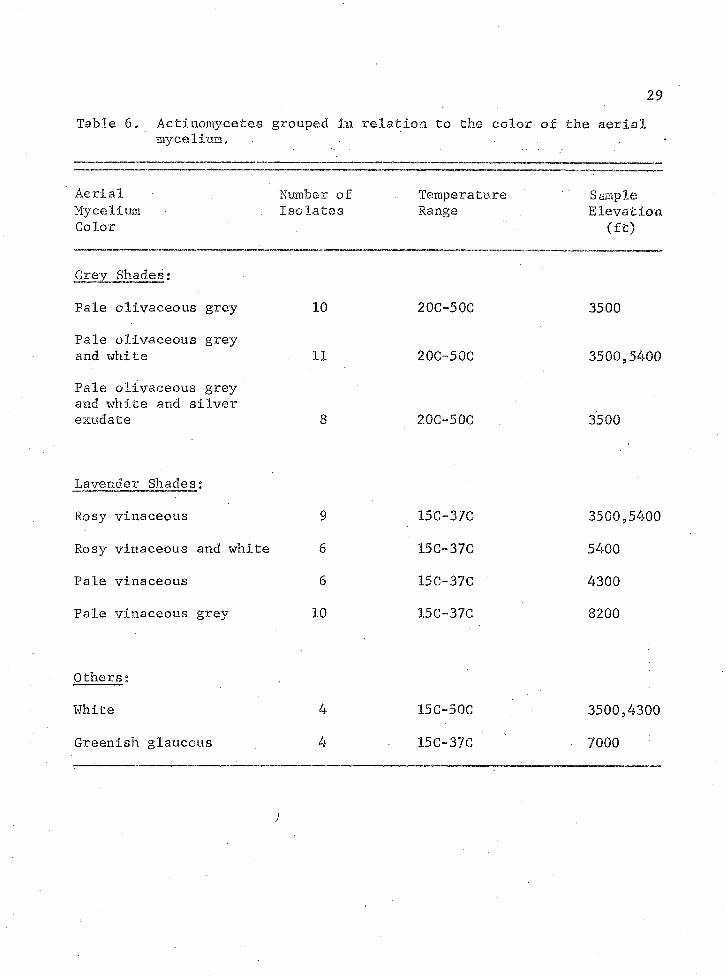
Table 6, Actinomycetes mycelium.
grouped in relation to the color of29
the aerial
Aerial Number of Temperature SampleMycelium •. Isolates Range ElevationColor (ft)
Grey Shades:
Pale olivaceous grey 10 20C-50C 3500
Pale olivaceous greyand white 11 20C-50C 3500,5400Pale olivaceous greyand white and silverexudate 8 20C-50C 3500
Lavender Shades:
Rosy vinaceous 9 15C-37C 3500,5400
Rosy vinaceous and white 6 15C-37C 5400
Pale vinaceous 6 15C-37C 4300
Pale vinaceous grey 10 15C-37C 8200
Others:
White 4 15C-50C 3500,4300
Greenish glaucous 4 15C-37C • 7000

30
Table 7, Growth of actinomycetes "isolated from each elevation on soil obtained from each elevation.
Test of Actinomycete Isolate ■'-St , % .x Growth on Soils at Elevation (feet).ulevacion (feet) 3500 4300 5400 7000 8200
3500 24* 2+ 2+ 1+ 24*
4300 24- 24* 24- 14- 24*
5400 3+ 3+ 34- 1+ 34-
7000 - ' ro - 14- l~l-
8200 24- 24* 2+ - 24*
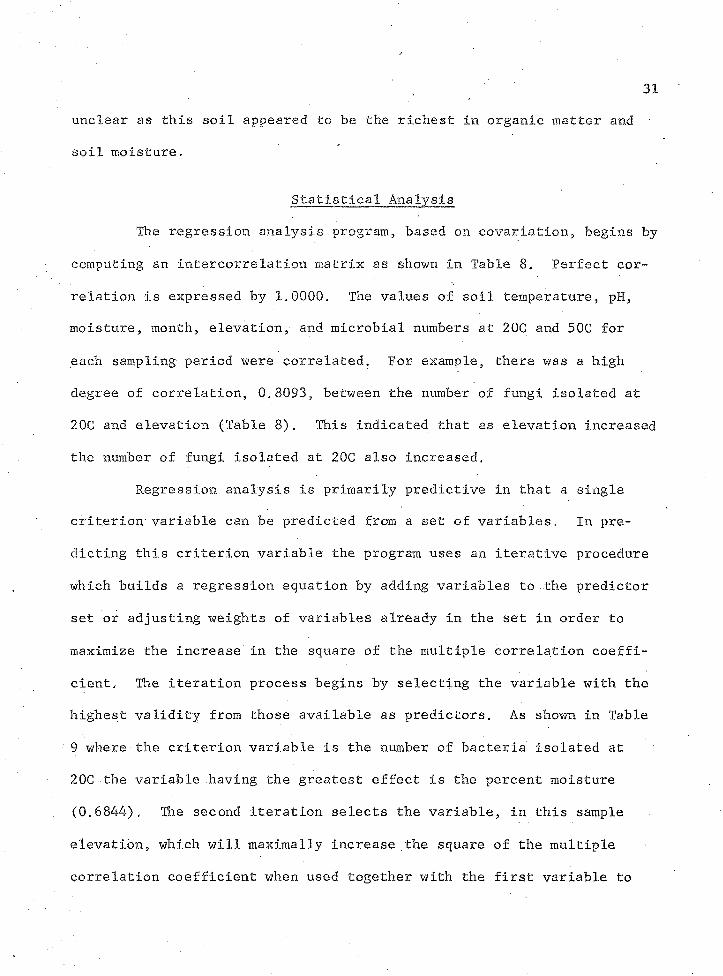
31unclear as this soil appeared to be the richest in organic matter and
soil moisture,
Statistical Analysis
The regression analysis.program, based on covariation, begins by
computing an intercorrelation matrix as shown in Table 8. Perfect cor
relation is expressed by 1.0000, The values of soil temperature, pH,
moisture, month, elevation, and microbial numbers at 20C and 50C for
each sampling period were correlated. For example, there was a high
degree of correlation, 0.8093, between the number of fungi isolated at
2DC and elevation (Table 8). This indicated that as elevation increased
the number of fungi isolated at 20C also increased.
Regression analysis is primarily predictive in that a single
criterion* variable can be predicted from a set of variables, In pre
dicting this criterion variable the program uses an iterative procedure
which builds a regression equation by adding variables to the predictor
set or adjusting weights of variables already in the set in order to
maximize the increase in the square of the multiple correlation coeffi
cient, The iteration process begins by selecting the variable with the
highest validity from those available as predictors. As shown in Table
9 where the criterion variable is the number of bacteria isolated at
2DC the variable having the greatest effect is the percent moisture
(0.6844), The second iteration selects the variable, in this sample
elevation, which will maximally increase the square of the multiple
correlation coefficient when used together with the first variable to

Table 8. Intercorrelation analysis.
1 2 3 4 5 6 7 8 9 10 11
Temperature 1.000pH .0201 1.000Month —. 014-6 .4076 1,000Elevation «.6734 -.2830 .0000 1.000% Moisture -.5020 .1525 . 2787 .5010 1.000Bacterial # at 20C -.1987 .5098 .3601 -.0148 .6844 1.000Actinomycete # at 20C . 0975 .1578 -.2185 .1166 .4676 .3746 1.000Fungal # at 20C -.5619 -.3930 . 0272 .8093 .4894 -.0843 .0734 1.000Bacterial # at 50C .0430 .6551 .3466 -.3384 .2687 .7040 .2210 -.4045 1.000Actinomycete # at 50C . 3992 .4342 .3286 -.5878 -.0049 .4561 .1724 -.5508 .7932 1.000Fungal # at 50C .2603 .3138 .4235 -.4905 -.0090 .3923 -.0905 -.5078 .4092 .5261 1.000
33
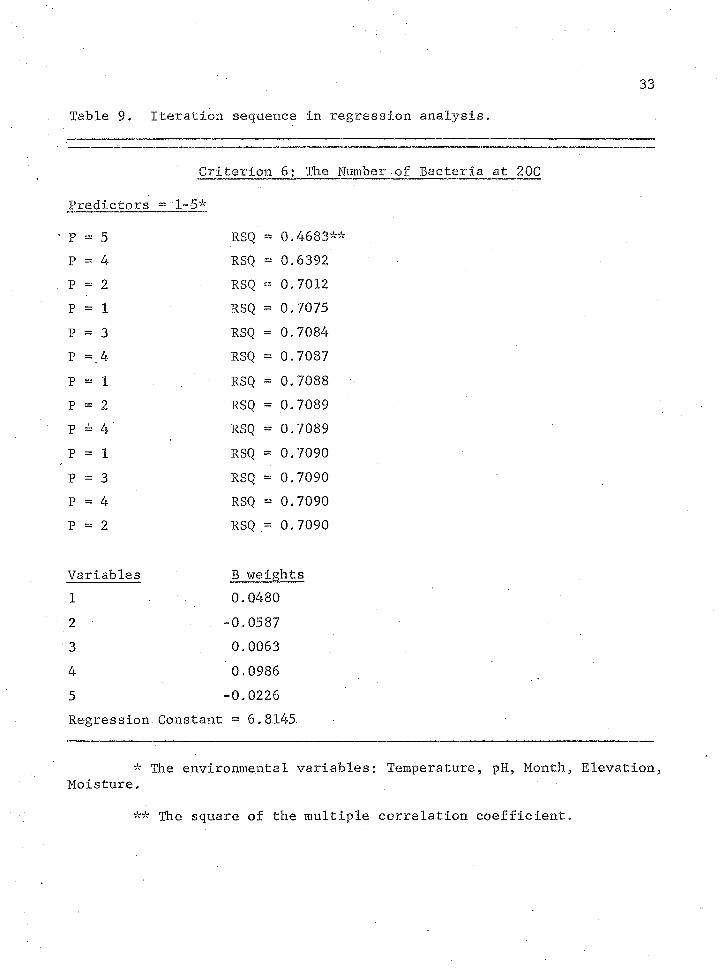
Table 9 . Iteration sequence in regression analysis.
Criterion 6: The Number of Bacteria at 20G
Predictors ~ 1-5*
• p = 5 RSQ 0.4683**p = 4 RSQ — 0.6392p = 2 RSQ — 0.7012p = 1 RSQ 0.7075p = 3 RSQ 0.7084p =.4 RSQ = 0.7087p = 1 RSQ 0.7088p = 2 RSQ = 0.7089p = 4 RSQ = 0.7089p = 1 RSQ 0.7090p = 3 RSQ = 0.7090p = 4 RSQ 0.7090p = 2 RSQ 0.7090
Variables B weights1 0.04802 -0.05873 0.00634 0.09865 -0.0226 Regression, Constant = 6.8145
* The environmental variables: Temperature, pH, Month, Elevation, Moisture.
** The square of the multiple correlation coefficient.

34form a set of two predictors and so on. The B weights indicate the
extent to which each variable is utilized in the regression equation.
With this analysis .many hypotheses may be tested. Table 10
shows the results of one hypothesis. The question was: Can the number
of-bacteria isolated at 2QC be predicted using (a) all the variables
programmed and (b) only the environmental variables.
Computing this question gives the square of the multiple correla
tion coefficient as 0,8109 for the full model and 0.7090 for the environ
mental model. This indicates that the full model can predict within
81 percent of the true value and the environmental model can predict
within 70.9 percent. Actual data from the month of January at an ele
vation of 5400 ft were inserted into the equation. The results of
7,1195 and 6,4415 for the full and shortened models5 respectively,
indicate a prediction within 81 percent and 70.9 percent of the real
value of 8,0414 (log number of organisms from bacteria at 20C in the
month of January at 5400 ft). All computations were performed on a CDC
6400 computer.

35
Table 10. Prediction of numbers of bacteria at 20C from environmental variables.
Criterion: Number of Bacteria at 20C
Predictors 1-5, 7-11* Predictors 1-5RSQ = 0.8109 RSQ = 0.7090
V B weights V B weights
1 0.0356** 1 0.0480
2 -0.0572 2 0.0587
3 -0.0095 3 0.0063
4 0.0031 4 0.0986
5 0.0112 5 -0.8145
7 0.0000
8 -0.0849
9 0.1508
10 -0.0152
11 -0.0410
Regression Constant = 6.8726 Regression IConstant = 6.8145
V6 = V1B1 + V2B2 * * * + RC
IIvO> 7.1195 V6 = 6.4415
* Predictors represent environmental factors (1-5) and organism numbers (7-11). Refer to Table 8.
** is actual data obtained from month of January at anelevation of 5400 ft.

DISCUSSION
The causes underlying the variations in numbers of microorganisms
in soil have been examined by numerous investigators. Opinions have
varied regarding positive or negative effects of moisture, temperature,
and pH, There appears to be some measure of agreement, however, that temperature has relatively little effect (28), Waksman (31) recorded his
inability to. show any correlation between bacterial numbers and moisture
or temperature. Jensen (14) concluded that bacteria, actinomycetes, and
fungi showed no correlation with the temperature, Seifert (24, 25) also
showed that temperature had little effect on the number of bacteria in
soil, Eggleton (7) found that changes in bacterial numbers were a re
flection of moisture.and not temperature.
Only fungi isolated at 20C appeared, to show a significant cor
relation with temperature. The correlation coefficient of -0.5619 indi
cates an inverse relation of fungi with temperature. However the high
correlation of fungi with elevation (0.8093) must also be considered.
It is difficult to tell whether the number of fungi varies due to eleva
tion effects or temperature only as temperature is an integral part of a
change in elevation,
Actinomycetes isolated at 50C also showed a degree of correlation
with temperature (0.3992), This is easily seen as in January (winter)
no thermophilic actinomycetes were isolated at the two upper elevations.
36
37At the three lower elevations a log decrease in numbers of thermophilic
actinomycetes isolated as compared to the July (summer) results was
observed, y
The highest numbers of microorganisms obtained from media incu
bated at 20C were observed when the environmental temperature was the
coldest in January and the warmest in July. These greater microbial
numbers are most likely due to an increase in soil moisture. Bacteria
isolated from plates incubated at 20C showed a very significant correla
tion with the percent moisture in soil, with a correlation coefficient
of 0.6844. Actinomycetes and fungi isolated from 20C also showed a
significant correlation (0.4676 and 0.4894, respectively),with moisture
content. Jensen (14) showed a significant correlation of bacteria with
soil moisture (0.520) but the fungi and actinomycete coefficients were
not as relevant, being 0.272 and 0.210, respectively. This greater
degree of correlation may be due to the dryness of the year in southern
Arizona. Any change in moisture was felt acutely. Eggleton (7) also
utilized regression analysis in studying environmental factors. He
concluded that of all the environmental factors the association of
bacteria with soil moisture was greatest. With regard to the fluctua
tions of actinomycetes and fungi, neither showed the same clear relation
ship with moisture.
Eggleton (7), working in the limited pH range of 6.1 to 6.8,
showed no evidence of soil pH exercising any effect on numbers of
bacteria, actinomycetes, or fungi, Jensen (14) also indicated that the
soil pH shows no significant correlation with numbers of microbes.

38There was a significant correlation with bacteria and fungi isolated at
20G and bacteria, actinomycetes, and fungi isolated at 50C. The pH of
all soils throughout the year varied from 5.0 to 7.5. For each elevation
the pH rarely varied more than one unit. However, at the times of in
creased microbial numbers, the pH also.increased slightly, this being
reflected in the correlation coefficient.
Soil from the 7000 ft site had a consistently lower pH, This
influenced the relative numbers of fungi to numbers of bacteria and
actinomycetes. Numbers of fungi increased with lowered pH while bacteri
al and actinomycete numbers decreased. Jensen (14) also noted this
occurrence in similar coarse, acid sand soils that were generally poor
in humus. The lower pH (average 5.2) and humus content of Jensen1s
soils related to lower numbers of bacteria and actinomycetes but not to
fungi.
Seasonal variation of microbial numbers is a controversial sub
ject. Eggleton (7) suggested that seasonal changes in temperature and
moisture are not the direct cause of the seasonal changes in numbers of
organisms but that in controlling the growth of surface vegetation these
climatic factors control the amount of energy material reaching the
microorganisms, Jensen (14) wrote that no distinct seasonal changes in
the numbers, apart from results from the changes in the moisture content,
are noticeable in any of the groups of organisms.
There was some correlation of month with the bacteria isolated
from 20C and the bacteria, actinomycetes, and fungi isolated from 50C,
The soil moisture which is a reflection of rainfall had a more

39significant correlation with the organisms isolated from 20C, Tempera
ture correlated with fungi isolated from 20C, This suggests that season
al variation does exist to some degree among these organisms. Microbial
numbers were considerably lower during drier portions of the year such
as May and November, Numbers were highest during the months of January
and July when rainfall was greater than three inches. Numbers were also
high during March because of the spring thaw providing moisture and
nutrients to the microorganisms.
The levels of moisture and availability of nutrients were im
portant factors influencing numbers and types of microbes isolated from
soils collected at the different elevations. Smaller numbers of organ
isms were obtained from soils taken at lower elevations, not only be
cause of less moisture but also because vegetative cover was sparse.
The upper elevations were forested with oak and pine trees which pro
vided both shade and soil leaf litter.
Data on the Santa Catalina Mountain range collected by Whittaker
et al. (33) show some characteristics of the soil. There is a 3,23
percent increase in organic matter with each 3200 ft up to 6560 ft.
There is a higher rate of increasing organic matter in the coniferous
forests of the upland above 6560 ft. With the increase in organic matter
in the surface soil there is an increasing thickness and coverage of
litter toward higher elevations. There is a 0,05 percent increase in
nitrogen content with each 3200 ft increase in elevation.
Throughout the investigation no psychrophiles were isolated by
conventional methods of enumeration. This was in contrast to results of

40investigators such as Stokes and Redmond (27) who maintained that p.sy-
chrophiles constitute up to 86 percent of the bacterial population in
uncultivated soils.
Growth did occur at 0C however within two weeks when larger
soil samples were inoculated into broth culture. In the more temperate
Arizona climate, it is therefore suggested that psychrophilic organisms
do not play as large a part in the environment as in colder climates.
After incubation for two weeks at 0C looking for psychrophilic
organisms, the agar plates were placed at room temperature prior to dis
carding. Growth occurred after several days. Numbers of colonies were
equal to those on plates prepared from the same material and held con
tinuously at 2QC, This suggested that low temperatures inhibited growth
but did not cause death.
Thermophilic organisms are probably a more important part of the
Arizona-desert environment, as a significant correlation exists between,
numbers of thermophilic microorganisms isolated and elevation. Stokes
and Redmond (27) found that thermophilic bacteria usually comprised
one percent or less of the bacterial population,. This was generally
true of the upper elevations of the Santa Catalina Mountain range.
The lower desert elevations depend on some thermophilic action
to decay the dead vegetation. For the sampling year the low temperature
at 3500 and 4300 ft was 12C (54F) and the high was 41C (106F) which
indicates that thermophilic or thermotolerant organisms are a necessity.

41One hundred fifty actinomycete isolates were examined. Most of
the isolates belonged to the genus Streptomyces which may be a reflec
tion on the selectivity of the medium, one which selects for aerobic heterotrophs,
The elevation experiments (Table 7) indicated that the organisms
were not restricted by elevation, although data from Table 6 suggest
otherwise. The available nutrients may be an important elevation, factor
as shown in data from Table 7 where growth of all actinomycetes on soil
from 7000 ft was poor.
The apparent delineation between meaophilic (lavender shades) and thermotolerant (grey shades) organisms is more likely a result of
pigment production than elevation. Although thermotolerant organisms
are generally found at the lower elevations some were found at the 5400
ft site and some of the meaophilic organisms were found at the lower
(3500 and 4300 ft) elevations.

LITERATURE CITED
1. . Black-, C, A. (ed,). 1965, Methods of Soil Analysis 9 Part 2,Chemical and Microbiological Properties. Madison, Wisconsin: American Society of Agronomy, Inc,
2. Burges, A, 1958, Microorganisms in the Soil, London: Hutchisonand Co,, Ltd.
3. Corke, C, T,«and F, E, Chase. 1964. Comparative Studies ofActinomycete Populations in Acid Podzolic and Neutral Mull Forest Soils, Soil Science Society Proceedings 28:68-70, ,
4. Davies, F, L, and S, T, Williams, 1970, Studies on the Ecologyof Actinomycetes in Soil, I. The Occurrence and Distribution ofActinomycetes in a Pine Forest Soil. Soil Biol, Blochem, 2:227-238.
5. Dayal, R. and 0. S, D. Gupta, 1967. The Soil Fungi of Varanosi,India in Relation to Edaphic Factors,. Oikos 18:76-81.
6. Daya1, R, and L. Giri, 1971. Soil Fungi in Leguminous Fieldsof Varanosi, India. Oikos 22:122-127.
7. Eggleton, W, G, E. 1938, The Influence of Environmental Factorson Numbers of Soil Microorganisms, Soil Science 46:351-363.
8. Emerson, R. and D. Cooney, 1964. Thermophilic Fungi, SanFrancisco: Freeman.
9. Gray, T. R, G, and D, Parkinson (eds.), 1968. The Ecology of SoilBacteria, Ontario: University of Toronto Press*,
10, Gray, T. R, G. and S, T. Williams. 1971, Soil Microorganisms,New York: Hafner Publishing Co.
11, Griffin, D. M. 1963, Soil Moisture and the Ecology of Soil Fungi.Biological Reviews 38:141-166.
12, Hattori, T, 1973, Microbial Life in the Soil, New York: MarcelDekker, Inc.
13, Ingraham, J. L, and J. L. Stokes, 1959, Psychrophilic Bacteria.Bacteriological Reviews 23:97-108,
42

43
14* Jensen,‘H. L» 1934, Contributions to the Microbiology of Australian Soils. I, Numbers of Microorganisms in Soil, and Their
. Relation to Certain External Factors. Linnean Society of New South Wales Proceedings-59:101-116.
15, Krasil'nikov, N. A, 1958, Soil Microorganisms and Higher Plants,Moscow: Academy of Science of the USSR.
16, Larkin, J, M» 1970, Seasonal Incidence of Bacterial TemperatureTypes in Louisiana Soil and Water. Applied Microbiology 20: 286-288.
17, Larkin, J. M. 1972. Peptonized Milk Agar as an Enumeration Mediafor Soil Bacteria. Applied Microbiology 23:1031-1032,
18. Lawrence, C, H. 1956. A Method of Isolating Actinomycetes fromScabby Potato Tissue and Soil with Minimal Contamination. Canadian Journal, of Botany 34:44-47.
19, Lochhead, A, G, 1925, The Bacterial Types Occurring in FrozenSoil. Soil Science 21:225-231.
20. Meiklejohn, J. 1957, Bacteria and Actinomycetes in a Kenya Soil,Journal of Soil Science 8:240-247.
21. Miller, J. H., J. E. Giddens and A. A, Foster, 1957. A Survey ofthe Fungi of Forest and Cultivated Soils of Georgia. Mycologia 49:779-808,
22. Mukerji, K. G. 1966. Ecological Studies on the MicroorganismPopulation of Usar Soils. Mycopathologia et Mycologia Acta 29:339-349.
23. Richardson, M. L. and M. L. Miller. 1974. Report and Interpretations for the General Soil Map, Pima County, Arizona, USDA:Soil Conservation Service.
24. Seifert, J. 1960. The Influence of Moisture and.Temperature onthe.Number of Microorganisms in the Soil, Folia Microbiologica 5:176-180.
25, Seifert, J, 1961. The Influence of Moisture and Temperature onthe Number of Bacteria in the Soil, Folia Microbiologica 6:268-271.
26, Shameemullah, M., D, Parkinson and A. Burges. 1971, The Influenceof Soil Moisture Tension on the Fungal Population of a Pinewood Soil. Canadian Journal of Microbiology 17:975-986.
\

4427. Stokes, J. L. and M. L. Redmond. 1966. Quantitative Ecology of
Psychrophilie Microorganisms. Applied Microbiology 14:74-78.
28. Tresner, H. D., M. P. Backus and J. T. Curtis. 1954. Soil Microfungi in Relation to the Hardwood Forest Continuum in Southern Wisconsin. Mycologia 46:314-333.
29. Van Groenewoud, H. 1961. Variation in pH and Buffering Capacityof the Organic Layer of Grey Wooded Soils. Soil Science 92:100-105.
30. Veldman, D. J. 1967. Fortran Programming for the BehavioralSciences. New York: Holt, Rinehart and Winston.
31. Waksman, S. A. 1916. Bacterial Numbers in Soils, at DifferentDepths, and in Different Seasons of the Year. Soil Science 1:363-380.
32. Waksman, S. A. 1967. The Actinomycetes, A Summary of CurrentKnowledge, New York: Ronald Press.
33. Whittaker, R. H., S. W. Buol, W. A. Niering and Y. H. Havens.1968. A Soil and Vegetation Pattern in the Santa Catalina Mountains, Arizona. Soil Science 105:440-450.
34. Wilkins, W. H. and G. C. M. Harris. 1974. The Ecology of LargerFungi. V. An Investigation into the Influence of Rainfall and Temperature on Seasonal Production of Fungi in a Beech and a Pine Wood. Ann. Appl. Biol, 33:179-188.
35. Witkamp, M. 1966. Macroflora, Mycoflora, and Soil Relationships in a Pine Population. Ecology 47:238-244.
