optimizing the size of an anaerobic digester · ad of manure in a thermophilic or mesophilic...
TRANSCRIPT
The Canadian Society for Bioengineering The Canadian society for engineering in agricultural, food, environmental, and biological systems.
La Société Canadienne de Génie Agroalimentaire et de Bioingénierie La société canadienne de génie agroalimentaire, de la bioingénierie et de l’environnement
Paper No. 06-102
Optimizing the Size of Anaerobic Digesters
Emad Ghafoori Department of Mechanical Engineering, University of Alberta, AB, Canada, T6G2G8
Peter C. Flynn Department of Mechanical Engineering, University of Alberta, AB, Canada, T6G2G8
Written for presentation at the CSBE/SCGAB 2006 Annual Conference
Edmonton Alberta July 16 - 19, 2006
Abstract Anaerobic digestion of manure from confined feeding operations (CFOs) to produce biogas and in turn electric power in farm or feedlot based units as well as centralized plants is evaluated for two settings in Alberta, Canada: a mixed farming area, Red Deer County, and an area of concentrated beef cattle feedlots, Lethbridge County. Centralized plants transport manure to the plant and digestate back to the source CFO, an added cost relative to farm or feedlot based plants, but gain from the economy of scale in plant capital and operating cost. A centralized plant drawing manure from 61 sources in the mixed farming area, at a manure yield of 34 dry tonne year-1 ha-1 could produce 6.5 net MW of power at a cost of $218 MWh-1. No individual CFO in the mixed farming area, including a 7,500 head beef cattle feedlot, can produce power at a lower cost with a farm or feedlot based unit. A centralized plant drawing manure from 560,000 beef cattle in Lethbridge County, at a manure yield of 280 dry tonne year-1 ha-1, can produce power at a cost of $138 MWh-1. In Lethbridge County, An individual feedlot larger than 40,000 head of beef cattle could produce power at a lower cost than the centralized plant. Commercial processes to recover concentrated nutrients and a dischargeable water stream from digestate are not available. However, we analyze the theoretical impact of digestate processing based on a capital cost of 2/3 of the AD plant itself. Digestate processing shifts the balance in favor of centralized processing, and a feedlot would need to be larger than 250,000 head to produce power at a lower cost than a centralized plant. Power from biogas has a high cost relative to current power prices and to the cost of power from other large scale renewable sources. Power from biogas would need to be justified by other factors than energy value alone, such as phosphate, pathogen or odor control.
Papers presented before CSBE/SCGAB meetings are considered the property of the Society. In general, the Society reserves the right of first publication of such papers, in complete form; however, CSBE/SCGAB has no objections to publication, in condensed form, with credit to the Society and the author, in other publications prior to use in Society publications. Permission to publish a paper in full may be requested from the CSBE/SCGAB Secretary, PO Box 23101, RPO McGillivray, Winnipeg MB R3T 5S3 or contact [email protected]. The Society is not responsible for statements or opinions advanced in papers or discussions at its meetings.
Optimizing the Size of Anaerobic Digesters
Emad Ghafoori and Peter C. Flynn
Department of Mechanical Engineering, University of Alberta, AB, Canada, T6G2G8
ABSTRACT
Anaerobic digestion of manure from confined feeding operations (CFOs) to
produce biogas and in turn electric power in farm or feedlot based units as well
as centralized plants is evaluated for two settings in Alberta, Canada: a mixed
farming area, Red Deer County, and an area of concentrated beef cattle feedlots,
Lethbridge County. Centralized plants transport manure to the plant and
digestate back to the source CFO, an added cost relative to farm or feedlot
based plants, but gain from the economy of scale in plant capital and operating
cost. A centralized plant drawing manure from 61 sources in the mixed farming
area, at a manure yield of 34 dry tonne year-1 ha-1 could produce 6.5 net MW of
power at a cost of $218 MWh-1. No individual CFO in the mixed farming area,
including a 7,500 head beef cattle feedlot, can produce power at a lower cost
with a farm or feedlot based unit. A centralized plant drawing manure from
560,000 beef cattle in Lethbridge County, at a manure yield of 280 dry tonne
year-1 ha-1, can produce power at a cost of $138 MWh-1. In Lethbridge County,
2
An individual feedlot larger than 40,000 head of beef cattle could produce power
at a lower cost than the centralized plant. Commercial processes to recover
concentrated nutrients and a dischargeable water stream from digestate are not
available. However, we analyze the theoretical impact of digestate processing
based on a capital cost of 2/3 of the AD plant itself. Digestate processing shifts
the balance in favor of centralized processing, and a feedlot would need to be
larger than 250,000 head to produce power at a lower cost than a centralized
plant. Power from biogas has a high cost relative to current power prices and to
the cost of power from other large scale renewable sources. Power from biogas
would need to be justified by other factors than energy value alone, such as
phosphate, pathogen or odor control.
Keywords: Centralized anaerobic digestion, Biogas plant, Optimum size,
Manure transport, Digestate processing, Power cost
INTRODUCTION
Animal manure from confined feeding operations (CFOs) is typically land spread
as near as possible to the source CFO, to minimize cost (Fleming et al., 1998).
Land spreading of manure has up to four problems with it: the loss of a potential
green energy source (biogas from anaerobic digestion (AD) of manure), the risk
of contamination of ground and surface waters with pathogens such as E. coli,
3
buildup of excess phosphate levels in soil, and odor emissions from land
spreading.
AD of manure in a thermophilic or mesophilic digester yields a medium heating
content biogas that typically ranges 55 to 80% methane, with the balance being
CO2 and traces of other gases (Mathony et al., 1999; Li, 2005). Biogas can be
combusted as is or after cleanup of trace amounts of H2S, for example in an
internal combustion engine to generate electrical power, or can be cleaned to
pipeline grade natural gas through removal of CO2 and other trace gases and
compression (QuestAir Technologies, 2004; Environmental Power Corporation,
2005).
Digestate, the slurry left after AD processing of manure, has low odor and
contains virtually all of the nutrients in the original manure in a dilute liquid. It is
almost pathogen free from properly designed AD plants. Today no commercially
available nutrient recovery scheme exists for digestate processing other than
simple segregation of solids through centrifugation or filtration. Either whole
digestate or the liquid fraction of it is still land spread. If solids are separated,
they typically contain as much as 60% of the phosphate in the manure.
However, they are typically recovered at a moisture level of 70% and thus still
have a low nutrient content, and hence long distance transport of it is not
economic (Moller et al., 2000 and 2002). Hence AD of manure from CFOs has
the potential today to recover energy from manure while reducing both pathogen
4
and odors. Processing of digestate to recover all nutrients or to remove all
phosphate is an area of active research (see, for example, Burns and Moody
(2002), Gungor and Karthikeyan (2005), and Uludag-Demirer et al. (2005)) and if
a commercial technology emerges, AD would also address the problem of
excess phosphate in some soil areas. However, as a source of renewable (non-
fossil) energy AD must compete with other alternatives, such as combustion of
straw/stover and wood, production of ethanol from straw/stover, and non-
biomass options such as wind and solar energy. Hence, the cost of recovering
energy from manure is critical.
AD of manure can be implemented at a variety of scales, from individual farm
based units to large centralized plants. Denmark in particular has focused on
centralized digesters, with transport of manure from the CFO and digestate back
to it. The ultimate responsibility for disposition of the digestate remains with the
source CFO (H-Gregersen, 1999). Scale issues are critical in all biomass
projects and have a critical impact on the cost of produced energy. That cost can
be thought of as having three distinct elements. The first is the harvesting cost of
biomass, e.g. the cost of acquiring the material and bringing the material from the
field to the edge of a road, which are typically independent of scale: a larger plant
requires the acquisition of more feedstock, but the unit cost of the feedstock is
often unchanged as the draw area increases. The second cost element is the
transportation cost of biomass, i.e. the total cost of moving the material from the
field to the processing plant, which has a scale dependency because larger plant
5

sizes require biomass to be moved over longer distances. When biomass is
relatively evenly distributed over an area, e.g. manure in a large area of mixed
farming, the transportation distance increases with the square root of the plant
size, since a doubling of the area from which biomass is drawn increases the
average driving distance by the square root of 2. The third cost element is the
processing cost of biomass, i.e. the cost of turning the biomass into power,
ethanol, heat, or some other useful end-product. Biomass processing is typically
capital intensive and shows the same economies of scale as other processing
plants, such as coal or gas fired power plants or chemical processing plants.
Typically scale factors for processing plants are in the range of 0.6 to 0.8 (Park,
1984), where scale factor relates the unit cost of capital from one size to another,
i.e.
factor scale
size1size21
2
Size
Sizex CostCost ⎟⎟
⎠
⎞⎜⎜⎝
⎛=
In the absence of other constraints, such as a limitation on use of produced
energy or heat, biomass utilization based on transported feedstock has an
optimum size, which arises from competition between two of the three major cost
elements in the overall cost of processing biomass: transportation costs increase
with increasing plant size, while capital and operating costs per unit output
decrease (Overend, 1982; Nguyen and Prince, 1996; Jenkins, 1997; Larson and
6
Marrison, 1997; Dornburg and Faaij, 2001, Kumar et al., 2003). Most biomass
projects have a similar cost pattern as a function of scale: there is a steep rise in
cost at small plant sizes, and a relatively flat profile of cost at large plant sizes,
with an optimum at a given plant size.
The objectives of this study are to develop an economic model of power
production from anaerobic digestion (AD) of manure for two regions of Canada
for which detailed data on manure availability is accessible. The two regions are
the western portion of Red Deer County, Alberta, a mixed farming region with
some urban and industrial development, and an area between Lethbridge and
Calgary, Alberta, that contains many large feedlots associated with finishing beef
cattle. Red Deer County would be typical of many mixed farming agricultural
regions in Canada. The Lethbridge to Calgary corridor that includes six counties
that have a concentration of feedlots is known as “feedlot alley” and it and the
surrounding areas are the highest concentration of animal manure in Canada. At
any point in time there are more than one million beef cattle in feedlots
(CANFAX, 2006). A comparable area in the US is in north Texas and in the
vicinity of Dodge City, KS (Dhuyvetter et al., 1998; Ward and Schroeder, 2004),
where an estimated five million beef cattle are in feedlots.
The model is based on a consistent scope for all cases of anaerobic digestion in
well mixed digesters, with production of electrical power from the biogas. Yields
and costs are based on thermophilic AD, although the choice of thermophilic vs.
7
mesophilic well mixed AD does not create a significant difference. While the
produced energy is electrical power, the results of this study on the impact of
scale on cost can conceptually be extended to the production of pipeline grade
natural gas from AD. The results will help to draw conclusions about the cost of
energy from AD of manure, the impact of scale and manure density (yield of
manure per unit area) on cost, and whether farm or feedlot based plants are
more economic than centralized digesters.
A previous study by Garrison and Richard (2005) evaluated scale issues in
anaerobic digestion in a county in Iowa, USA, using the AgSTAR Farmware v2.0
program available from the United States Environmental Protection Agency (US
EPA, 1997) to develop estimates for 24 scenarios. They calculated minimum
sizes of AD plants that would achieve profitable operation of farm based units
producing electrical power or combined heat and power, for example 5,000 hogs
in a finishing operating, 20,000 in a farrow-to-finishing operation, and 150 to 350
dairy cattle. This study is discussed further below.
MODEL DEVELOPMENT
The model was developed as a spreadsheet with the potential to easily modify
critical parameters. All costs in the model are in 2005 US dollars, and a
conversion rate of $1.2 Canadian to $1 US was used where needed.
8
No cost was assumed for acquiring manure, since an equivalent amount of
nutrient in digestate is returned to the source CFO. The model assumes that the
CFO is responsible for the construction of all equipment at the farm or feedlot to
load solid manure (e.g. a front-end loader in a feedlot), impound liquid manure
(e.g. tanks at a dairy) and to receive liquid whole digestate.
The feedstock supply in this model for Red Deer County is based on a survey of
the different sources of manure by size, type and location within the county
(RDC, 2005), and includes dairies, cow/calf operations, beef cattle feedlots, hog
and poultry operations. Most of the CFOs are located in the western half of the
county, and quantities and locations were identified for every source. The gross
yield of manure in the mixed farming areas, i.e. the manure divided by the total
area from which manure is drawn, is 34 dry tonne year-1 ha-1. 40% of manure is
in the form of liquid and would be shipped in a tanker truck; the remaining 60%
would arrive as a solid with a moisture content of 75%. Red Deer County had
identified 7 major areas that were thought to produce enough feedstock to
potentially support a stand alone typical biogas plant.
Precise confined feeding operation locations were not available for the
Lethbridge to Calgary beef cattle feedlot corridor but cattle numbers are so high
in some counties that reasonable transportation numbers can be approximated
by assuming the feedlots are dispersed evenly across each county and using the
9
center of the county as the average transportation distance for shipment outside
the counties. Transportation costs are hence less precise for feedlot alley than
for Red Deer County, but within the accuracy of the overall study.
Transport of manure and digestate is by truck; for a detailed analysis of manure
transport cost by both truck and pipeline see Ghafoori et al. (2005).
Transportation costs are derived from an analysis of current trucking rates in
Alberta (AAFRD, 2004; Taylor, 2005), and are consistent with literature values for
solid manure but significantly lower for liquid manure (Araji and Stodick, 1990;
Brenneman, 1995; Ribaudo et al., 2003; Aillery et al., 2005). The two critical
parameters for truck transport are the distance fixed cost of trucking (DFC, in $
tonne-1), which is independent of distance traveled and includes the cost of
loading and unloading the truck, and the distance variable cost (DVC, in $ tonne-1
km-1), which is directly dependent on time of travel, which at an constant average
speed (assumed at 80 km hr-1 in this study) is in turn directly dependent on
distance traveled. In this study values of DFC are $5.0 and $3.5 for solid and
liquid manure. DVC is $0.09 for both liquid and solid manure.
For centralized digesters, the power cost includes the DFC and DVC of moving
manure plus digestate. For farm and feedlot based digesters processing solid
manure, the power cost includes the DFC of loading manure, since processing
manure at the farm level would require an incremental truck trip: manure to
digester, and digestate to field, as opposed to a possible single move of manure
10

to field. DVC is zero for a farm based digester because haul distances are
negligible. For farm based digesters processing liquid manure, e.g. hog barns
and some dairy operations, the power cost includes no incremental DFC since
manure is assumed to flow or be pumped to the digester without being loaded on
a truck.
The processing technology is thermophilic anaerobic digestion followed by minor
gas cleanup (moisture control and some sulfur removal in a packed column) and
combustion of the gas. For all cases up to 25 MW the basis of power generation
is an internal combustion engine electrical generation module with a generation
efficiency of 37-43% (Harrison, 2005; GE Energy, 2006); above 25 MW we
assume combined cycle (gas turbine and heat recovery steam generator with a
generation efficiency of 55% (Shilling, 2004). Operating labor is included in the
cost for all centralized AD plants and large feedlot based plants (animals in
excess of 7,500), but is not included in the cost of farm-based units and feedlots
of 7,500 or less; the farmer or feedlot operator is assumed to operate the plant
“for free”. Identical factors are used, however, to calculate capital recovery
charges, based on a 12% pre-tax return on equity, and plant maintenance, based
on 3% of capital cost per year.
Values for the capital cost of AD plants reported in the literature for actual plants
and from studies, as well as data from vendor quotations and budgetary
estimates, show a high degree of scatter (Hashimoto et al., 1979; Mathony et al.,
11
1999; H-Gregersen, 1999; Nielsen and H-Gregersen, 2002; Row and Neable,
2005; Tofani, 2006). All costs were adjusted to 2005 US dollars, and adjusted to
a consistent scope (e.g. data for Danish plants that did not include power
generation was adjusted to include this cost, using data from a European
manufacturer (Harrison, 2005; GE Energy, 2006)). Figure 1 shows the capital
cost data as a function of plant size and lines of best fit to individual data sets.
While the data show a high degree of variance, the value of the scale factor is
consistent between data sets. Based on Fig. 1 a scale factor of 0.6 is used in
this study, a value that is also consistent with chemical process plants and with
prior studies of AD (Hashimoto and Chen, 1981; Park, 1984; Lusk, 1998).
Capital cost estimates include the cost of equipment to connect to an electrical
power grid, but do not include any one time or ongoing administrative charges for
the connection. Note that the highest data in Fig. 1 are from actual plants in
Denmark (H-Gregersen, 1999), and that data from studies and budgetary
estimates are lower than the one consistent set from actual plants. The values in
this study are based on a capital cost of 80% of the best fit curve for Danish plant
data. We deliberately have not included estimates based on the AgSTAR
Farmware model in Fig. 1 because of concerns about the validity and accuracy of
the currently available version of the model (Farmware v3.0 is being released in
2006). The Farmware v2.0 ignores the impact of scale for some components: for
example, the cost for the internal combustion engine and generator is fixed at
$1,050 per kW with heat recovery and $600 per kW without heat recovery
regardless of generator size. In effect this is a scale factor of one, a value in
12

conflict with the cost of actual commercial units (Harrison, 2005; GE Energy,
2006). Mixers, a major cost element, are similarly estimated with a scale factor
of one. In addition, Farmware gives overall estimates that are so significantly
lower than budgetary quotes from vendors and actual Danish costs that we
suspect the validity. For example, a plant producing 11,000 m3 biogas day-1 has
an estimated capital cost of $9.1 M from best fit of Danish data, $7.7 M and $5.7
M from two recent budgetary quotes to Red Deer County, and $3.1 M from
Farmware program. Resolution of discrepancies between the AgSTAR model
and other estimates of AD capital costs is an opportunity for future study.
[Figure 1 here]
Fig. 1. The estimated cost of biogas plants generating electric power
( Hashimoto et al. (1979); Mathony et al. (1999); H-Gregersen (1999);
Nielsen and H-Gregersen (2002); Row and Neable (2005); Tofani (2006))
The model is designed to allow for revenue from the sale of power, heat, by-
product fertilizer, subsidies, and carbon credits. In this study we exclude revenue
from heat, since there are few sinks in rural settings in North America for low
quality waste heat, and for fertilizer, since no payment is assumed to the source
CFO and presumably this would only be the case if the manure nutrient value
was returned. Revenue from the sale of carbon credits is not included in this
study; for an analysis, see Ghafoori et al. (2006a and 2006b).
13

RESULTS
Red Deer County: Mixed Farming Region
61 manure sources were identified for the western half of Red Deer County. Two
sets of cases were developed to process all of this manure: centralized digesters
(ranging from seven to one) and a digester at each farm or feedlot. The location
of each centralized digester was based on minimizing the aggregate
transportation cost. Nine different scenarios for centralized digesters were
evaluated, one with seven digesters, two with six, one with five, one with four,
one with three, one with two, and one with just one centralized digester. In each
case the total gross power production was 8.1 MW gross, and 6.5 MW net after a
parasitic (inside the AD plant) power consumption of 20%. The nine scenarios
involved 14 different AD plant sizes.
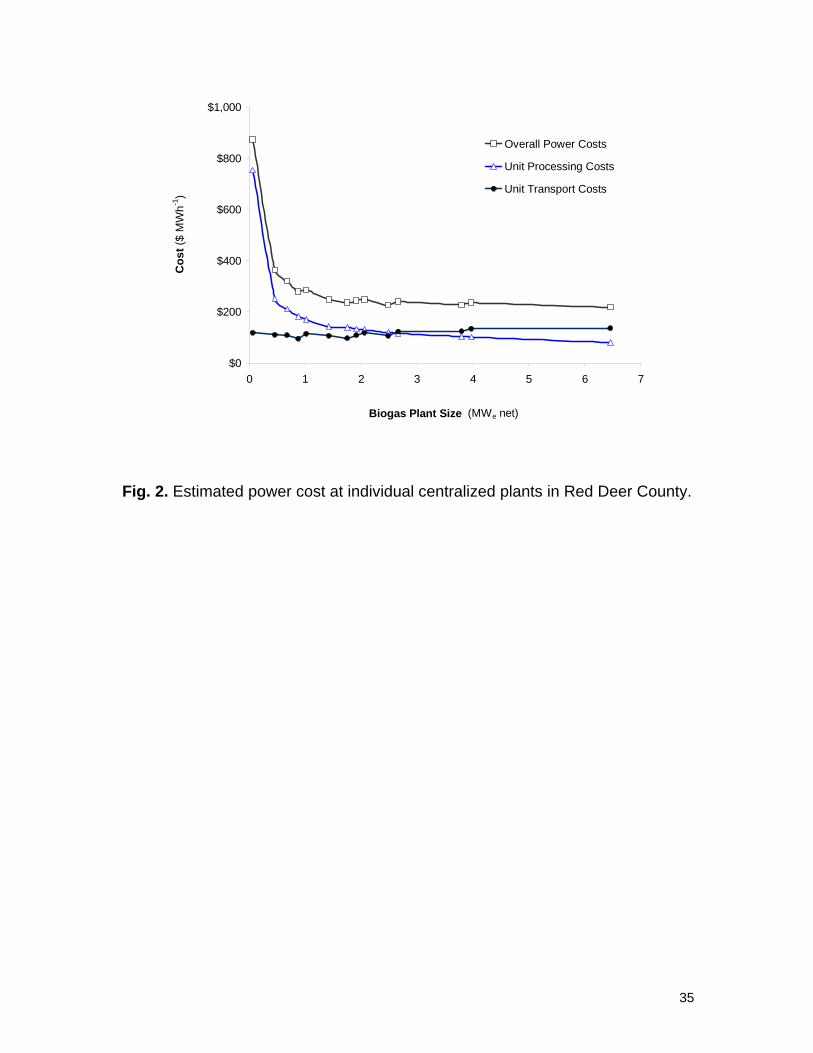
Figure 2 shows the cost of power as a function of plant size for the 14 different
plants that were used in the various scenarios. Overall power cost as a function
of size shows the pattern typical of all biomass plants processing externally
sourced feedstock: a very high increase in output cost at small capacities. The
inflections in the unit transport costs reflect the precision of location of CFOs in
Red Deer County. For each plant a precise transportation cost is calculated
14

based on actual distances from CFO’s to proposed centralized digester locations.
The minor inflections in unit processing cost reflect increasing efficiency of power
generation as the generator size increases; for an internal combustion powered
generator it increases from 37% to 43% (Harrison, 2005; GE Energy, 2006).
[Figure 2 here]
Fig. 2. Estimated power cost at individual centralized plants in Red Deer County.
It is evident that at 6.5 MW of net output, at which all identified manure sources
are being processed in a single centralized digester, the optimum size has still
not been reached. Manure could be drawn from outside the county with an
expected further drop in the overall cost of power. However, the incremental
reduction in power cost from incremental manure is low, i.e. the curve of overall
power cost vs. size becomes quite flat above 4 MW. Manure and digestate
transport cost is 30 to 60% of total power cost, with digestate transportation
being the larger component because of the increase in volume of digestate vs.
solid manure, about 2.5 times. It is also evident that the distance fixed cost of
loading and unloading manure is high compared to the distance variable cost of
actually trucking the manure over roads. More time is spent in loading manure
and digestate than in transporting it to or from the digester. It is evident from Fig.
2 that if a commercial process were available to recover all nutrients from
digestate as solid fertilizer, leaving a water stream that could be discharged to a
15
watercourse, then significant savings, on the order of $60 per MWh, could be
realized in power cost. Digestate processing can be expected to have a
comparable economy of scale, 0.6, to anaerobic digestion of manure and other
chemical processing (Park, 1984).
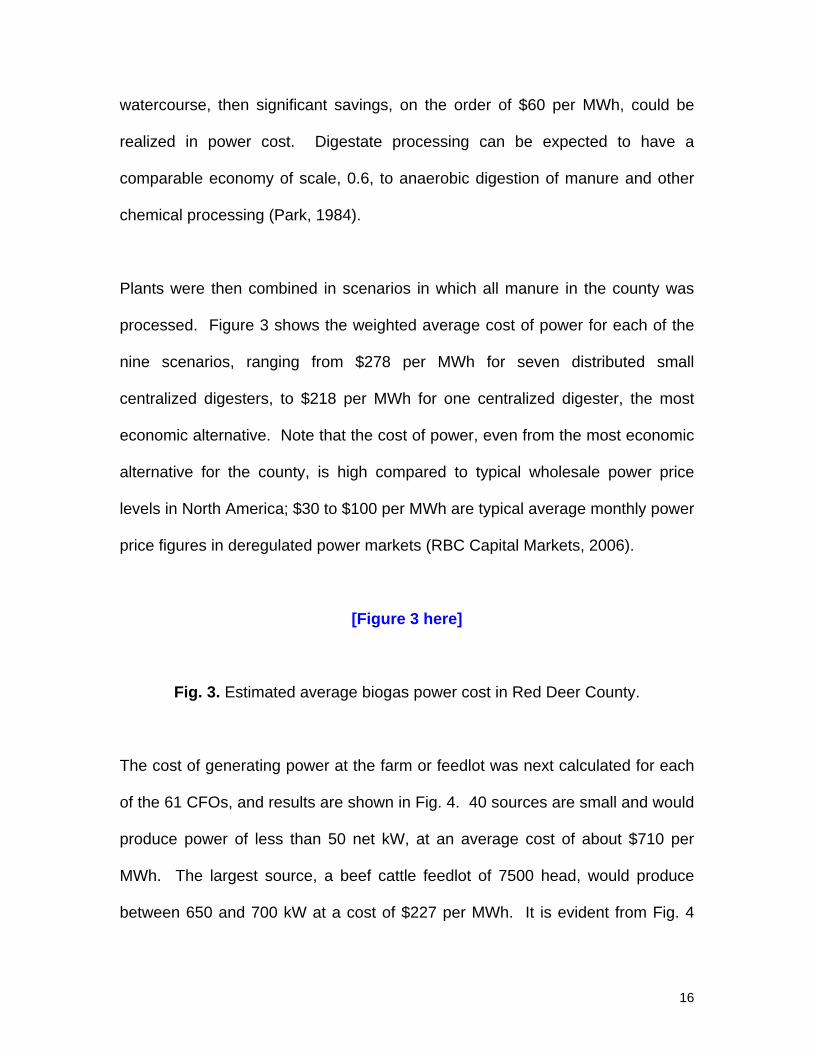
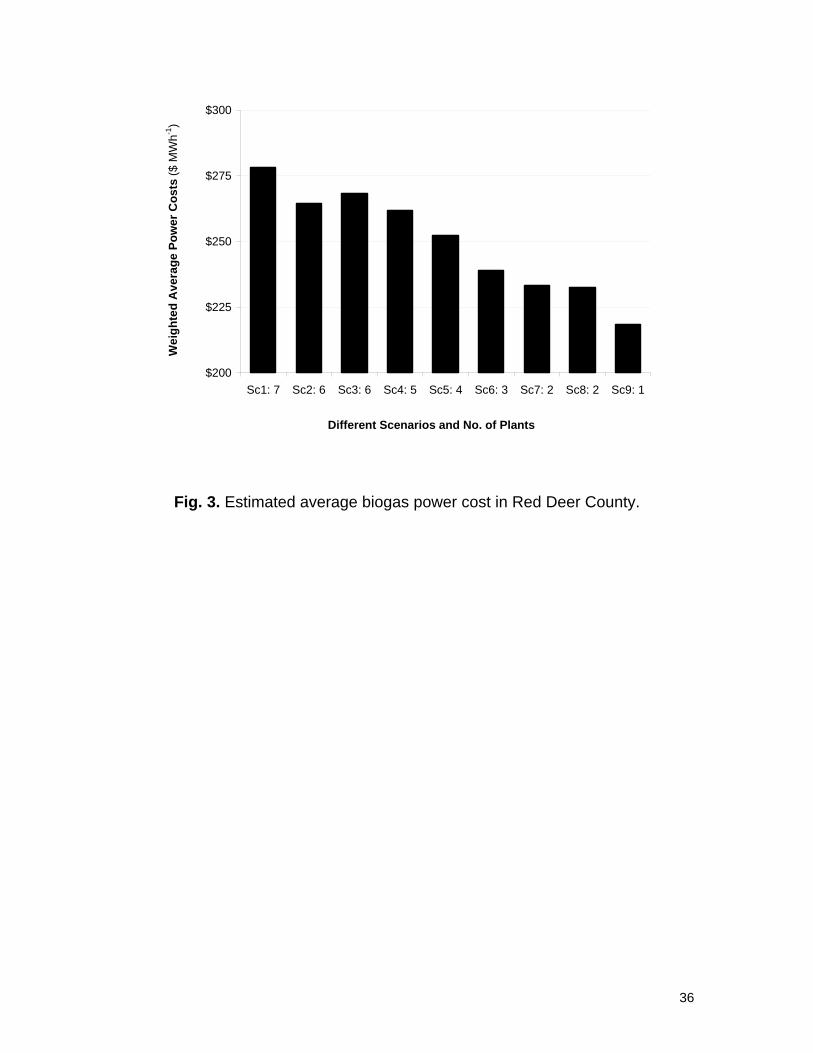
Plants were then combined in scenarios in which all manure in the county was
processed. Figure 3 shows the weighted average cost of power for each of the
nine scenarios, ranging from $278 per MWh for seven distributed small
centralized digesters, to $218 per MWh for one centralized digester, the most
economic alternative. Note that the cost of power, even from the most economic
alternative for the county, is high compared to typical wholesale power price
levels in North America; $30 to $100 per MWh are typical average monthly power
price figures in deregulated power markets (RBC Capital Markets, 2006).
[Figure 3 here]
Fig. 3. Estimated average biogas power cost in Red Deer County.
The cost of generating power at the farm or feedlot was next calculated for each
of the 61 CFOs, and results are shown in Fig. 4. 40 sources are small and would
produce power of less than 50 net kW, at an average cost of about $710 per
MWh. The largest source, a beef cattle feedlot of 7500 head, would produce
between 650 and 700 kW at a cost of $227 per MWh. It is evident from Fig. 4
16

that no CFO in Red Deer County can produce power from AD of manure at a
lower cost than a single centralized plant.
[Figure 4 here]
Fig. 4. Farm-based power cost as a function of capacity vs. centralized
processing in Red Deer County (number of manure sources at each capacity is
identified at the top of bar charts).
Centralized digestion has three advantages in addition to the cost factors
included in this model. First, it would centralize a large quantity of digestate and
enable the future processing of this digestate as technology emerges to do so.
This kind of processing would be chemical and physical processing and would
likely only be economic at a larger scale, i.e. it would not be economic to apply in
small farm based units. A second advantage of centralized digestion is that it
gives the option of producing pipeline quality gas as an alternative to power
(QuestAir Technologies, 2004; Environmental Power Corporation, 2005).
Producing pipeline quality gas would require gas cleaning (removal of CO2 and
H2S), an easy chemical process. It would also require compression, a step that
also has a significant economy of scale. A third advantage of centralized
digestion is that it enables the option, if combined with CO2 removal, of
sequestering the CO2, for example in a depleted natural gas formation. The use
of a renewable energy source such as manure gives a single carbon credit for
17

displacing fossil fuel; sequestration of carbon from a renewable energy source
would give a second carbon credit for a net removal of carbon from the
atmosphere. Again, the steps involved in sequestration, including compression
and pipelining of the gas, would likely be economic at larger scale.
“Feedlot Alley”: Concentrated Feedlots Area
Data for the Lethbridge to Calgary corridor is available on a county wide basis,
although the size and location of some individual feedlots are known to the
authors. Of the more than one million beef cattle in feedlots in the corridor, about
560,000 are in Lethbridge County itself (CANFAX, 2006). Lethbridge County has
an area approximately the same as the western half of Red Deer County but with
much higher manure gross yield (280 dry tonne year-1 ha-1). Various
combinations of centralized AD plants were analyzed, ranging from 60,000 head,
from the county with the least amount of beef cattle, to 1,130,000 head, all of the
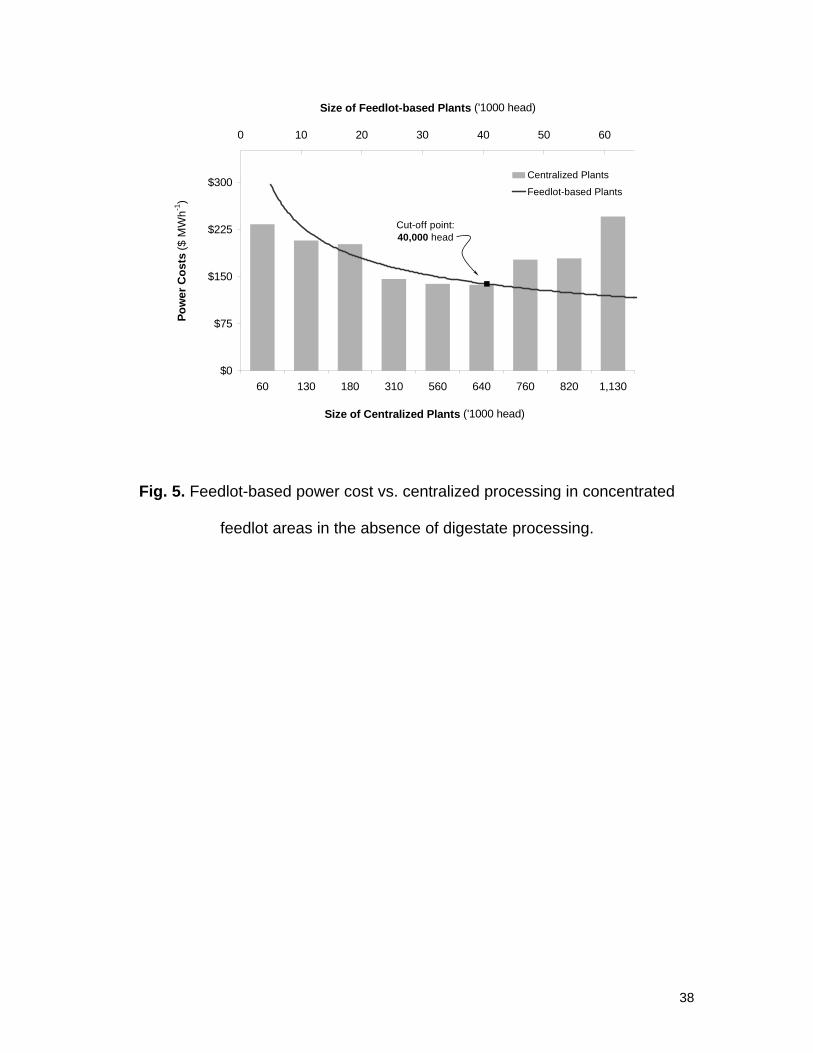
beef cattle in the corridor. These, the bars in Fig. 5 (lower axis) are compared to
the cost of a plant operated at a feedlot level (upper axis).
[Figure 5 here]
Fig. 5. Feedlot-based power cost vs. centralized processing in concentrated
feedlot areas in the absence of digestate processing.
18
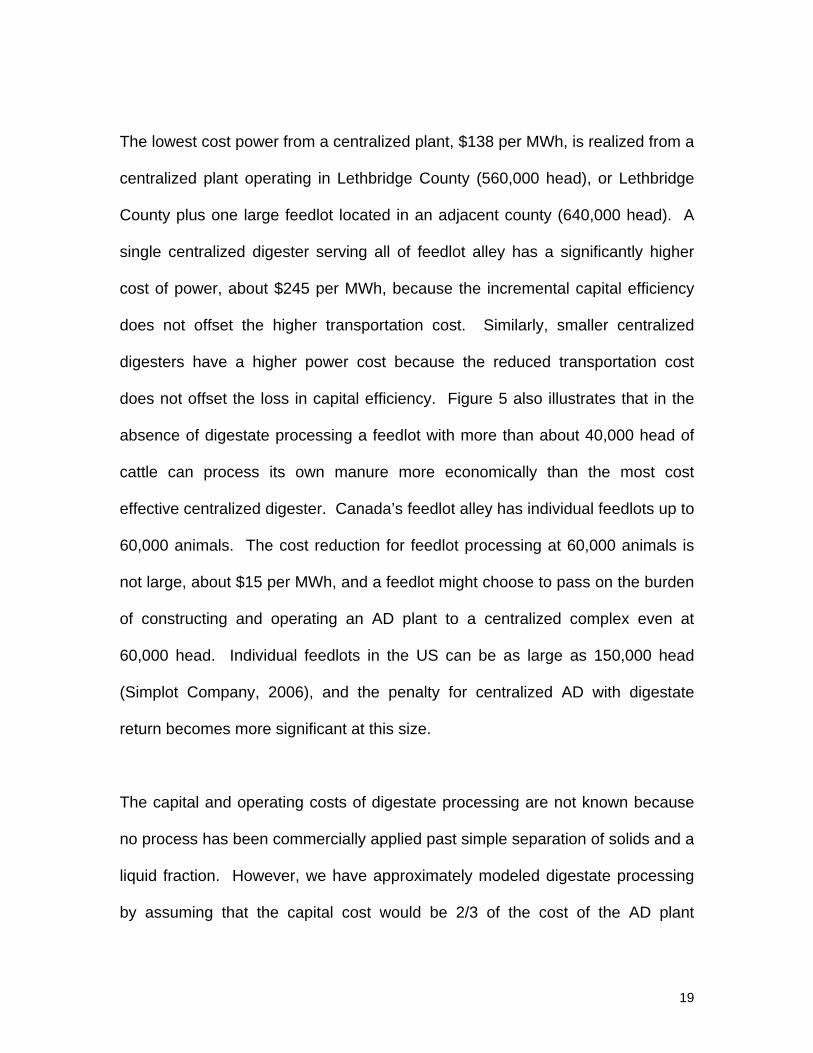
The lowest cost power from a centralized plant, $138 per MWh, is realized from a
centralized plant operating in Lethbridge County (560,000 head), or Lethbridge
County plus one large feedlot located in an adjacent county (640,000 head). A
single centralized digester serving all of feedlot alley has a significantly higher
cost of power, about $245 per MWh, because the incremental capital efficiency
does not offset the higher transportation cost. Similarly, smaller centralized
digesters have a higher power cost because the reduced transportation cost
does not offset the loss in capital efficiency. Figure 5 also illustrates that in the
absence of digestate processing a feedlot with more than about 40,000 head of
cattle can process its own manure more economically than the most cost
effective centralized digester. Canada’s feedlot alley has individual feedlots up to
60,000 animals. The cost reduction for feedlot processing at 60,000 animals is
not large, about $15 per MWh, and a feedlot might choose to pass on the burden
of constructing and operating an AD plant to a centralized complex even at
60,000 head. Individual feedlots in the US can be as large as 150,000 head
(Simplot Company, 2006), and the penalty for centralized AD with digestate
return becomes more significant at this size.
The capital and operating costs of digestate processing are not known because
no process has been commercially applied past simple separation of solids and a
liquid fraction. However, we have approximately modeled digestate processing
by assuming that the capital cost would be 2/3 of the cost of the AD plant
19

excluding power generation (Li, 2005). We further assume that the products of
digestate processing are dischargeable water and solid or highly concentrated
liquid ammonia fertilizers with a negligible cost of transport relative to digestate.
Note that if the basis of digestate processing is reverse osmosis a concentrated
stream of potassium rich water would still require land spreading or mixing in
irrigation water; this stream would be low in volume compared to the full
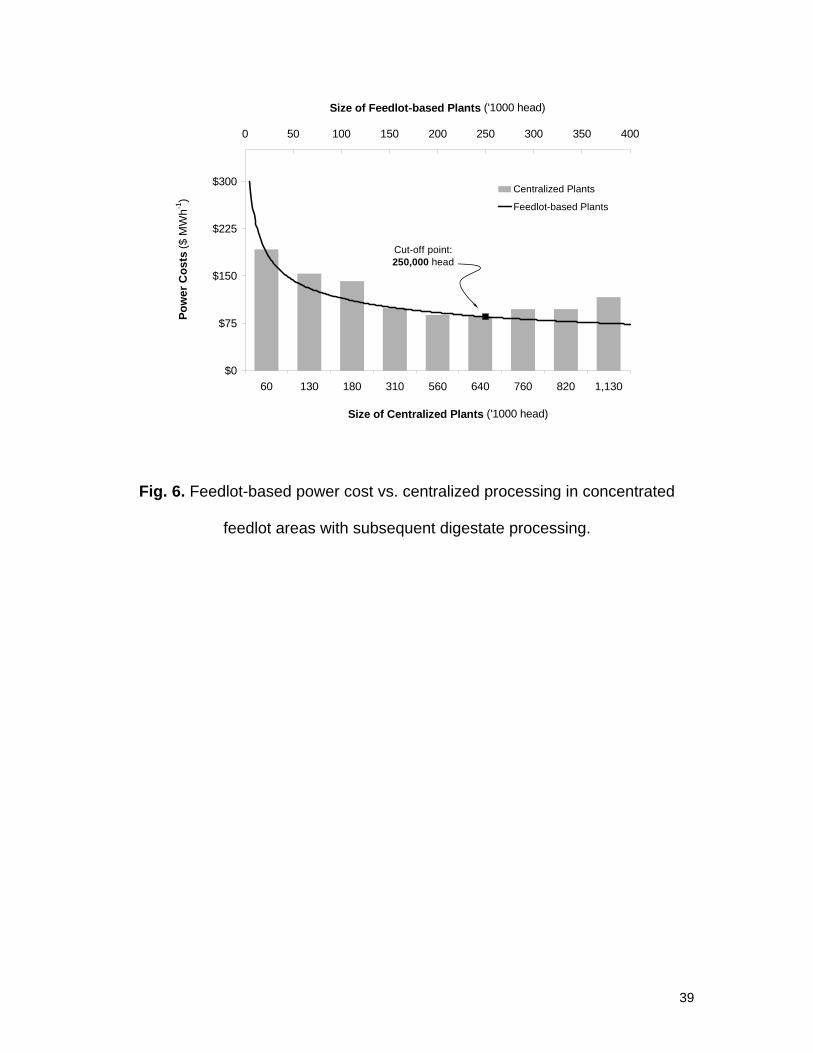
digestate stream. Figure 6 shows the impact of these assumptions. Digestate
processing increases the capital cost and decreases the transportation cost
because digestate is not returned to the source CFO.
[Figure 6 here]
Fig. 6. Feedlot-based power cost vs. centralized processing in concentrated
feedlot areas with subsequent digestate processing.
From Fig. 6 it is clear that the transportation saving is higher than the capital
recovery cost, and power cost for the most cost effective centralized plant drops
to $86 per MWh. Further the increased capital intensity means that an individual
feedlot can not produce power for less than a centralized plant until it exceeds
250,000 head. We know of no single feedlot of this size in North America, and
hence if digestate processing has the cost assumed in this study then centralized
AD plants will be the most economic choice in areas of intense feedlot CFOs.
We note that the assumptions on digestate processing are very preliminary, and
20
the model does not provide for the purchase of manure from the source CFO or
the sale of concentrated fertilizers. This level of detail is not warranted until a
better definition of the technology and capital and operating cost of digestate
processing is defined. The key observation is that digestate processing will
significantly reduce the cost of the production of biogas from manure, and will
favor large centralized AD plants.
DISCUSSION
Anaerobic digestion of animal manure does not make low cost power. In a mixed
farming area, the cost of power from biogas from AD of manure is over $200 per
MWh, which is very high compared to average current power prices in North
America. Even in an area of concentrated feedlots giving a very high density of
manure per hectare the cost of power is over $130 per MWh. This is high not
only in relation to current power prices, but also relative to alternative sources of
power from biomass. For example, Kumar et al. (2003) estimated a cost of $60
to $70 per MWh for large scale straw fired power plants in western Canada. In
addition, this research clearly shows that farm and small feedlot based AD
treatment of manure is uneconomic compared to centralized processing.
There are several implications for AD processing of manure. First, AD of manure
will be hard to justify solely as a renewable energy project, because there are
21
abundant biomass resources for less expensive alternatives. Hence, the
incentive for AD processing of manure needs to be broadened to include one of
the other problems with land spreading of manure: pathogen control, odor
control, and phosphate control. Combining the production of biogas with the one
or more of these three issues may create sufficient justification for AD of manure.
At a commercial scale, digestate processing today is limited to simple
segregation of solids. This captures more than half of the phosphate in the
digestate, but the remaining liquid fraction of digestate is a low-concentration
slurry that still must be land spread. Phosphate control would be far more
effective with total recovery of phosphate from digestate, e.g. through
precipitation of residual phosphate from the liquid fraction of digestate. Ideally,
processing of digestate would also recover nitrogen and potassium in
concentrated form, allowing the water to be discharged from the AD plant. This
degree of digestate processing would significantly reduce the cost of AD
treatment of manure. In the two most economic cases in this study, the
centralized plants in Red Deer and Lethbridge counties, the cost of digestate
return is 25% and 40% of the total cost of power, respectively.
Digestate processing to produce solid fertilizers would require changes in
modeling the cost of either power or pipeline grade natural gas from AD of
manure, because the CFO that is the source of the manure might want a
payment for the manure if the concentrated fertilizers from the AD plant were
22
marketed rather than being returned to the source CFO. Manure is rich in
phosphate, and marketing the phosphate component of recovered nutrients to
areas deficient in phosphate would be a key part of addressing the problem of
excess phosphate levels in soils.
Data on the capital cost of centralized AD plants is limited; the best source of
data is from a number of plants in Denmark (H-Gregersen, 1999). In this study
we made two assumptions, to minimize the potential for bias against farm or
small-feedlot based plants: capital cost of AD plants is 80% of the best fit of the
Danish plant data, and no operating labor cost is incurred for farm or feedlot
based units up to the equivalent of 7500 beef cattle. The assumption on
operating labor is questionable for all but small CFOs: operation of an AD plant
processing the manure from 7500 beef cattle, or even half that number, with no
net operating labor cost is an aggressive assumption. Despite the reservations
discussed above regarding AgSTAR Farmware, we note that the study of
Garrison and Richard (2005) reaches a similar conceptual conclusion to this
study: the economic feasibility varies significantly with scale, and AD plants
become less economic with reduced throughput.
Pipeline grade natural gas can be produced from biogas by removing H2S and
CO2 and compressing the gas; at least one plant is proposed in the United States
(Environmental Power Corp, 2005). Gas cleanup and compression both have an
economy of scale, and the general conclusion of this work, that AD of manure at
23
the size of a farm or small feedlot is less economic than centralized processing,
is not likely to be changed by the choice of pipeline grade natural gas as the end
product instead of power.
CONCLUSIONS
Key conclusions from this study are:
- In the western half of Red Deer County, a mixed farming area generating 34
dry tonnes year-1 ha-1, a 6.5 MW net power plant processing all manure has
a lower cost of power production, $218 MWh-1 than any farm or feedlot
based plant. The cost of transporting manure to the AD plant and digestate
back to the source CFO is less than offset by the economy of scale realized
in capital and operating costs.
- In Lethbridge County, which has 560,000 head of beef cattle in feedlots and
produces 280 dry tonne year-1 ha-1 of manure, feedlots greater than 40,000
head could produce power at a lower cost than a centralized plant
processing all of the manure in the county, $138 MWh-1.
- Digestate processing to produce concentrated fertilizers and a
dischargeable water stream is not commercially available today. However,
24

based on a preliminary estimate of the capital cost of digestate processing
of 2/3 the cost of the AD power plant, digestate processing would reduce
the cost of power in Lethbridge County to $86 MWh-1, and centralized
processing would be more cost effective than processing at the feedlot up to
a size of 250,000 head of beef cattle.
- The cost of power from manure is high compared to current North
American power prices, and compared to the cost of power from other
biomass sources such as straw. It is difficult to justify power from manure
on an energy basis alone; further justification might come from one or more
of phosphate, pathogen or odor control.
ACKNOWLEDGEMENTS
The authors gratefully acknowledge financial support from the Alberta Energy
Research Institute (AERI), the Alberta Agricultural Research Institute (AARI), and
the Biocap Foundation, which have supported this research by grants, and from
the Poole Family and Canada’s Natural Sciences and Engineering Research
Council (NSERC).
25
REFERENCES
AAFRD (Alberta Agriculture, Food and Rural Development). 2004. Custom rates
survey. Statistics and Data Development Unit, Alberta, Canada
Aillery M, Gollehon N, and Breneman V. 2005. Technical documentation of the
regional manure management model for the Chesapeake Bay watershed.
Economic Research Service, USDA, Technical Bulletin Number 1913.
Araji AA and Stodick LD. 1990. The economic potential of feedlot wastes
utilization in agricultural production. Biological Wastes 32: 111-124.
Brenneman G. 1995. You can’t afford not to haul manure. Iowa State University
Extension office. Pm-1609.
Burns RT and Moody LB. 2002. Phosphorus Recovery from Animal Manures
using Optimized Struvite Precipitation. Proceedings of Coagulants and
Flocculants: Global Market and Technical Opportunities for Water Treatment
Chemicals, Chicago, Illinois. May 22-24, 2002.
CANFAX. 2006. Cattle on Feed. Alberta and Saskatchewan Feedlot Capacity by
Region. http://www.canfax.ca/default.htm (Accessed January 2006).
26
Dhuyvetter KC, Graff J, Kuhl GL. 1998. Kansas Beef Industry Economic Trends.
Kansas State University Agricultural Experiment Station and Cooperative
Extension Service. Report MF-1057.
Dornburg V and Faaij APC. 2001. Efficiency and economy of wood-fired biomass
energy systems in relation to scale regarding heat and power generation using
combustion and gasification technologies. Biomass and Bioenergy 21(2):91–108.
Environmental Power Corporation (2005) News Release:
http://ir.environmentalpower.com/ReleaseDetail.cfm?ReleaseID=172199
(Accessed February 2006).
Fleming RA, Babcock BA, and Wang E. 1998. Resource or waste? The
economics of swine manure storage and management. Review of Agricultural
Economics 20(1):96-113.
Garrison MV and Richard TL. 2005. Methane and manure: feasibility analysis of
price and policy alternatives. Transactions of the ASAE 48(3):1287-1294.
GE Energy. 2006. GE Jenbacher Gas Engines.
http://www.gepower.com/prod_serv/products/recip_engines/en/index.htm
(Accessed March 2006).
27
Ghafoori E, Flynn PC, Feddes JJ. 2005. Pipeline vs. Truck Transport of Beef
Cattle Manure. Proceedings of the 2005 ASAE Annual Meeting, Tampa FL, July
17-20.
Ghafoori E, Flynn PC, Checkel MD. 2006a. Global Warming Impact of Electricity
Generation from Beef Cattle Manure: a Life Cycle Assessment Study.
International Journal of Green Energy, 3:1-14.
Ghafoori E, Flynn PC, Checkel MD. 2006b. Carbon Credits Required to Make
Manure Biogas Plants Economic. Proceedings of the 2nd International Green
Energy Conference, 25-29 June 2006, Oshawa, ON, Canada.
Gungor K, Karthikeyan KG. 2005. Influence of anaerobic digestion on dairy
manure phosphorus extractability. Transactions of the ASAE 48 (4): 1497-1507.
Harrison G. 2005. Personal communication. GE Jenbacher; Waterous Power
Systems. (Contacted May 2004).
Hashimoto AG and YR Chen. 1981. Economic Optimization of Anaerobic
Fermenter Designs for Beef Cattle Production Units. Livestock Wastes: A
Renewable Resource. R.J. Smith, Ed. ASAE Publication No. 2-81. ASAE, St.
Joseph, MI 49085.
28
Hashimoto AG, Chen YR, Prior RL. 1979. Methane and protein production from
animal feedlot wastes. Journal of Soil and Water Conservation 34 (1): 16-19.
H-Gregersen K. 1999. Centralized biogas plants - Integrated energy production,
waste treatment and nutrient redistribution facilities. Danish Institute of
Agricultural and Fisheries Economics.
Jenkins BM. 1997. A comment on the optimal sizing of a biomass utilization
facility under constant and variable cost scaling. Biomass and Bioenergy
13(1/2):1-9.
Kumar A, Cameron JB, and Flynn PC. 2003. Biomass power cost and optimum
plant size in western Canada. Biomass and Bioenergy 24(6): 445-464.
Larson ED and Marrison CI. 1997. Economic scales for first-generation biomass-
gasifier/gas turbine combined cycles fueled from energy plantations. Journal of
Engineering for Gas Turbines and Power 119:285–90.
Li X. 2005. Personal communication. Environmental Technologies, Alberta
Research Council Inc (Contacted January 2006).
29

Lusk P. 1998. Methane Recovery from Animal Manures: The Current
Opportunities Casebook, National Renewable Energy Laboratory, NREL/SR-580-
25145.
Mathony T, O’Flaherty V, Colleran E, and others. 1999. Feasibility Study for
Centralized Anaerobic Digestion for Treatment of Various Wastes and
Wastewaters in Sensitive Catchment Areas. Environmental Protection Agency.
Ireland.
Møller HB, Lund I, Sommer SG. 2000. Solid-liquid separation of livestock slurry:
efficiency and cost. Bioresource Technology 74:223-229.
Møller HB, Sommer SG, Ahring BK. 2002. Separation efficiency and particle size
distribution in relation to manure type and storage conditions. Bioresource
Technology 85:189-196.
Nguyen MH and Prince RGH. 1996. A simple rule for bioenergy conversion plant
size optimization: bioethanol from sugar cane and sweet sorghum. Biomass and
Bioenergy 10(5/6):361–5.
Nielsen LH and H-Gregersen K. 2002. Socio-economic Analysis of Centralized
Biogas Plants, Danish Research Institute of Food Economics. Report no. 150.
ISSN 0106-1291.
30

Overend RP. 1982. The average haul distance and transportation work factors
for biomass delivered to a central plant. Biomass 2:75–9.
Park WR. 1984. Cost engineering analysis: a guide to economic evaluation of
engineering projects, New York Wiley
QuestAir Technologies. 2004. http://questairinc.com/applications/biogas.htm
(Accessed February 2006).
RBC (Royal Bank of Canada) Capital Markets. 2006. Power and pipelines weekly
review. June 22, 2006.
RDC (Red Deer County) Office. 2005. Red Deer County Biomass Survey.
Unpublished Report.
Ribaudo M, Gollehon N, Aillery M, Kaplan J, Johansson R, and others. 2003.
Manure management for water quality: costs to animal feeding operations of
applying manure nutrients to land. U.S. Department of Agriculture, Economic
Research Service, Resource Economics Division. Agricultural Economic Report
824.
31
Row J and Neabel D. 2005. Integrated Manure Utilization System Life Cycle
Value Assessment. Unpublished Report by the Pembina Institute, Calgary, AB.
Shilling N. 2004. Personal communication, General Electric Corporation.
(Contacted June 2004).
Simplot Company. 2006. Feedlots.
http://www.simplot.com/land/cattle_feeding/feedlots.cfm (Accessed June 2006).
Taylor J. 2005. Personal communication. Gibson Energy Ltd. (Contacted Nov.
2005).
Tofani R. 2006. Innogy Consulting Limited. Personal Communication (Contacted
January 2006).
Uludag-Demirer S, Demirer GN, Chen S. 2005. Ammonia removal from
anaerobically digested dairy manure by struvite precipitation. Process
Biochemistry 40(12):3667-3674.
US EPA. 1997. AgSTAR Handbook: A manual for developing biogas systems at
commercial farms in the United States. K.F. Roos and M.A. Moser, eds. EPA
430-B97-015. Washington, D.C.
32

Ward CE and Schroeder TC. 2004. Structural Changes in Cattle Feeding and
Meat Packing. Oklahoma Cooperative Extension Fact Sheets. Oklahoma State
University. F-553.
33

y = 147,870 x0.60
y = 360,280 x0.56y = 323,862 x0.56
$0
$4,000
$8,000
$12,000
$16,000
0 200 400 600 800 1,000 1,200 1,400 1,600
Biomass Input (m3 day-1)
Cap
ital C
osts
('$1
000)
Fig. 1. The estimated cost of biogas plants generating electric power
( Hashimoto et al. (1979); Mathony et al. (1999); H-Gregersen (1999);
Nielsen and H-Gregersen (2002); Row and Neable (2005); Tofani (2006))
34
$0
$200
$400
$600
$800
$1,000
0 1 2 3 4 5 6 7
Biogas Plant Size (MWe net)
Cos
t ($
MW
h-1)
Overall Power Costs
Unit Processing Costs
Unit Transport Costs
Fig. 2. Estimated power cost at individual centralized plants in Red Deer County.
35
$200
$225
$250
$275
$300
Sc1: 7 Sc2: 6 Sc3: 6 Sc4: 5 Sc5: 4 Sc6: 3 Sc7: 2 Sc8: 2 Sc9: 1
Different Scenarios and No. of Plants
Wei
ghte
d A
vera
ge P
ower
Cos
ts ($
MW
h-1)
Fig. 3. Estimated average biogas power cost in Red Deer County.
36

1111121
2
4
7
40
$218
$0
$200
$400
$600
$800
50 100 150 200 250 300 350 400 450 500 550 600 650 700
Size of Manure Source in Equivalent Power Potential (kWe)
Pow
er C
osts
($ M
Wh-1
)
Farm-based Power CostCentralized Power Cost
Fig. 4. Farm-based power cost as a function of capacity vs. centralized
processing in Red Deer County (number of manure sources at each capacity is
identified at the top of bar charts).
37
$0
$75
$150
$225
$300
60 130 180 310 560 640 760 820 1,130
Size of Centralized Plants ('1000 head)
Pow
er C
osts
($ M
Wh-1
)
0 10 20 30 40 50 60
Size of Feedlot-based Plants ('1000 head)
Centralized Plants
Feedlot-based Plants
Cut-off point: 40,000 head
Fig. 5. Feedlot-based power cost vs. centralized processing in concentrated
feedlot areas in the absence of digestate processing.
38
$0
$75
$150
$225
$300
60 130 180 310 560 640 760 820 1,130
Size of Centralized Plants ('1000 head)
Pow
er C
osts
($ M
Wh-1
)
0 50 100 150 200 250 300 350 400
Size of Feedlot-based Plants ('1000 head)
Centralized Plants
Feedlot-based Plants
Cut-off point: 250,000 head
Fig. 6. Feedlot-based power cost vs. centralized processing in concentrated
feedlot areas with subsequent digestate processing.
39