mechanistic models to simulate dose response of ige ... · mechanistic models to simulate dose...
TRANSCRIPT

© Tripos, L.P. 2010 All Rights Reserved
Mechanistic Models to Simulate Dose Response of IgE Suppression Following Dosing of Anti-IgE Monoclonal Antibodies
Pascal Chanu1, Balaji Agoram2, René Bruno1
(1) Pharsight, a CertaraTM company; (2) Pfizer, Clinical PharmacologyPAGE – June 9, 2010 - Berlin

Omalizumab (XolairTM) is a recombinant humanized anti-IgE antibody
Omalizumab inhibits the activity of IgE
Omalizumab is approved in the treatment of moderate to severe persistent asthma for adults and adolescents (≥12 y)
Slide 2© Tripos, L.P. 2010 All Rights Reserved
Xolair FDA PADAC, May 2003, Figure 1

Key questions and objective
Key questions
• Is there a potential to develop a new anti-IgE antibody with enhanced affinity to treat the Omalizumab non-treatable population?
• What is the minimum effective dose in the most “difficult to treat” portion of the population?
Objective: Simulate dose response of IgE suppression for anti-IgE Objective: Simulate dose response of IgE suppression for anti-IgE monoclonal antibodies such as Omalizumab versus higher affinity antibodies
Slide 3© Tripos, L.P. 2010 All Rights Reserved

Available information: existing models
Two published instantaneous equilibrium drug-IgE binding models for Omalizumab: Hayashi et al., Br J Clin Pharmacol, 2007 and Lowe et al., Br J Clin Pharmacol, 2009
Slide 4© Tripos, L.P. 2010 All Rights Reserved
Lowe et al., 2009

Available information: clinical information
Clinical data on another 2nd generation anti-IgE monoclonal antibody HAE1 showed that with an enhanced affinity, the expected fold reduction in dose is limited to roughly 2-fold (Putnam et al., AAPS J, 2008)
The dosing rationale for Omalizumab is based on a target average free IgE level of 25 ng/mL which should ensure that 95% of patients achieve free IgE level <50 ng/mL (Xolair FDA PADAC, May 2003)
Slide 5© Tripos, L.P. 2010 All Rights Reserved
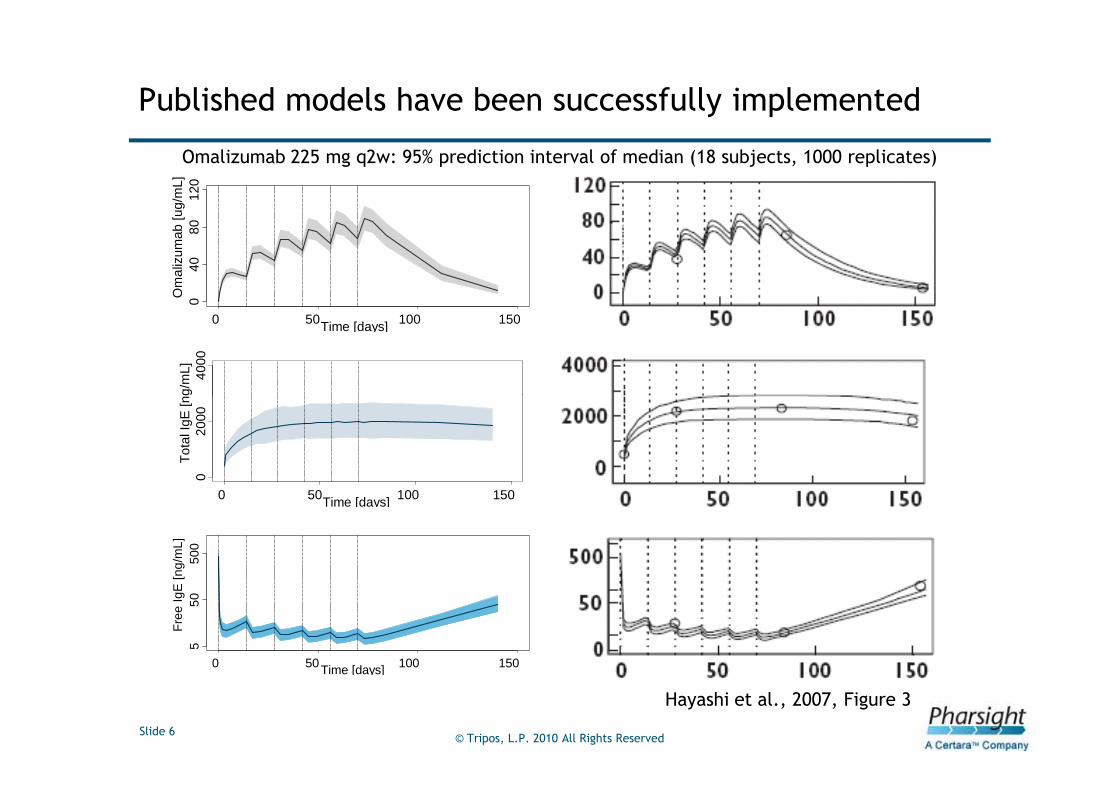
Published models have been successfully implemented
Omalizumab 225 mg q2w: 95% prediction interval of median (18 subjects, 1000 replicates)
040
8012
0
0 50 100 150Time [days]
Om
aliz
umab
[ug/
mL]
4000
Tot
al Ig
E [n
g/m
L]
Slide 6© Tripos, L.P. 2010 All Rights Reserved
Hayashi et al., 2007, Figure 3
020
00
0 50 100 150Time [days]
Tot
al Ig
E [n
g/m
L]5
5050
0
0 50 100 150Time [days]
Fre
e Ig
E [n
g/m
L]

Model based simulations according to the EU licensed table (Lowe et al.)
Slide 7© Tripos, L.P. 2010 All Rights Reserved
q2w regimens up to 750 mg over 4 weeks: 375 mg q2w
q4w regimens Non treatable

Model based simulations based on Lowe et al. tend to confirm the EU licensed table and the Omalizumab dosing rationale
EU Table: percentage of patients achieving target free IgE<50 ng/mLbased on a pre dose steady state free IgE level (week 29)
Body weight
Baseline IgE (ng/mL) >30-40 >40-50 >50-60 >60-70 >70-80 >80-90 >90-125 >125-150
72.6-242 q4w 93.5 98.2
>242-484 94.3
>484-726 93.4 98.5 97.9
>726-968 97.9 96.3
>968-1210 q2w 97.7
Slide 8© Tripos, L.P. 2010 All Rights Reserved
>968-1210 q2w 97.7
>1210-1450 97.1 95.6
>1450-1690 97.8 83.5
>1690-1940 97.5
>1940-2180 94.6 92.3 84.5
>2180-2420 97.8 88.2
>2420-2660 89.0 67.1
According to this rationale and based on the model from Lowe et al., the treatable population with Omalizumab 375 mg q2w could be a little bit expanded to higher baseline IgE values and higher body weights than those mentioned in the EU-licensed table (Lowe et al.)

However deterministic simulations with the instantaneous equilibrium models (Lowe et al.) denoted the need for a physiological model for PK-PD translation across anti-IgE antibodies with various affinities
Fre
e Ig
E [n
g/m
L]
100.
010
00.0
375 mg q2w187.5 mg q2w - Kd/10187.5 mg q2w - Kd/30target 25 ng/mLbaseline IgE=1100 ng/mL
A much more than 2-fold reduction in dose expected with a 10-fold enhanced affinity
Slide 9© Tripos, L.P. 2010 All Rights Reserved
Time [days]
Fre
e Ig
E [n
g/m
L]
0 50 100 150 200
0.1
1.0
10.0
No apparent saturation on free IgE suppression expected with a further enhanced affinity

Switch to a Target Mediated Disposition model
• Parameterization in terms of Koff and Kon instead of Kd (Kd=Koff/Kon)
• Molar ratio (total Omalizumab/total IgE) implemented on Kon
E C
dS= -ka.S
dTdX CLx
= ka.S - Kon.X.Conc - .X +Koff.Vx.ConcdT Vx
The Target Mediated Disposition model (Agoram et al. Br. J. Clin. Pharmacol, 2009) was implemented and extended as follows:
Units: nmol, L, dX: free Omalizumab amountConcE and ConcC: free IgE and complex conc.
implemented on Kon
• Parameter estimates, baseline IgE, correlations, covariates relationships from Lowe et al.
• Estimated model parameters: CLx, CLc, Cle, Vx=Ve, Vc, R, ka, Kd0, α
Slide 10© Tripos, L.P. 2010 All Rights Reserved
EE E C
CE C C
E baseline
C
dConc X CLe R= -Kon. Conc - .Conc + +Koff.Conc
dT Vx Ve VedConc X CLc
= Kon. Conc - .Conc - Koff.ConcdT Vx Vc
S(0) = 0
X(0) = 0
Conc (0) = IgE
Conc (0) = 0
CLcKoff = .4
Vc
E C
C
.Vc.
.Vc
α
0
Conc .Ve + ConcKoffKon =
Kd X + Conc

Simulations performed at usual Omalizumab dosing regimens with the TMD model are consistent with those from published instantaneous equilibrium models
Fre
e Ig
E [n
g/m
L]
0 50 100 150
15
5050
0 Model from Lowe et al.
Omalizumab: 225 mg q2w
0 50 100 150
510
5050
0
Model from Lowe et al.
Omalizumab: 150 mg q4w
Slide 11© Tripos, L.P. 2010 All Rights Reserved
0 50 100 150 0 50 100 150
Time [days]
Fre
e Ig
E [n
g/m
L]
0 50 100 150
15
5050
0 Model from Hayashi et al.
Time [days]
0 50 100 150
510
5050
0
Model from Hayashi et al.
90% pred. int. and median from published models90% pred. int and median from TMD model

Based on the TMD model, a 10-fold reduction in Koff is expected to result in a 2 to 3-fold dose reduction
subj
ects
with
free
IgE
<25
ng/
mL
[%]
6080
100
The expected q2w dose reduction assuming Koff/10 is 2.6 fold for a target achievement of 90%
Saturationof effect
Slide 12© Tripos, L.P. 2010 All Rights Reserved
q2w Omalizumab dose [mg]
subj
ects
with
free
IgE
<25
ng/
mL
[%]
0 200 400 600
020
40
125 325
baseline IgE ]968,1210] ng/mLreferencekoff/10koff/30
target achievement of 90%

Conclusions
Model based simulations using the model from Lowe et al. confirm the EU licensed table and the Omalizumab dosing rationale
A fully mechanistic TMD model is required for PK-PD translation across anti-IgE antibodies of different affinities
The TMD model seems to provide reliable results:
• In line with both published instantaneous equilibrium models
• In line with clinical data on a 2nd generation anti-IgE monoclonal • In line with clinical data on a 2nd generation anti-IgE monoclonal antibody (Putnam et al.)
Assuming Koff/10, a dose of 225 mg q2w is expected to ensure a free IgE level <50 ng/mL in more than 95% of patients within the most “difficult to treat” portion of the population (highest body weight and baseline IgE values)
There is potential to treat a larger patient population with a higher potency anti-IgE antibody and a more convenient dosing paradigm
Slide 13© Tripos, L.P. 2010 All Rights Reserved

Back-up slides
Slide 14© Tripos, L.P. 2010 All Rights Reserved

EU Table: mean pre dose steady state free IgE level (week 29)
Body weight
Baseline IgE (ng/mL) >30-40 >40-50 >50-60 >60-70 >70-80 >80-90 >90-125 >125-150
72.6-242 q4w 22 14.9
>242-484 21.3
>484-726 22.4 14.7 16.1
Model based simulations based on Lowe et al. tend to confirm the EU licensed table and the Omalizumab dosing rationale
Slide 15© Tripos, L.P. 2010 All Rights Reserved
>484-726 22.4 14.7 16.1
>726-968 16.5 18.8
>968-1210 q2w 16.8
>1210-1450 17.5 19.8
>1450-1690 16.5 32.4
>1690-1940 17.2
>1940-2180 21.4 23.9 31.9
>2180-2420 17.1 28.7
>2420-2660 27.3 45.7

For increased affinity the TMD model shows results consistent with the clinical data (Putnam et al.)
Fre
e Ig
E [n
g/m
L]
100.
010
00.0
baseline IgE=1100 ng/mL
375 mg q2w375 mg q2w - Koff/10, 375 mg q2w - Koff/30target 25 ng/mL
Slide 16© Tripos, L.P. 2010 All Rights Reserved
Time [days]
Fre
e Ig
E [n
g/m
L]
0 50 100 150 200
0.1
1.0
10.0