measuring urban form and walkability in rural...
TRANSCRIPT

Measuring Urban Form and Walkability in Rural Communities
Lucy Gibson
Smart Mobility, Inc.

Research Activities
• “Obesity and the Built Environment”– Study of over 2,000 students in 48 schools in VT
and NH
– Evaluated walkability for schools and residence locations
• “NETI Rural Transportation Issues Survey ”– Over 3,500 survey respondents in VT, NH and ME
– Evaluated the built environment for walkability, accessibility, for residences and communities

Rural Public Transit Ridership Factors
• Accessibility to trip origin and final destination• Relative cost and convenience compared to
other potential options– travel time, waiting time
– Fare cost• Safety and comfort of transit alternative
– walking to bus stop, – waiting for the bus

The Four D’s of the Land Use/ Transportation Connection
• Density (population per square mile)
• Diversity (jobs/housing balance)
• Design (street connectivity)
• Destinations (accessibility)

Density

Diversity


Local Scale

Design


Destinations

Four D’s in Rural Areas
• Data is more sparse,
• geographic units are very large, and • settlement patterns can be very
heterogeneous
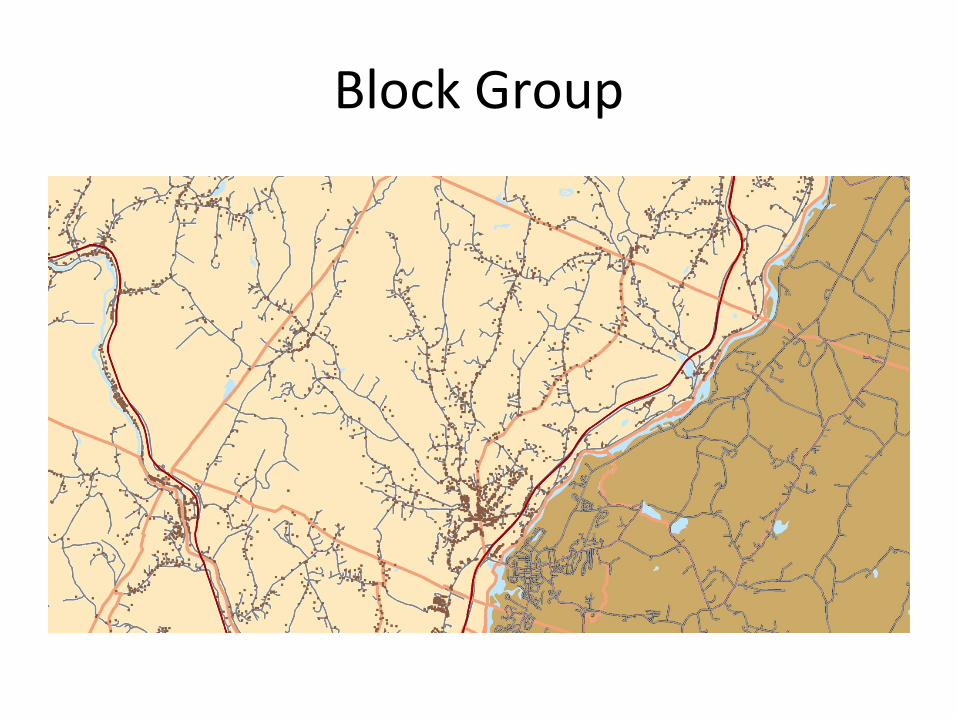
Block Group

A Tale of Two Towns
Town Wide Data Swanton Georgia
Population 6,415 4,480
Population Density 128 111

Refined 3D's GIS Site Specific Analysis
Applied to Area 1 kilometer radius from school
Population 1,463 77
Households 894 23
Intersections 32 7


Intersection Density

Design: Intersection Density• Even in rural Vermont, some of our
communities can meet these guidelines:


Respondents by intersection density
LEED‐ND Category Description Count
Below eligibleFewer than 90 per square
mile 2,828
Meets Minimum
eligibilityBetween 90 and 144 per
square mile 421
Meets LEED ND TargetBetween 144 and 300 per
square mile 366
Extra points for
connectivityMore than 300 per square
mile 15

Land Use CharacteristicsTransit
Implications
Neighborhood HH
Density
(hh/sqmi)* CountRural/ Exurban, 3+ acre lot
ruralParatransit
marginalLess than 200 1,763
Semi‐rural, 0.6 to 3 acre lot
semi‐ruralParatransit only 200 to 1,200 1,256
Suburban or Village density
(2 to 6 units per acre)Lower Frequency
Fixed Route Bus1,200 to 2,400 360
Walkable/Urban density (6
to 12 units)High Frequency
Fixed Route Bus2,400 to 4,800 133
Over 12 units per acrePremium Bus or
RailOver 4,800 36
Respondents by transit supportiveness
•These ranges are adjusted to reflect the difference between gross density and net density, which reflects land not consumed by roads, • utilities, etc. in urban areas.

Diversity
• Only town‐wide statistics available for rural areas, but can be combined with more local measures to get a 3’ds surrogate.

Jobs/Housing Balance in Vermont
1980Jobs/Worker
Balance
jobs - workersless than -1000-1000 to -500-500 to -200-200 to +200200 to 500500 to 1000more than 1000
2000Jobs/Worker
Balance
jobs - workersless than -1000-1000 to -500-500 to -200-200 to +200200 to 500500 to 1000more than 1000

Destinations


Walk Model Based on 3 D’s (Density, Diversity, Design)
Legend
walk_mdl.WORK_HOME0.000000 - 0.010000
0.010001 - 0.030000
0.030001 - 0.050000
0.050001 - 0.075000
0.075001 - 0.100000
0.100001 - 0.125000
0.125001 - 0.150000
0.150001 - 0.901291
Walk Share ModelWork to Home Trips
Data from 1990 CATS Survey -Prepared by Smart Mobility, Inc.
Legend
walk_mdl.NONWORK_HO0.000000 - 0.010000
0.010001 - 0.030000
0.030001 - 0.050000
0.050001 - 0.075000
0.075001 - 0.100000
0.100001 - 0.125000
0.125001 - 0.150000
0.150001 - 0.847597
Walk Share ModelNon-Work to Home Trips
Data from 1990 CATS Survey -Prepared by Smart Mobility, Inc.

Conclusions
• Land Use and the Built Environment affects transportation in rural and urban areas alike.
• Most methods to model, measure and predict were developed for urban settings.
• Different scales and heterogeneity of rural areas requires some adaptation of these
methods, but the basic principles still apply.

How can we use these methods?
• Research, modeling and analysis of different land use patterns and travel behavior.
• Transit planning: identifying most accessible locations.
• Land Use Policy: identify locations with greatest walkability.

Thank You!
Questions?