identifying and measuring urban design qualities related ... · identifying and measuring urban...
TRANSCRIPT

Identifying and Measuring Urban Identifying and Measuring Urban Design Qualities Related to Design Qualities Related to
WalkabilityWalkability
Funding by the Active Living Research program of The Robert Wood Johnson Foundation
Reid Ewing, Otto Clemente,
Susan Handy, Ross Brownson, and Emily Winston

Growing Body of EvidenceGrowing Body of Evidence

Mostly Gross QualitiesMostly Gross Qualities

Even Audit InstrumentsEven Audit Instruments

Not a Lot to Do with Experience Not a Lot to Do with Experience of Walking Down a Streetof Walking Down a Street

Genesis of ProjectGenesis of Project
• Christopher Alexander, A Pattern Language -Towns Buildings Construction
• Richard Hedman, Fundamentals of Urban Design
• Allan Jacobs, Great Streets
• Kevin Lynch, The Image of the City
• Amos Rapoport, History and Precedent in Environmental Design
• William H. Whyte, City—Rediscovering the Center

Conceptual FrameworkConceptual Framework
Physical features
Perceptual qualities
Individualreactions
Overallwalking quality
-Sense of Safety-Sense of Comfort-Level of Interest
-Imageability-Legibility-Complexity-Coherence-Enclosure-Human scale-Linkage-Transparency
-Sidewalk width-Street width-Traffic volumes-Tree canopy-Building height-Number of people-Weather-Etc.
Walking behavior
More objective More subjective

Work PlanWork Plan
• Expert Panel
• Literature Review with Definitions
• Library of Video Clips
• Visual Assessment Survey
• Quantitative and Qualitative Analyses
• Instrument Development, Testing, and Training
• Illustrated Field Manual

National Expert PanelNational Expert Panel
• Victor Dover - urban designer• Rob Lane - urban designer• Geoffrey Ferrell - urban designer/code expert• Tony Nelessen - urban designer• Anne Vernez Moudon - urban designer/planner• Mark Francis - landscape architect• Michael Southworth - urban designer• Michael Kwartler - architect/simulations expert• John Peponis - architect/space syntax expert• Dan Stokols - social ecologist

Perceptual QualitiesPerceptual Qualities
41 qualities
8 qualities
• Imageability
• Enclosure
• Human Scale
• Transparency
• Linkage
• Complexity
• Coherence
• Legibility

Textbook DefinitionsTextbook Definitions
Imageability is the quality of a place that makes it recognizable and memorable. A place has high imageability when specific physical elements and their arrangement evoke distinct images or positive feelings.
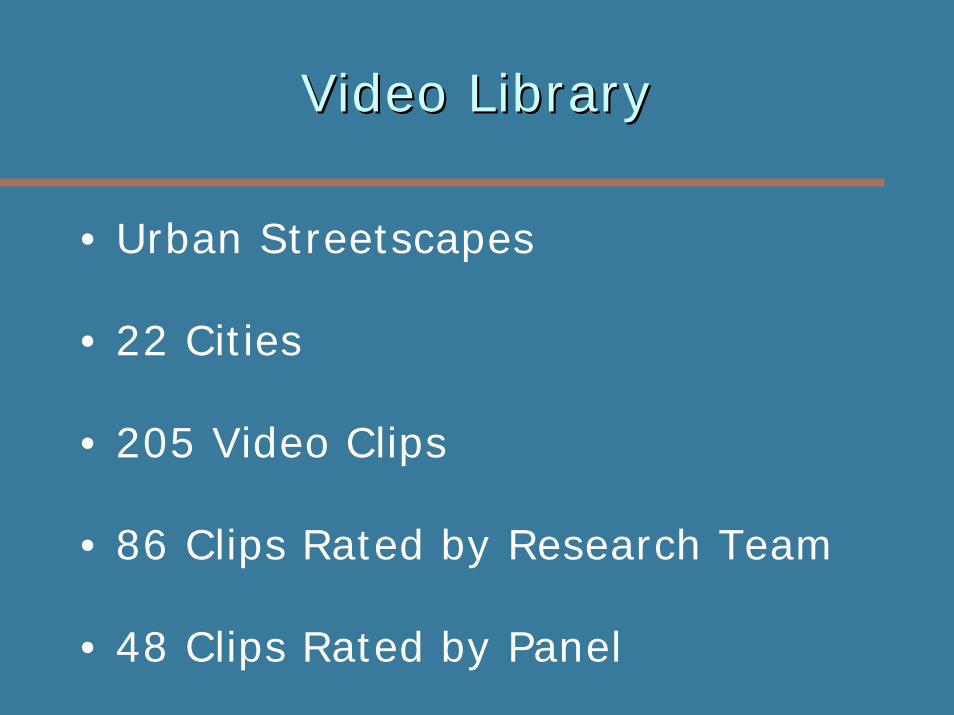
Video LibraryVideo Library
• Urban Streetscapes
• 22 Cities
• 205 Video Clips
• 86 Clips Rated by Research Team
• 48 Clips Rated by Panel

Fractional Factorial DesignFractional Factorial Design
full factorial design =28 design = 256 clips
1/16 fractional design =28-4 design = 16 clips

Best Match RunBest Match RunHigh Values of All Eight QualitiesHigh Values of All Eight Qualities

Best Match RunBest Match RunHigh Values of High Values of ImageabilityImageability, Human , Human
Scale, Linkage, and TidinessScale, Linkage, and Tidiness

Best Match RunBest Match RunHigh Values of Enclosure, Transparency, High Values of Enclosure, Transparency,
Complexity, and CoherenceComplexity, and Coherence

Visual Assessment Survey FormVisual Assessment Survey Form
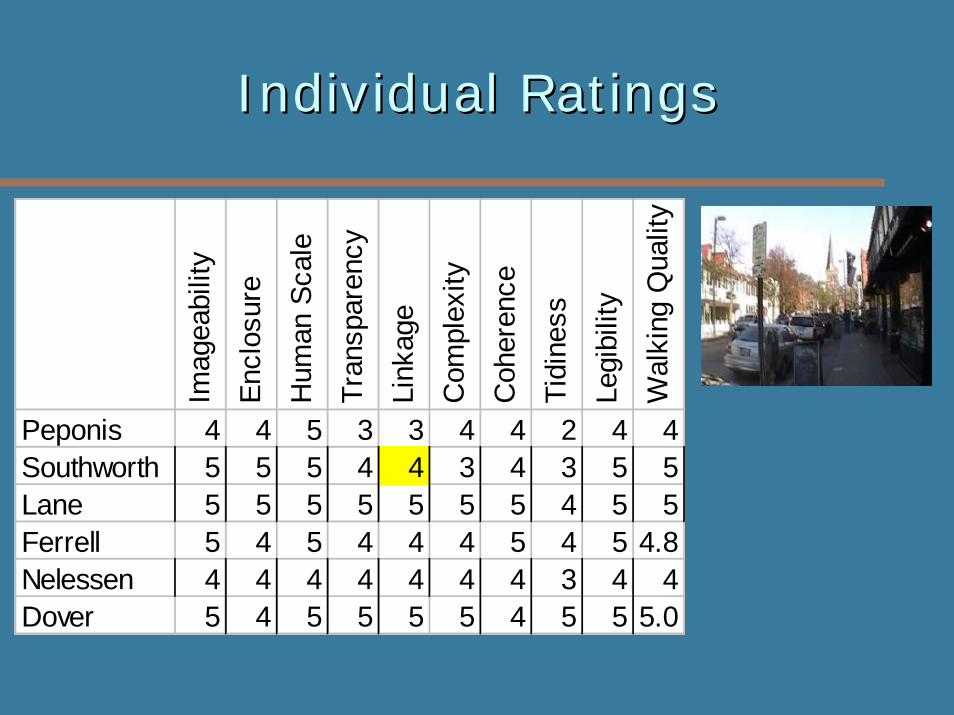
Individual RatingsIndividual Ratings
Imag
eabi
lity
Encl
osur
e
Hum
an S
cale
Tran
spar
ency
Link
age
Com
plex
ity
Coh
eren
ce
Tidi
ness
Legi
bilit
y
Wal
king
Qua
lity
Peponis 4 4 5 3 3 4 4 2 4 4Southworth 5 5 5 4 4 3 4 3 5 5Lane 5 5 5 5 5 5 5 4 5 5Ferrell 5 4 5 4 4 4 5 4 5 4.8Nelessen 4 4 4 4 4 4 4 3 4 4Dover 5 4 5 5 5 5 4 5 5 5.0

Regression Model for Overall Regression Model for Overall WalkabilityWalkability
Variable CoefficientStandardized
Coefficient t-statistic p-valueconstant -0.226 -1.503 0.140human scale 0.411 0.420 5.814 0.000transparency 0.137 0.149 2.366 0.023tidiness 0.070 0.059 1.598 0.117enclosure 0.140 0.157 2.504 0.016imageability 0.307 0.310 5.153 0.000N 48R-square .959Adjusted R-
square .954

InterInter--rater Reliabilityrater ReliabilityRatings of Urban Design Ratings of Urban Design
QualitiesQualitiesIntra-class Correlation Coefficient
95% Confidence Interval of ICC
Cronbach’sAlpha
imageability .494 .385-.618 .930legibility .380 .276-.509 .895enclosure .584 .478-.697 .945human scale .508 .399-.630 .928transparency .499 .390-.622 .926linkage .344 .169-.621 .896complexity .508 .398-.632 .926coherence .374 .271-.504 .880Tidiness .421 .314-.550 .915N 48
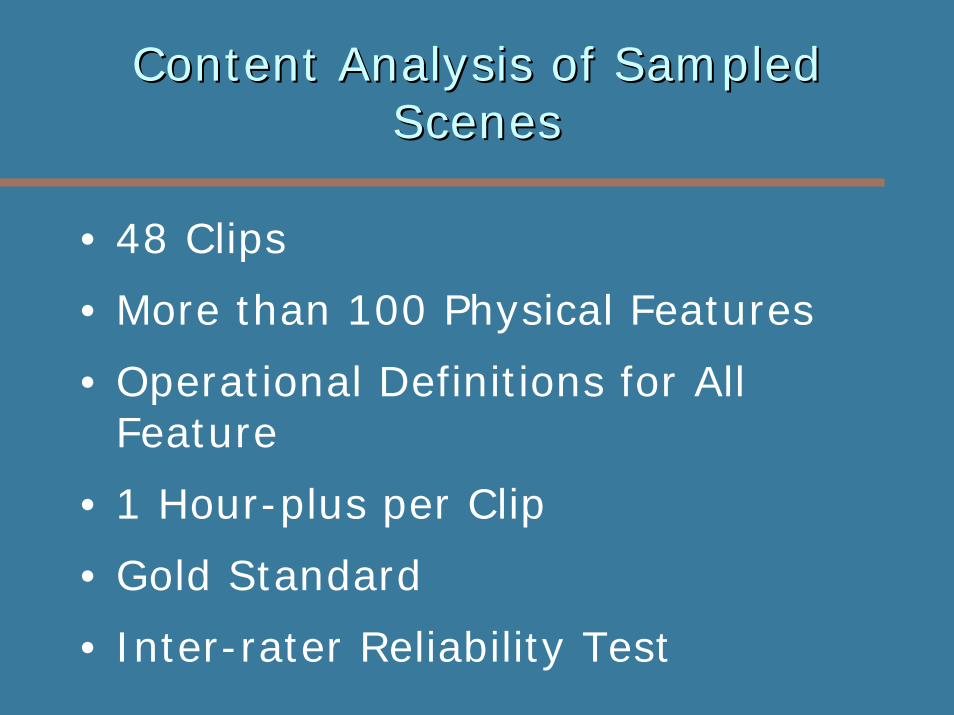
Content Analysis of Sampled Content Analysis of Sampled Scenes Scenes
• 48 Clips
• More than 100 Physical Features
• Operational Definitions for All Feature
• 1 Hour-plus per Clip
• Gold Standard
• Inter-rater Reliability Test
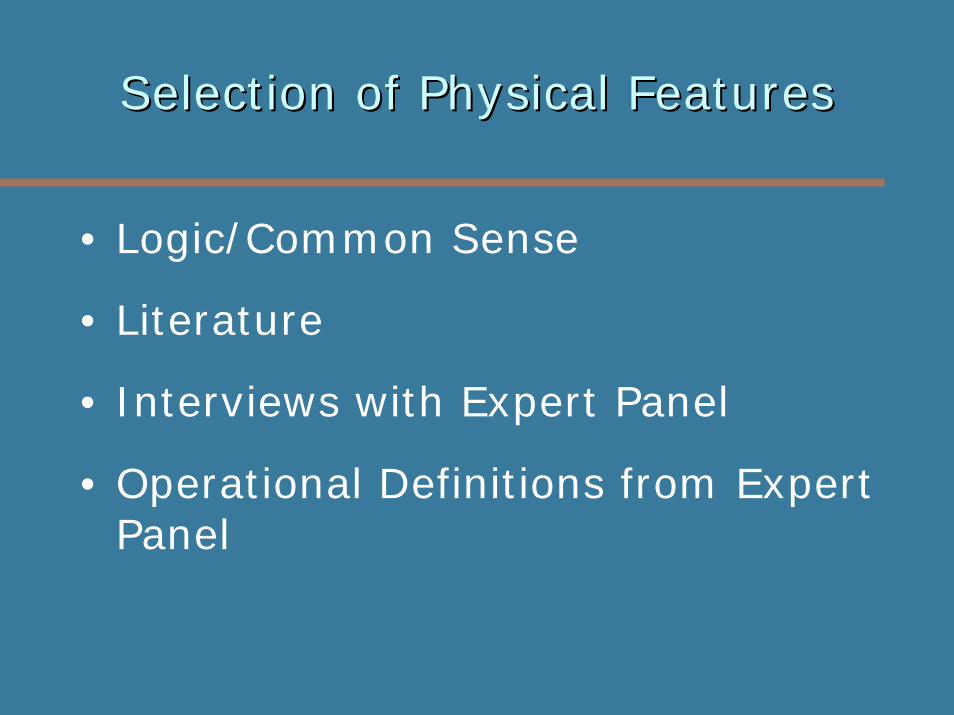
Selection of Physical FeaturesSelection of Physical Features
• Logic/Common Sense
• Literature
• Interviews with Expert Panel
• Operational Definitions from Expert Panel

Operational DefinitionsOperational Definitions
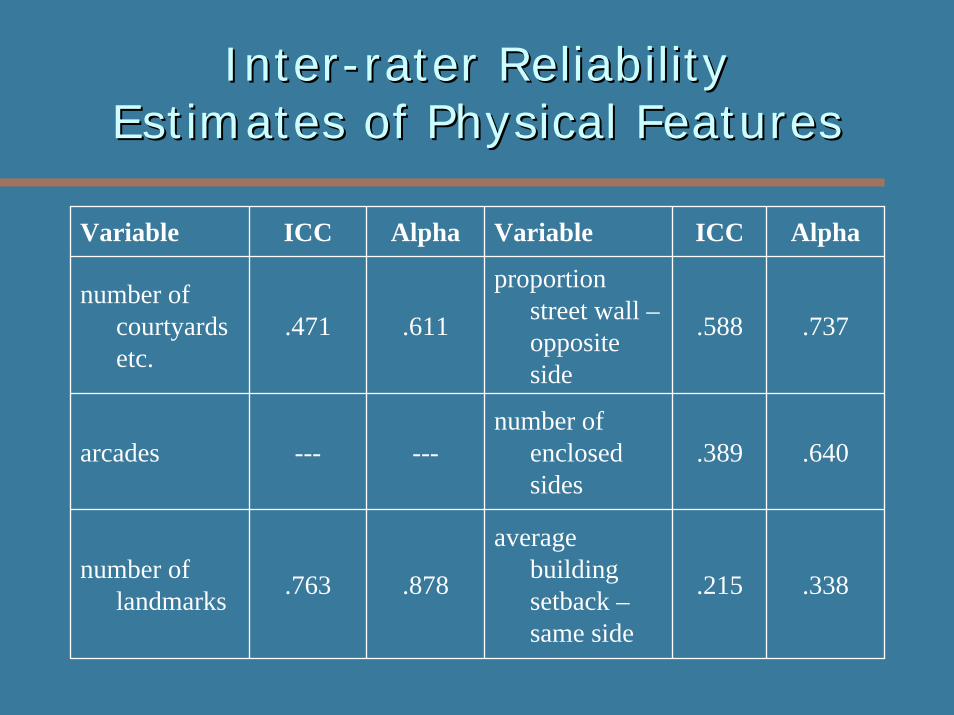
InterInter--rater Reliabilityrater ReliabilityEstimates of Physical FeaturesEstimates of Physical Features
Variable ICC Alpha Variable ICC Alpha
number of courtyards etc.
.471 .611
proportion street wall –opposite side
.588 .737
arcades --- ---number of
enclosed sides
.389 .640
number of landmarks .763 .878
average building setback –same side
.215 .338

Relate Urban Design Relate Urban Design Qualities Ratings to Physical Qualities Ratings to Physical
FeaturesFeatures

CrossCross--Classified Random Classified Random Effects ModelEffects Model
• New Class of Model
• Only a Handful of Applications
• Hierarchical in Nature
• Partitions Variance

Partitioning Total VariancePartitioning Total Variance
Scene VarianceViewer Variance
Measurement Error Total Variance
imageability 0.67(50)
0.16(12)
0.50(38)
1.33
legibility 0.46(39)
0.17(14)
0.55(47)
1.18
enclosure 0.83(59)
0.10(7)
0.48(34)
1.41
human scale 0.68(53)
0.11(8)
0.50(39)
1.29
transparency 0.77(51)
0.13(8)
0.62(41)
1.52
linkage 0.51(34)
0.26(17)
0.74(39)
1.51
complexity 0.6(52)
0.09(8)
0.47(40)
1.16

CrossCross--Classified Random Effects Classified Random Effects Models (fixed effects too)Models (fixed effects too)
actual score = predicted score + measurement error
predicted score = constant + viewer random effect + scene random effect + a*viewer variables + b*scene variables
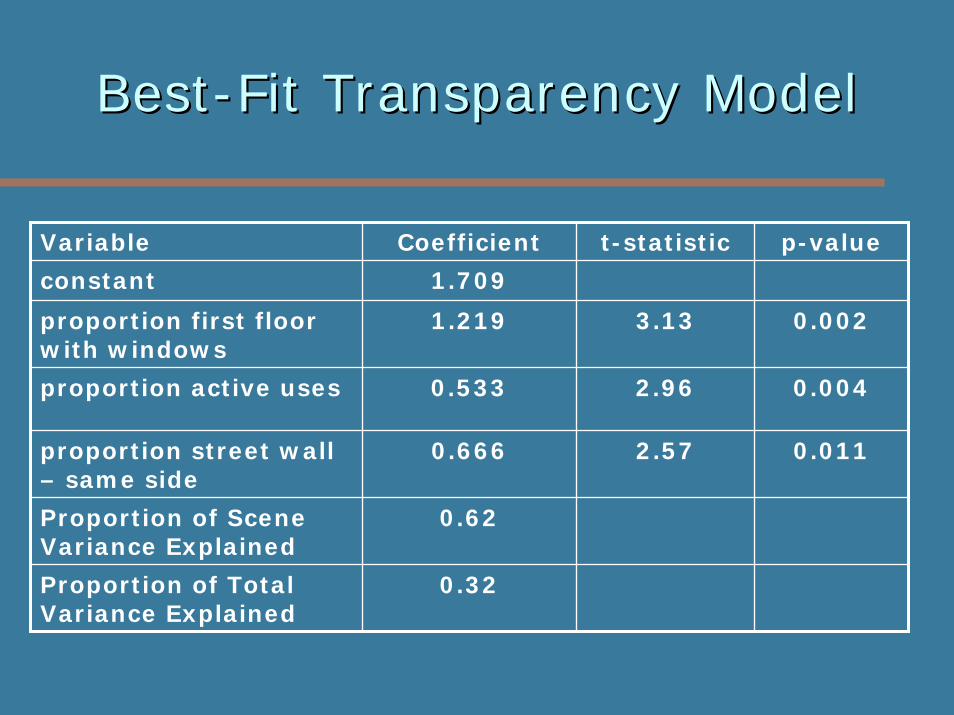
BestBest--Fit Transparency ModelFit Transparency Model
Variable Coefficient t-statistic p-value
constant 1.709
proportion first floor with windows
1.219 3.13 0.002
proportion active uses 0.533 2.96 0.004
proportion street wall – same side
0.666 2.57 0.011
Proportion of Scene Variance Explained
0.62
Proportion of Total Variance Explained
0.32

Performance of Urban Design Performance of Urban Design QualitiesQualities
Relationship to Walkability in Best-Fit Model (p-value)
Inter-rater reliability (ICC)
Portion of Scene Variance/Total Variance Explained by Best-Fit Models
Inter-rater Reliability of Significant Variables (number with ICC>0.4)
Criteria Met
Imageability 0.000 0.494 0.72/0.37 7 of 7
(1 missing)
5 of 5
Legibility --- 0.380 0.54/0.21 5 of 5
(1 missing)
1 of 5
Enclosure 0.016 0.584 0.72/0.43 5 of 5 5 of 5
Human scale 0.000 0.508 0.62/0.35 7 of 7 5 of 5
Transparency 0.023 0.499 0.62/0.32 3 of 3 5 of 5
Linkage --- 0.344 0.61/0.21 4 of 5 1 of 5
Complexity --- 0.508 0.73/0.38 5 of 6 3 of 5
Coherence --- 0.374 0.67/0.25 3 of 4 1 of 5
Tidiness 0.117 0.421 0.70/0.30 2 of 3
(1 missing)
3 of 5
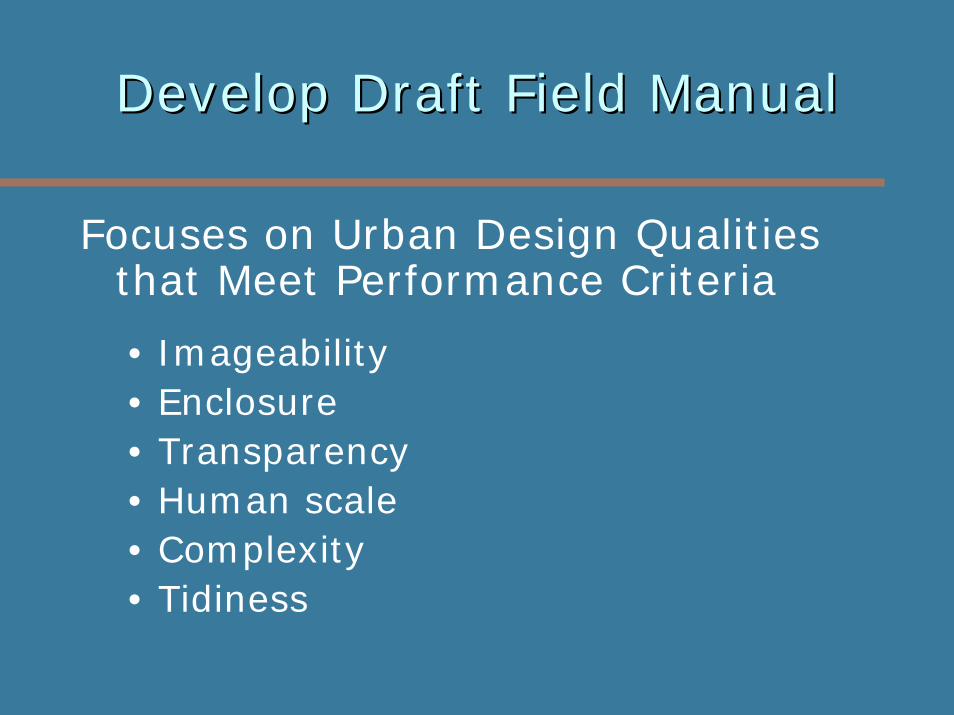
Develop Draft Field ManualDevelop Draft Field Manual
Focuses on Urban Design Qualities that Meet Performance Criteria
• Imageability• Enclosure• Transparency• Human scale• Complexity• Tidiness
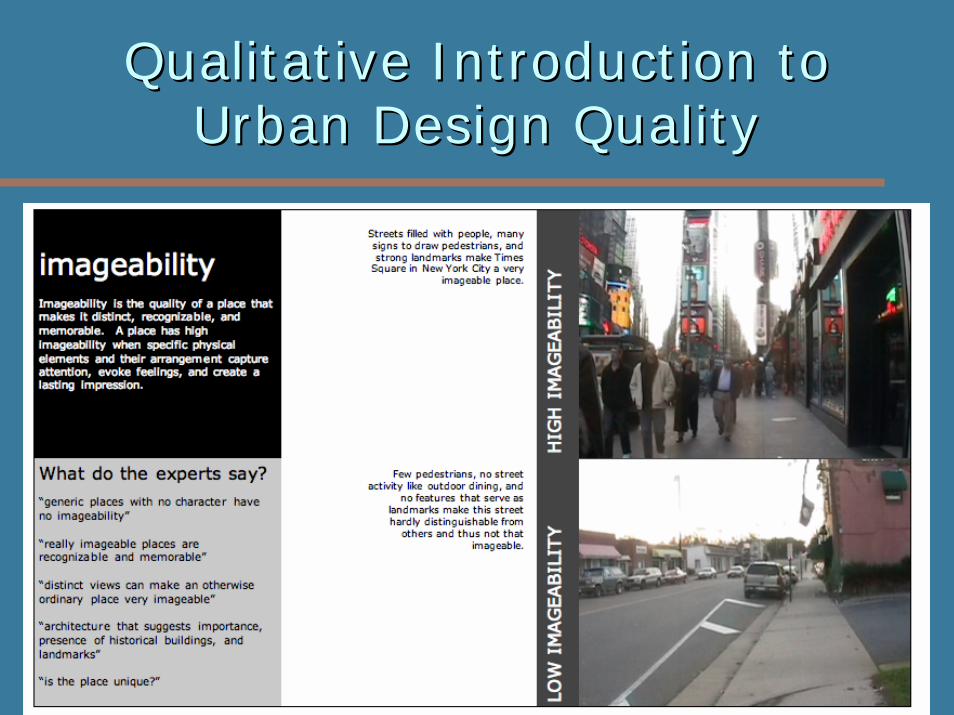
Qualitative Introduction to Qualitative Introduction to Urban Design QualityUrban Design Quality

Detailed Illustrated StepsDetailed Illustrated Steps

Scoring SheetScoring Sheet

Next stepsNext steps
• Test and Refine Instrument
• Provide Lab and Field Training to Lay Observers
• Finalize Instrument