measuring the online impact of your information project - knight
TRANSCRIPT
Measuring the Online Impact of
Your Information Project
A Primer for Practitioners and Funders

2 Measuring the Online Impact of Your Information Project
© FSG Social Impact Advisors
Contents
I. Introduction ........................................................................................................................................3
II. Looking at Basic Performance Metrics................................................................................................5
III. Aligning Metrics to Site Goals ...........................................................................................................11
IV. Analytics in Practice ..........................................................................................................................20
V. Appendix ...........................................................................................................................................22
A. About...............................................................................................................................................23
B. KCIC projects and websites .............................................................................................................24
C. Sample Key Performance Indicators (KPI) dashboard ....................................................................25
D. Web and social media analytics tools .............................................................................................26
Table of Figures
Figure 1. The Evaluation Process 4 Figure 2. The Notebook’s site traffic – Total number of visits per week 6 Figure 3. The Notebook’s visits per unique visitor per week 7 Figure 4. The Notebook’s page views per visit per week 7 Figure 5. The Notebook’s home page bounce rate, week of 6/20/10 8 Figure 6. The Notebook’s home page bounces by visits from new vs.
returning visitors, week of 6/20/10 9 Figure 7. The Notebook’s visits from new visitors per week 9 Figure 8. The Notebook’s audience estimate 12 Figure 9. The Notebook’s visits to audience section front pages 13

3
I. Introduction
In the spring of 2010, FSG Social Impact Advisors and independent web analytics consultant and journalism professor Dana Chinn reviewed fifteen (15) websites1 funded by the John S. and James L. Knight Foundation Community Information Challenge (KCIC). Our intent was (1) to build a better understanding of how funders and their implementation partners were reaching and engaging audiences online through websites and social media, and (2) to identify metrics that would be relevant and meaningful for understanding the progress and impact of projects for which creating more informed and engaged communities is the goal.
This report summarizes our findings and recommendations from our web review. It should be seen as a starting point, or primer, for how organizations can begin to sift through the copious amounts of data available using Google Analytics and to focus on the metrics that can best inform their decision making. We hope this document provides practical guidance to practitioners and funders of community information projects on how to begin to measure online impact, understanding that with more time and resources, organizations can go much further in understanding their online activities and connecting them to their project-specific impact goals.
At the time of this document’s release in the fall of 2010, it should also be noted that the resources for, and approaches to, web and social media analytics are rapidly changing. With each new emerging web and social media innovation, new data tools and service providers become available to help measure them. We fully expect our understanding of “the basics” of online impact measurement to evolve as the field evolves; future versions of this document will reflect this evolution.
In Context
Organizations are implementing and funding a range of projects that address community information needs. In our recommendations, we have tried to focus on providing guidance that is relevant to the broadest set of information projects, and indicate when recommendations are more (or less) relevant to certain types of projects. Depending on the specific goals, approaches, or stages of project development, organizations may find that some of the recommendations in this document may not be as relevant. For additional support in defining goals, identifying relevant indicators, and planning ongoing analyses, consultants, such as Knight Foundation Circuit Riders and FSG Social Impact Advisors are available to provide additional assistance.
1 See Appendix for list of projects

4 Measuring the Online Impact of Your Information Project
© FSG Social Impact Advisors
Organizations should evaluate the online components of community information projects as part of a broader evaluation process. The process illustrated below (Figure 1) applies to any information project, regardless of goal or approach.
Figure 1. The Evaluation Process
Organizations should design and implement their evaluations of community information project-related websites as part of steps 2-6 in the above figure.

5
II. Looking at Basic Performance Metrics
Know Your Community
Community information sites should be assessed based on metrics that indicate growth, penetration, and engagement for specific audience segments. Many organizations make the mistake of defining their audience using mass media characteristics, such as all stakeholders in a geographic region. However, online audiences are highly fragmented and dynamic; online audience growth and retention come from targeting segments defined by demographics, attitudes, interests and other characteristics.
Organizations should use metrics that indicate:
Reach: The site’s existing audiences are indeed the intended stakeholders in the community Penetration: The extent to which the site is reaching – or not – the intended audience Engagement: Audiences are coming back repeatedly, viewing more content and using or
interacting with the site’s services
This analysis requires multiple web metrics, not just one metric, such as total visits. As a starting point to assess overall site traffic trends, including “growth” and “stickiness,” organizations should analyze:
By week or four-week period…
Total number of visits per week Total number of weekly unique visitors Visits per weekly unique visitor Page views per visit Bounce rates of the pages where visits most frequently start (landing page) Visits from new versus returning visitors
These metrics will help organizations answer the following questions:
Over time and on average, is the site growing in audience reach and engagement?
How have our team’s actions affected site traffic, either positively or negatively?
When people visit the site, do they find what they are looking for?
Are visitors returning?
Is the site attracting the number of new visitors we should expect given our outreach efforts?

6 Measuring the Online Impact of Your Information Project
© FSG Social Impact Advisors
Overall Site Trends
Total page views, total unique visitors, and time spent on site are common metrics used by many online news organizations. They are popular because they are familiar translations of the metrics used for mass media – for example: monthly subscribers, average time spent per week. These metrics, however, have limitations. They do not recognize the unique characteristics of online audience behavior. Furthermore, the way that they are measured by web analytics systems is so flawed that the numbers, by themselves, are not credible.
The total number of visits is a much better gross trend to track. Visit methodology is also flawed, but not as greatly as unique visitors and page views. When tracking number of visits over time, an increasing number always indicates a positive trend; a decreasing number, negative.
Site traffic data from The Notebook (thenotebook.org), a project funded by the John S. and James L. Knight Foundation’s Community Information Challenge, illustrates the kind of trends that organizations that are implementing community information projects should look for – steady growth in visits and engagement. The Notebook has seen some spikes in page views due to breaking news. It has also had some Google Analytics technical coding problems in the past that affect the data integrity in some weeks, but, over time, the overall trend is upward. By monitoring traffic daily, The Notebook staff was able to identify the technical problems and fix them relatively quickly.
As seen in Figures 2 and 3 below, the overall trend - steady growth punctuated by spikes - is more apparent when looking solely at visits. Weekly visits have more than doubled over the past year, and the average number of visits per unique visitor has also increased.
Figure 2. The Notebook’s site traffic – Total number of visits per week

7
Figure 3. The Notebook’s visits per unique visitor per week
While the number of visits per unique visitors has grown gradually over several months, the number of page views has remained fairly steady, with the exception of a significant change in December 2009 through February 2010, when The Notebook experienced a technical issue with its Google Analytics coding.
Figure 4. The Notebook’s page views per visit per week
8 Measuring the Online Impact of Your Information Project
© FSG Social Impact Advisors
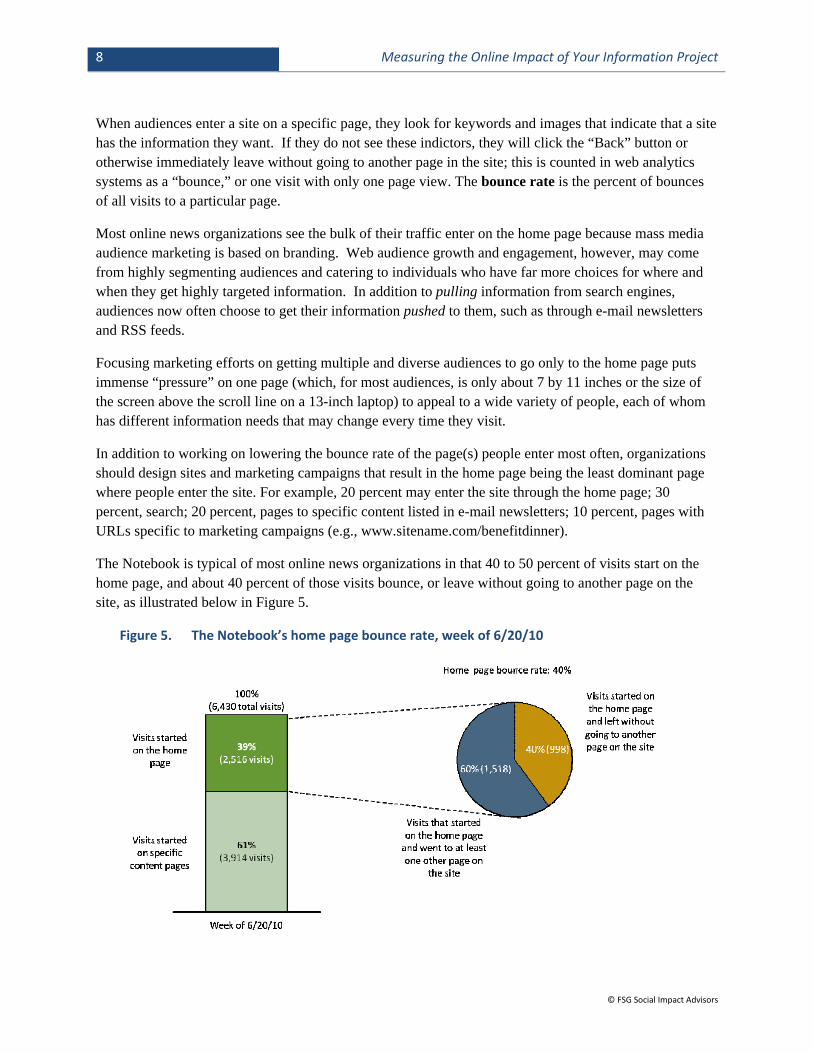
When audiences enter a site on a specific page, they look for keywords and images that indicate that a site has the information they want. If they do not see these indictors, they will click the “Back” button or otherwise immediately leave without going to another page in the site; this is counted in web analytics systems as a “bounce,” or one visit with only one page view. The bounce rate is the percent of bounces of all visits to a particular page.
Most online news organizations see the bulk of their traffic enter on the home page because mass media audience marketing is based on branding. Web audience growth and engagement, however, may come from highly segmenting audiences and catering to individuals who have far more choices for where and when they get highly targeted information. In addition to pulling information from search engines, audiences now often choose to get their information pushed to them, such as through e-mail newsletters and RSS feeds.
Focusing marketing efforts on getting multiple and diverse audiences to go only to the home page puts immense “pressure” on one page (which, for most audiences, is only about 7 by 11 inches or the size of the screen above the scroll line on a 13-inch laptop) to appeal to a wide variety of people, each of whom has different information needs that may change every time they visit.
In addition to working on lowering the bounce rate of the page(s) people enter most often, organizations should design sites and marketing campaigns that result in the home page being the least dominant page where people enter the site. For example, 20 percent may enter the site through the home page; 30 percent, search; 20 percent, pages to specific content listed in e-mail newsletters; 10 percent, pages with URLs specific to marketing campaigns (e.g., www.sitename.com/benefitdinner).
The Notebook is typical of most online news organizations in that 40 to 50 percent of visits start on the home page, and about 40 percent of those visits bounce, or leave without going to another page on the site, as illustrated below in Figure 5.
Figure 5. The Notebook’s home page bounce rate, week of 6/20/10

9
Organizations should analyze whether new or returning visitors are bouncing. In Figure 6 below, The Notebook data shows that, for all bounces from the home page, about 80 percent come from returning visitors. This is not necessarily a significant problem, because the home page is specifically designed for quick, short, breaking news bites, and The Notebook’s audience (Philadelphia public school stakeholders) is already a well-defined population.
Figure 6. The Notebook’s home page bounces by visits from new vs. returning visitors, week of
6/20/10
The high bounce rate should be addressed if The Notebook has a “call to action” on its home page that it wants audiences to take, such as increasing membership contributions or asking people to go to special sections for parents, teachers or students to find more targeted content and engage them further.
As project sites grow and project teams increase their outreach efforts, organizations should see a steady increase in visits from new visitors, as the chart in Figure 7 indicates.
Figure 7. The Notebook’s visits from new visitors per week

10 Measuring the Online Impact of Your Information Project
© FSG Social Impact Advisors
An increasing trend in visits from new visitors, combined with an increase in the number of total visits overall, tells The Notebook that they are increasing their online reach.
Just the Basics?
For some, understanding audience engagement with site content may include looking at other relevant metrics. For example:
Percent of zero results from internal searches: A site visitor should not get a “0 results found” error message if a project website has clearly communicated its purpose and scope to its target audiences and provided the quantity of relevant content those audiences expect. If the percentage is high, project teams should further investigate what key search words or terms are most frequently turning up error messages and improve the way that content is tagged on the site or consider new content areas that seem to be of high interest to the site’s audiences and are consistent with the site’s goals.
For citizen journalism sites, engagement of an online audience goes beyond reading the content. For these sites especially, organizations should consider the use of member registration to develop better proxies for true engagement. Registration may be an incentive for audiences to engage beyond reading content anonymously, e.g., posting comments on articles on the site. A few proxy measures for this type of engagement include:
Number of registered members in each audience segment, as a percent of the overall audience universe
Percent of visits from registered members who sign in when they visit, by segment
Visits per week per signed-in member, by segment
A Note about the Limitations of Site Traffic Data Site traffic data only gives information about audiences who actually come to the site. It does not help much with determining how to get new audiences. Traffic data also does not give attitudinal information, such as whether people liked what they saw when they did come. For example, a high page views per visit ratio (e.g., 10 pages per visit), may mean people couldn’t find what they were looking for. Thus, the ideal, complete website evaluation should include traditional attitudinal survey research. However, as this research is expensive and time-consuming, one approach would be to get as much insight as possible from a variety of site traffic metrics, and then turn to attitudinal research on a few high-priority issues or trouble spots.

11
III. Aligning Metrics to Site Goals
What does success look like?
Just as with their overall community information initiatives, organizations need to clearly define goals for their project websites. Clear and specific site goals should indicate to project teams what to measure. The right metrics can work as key performance indicators (KPIs), or metrics that reflect actions the team has taken or should take. The organization should have at least one metric mapped to each of its site goals. Collecting and analyzing metrics that do not relate to a site goal may not be a good use of valuable time and resources.
This section focuses on four types of site goals.
Audience: Organizations should set reach and frequency goals based on universe estimates of each audience segment
Content: Audience growth and engagement is dependent upon a project having content and services that are demanded by the intended audience and are not available elsewhere
Sustainability: Sites should appropriately support a sustainable business model, e.g., through donations, sponsorships, advertising or event ticket sales
Social media: Organizations should be using social media to engage influencers in each audience segment
If the site structure and coding are set up to correspond to the site’s goals, organizations can set goals and monitor their KPIs weekly; this activity becomes a starting point for investigating the reasons behind significant increases and decreases in their KPI data. It should be noted that KPIs can change as a result of both external events/seasonality and a project team’s actions/inactions.
The following sub-sections explain each of the four types of site goals in greater detail, using data from one Knight Community Information Challenge project site, The Notebook (thenotebook.org), as an example.
Audience
Defining audience segments is an essential first step toward setting a community news site’s goals. A community is made up of many different stakeholder groups defined by many characteristics, attitudes and behaviors. Each group or segment has different needs and wants for which a community information project team should tailor its website content and marketing efforts.
To use its limited resources efficiently, organizations should set priorities about which segments should be approached first – or if at all. Thus, projects should be evaluated on metrics that indicate growth, penetration and engagement for specific, defined audience segments that will also build a long-term base for sustainability.
12 Measuring the Online Impact of Your Information Project
© FSG Social Impact Advisors
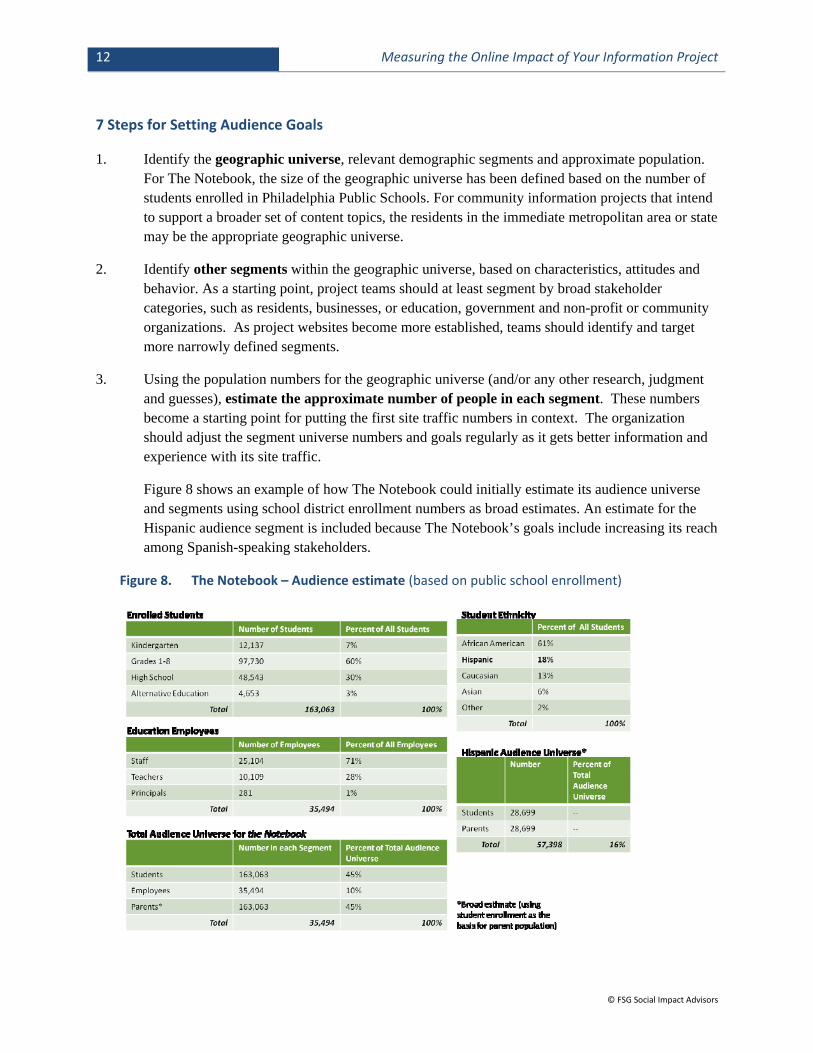
7 Steps for Setting Audience Goals
1. Identify the geographic universe, relevant demographic segments and approximate population. For The Notebook, the size of the geographic universe has been defined based on the number of students enrolled in Philadelphia Public Schools. For community information projects that intend to support a broader set of content topics, the residents in the immediate metropolitan area or state may be the appropriate geographic universe.
2. Identify other segments within the geographic universe, based on characteristics, attitudes and behavior. As a starting point, project teams should at least segment by broad stakeholder categories, such as residents, businesses, or education, government and non-profit or community organizations. As project websites become more established, teams should identify and target more narrowly defined segments.
3. Using the population numbers for the geographic universe (and/or any other research, judgment and guesses), estimate the approximate number of people in each segment. These numbers become a starting point for putting the first site traffic numbers in context. The organization should adjust the segment universe numbers and goals regularly as it gets better information and experience with its site traffic.
Figure 8 shows an example of how The Notebook could initially estimate its audience universe and segments using school district enrollment numbers as broad estimates. An estimate for the Hispanic audience segment is included because The Notebook’s goals include increasing its reach among Spanish-speaking stakeholders.
Figure 8. The Notebook – Audience estimate (based on public school enrollment)

13
4. Review the site to determine whether it is capturing the information needed to track the targeted audience segments. As much as possible, organizations should make use of audience registration to collect data on who is accessing their sites; basic data that will aid organizations’ evaluation activities include:
Who they are (e.g., full name)
Where they are (e.g., zip code)
If possible, organizations may also try to collect data that indicates why an audience member is registering. Understandably, organizations may be reluctant to ask for more than a screen name and e-mail address. However, audience members may be willing to provide personal information to a nonprofit organization or foundation (vs. an e-commerce company) if the organization explains why the information is needed to better serve the individual’s information needs. People who are willing to register on a site may be more committed community stakeholders; organizations should try to capture as much information as needed at this first sign of engagement.
Furthermore, sites can sometimes be structured to provide proxies for segmenting traffic by audience type. The Notebook has section front pages for parents, teachers, students and Spanish-speaking stakeholders, each coded by audience type. This type of site architecture assumes that these pages should be valuable or compelling enough to a particular audience segment that returning visitors will go to these audience-specific pages frequently, and may even bookmark them to use as a “home” page. Thus, tracking visits to these pages gives a rough assessment of reach among audience segments, especially if combined with other assessment information, such as registration information.
Figure 9. The Notebook’s visits to audience section front pages

14 Measuring the Online Impact of Your Information Project
© FSG Social Impact Advisors
Using the proxy method described above, the chart in Figure 9 suggests that The Notebook’s visit growth has been due more to teachers than parents, an audience that The Notebook staff would like to engage more deeply in the site.
5. Determine the questions that the site traffic data will help answer about the target audience segments. These are questions that will determine which customized site traffic reports – beyond the baseline key performance indicators – an organization should review to determine progress against near-term (perhaps quarterly) goals. The Notebook, for example, could reasonably ask, “To what extent are parents increasingly visiting our site?” perhaps tied to recent marketing efforts initiated by The Notebook staff.
6. Identify the decisions that need to be made. Looking at a report should prompt a project team to react in some way based on its goals. For example, if a report indicates that the number of visitors reading content from The Notebook’s “Parents” section is lower than expected or not hitting its expected goals, the team may decide to launch a marketing campaign to a specific sub-group of parents (e.g., subscribers or nonsubscribers), using an incentive offer (e.g., an invitation to attend a special lecture), with a particular outreach method (e.g., linking with an affiliate site, placing a house ad in a magazine, or sending a direct mail appeal).
7. If needed, make adjustments to the site structure and coding to ensure the site has the elements needed to gather and track relevant data. For example, The Notebook wants to reach out to more Philadelphia public school district parents. Instead of only asking whether a registrant is a parent, administrator/teacher or student, they may also want to ask how many children they have enrolled in Philadelphia public schools, and at which grade levels. Organizations may find that making changes to the site structure or code will be less costly if data collection needs are identified early in the site development process.
Relevant Project‐Specific Indicators of Audience Reach and Growth
Depending on the specific project website goals and approaches, other indicators not mentioned above may be relevant and useful for organizations to track to better understand their online impact. Below are a few examples.
# of print subscribers who have online accounts
# of new online accounts from people who are not print subscribers
# of registered users or email subscribers by neighborhood or sub-group within community
# of reporters (new versus returning) from the region
# of people who submit content (e.g., videos, articles, photos)
% of registered users who submit content

15
Content
Site traffic data can help an organization understand what content and services make a difference in usage and engagement among target audiences. These data should help project teams decide what topics to cover, how much, and where/when to cut, so it can reallocate resources to higher priority initiatives if necessary.
Google Analytics tracks traffic based on the URL of a page; a page has to have a URL with the appropriate coding so that it can be included in pages by topic counts.
Examples of Content‐Specific URLs
1. URLs that give a count of total page views for the site, but not any other information
about how many views were for Health pages: http://www.sitename.com/page1.html http://www.sitename.com/page2.html http://www.sitename.com/page3.html
2. URLs that give a count of total page views for “Health,” but only if all of the
“Health” pages are in the “Health” section: http://www.sitename.com/health http://www.sitename.com/health/page2 http://www.sitename.com/health/page3
3. URLs that give a count of total page views for a topic in multiple sections (“382” is
the code for “Health”): http://www.sitename.com/health/38273 http://www.sitename.com/cityname/38245 http://www.sitename.com/blogs/38266
Having a well-defined set of site goals based on what targeted audience segments want is an essential first step to getting and understanding meaningful data out of Google Analytics. It is too labor-intensive to code a site to track every topic and every possible permutation of subtopics, so it is important to code only what is needed.
As discussed above, thoughtful audience segmentation during the development phase should inform site architecture and coding so that organizations can collect the data they need. For audiences, the structure of a site and its corresponding codes are key to efficient navigation and usability, which in turn lead to more traffic and audience satisfaction and engagement. Using print newspaper or story type terms like “News,” “Blogs,” and “Multimedia” are frustrating to users. Users know what they want (“I’m looking for that welfare story”) or what their affiliation is (“I live in Ansonia”); whether a story is an article or a video clip is a secondary need, if one at all. These story type terms are holdovers from traditional news

16 Measuring the Online Impact of Your Information Project
© FSG Social Impact Advisors
organizations; they are signs that an online news organization is content-focused, rather than audience-focused.
Having navigation and coding by geography is important for a community information site, but it is not essential for projects targeting smaller communities (e.g., Lower Naugatauk Valley, Connecticut) or affinity groups (e.g., bicyclists in Detroit) because their geographic universes are already well defined. For organizations that are reaching communities in larger cities, such as San Diego or Minneapolis, or across an entire state, having navigation (and coding) that uses the primary community or neighborhood names with which the audiences associate themselves is crucial.
Relevant Project‐Specific Indicators of Engagement with Content
Depending on the specific project website goals and approaches, other indicators not mentioned above may be relevant and useful for organizations to track to better understand their online impact. Below are a few examples.
Internal search terms most frequently requested versus zero results
Visits/unique page views by topic
Visits/unique page views by topic and region (neighborhood)
Referrals by topic
% of visits that complete a specific chain of events or path on the website
Sustainability
Information project websites should aim to be strong conceptually with the potential to contribute to a business model that is sustainable in the long-term. For example, The Notebook’s site features indicate that they are attempting to engage the full spectrum of revenue options, including donations, sponsorships, advertising and benefit dinner ticket sales. They are in a good position to optimize their e-commerce functionality.
To use site traffic data for this purpose, information project teams should think of themselves as running not only an information project, but also as an e-commerce business, for which everything on the site could contribute to a desired revenue-related action. Below is an outline of each step in a typical e-commerce event chain; at each step, it is common for some users to leave the process.

17
Sample e‐commerce process
1. First call-to-action, e.g., “Click here to donate”
2. Benefit page, e.g., “If you donate, you will be supporting public education”
3. Submit information, e.g., Name, donation amount
4. Submit payment information, e.g., credit card number (The site should be set up so that the user information is separate from the payment process and can be recorded and the donor re-contacted, if necessary.)
5. Payment confirmation and thank you page
If organizations have set up Google Analytics’ “goal and funnel” functions for their websites, they can set goals for each step of the process described above, and adjust the pages as needed. For example, a low number of visits that progress from the benefit page to submitting information could prompt the project team to change the wording or the offer. A drop in the number of visits that get to the payment confirmation page may mean a technical problem that should be fixed immediately.
Organizations should be aware of how to value project sites and audience to attract potential donors, sponsors or advertisers. The most common metric – total number of people – is a traditional mass media business model metric based on selling advertisers the premise that a static set of people is coming consistently to a publication and that they all have the same level of use and engagement. Organizations that have metrics that indicate growth, penetration and engagement for specific, defined audience segments can use them effectively to approach advertisers and sponsors. As with any “sale,” sponsors and small local advertisers want to know…
…if a project is reaching who the sponsor wants to reach …in ways that are unique …and which would be beneficial to the sponsor/advertiser
Organizations will, however, need to invest the time to educate sponsors and advertisers that these targeted, yet small, online audiences are more valuable than mass numbers that have little context. Organizations that do not have online donation functions are perhaps forgoing donations from a variety of donors, from those who find online donations more convenient to impulsive donors reacting to a news event. To some extent, organizations could perhaps assume that users expect some type of “please donate” section if it is clear that the site is operated by a nonprofit. For sponsorships, a “call to action” could simply be a page that says the organization would like sponsors.

18 Measuring the Online Impact of Your Information Project
© FSG Social Impact Advisors
Relevant Project‐Specific Indicators of Sustainability
Depending on the specific project website goals and approaches, other indicators not mentioned above may be relevant and useful for organizations to track to better understand their online impact. Below are a few examples.
Impressions and click-throughs on lead sponsor ads # of visits referred from email campaigns # of donors contributing through website % of visitors who complete the online donations process
Social Media
Social media is an essential component of a site strategy. If used effectively, social media can be a significant factor in a project team achieving its goals among selected audience segments. However, using social media effectively can be very labor-intensive, and evaluating whether or not social media is adding to or diverting from a project’s goals is essential.
The dynamic nature of social media makes measuring impact and effectiveness extremely difficult, and software tools are constantly evolving. Thus, a good approach may be to limit measuring social media’s impact to specific campaigns. For example, if an organization is having a benefit dinner, it should incorporate Twitter and Facebook into its marketing efforts a month before and during the dinner, and measure the impact these efforts have on traffic to the benefit dinner ticket sales page and other related parts of the site. A strategic social media evaluation should include the following steps.
Key Steps to Evaluating Social Media
1. Identify the influencers in the target audience segments. Because organizations know their communities well, they should be able to identify the influencers in their targeted segments, and cultivate them both on- and offline. Two important metrics are:
The number of influencers in a group of Twitter followers or Facebook fans/friends
The level of interaction those influencers have with a project’s content
Tools, such as MyTweeple, can also help organizations identify lesser-known stakeholders who may be more prominent (and influential) on social media than on the web or in the community.
2. Evaluate the conversations. Measuring the level of engagement, not the number of people, is much more important with social media than with a website. Organizations should evaluate whether audience members are:
19
starting conversations on topics important to the targeted segments
are participating in key conversations
A thorough text analysis is a complex process, but organizations can see whether they are generally using the keywords important to its audiences with free content analysis tools, such as TweetStats and TweetBeep.
While social media tools can be useful to broadcast information about the project or linked to content on the project website, Twitter and Facebook should ideally be used for conversation among specific people associated with the project. With newer project websites just beginning to make use of Twitter and Facebook, it may be difficult for s to maintain a consistent presence.
As organizations move forward with social media, they should regularly analyze their follower, fan and friend profiles to see if their groups include the influencers and people from different regions in their target audiences.
Relevant Project‐Specific Indicators of Social Media Influence
Depending on the specific project website goals and approaches, other indicators not mentioned above may be relevant and useful for organizations to track to better understand their online impact. Below are a few examples.
Diversity of follower profiles by region, influencers # of responses to “Calls to Action”

20
IV. Analytics in Practice
As we have emphasized throughout this document, it is important for organizations pursuing community information projects to know what they are looking for before setting out to collect and analyze web and social media data. Deciding what to measure and ensuring a site is coded so that metrics are mapped to goals are ongoing processes that require a basic understanding of web analytics and Google Analytics (or other system). More importantly, web analytics requires staff time and a commitment to use data for decision-making throughout the organization. Organizations should enter into this process with a sound understanding of what data are meaningful to measure and what resources are required to measure effectively.
Recommended Actions
As part of the design, implementation and evaluation of community information websites, organizations should:
□ Clarify and refine site audience segments and goals □ Identify the staff time that can be committed to web and social media analytics □ Monitor site traffic metrics at least weekly □ Get basic training on Google Analytics (or other system), as needed □ Revise the site content, design and coding based on the highest priority audience segments
and decisions needed
Set‐up
Organizations should clearly define their overall goals, theories of change and logic models for their projects. As part of this process, organizations should prioritize which aspects of their online project activities they would most like to evaluate or learn more about. In this document, we have suggested four topics that we believe will be most relevant and important for implementers and funders of community information projects to understand the collective impact of an initiative on community information health.
After determining key performance indicators and setting site goals, organizations should ensure each page of the website is coded appropriately to support data collection whenever possible. This may require changes to the site’s design and technical infrastructure.

21
Ongoing monitoring and review
Organizations should discuss with key decision-makers on their team what data will be most useful to help inform ongoing implementation of community information websites. A sample dashboard of key performance indicators is provided in the Appendix (C) as a starting point.
Organizations should also consider how and when data reports are shared. For implementing teams and internal audiences, organizations may wish to report on all or most metrics weekly or monthly to partners that are most directly connected to program implementation. For external audiences and board members, organizations may wish to highlight specific metrics among all of the data available and share reports quarterly or annually. In each case, it is important for organizations to consider how the data will be interpreted. Collection and analysis alone will not lead to understanding or effective communication of progress. Organizations should set aside time to discuss the relevant web and social media data as part of decision-making and look for opportunities to educate stakeholders about the online impact their projects are having.
Additional resources
Consultants such as Knight Foundation Circuit Riders and FSG Social Impact Advisors team members are available to assist organizations with their information projects’ web and social media analytics. We also hope that organizations involved in community information initiatives will act as a resource to each other, particularly among like projects. URLs for analytics tools are compiled in the Appendix.

22 Measuring the Online Impact of Your Information Project
© FSG Social Impact Advisors
V. Appendix
A. About
B. KCIC projects and websites
C. Sample key performance indicator (KPI) dashboard
D. Web and social media analytics tools
23
A. About
FSG Social Impact Advisors (www.fsg‐impact.org)
FSG is a nonprofit consulting firm specializing in research, strategy, and evaluation. Founded in 2000 as Foundation Strategy Group, today FSG works across all sectors in every region of the globe—partnering with foundations, corporations, nonprofit and governments to develop more effective solutions to the world’s most challenging issues. The FSG team cares deeply about social impact. We have a passion for solving problems—and the right combination of on-the-ground experience and world-class consulting talent to achieve results. We create fresh ideas and practical tools that boost the success of change makers in all sectors. We consult with clients to build strategies that lead to powerful results in their areas of focus. And we connect peers to each other and with proven practices, so each gains from the knowledge of all. FSG brings together leaders that are hungry to exchange information, elevate learning, and to create collective impact for shared priorities in social change. FSG is the Knight Foundation’s evaluation partner for the Community Information Challenge. Team members John Kania, Katelyn Mack, Ellen Martin, Marina Pol Longo and Hallie Preskill all contributed to this document.
Dana Chinn
Dana Chinn is a full-time faculty member at the USC Annenberg School for Communications and Journalism. Her research and consulting activities focus on web analytics, media audiences, and news business models. Her blog, NewsNumbers.com, translates best practices in e-commerce web analytics for news and nonprofit organizations.
She is currently developing USC Annenberg programs that will partner journalism, business and engineering students together with local news and nonprofit organizations to help them explore web analytics, mobile news and other digital initiatives.
Her work experience includes management positions in online planning and operations, strategic planning, marketing and finance at Gannett and the Los Angeles Times. She has an undergraduate degree in journalism and an MBA from USC.

24 Measuring the Online Impact of Your Information Project
© FSG Social Impact Advisors
B. KCIC projects and websites
Project (KCIC Grantee) URL
BCTV.org (Berks County Community Foundation) bctv.org
BGTIME.org (Central Carolina Community Foundation)
bgtime.org
CommonWealth Magazine (Boston Foundation) http://www.commonwealthmagazine.org/
Connect Network (Community Foundation Serving Richmond and Central Virginia)
http://connectrichmond.org/ or connectnetwork.org
CU Citizen Access (Marajen-Stevick Foundation) http://cu-citizenaccess.org/
Gables Home Page (Coral Gables Community Foundation)
gableshomepage.com
Manatee Connects (Manatee Community Foundation) http://manateeconnects.org/
MinnPost (Minneapolis Foundation) http://www.minnpost.com/communitysketchbook/
MN Idea Open (Minnesota Community Foundation) mnideaopen.org
Park City Green (Park City Foundation) parkcitygreen.org
Regional Information Initiative (San Diego Foundation)
http://voiceofsandiego.org/
The Notebook (William Penn Foundation) thenotebook.org
The Rapidian (Grand Rapids Community Foundation) therapidian.org
Valley Independent Sentinel (Community Foundation of Greater New Haven)
http://valleyindependentsentinel.org/
YourPBC (Community Foundation for Palm Beach and Martin Counties)
yourpbc.org

25 Measuring the Online Impact of Your Information Project
C. Sample Key Performance Indicators (KPI) dashboard

26 Measuring the Online Impact of Your Information Project
© FSG Social Impact Advisors
D. Web and social media analytics tools
The resources below are available for free.
Google Analytics: http://www.google.com/analytics/
My Tweeple: http://www.mytweeple.com
TweetStats: http://www.tweetstats.com
TweetBeep: http://www.tweetbeep.com
Web analytics for news organizations bookmarks: http://www.delicious.com/danachinn
Other resources are available at a modest purchase price. Web analytics concepts
Web Analytics: An Hour a Day, and Web Analytics 2.0, by Avinash Kaushik
Actionable Web Analytics, by Jason Burby and Shane Atchison
Social Media Metrics, by Jim Sterne
Google Analytics
Advanced Web Metrics with Google Analytics (second edition), by Brian Clifton
Introductory Google Analytics courses (offered by many independent vendors, such as http://www.seminars.websharedesign.com)
“Applying Google Analytics Goal and Funnel Techniques,” by Justin Cutroni for Public Media Metrics, a research organization for public radio and TV. Available at http://publicmediametrics.com/sections/5/projects This article walks readers step-by-step on how to set up Google Analytics goals and funnels for tracking donation functions.