measuring equity in higher education: an accountability
TRANSCRIPT
AUGUST 24, 2005 NUMBER 2
Measuring Equity in Higher Education: An Accountability Framework for California Colleges and Universities
Performance gaps point to the need for an accountability system in California. SUMMARY California does not have a formal accountability system for its public colleges and universities. Estela Bensimon’s Academic Equity Scorecard provides a framework to model a higher education accountability system by calling attention to both the equity of opportunities and the equity of outcomes across all subpopulations of the state. Data from the California Postsecondary Education Commission (CPEC) reveals that Latinos and African Americans attend California’s colleges and universities in lower numbers than they represent in the general population. Equally important, according to Bensimon, is the disproportionately low number of degrees awarded to Latinos and African Americans by the University of California (UC) and California State University (CSU) systems. KEY FINDINGS AND DATA POINTS Enrollment in colleges and universities is one measure of equity that can be considered by policymakers. Additionally, completion rates can also be considered as an additional measure of equity. By considering both, policymakers can begin to consider equity of opportunities and equity of outcomes as they assess the performance of public colleges and universities.
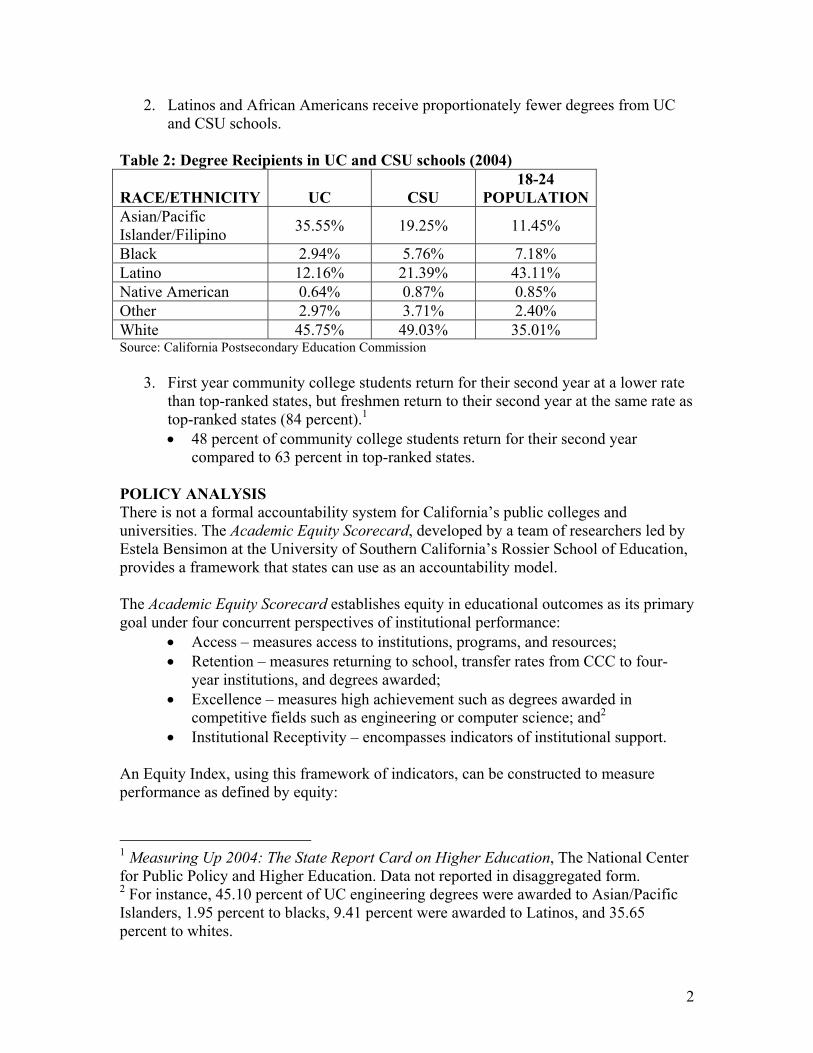
1. Latinos and African Americans enroll in UC, CSU, and California Community Colleges (CCC) at lower rates than whites or Asian/Pacific Islanders.
Table 1: Enrollments in Public Colleges & Universities (All Degrees, 2004)
RACE/ETHNICITY UC CSU CCC 18-24
POPULATIONAsian/Pacific Islander/Filipino 36.79% 22.42% 16.99% 11.45%
Black 3.33% 6.49% 8.03% 7.18% Latino 13.75% 24.48% 30.47% 43.11% Native American 0.66% 0.83% 0.96% 0.85% Other 2.75% 3.16% 2.08% 2.40% White 42.72% 42.62% 41.46% 35.01% Source: California Postsecondary Education Commission
• Less than nine percent of graduate school enrollments in the UC system are Latinos.
• More than 58 percent of graduate school enrollments in the UC system are whites.
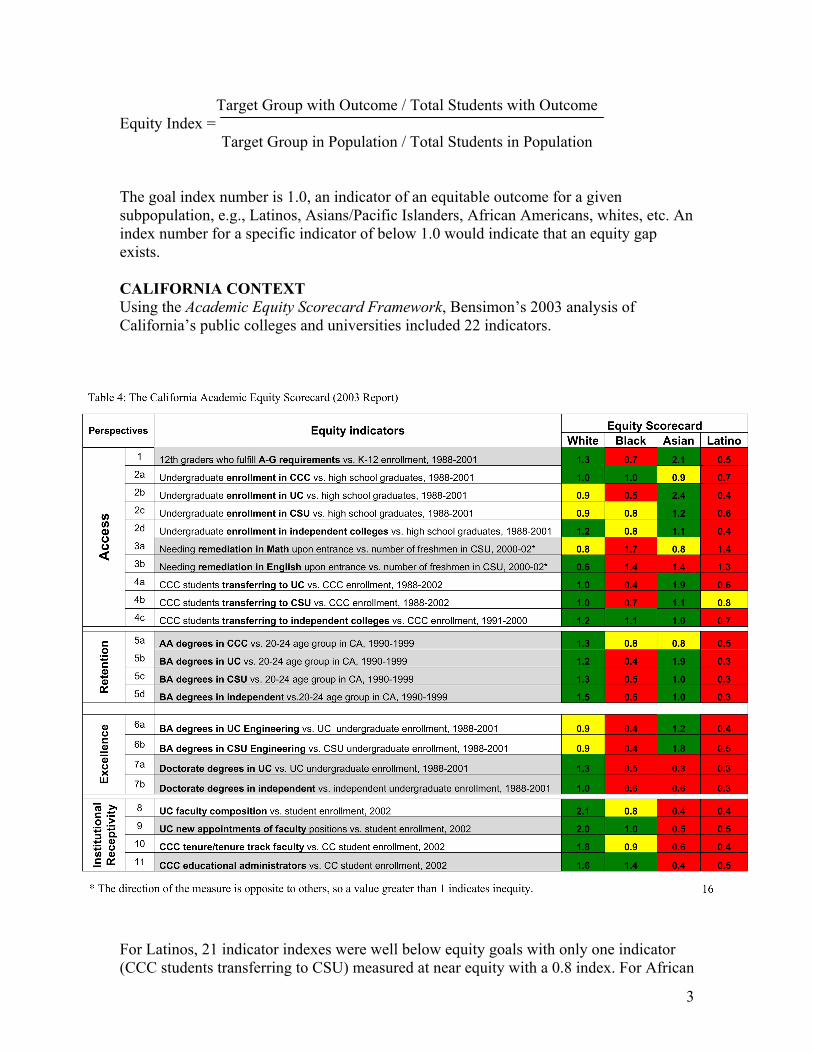
2. Latinos and African Americans receive proportionately fewer degrees from UC and CSU schools.
Table 2: Degree Recipients in UC and CSU schools (2004)
RACE/ETHNICITY UC CSU 18-24
POPULATION Asian/Pacific Islander/Filipino 35.55% 19.25% 11.45%
Black 2.94% 5.76% 7.18% Latino 12.16% 21.39% 43.11% Native American 0.64% 0.87% 0.85% Other 2.97% 3.71% 2.40% White 45.75% 49.03% 35.01% Source: California Postsecondary Education Commission
3. First year community college students return for their second year at a lower rate than top-ranked states, but freshmen return to their second year at the same rate as top-ranked states (84 percent).1 • 48 percent of community college students return for their second year
compared to 63 percent in top-ranked states. POLICY ANALYSIS There is not a formal accountability system for California’s public colleges and universities. The Academic Equity Scorecard, developed by a team of researchers led by Estela Bensimon at the University of Southern California’s Rossier School of Education, provides a framework that states can use as an accountability model. The Academic Equity Scorecard establishes equity in educational outcomes as its primary goal under four concurrent perspectives of institutional performance:
• Access – measures access to institutions, programs, and resources; • Retention – measures returning to school, transfer rates from CCC to four-
year institutions, and degrees awarded; • Excellence – measures high achievement such as degrees awarded in
competitive fields such as engineering or computer science; and2 • Institutional Receptivity – encompasses indicators of institutional support.
An Equity Index, using this framework of indicators, can be constructed to measure performance as defined by equity:
1 Measuring Up 2004: The State Report Card on Higher Education, The National Center for Public Policy and Higher Education. Data not reported in disaggregated form. 2 For instance, 45.10 percent of UC engineering degrees were awarded to Asian/Pacific Islanders, 1.95 percent to blacks, 9.41 percent were awarded to Latinos, and 35.65 percent to whites.
2
Target Group with Outcome / Total Students with Outcome Equity Index =
Target Group in Population / Total Students in Population The goal index number is 1.0, an indicator of an equitable outcome for a given subpopulation, e.g., Latinos, Asians/Pacific Islanders, African Americans, whites, etc. An index number for a specific indicator of below 1.0 would indicate that an equity gap exists. CALIFORNIA CONTEXT Using the Academic Equity Scorecard Framework, Bensimon’s 2003 analysis of California’s public colleges and universities included 22 indicators.
For Latinos, 21 indicator indexes were well below equity goals with only one indicator (CCC students transferring to CSU) measured at near equity with a 0.8 index. For African
3
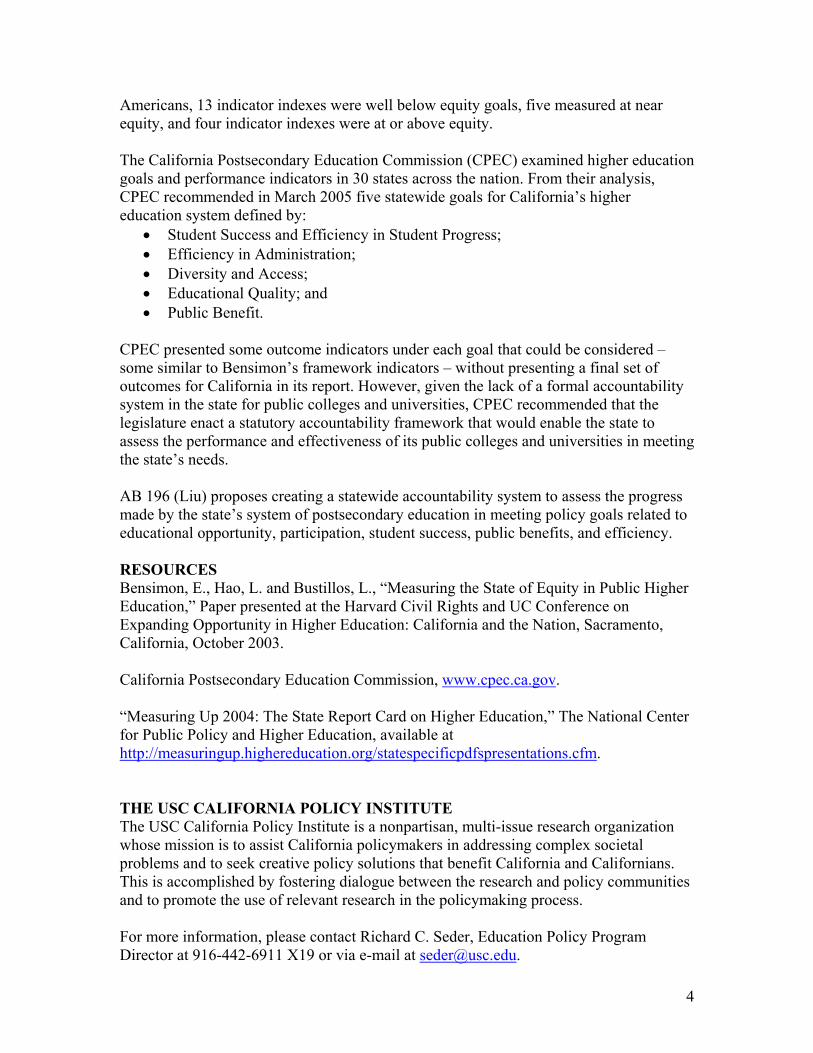
Americans, 13 indicator indexes were well below equity goals, five measured at near equity, and four indicator indexes were at or above equity. The California Postsecondary Education Commission (CPEC) examined higher education goals and performance indicators in 30 states across the nation. From their analysis, CPEC recommended in March 2005 five statewide goals for California’s higher education system defined by:
• Student Success and Efficiency in Student Progress; • Efficiency in Administration; • Diversity and Access; • Educational Quality; and • Public Benefit.
CPEC presented some outcome indicators under each goal that could be considered – some similar to Bensimon’s framework indicators – without presenting a final set of outcomes for California in its report. However, given the lack of a formal accountability system in the state for public colleges and universities, CPEC recommended that the legislature enact a statutory accountability framework that would enable the state to assess the performance and effectiveness of its public colleges and universities in meeting the state’s needs. AB 196 (Liu) proposes creating a statewide accountability system to assess the progress made by the state’s system of postsecondary education in meeting policy goals related to educational opportunity, participation, student success, public benefits, and efficiency. RESOURCES Bensimon, E., Hao, L. and Bustillos, L., “Measuring the State of Equity in Public Higher Education,” Paper presented at the Harvard Civil Rights and UC Conference on Expanding Opportunity in Higher Education: California and the Nation, Sacramento, California, October 2003. California Postsecondary Education Commission, www.cpec.ca.gov. “Measuring Up 2004: The State Report Card on Higher Education,” The National Center for Public Policy and Higher Education, available at http://measuringup.highereducation.org/statespecificpdfspresentations.cfm. THE USC CALIFORNIA POLICY INSTITUTE The USC California Policy Institute is a nonpartisan, multi-issue research organization whose mission is to assist California policymakers in addressing complex societal problems and to seek creative policy solutions that benefit California and Californians. This is accomplished by fostering dialogue between the research and policy communities and to promote the use of relevant research in the policymaking process. For more information, please contact Richard C. Seder, Education Policy Program Director at 916-442-6911 X19 or via e-mail at [email protected].
4