dws: measuring physical climate risk in equity...
TRANSCRIPT

Deutsche Asset Management
MEASURING PHYSICAL CLIMATE RISK IN EQUITY PORTFOLIOS
November 2017

climate hazards. For instance, more energy and water intensive industries will be more directly affected by extreme heat and water scarcity while sectors such as construction, mining, retail, tourism and agriculture will be particularly sensitive to daily weather fluctuations.
Thankfully for investors, this white paper does all of that. We leverage data analytics from Four Twenty Seven, which maps the physical locations of corporate facilities around the world alongside climate models. Four Twenty Seven’s scoring methodology identifies both the geographic exposure to climate hazards of individual companies, but, also the business sensitivity of facilities or companies to those hazards. In our view, this delivers powerful results since we can now identify over a million corporate sites and the risks to each site from heat stress, extreme rainfall, water stress and sea level rise.
Asia is particularly vulnerable since five out of six people occupying the highest climate risk zones globally live there. The Asian Development Bank warned that, without mitigation action, Asia will experience temperature rise of six degrees centigrade by the end of the century.2
3
At the end of last week, the US Global Change Research Program Climate Science Special Report stated that it is extremely likely that human activities, especially emis-sions of greenhouse gases, are the dominant cause of the observed warming since the mid-20th century.1 Thus far, investors’ approach to boosting climate resilience has typically involved measuring the carbon emissions of issuers in their investment portfolios. This carbo-foot-printing exercise helps assess the transition risk (i.e. the transition to a low-carbon economy) to a portfolio as global efforts to limit temperature rise below two degrees centigrade gather momentum. However, this strategy fails to take into account the physical risks of climate change, such as sea level rise, droughts, flooding, and cyclones. These, in our mind, pose a far more immediate threat to investment portfolios.
Addressing this gap, however, is far from easy. To do so, investors first need to identify the physical locations of the companies they invest in, a task made tricky by the generally poor corporate disclosure around these topics. Investors then need to master the increasingly complex science around climate change to understand the vulnerability of these corporate production and retail sites. And finally, investors would need to account for the nature of the business activity being carried out in these locations to gauge the sensitivity to specific
Executive summary
This white paper provides some of the tools that investors need to more accurately monitor and address the physical effects of climate change on investment portfolios. The objective is to satisfy institutional investors’ growing desire for more climate resilient portfolios given the increasing frequency and intensity of natural disasters.
Of extreme concern is the region’s vulnerability to sea level rise. For example, China leads the world in terms of coastal risk with 145 million people and economic assets living on land ultimately threatened by rising seas.3 Hence, Four Twenty Seven has mapped the physical climate risks for 500 large and mid-cap constituents of an Asia ex-Japan listed equity index.
We believe investors have no place to hide when it comes to the effects of physical climate change since even if emissions were cut to zero tomorrow, society
will still face intensifying extreme weather events over the next several decades. We are keen to promote the disclosure by companies of annual and once in a lifetime climate risks so that we can manage these risks even more accurately going forward.
We hope you find this white paper informative and we very much look forward to discussing with you the ways to address the multitude of risks and opportunities phys-ical climate risk presents to corporates, investors, and regulators around the world.
1 NUSGRCP (November 2017): Climate Science Special Report: Fourth National Climate Assessment, Volume I [Wuebbles, D.J., D.W. Fahey, K.A. Hibbard, D.J. Dokken, B.C. Stewart, and T.K. Maycock (eds.)]. U.S. Global Change Research Program, Washington, DC, USA, 470 pp.2 Asian Development Bank and Potsdam Institute for Climate Impact Research (July 2017). A Region at Risk: The Human Dimensions of Climate Change in Asia and the Pacific.3 Climate Central (November 2015): Rising Seas Threaten Land Home to Half a Billion Whilst Deutsche Asset Management makes reasonable efforts to check the accuracy of the scoring methodology and data from Four Twenty Seven, it cannot guarantee the accuracy of this information
SUMMARY
This white paper has been written by Four Twenty Seven, the California based award-winning market intelligence and research firm specialized on the economic risk of climate change.
Important InformationNothing contained herein is fiduciary or impartial investment advice that is individualized or directed to any plan, plan participant, or IRA owner regarding the advisability of any investment transaction, including any IRA distribution or rollover.
Past performance is not indicative of future returns.
Forecasts are based on assumptions, estimates, opinions and hypothet-ical models that may prove to be incorrect. Investments come with risk. The value of an investment can fall as well as rise and your capital may be at risk. You might not get back the amount originally invested at any
point in time. The comments, opinions and estimates contained herein are based on or derived from publicly available information from sources that we believe to be reliable. We do not guarantee their accuracy. This material is for informational purposes only and sets forth our views as of this date. The underlying assumptions and these views are subject to change without notice.
Deutsche Assset Management represents the asset management activi-ties conducted by Deutsche Bank AG or any of its subsidiaries.
© November 2017 Deutsche Asset Management UK Ltd. I- 053295-1(11/17)
Deutsche Asset Management and its affiliates are not affiliated with 427 or Trucost. The material is provided as informational and not a recommenda-tion for the purchase or sale of any investment security. This material is not provided as an endorsement of Deutsche Asset Management or any of its products or services.
Michael LewisHead of ESG Thematic [email protected]
Murray BirtESG Thematic Research [email protected]
In August and September 2017, for the first time in 166 years of weather records,1 the United States saw three Category 4 hurricanes make landfall in the same year.2 Estimates of the cost of destruction range from $65 billion to $190 billion, surpassing Hurricane Katrina’s record of $62 billion in 2005.3 The storms caused a downward revision of economic growth estimates, as Goldman Sachs decreased its fourth quarter GDP growth forecast for the US by 0.8 percentage points due to Harvey and Irma.4 This series of devastating hurricanes is a dire reminder that wealth is no protection from extreme weath-er events. The higher the value of assets, the greater the economic impact of climate-related events.
North America, however, is not the only region experiencing the wrath of climate change. In South Asia, the devastation from extreme storms and flooding throughout August 2017 affected over 16 million people, leaving more than 1,200 dead.5 The city of Mumbai, India’s financial capital, suffered its worst flooding since 2005. In Nepal, more than 20 per cent of the popula-tion was affected by severe flooding in the southern plains, known as Terai, which is also the most fertile region in the country. Around 80 per cent of the crops was damaged.6,7
Natural disasters have always been with us. However, they are now becoming more frequent, more intense, and importantly, more predictable. Climate science points to an increase in extreme weather events and long term clima- tic changes that will dramatically alter the environment upon which human societies and economic activity depends. Ignoring this extensive body of climate science and the unambiguous signals of long-term risks is a massive market failure.
The wrath of climate change
INTRODUCTION
5

A MAJOR DATA GAP A MAJOR DATA GAP
6
from these companies is spotty at best.12, 13 The lack of usable, relevant data on the projected impacts of climate change on publicly-traded companies and other under-lying assets is a major concern to the financial system at large and hampers portfolio managers’ abilities to devise a risk management strategy.14
To address this data gap, Four Twenty Seven, a market intelligence company specializing in analysis of the phys-ical risk of climate change, has developed a model that leverages global climate data to provide asset-level risk assessments of corporations and score public equities’ exposure to climate change impacts. Screening hundreds of thousands of corporate facilities around the globe using big data analytics technology, Four Twenty Seven provides a concise yet thorough view of each compa-ny’s exposure to the physical impacts of climate change across its value chain.
Yet today, investors lack the tools to anticipate, quantify, and respond to the oncoming impacts of extreme weather events on their equity portfolios.8 Dozens of sophisticat-ed climate models run by the world’s leading academic institutions forecast changes in the earth’s systems, but their outputs are extremely complex and require special-ized programming skills and computers to access and process.9 Raw climate data comes by the terabytes and comprises dozens of indicators that provide a detailed picture of forecasted changes to the planet’s physical systems, but that do not speak to impacts on human and economic systems.
Compounding this issue, investors typically do not know the location of the corporate facilities of the corporations they invest in10 and are thus unable to assess the risk to their portfolio companies.11 Few corporations have per-formed their own climate risk assessments, and disclosure
A major data gap
Sea ice concentration (%)
22 24 26 28 30 32-2 0 2 4 6 8 10 12 14 16 18 20
Sea surface temperatur (C°)
-2 0 2 4 6 8 10 12 14 16 18 20 22 24 26 28 30 32
Figure 1. Climate models simulate earth’s systems
Source: National Center for Atmospheric Research
Investors and regulators call for disclosure
Global asset management firms including Deutsche Asset Management,15 BlackRock,16 State Street,17 Vanguard,18 Amundi,19 and Schroders,20 as well as institutional investors in Europe and in the US, are acutely aware of climate risks and are raising the alarm with their investors and portfolio compa-nies. Financial regulators are also stepping up their efforts to address the “Tragedy of the Horizon” – an expression coined by Mark Carney, Governor of the Bank of England and Chair of the G20 Financial Stability Board (FSB).21 Carney cites outcomes like the impact of rising seas on the world’s coastlines and infrastructure as one of the largest risks to financial stability around the world.
Under Carney’s leadership, the FSB created an industry Taskforce on Climate-related Financial Disclosures (TCFD) led by Michael Bloomberg.
In June 2017, the Taskforce released its guidance for investors and corporations on better assessing and disclosing climate risk.22 The TCFD breaks down climate risk into two distinct categories: Energy Transition risk and Physical risk. Energy Transition risk refers to the potential large-scale impacts of rapidly decarbonizing our economies and energy systems. Physical climate risk includes both shocks and stresses from climate impacts. The TCFD recommendations come among growing regulatory pressures in Europe. Article 173, part of the French Energy Transition for Green Growth Law, pioneered the field by requiring institutional investors to disclose climate risk in their portfolio, including both transition and physical risk.23
7

SECTION I - PHYSICAL CLIMATE RISK SCORES SECTION I - PHYSICAL CLIMATE RISK SCORES
8
Four Twenty Seven’s physical risk score comprises three key components: Operations Risk, Supply Chain Risk, Market Risk (Figure 2).
Operations Risk is assessed at the facility-level, whereby thousands of corporate facilities are screened individu-ally for their exposure to climate risk, accounting for the fact that different facilities have different sensitivity to specific hazards. Each company receives a composite Operations Risk score that is an aggregate of facility scores, reflecting both exposure and sensitivity to cli-mate hazards. The other components, Supply Chain Risk and Market Risk, are scored using company financial data on production, revenues, and other fundamentals.
Each dimension of risk is scored on a scale of 0 to 100, from the most exposed (low score) to the least exposed (high score). Scores are normalized so companies’ climate risk can be compared across diverse portfolios. This approach enables the quantification of the many factors and risks that may affect the future value of a company, providing investors with a concise, standard-ized measure of physical climate risk. This integrated measure provides a point of entry to understand and address climate risk, engage with corporations, and identify risk mitigation strategies.
Figure 3 provides an example of the relative performance of France’s 40 largest companies from the benchmark in-dex CAC40. Market and supply chain risk score is shown the X-axis and operations risk score on the Y-axis.
These changes in the natural environment affect econom-ic activity through disruptive events, changes in resource availability (freshwater, coastal real estate), commodity price volatility, and reduced human health.26 Further, climate change and extreme weather events increase environmental and socioeconomic vulnerability, exacer-bating poverty, and driving new migration patterns.27
Different industries and sectors will experience different impacts, depending on their sensitivity to factors such as weather and natural resource availability. Resource- intensive sectors that consume a lot of energy and water in their production processes will be more directly affected by extreme heat and water scarcity than sectors that do not, such as service-based industries. Similarly, those sectors most sensitive to daily weather fluctua-tions – such as construction, mining, retail, tourism and recreation, and agriculture – are more likely to experience a reshaping of their markets, seeing new risk but also opportunities arise in response to shifts in demand.
To capture the nuance and diversity of these risk and opportunity drivers, Four Twenty Seven’s scoring meth-odology includes an array of indicators, each focused on a distinct driver of climate risk. Company scores include both geographic exposure to climate hazards and business sensitivity of facilities or companies to those hazards. Four Twenty Seven’s methodology was developed with a focus on the business-climate nexus, based on published research of how climate risks affect companies.
Modelling a complex reality
SECTION I - PHYSICAL CLIMATE RISK SCORES
Figure 3. Best and worst-in-class in France’s CAC40
© Four Twenty Seven, Inc. All Rights Reserved.
MichelinKering
BNP ParibasAXA Capgemini
Publicis Groupe
Société GénéraleAtos
OrangeCarrefour
Unibail-Rodamco
Sodexo Vivendi
AccorSaint-Gobain
Bouygues
VINCI
Veolia Environnement
Sanofi
Safran
TotalNokia
PeugeotRenault
LVMHL‘Oreal
Airbus
TechnipFMC
Schneider Electric
Essilor International
Pernod Ricard
ArcelorMittal
Air Liquide
Danone
LafargeHolcim
Solvay
Valeo
ENGIE
Rating
BEST
BELOW AVERAGE
WORST
ABOVE AVERAGE
AVERAGE
1%
Weight (%)
4%
8%
6%
9%
2%
Credit Agricole
Legrand
The effects of climate change will be ubiquitous but uneven, ranging from those that disrupt daily life, such as damaged or flooded infrastructure, to more gradual impacts like declines in labor productivity24 and widespread threats to global welfare through decreased crop yields.25
Figure 2. Four Twenty Seven’s climate risk indicators
© Four Twenty Seven, Inc. All Rights Reserved.
Physical Risk Score
Country ofOrigin
ResourcesDemand
Supply Chain
Risk Score
Water Stress
Heat Stress
ExtremPrecipitation
Country ofSales
WeatherSensitivity
MarketRisk Score
Sea Level Rise
Wild-fires
Hurricans &Typhoons
Operations Risk Score
Market & Supply Chain Risk Score
Ope
ratio
ns R
isk
Sco
re
9
This information is intended for informational purposes only and does not constitute investment advice, a recommendation, an offer or solicitation.

10
SECTION I - PHYSICAL CLIMATE RISK SCORES SECTION I - PHYSICAL CLIMATE RISK SCORES
facility’s own sensitivity to that hazard. For example, a water-intensive facility in a drought-prone region will have a higher Water Stress score than another facility in the same region that does not rely as heavily on fresh water.
Specific climate hazards included in the Operations Risk scores include heat stress, water stress, extreme pre-cipitation, sea level rise, hurricanes, and wildfires. Opera-tions Risk also includes a measure of socioeconomic risk to each asset based on the country where it is located. This measure is based on a subset of indicators from the 427 Country Climate Risk Index.
Perhaps the most telling metric of a company’s climate risk is the location of its assets and their exposure to changing extreme weather patterns. The geographic areas on which a company depends to produce, manu-facture, deliver, and sell goods, are a powerful indicator of its fundamental exposure to future climate risks.
Operations Risk indicators measure the exposure and sensitivity of a company’s assets to physical climate risks. The company level score is based on the level of exposure of its assets (manufacturing plant, distribution center, warehouse, offices, other investments such as real estate, etc.). A facility’s individual score is a combi-nation of the local exposure to climate hazards and the
Operations risk
CLIMATE HAZARD DESCRIPTION POTENTIAL BUSINESS IMPACTS
Heat Stress Increase in temperature
– Increased energy costs
– Heightened risk of brownouts/power outages
– Stress on human health/ labor force
Water StressChange in water supply
and demand
– Reduced water supply
– Increased water costs
– Social license to operate/reputation
Extreme Precipitation Intense rainfall events
– Property and building damage
– Compromised infrastructure
– Business interruptions
Wildfire Change in fire conditions – Permanent loss of property value
– Relocation costs
Sea level riseHeightened storm surge,
augmented by sea level rise
– Nuisance floods, property damage
– Permanent loss of property value
– Relocation costs
Cyclones, Hurricanes,
TyphoonsExposure to past cyclones
– Severe property damage
– Permanent loss of property value
– Relocation costs
Socio-economic
vulnerability
Social unrest, migration or economic
disruption exacerbated or induced by
climate change
– Business interruptions, property damages
– Impact on workforce
– Social license to operate
Operations risk indicators
Figure 4 maps CAC40 sites and shows their relative exposure to extreme precipitation. Facilities in red or orange have the highest exposure to extreme precipita-tion and conditions that might lead to flooding. Overall, Four Twenty Seven’s global facility database contains over a million corporate sites.
Developing the Operations Risk scores for the French 40 multinational companies displayed below involved mapping over 68,000 sites and gathered information specific to each facility: geographic location and primary function. Four Twenty Seven performs a climate risk assessment of each unique facility using global climate models statistically downscaled by the U.S. National Air and Space Agency (NASA) to a 25km2 precision. We evaluate site risk by comparing projected changes to current conditions.
Figure 4. CAC40 facilities and extreme precipitation risk
© 2017 Four Twenty Seven, Inc. All Rights Reserved.
11

12
SECTION I - PHYSICAL CLIMATE RISK SCORES SECTION I - PHYSICAL CLIMATE RISK SCORES
This industry-based approach offers insight into likely upstream risks for a company without directly identifying a company’s suppliers. Using detailed trade flow data, Four Twenty Seven maps the network of countries con-tributing to each industry’s supply chain and combines it with the relative climate risk for each of those countries. Countries individual exposure is scored using the 427 Country Climate Risk Index (see below).
Climate change risks can multiply through global supply chains. Disruption may stem from extreme weather events, but also from climatic changes to regions for crop farming, mineral extraction, or fluctuation of production or transportation costs. Four Twenty Seven evaluates the level of climate risk in a company’s supply chain with two indicators. The Country of Origin indicator is a meas-ure of the risk in countries that export the commodities a company depends on. The Natural Resources indicator measures the level of the industry’s dependency on climate-sensitive resources such as water, land, and energy across the supply chain.
Supply chain risk
Supply chain indicators Market risk indicators
Each company is evaluated for Market Risk according to two measures: where it generates its sales and how its industry has historically responded to weather variability. For Country of Sales Risk, we use reported and modeled company revenue data and apply scores for the 427 Country Climate Risk Index to countries that contribute to a company’s revenues. For Weather Sensitivity, we analyze the elasticity of consumption and production to historical variability in temperature and precipitation patterns. These two measures are combined to con-stitute Market Risk and reflect the degree to which a company’s sales may fluctuate following regional climate impacts or prolonged stresses originating from changes in weather patterns.
Market Risk scores provide insights into the heart of a business’ concern: its primary customers, markets, and sales. The metric estimates how patterns of purchasing and consumption may fluctuate because of climate change. Indeed, shifts in markets, economic welfare, and consumer preferences follow changes in weather patterns for a number of commodities. The macroeco-nomic impact of climate change on regional economies and productive capacity becomes an indirect driver of risk and opportunities for companies that operate in that market.
Market risk
13
INDICATORS DEFINITION POTENTIAL BUSINESS IMPACTS
Country of
Origin
Measures current and future levels
of climate risk in countries that
contribute to sector production and
re-export activities
– Distribution delays and disruption
– Supply shortages
– Maladaptation or resource mismanagement
– High price sensitivity
– Susceptibility to hazards and climate risks
Resource
Demand
Measures sector dependence on
natural resources: water, energy
and land
– Supply shortages
– High input costs
– Social license to operate
– Reputation risks
INDICATORS DEFINITION POTENTIAL BUSINESS IMPACTS
Country of
Sales
Measures current and future levels of
climate risk in countries that contribute
to company revenues
– Interruptions at points of sale
– Change in customer welfare and economic conditions
– Changes in customer preferences and market opportunities
– Migrations, conflicts, and risk of political disruption
Weather
Sensitivity
Measures the sensitivity of a sector
to weather variability
– Volatility in sales and revenues
– Higher inventory costs
– Changing consumer preferences
14
SECTION I - PHYSICAL CLIMATE RISK SCORES SECTION I - PHYSICAL CLIMATE RISK SCORES
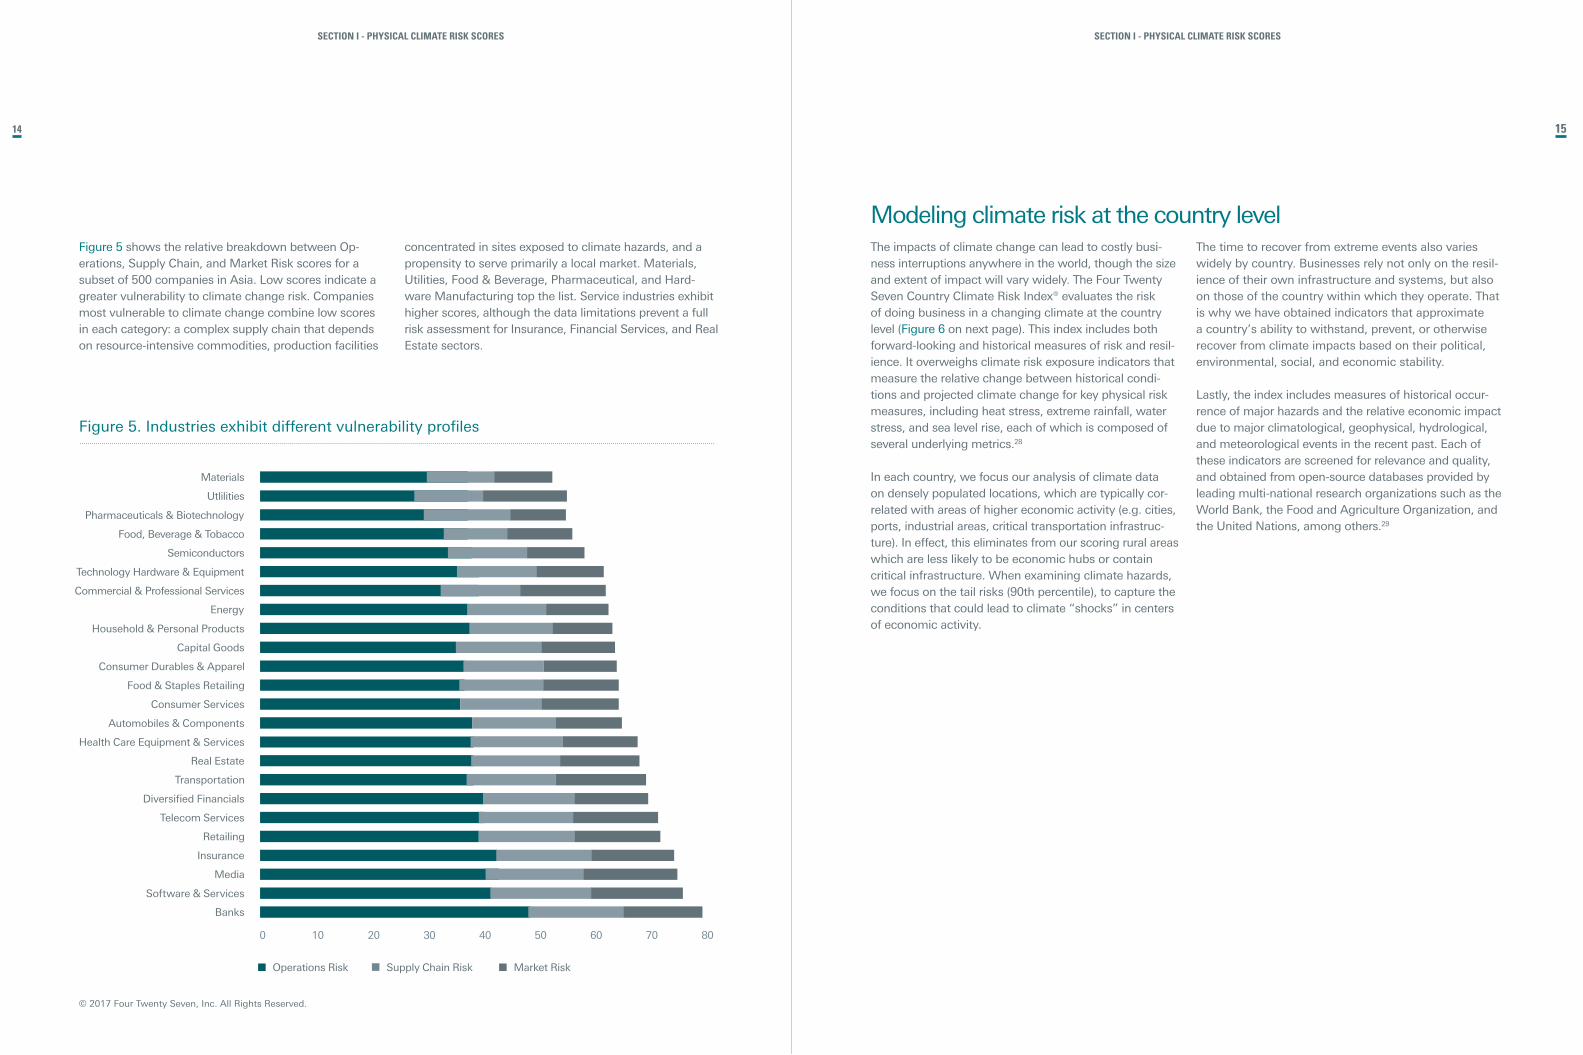
Figure 5 shows the relative breakdown between Op-erations, Supply Chain, and Market Risk scores for a subset of 500 companies in Asia. Low scores indicate a greater vulnerability to climate change risk. Companies most vulnerable to climate change combine low scores in each category: a complex supply chain that depends on resource-intensive commodities, production facilities
concentrated in sites exposed to climate hazards, and a propensity to serve primarily a local market. Materials, Utilities, Food & Beverage, Pharmaceutical, and Hard-ware Manufacturing top the list. Service industries exhibit higher scores, although the data limitations prevent a full risk assessment for Insurance, Financial Services, and Real Estate sectors.
The impacts of climate change can lead to costly busi-ness interruptions anywhere in the world, though the size and extent of impact will vary widely. The Four Twenty Seven Country Climate Risk Index® evaluates the risk of doing business in a changing climate at the country level (Figure 6 on next page). This index includes both forward-looking and historical measures of risk and resil-ience. It overweighs climate risk exposure indicators that measure the relative change between historical condi-tions and projected climate change for key physical risk measures, including heat stress, extreme rainfall, water stress, and sea level rise, each of which is composed of several underlying metrics.28
In each country, we focus our analysis of climate data on densely populated locations, which are typically cor-related with areas of higher economic activity (e.g. cities, ports, industrial areas, critical transportation infrastruc-ture). In effect, this eliminates from our scoring rural areas which are less likely to be economic hubs or contain critical infrastructure. When examining climate hazards, we focus on the tail risks (90th percentile), to capture the conditions that could lead to climate “shocks” in centers of economic activity.
Modeling climate risk at the country levelThe time to recover from extreme events also varies widely by country. Businesses rely not only on the resil-ience of their own infrastructure and systems, but also on those of the country within which they operate. That is why we have obtained indicators that approximate a country’s ability to withstand, prevent, or otherwise recover from climate impacts based on their political, environmental, social, and economic stability.
Lastly, the index includes measures of historical occur-rence of major hazards and the relative economic impact due to major climatological, geophysical, hydrological, and meteorological events in the recent past. Each of these indicators are screened for relevance and quality, and obtained from open-source databases provided by leading multi-national research organizations such as the World Bank, the Food and Agriculture Organization, and the United Nations, among others.29
Figure 5. Industries exhibit different vulnerability profiles
© 2017 Four Twenty Seven, Inc. All Rights Reserved.
Market RiskSupply Chain RiskOperations Risk
15

16
SECTION I - PHYSICAL CLIMATE RISK SCORES SECTION I - PHYSICAL CLIMATE RISK SCORES
– There may be reputational risks for companies whose preparation and responses to climate change events will be scrutinized by the public.31 Conversely, some companies are concerned over first mover’s disadvan-tage and triggering a backlash as they provide more information on their exposure than their competitors.
– Lastly, an assessment of corporate resilience is critical to gaining a full picture of risk in a portfolio. A robust risk management process, a management style that enables companies to better process and assimilate new information, a culture of innovation, and pro- active engagement in responsible corporate adaptation will be a key driver of success in a changing climate.32
These drivers of risk are not currently included in our set of indicators, but constitute the next frontier to gain a more comprehensive and nuanced understanding of all facets of company vulnerability to climate change. The disclosures called for by the TCFD may help bring some of these dimensions to light.
The impacts of climate change span much more than a company’s physical assets, ranging from its finances to its reputation.
– Financial risk can go beyond recovering from an extreme weather event. Even a company that was not directly affected might be financially impacted. For example, through a gradual increase in its operational expenses due to rising insurance costs, a default in bank loans or other debt, or at a more macro-level, lower consumption levels.
– Climate change can trigger regulatory risk as gover-ments prepare to deal with the potential hazards from climate change. Changes to zoning laws due to sea level rise, for example, could dramatically impact real estate prices.
– Litigation risk might also arise as climate change sparks breaches of fiduciary duty around improper or insufficient disclosure, negligence in allowing exposure to climate change, or breaches of contracts with suppliers (e.g., due to non-delivery of goods) or insurers (e.g., disagreement around the meteorological definition of an event or improperly denied claims).30
The next frontier: Corporate resilience indicatorsFigure 6. The many dimensions of country climate risk
© 2017 Four Twenty Seven, Inc. All Rights Reserved.
Economic Risk
Governance Risk
Social Risk
Environmental Risk
Natural Disaster
Risk
Climate Change
Risk 427 COUNTRY
CLIMATE RISK INDEX
CLIMATE CHANGE EXPOSURE – Changes in heat stress – Changes in heavy rainfall – Exposure to sea level rise
NATURAL DISASTER RISK – Population exposure to hazards – Capital exposure to hazards – Total economic losses – Quality of overall infrastructure
ECONOMIC RISK – Ease of doing business – Energy import dependency – Natural resource dependency – Quality of trade and transport
infrastructure – Control of international distribution – Labor intensity
GOVERNANCE RISK – Conflict and terrorism – Corruption – Regulatory quality – Government effectiveness – Rule of law – Strength of legal rights
SOCIAL RISK – Education – Food security – Human rights – Urbanization rate – Labor rights – Youth male unemployment
ENVIRONMENTAL RISK – Biodiversity loss – Biodiversity & habitat protected – Access to environmental information – Access to environmental litigation – Environmental health risk exposure – Public participation in
environmental review
17

18
SECTION II - CLIMATE RISK IN FAR EAST ASIA
A regional focus
SECTION II – EXPLORING CLIMATE RISK IN FAR EAST ASIA
Asia is expected to increase by 6 degrees Celsius by the end of the century, which will coincide with more extreme tropical storms, increasing pollution, more frequent and severe flooding, and decreased agriculture productivity. 34 Understanding which Asian company is most exposed to these looming hazards is the first step to mitigating risk exposure in an equity portfolio.
This section explores more detailed findings over one such index that includes 500 large and mid-cap constitu-ents and covers all emerging economies in Far East Asia (China, South Korea, Indo nesia, Malaysia, the Philippines, Thailand, etc.) excluding Japan.
The International Monetary Fund’s October 2017 World Economic Outlook emphasizes that adverse economic impacts of rising temperature will affect low-income countries most.33 The Asian Development Bank also recently warned of Asia’s acute vulnerability to climate change: without mitigation action, the temperature in
Four Twenty Seven data for the Oil and Gas sector near Guangzhou and Shenzhen shows a number of high value, long-lived capital assets at high risk of flooding due to combined sea level rise and storm surge.
The Pearl River Delta is already experiencing a higher than average rate of sea level rise, with research sugge-sting that a 30 cm rise in relative sea level at the mouth of the estuary is possible by 2030 (against an average 8 cm globally).38 In addition, tidal variability and storm surge are relatively high. Figure 7 illustrates the number of assets exposed to flood risk in the region under a two-meter flood scenario (which could represent any combination of sea level rise, tide, and storm surge).
Energy assets are long-lived, high value capital assets that cannot be easily moved. Oil platforms and explora-tion wells, power plants, and other energy infrastructure will require protection from rising seas, or will be de-commissioned or moved well before the water reaches the facilities. This creates, at the very least, uncertainty over the long-term viability of such assets, and signals a risk of costly relocation or decommission efforts for the parent companies.
Increased coastal flooding driven by sea level rise is a current climate change impact and an accelerating threat. Five out of six people occupying the highest risk zones globally live in Asia, and delta regions are both economically important and particularly vulnerable in Asia. Princeton, New Jersey-based think tank Climate Central showed that business-as-usual emissions and a 4 degrees Celsius increase in global temperatures could lock in enough sea level rise to submerge land currently home to 470 to 760 million people, with unstoppable rise unfolding over centuries. China leads the world in coastal risk with 145 million people living on land ulti-mately threatened by rising seas if emission levels are not reduced.35
The Guangzhou region in southeast China is one such example of acute concentration of human populations and economic assets in a region prone to floods and vulnerable to sea level rise. Guangzhou and its cluster of cities, including Shenzhen, had a municipal GDP of 2 trillion yuan (280 billion $) in 2016,36 driven by a high concentration of commercial and manufacturing assets. Floods along the Yangtze are frequent and threaten manufacturing, transportation, and supply chains both in China and internationally.37
Sea level rise in the Pearl River Delta
19
SECTION II - CLIMATE RISK IN FAR EAST ASIA
Figure 7. Oil infrastructure in the Guangzhou region is exposed to sea level rise and flood risk.
Source: Climate Central and Four Twenty Seven, Inc. All Rights Reserved.
Company: China Petroleum & Chemical CorpFacility: Gas Stations
Company: China Petroleum & Chemical CorpFacility: Gas Stations
Company: China Shenhua EnergyFacility: Port, Coal Storage and Transfer
Company: CNOOCFacility: Natural Gas Transmission
Company: China Petroleum & Chemical CorpFacility: Petroleum Merchant Wholesalers
Company: China Petroleum & Chemical CorpFacility: Petroleum Pipelines
Company: China Petroleum & Chemical CorpFacility: Gas Stations
Company: China Petroleum & Chemical CorpFacility: Petroleum Merchant Wholesalers
Company: CNOOCFacility: Petroleum Refineries
Four Twenty Seven’s physical climate risk scores to minimize exposure to climate risk while maintaining performance comparable to that of the benchmark index.
The science of sea level rise
DR. BENJAMIN STRAUSS PhD, Climate Central
Global sea level rise is driven by two main factors: first, rising global temperatures are causing water to expand as it warms; and second, warmer tem-peratures are eating away at ice previously locked in land-based glaciers and ice sheets, sending melt-water and icebergs into the ocean. Both phenome-na are well documented, and over the past century or so, oceans all over the world have been creeping steadily higher — about 20 cm (8 in.), on average, since around 1900.
Globally, under business as usual emissions, the seas are likely to rise between 0.6 and 1.0 m (2-3.3 ft.) by century’s end, although rise as high as 2.5 m is plausible.39 However, local increases can vary widely from the global change due to factors such as differences in land subsidence rates, oceanic current shifts and local ocean tem-
perature changes. A complete picture of coastal vulnerability requires developing local sea level projections, integrating them with local flood risks from tides and storms, and comparing projected flood heights against land elevations.
Problematically, however, the widely-used global elevation dataset from NASA averages two meters too high in coastal areas. This overestimation of land elevation means past coastal assessments have been biased toward underestimation of risk. Climate Central has developed a new global coastal elevation dataset, CoastalDEM™; nearly eliminating this bias and setting up uniquely accurate regional and global coastal assessments. Climate Central integrates local sea level projections with local flood height-probability relationships to quantify the expected number of local floods exceeding critical elevations over a fixed period. These results, com-bined with facility locations, feed into Four Twenty Seven’s Operations Risk scores for sea level rise.

20
SECTION II - CLIMATE RISK IN FAR EAST ASIA
21
SECTION II - CLIMATE RISK IN FAR EAST ASIA
workforce is primarily indoors in climate-controlled conditions have been found to suffer diminished perfor-mance during periods of high outdoor temperature.45 Unlike acute weather events that grab headlines, these damages are not always immediately recognized, but this chronic stressor represents a measurable and significant drain on financial performance.
Many of the worst performers in the Far East ex Japan score low on our Heat Stress indicator, in particular com-panies in the Food and Beverage industry, in Southeast Asia such as Nestlé Malaysia, British American Tobacco Malaysia, and Universal Robina Corporation, as well as Materials companies such as Petronas Chemicals Group, Semen Gresik, and Asia Cement Corp, which all rank worst-in-class in their sectors.
One of the largest measurable impacts of climate change on the global economy is the expected decline in labor productivity as temperatures increase, particu-larly in less developed economies that rely more heavily on outdoor industries.40 Even in developed economies, labor productivity improvements have been historically important, and even small percentage reductions in GDP translate into large monetary declines. Research shows that workers subjected to hotter environmental condi-tions show reduced cognitive capacity and endurance, resulting in diminished work intensity and duration.41,42,43 Further, higher temperatures reduce the amount of time that individuals allocate towards labor, reducing avail-able labor supply.44
Industries such as agriculture, construction, utilities, and manufacturing have a higher risk of declining labor performance due to heat, but even industries where the
Impacts of heat on worker productivity
Sony,49 to Thailand’s rice industry, one of the largest exporters in the world.50 Even tourism revenue declined, partially due to the closing of Don Mueang airport, one of the two international airports serving Greater Bang-kok.51 The ripples were also felt worldwide and further up the value chain in the operations of hard drive man-ufacturers like Western Digital and Toshiba52 impacting companies that rely on these parts such as Lenovo.53 The total economic damages ensuing from the Thai floods, both locally and globally, were totaled at almost 44 billion $.54
Annual precipitation in Asia is expected to increase by up to 50 per cent over most land areas in the region, putting coastal and low-lying areas at an increased risk of flooding. Bangkok, along with 12 other Asian cities, is in the top 20 cities globally forecasted to experience the largest growth of annual flood losses from 2005-2050.46 Bangkok is no stranger to flooding, as the 2011 floods were the worst the country had experienced in 50 years.47 The heavy monsoon inundated many indus-trial parks, which hosted over 800 companies.
The economic fallouts of the floods were felt across in-dustries ranging from car manufacturers such as Honda, Toyota, and Ford,48 to companies such as Goodyear and
Extreme precipitation and the 2011 Thailand floods
The technology hardware sector was particularly hit by the floods, as Thailand is home to about a quarter of the world’s manufacturing capacity for hard disk drives.55 The impacts were felt all the way up the stock market: by November 30th, 2011, Thailand’s Stock Exchange Index, the SET, was down by 17 per cent from its July 29th high point, hitting its low for that period a few weeks after, on October 4th, with a drop of 28 per cent.
Using Four Twenty Seven facility maps, we were able to identify precisely which Asian hardware manufactur-ing companies were most affected by the floods: Acer, Lenovo, and Samsung Electro-Mechanics all have facilities in the Bangkok region, as do two smaller Thai firms, KCE and Delta Electronics (see Figure 8).
Figure 8. Identifying hardware manufacturers affected by 2011 Thai floods
© 2017 Four Twenty Seven, Inc. All Rights Reserved.

22
Indeed, KCE reported in its fourth quarter 2011 Earning Release that the floods stranded nearly 50 percent of KCE Ayutthaya plant’s production capacity58 and re-sulted in lower production at other KCE plants that use KCET’s semi-processes products. Production did not restart until the next year, and even by February 20th, production capacity was only 60 per cent of normal.59 The damages from the flooding to KCE were estimated at nearly $60 million dollars, of which over $36 million was for damages to fixed assets and $14 million by damages to inventory.60 The loss was mostly covered by insurance to property damage and business interrupti-on. In 2012, KCE registered nearly $50 million in capital expenditure (22 per cent of sales), mostly to replace KCET machinery.61
This concentration of assets in a region prone to extreme precipitation and flooding is captured in the companies’ scores for Extreme Rainfall (and overall Risk Scores), enabling investors to understand the different risk profiles of their portfolio companies.
Acer, Samsung Electro-mechanics, Delta, and KCE all reported drops in share prices in that same period; the largest being that of KCE, a Thai manufacturer of printed circuit boards,56 whose shares fell by 35 per cent in that period. Yet not all of the stock prices of technology manufacturing companies with facilities in Thailand’s affected regions were negatively impacted. Samsung Electronics and the Lenovo Group both saw their shares go up within the same period, by 10 and 9 per cent respectively (Figure 9).
A closer look at corporate facilities reveals that geo-graphic concentration of facilities may be a key driver: Lenovo and Samsung Electronics both have over 100 company sites worldwide, of which only one is located within the area affected by the floods. In contrast, KCE Electronics had, at the time, only 3 manufacturing facilities,57 all in Thailand, and all located within the areas affected by the floods.
Figure 9. Financial impact is correlated to asset geographic concentration
SECTION II - CLIMATE RISK IN FAR EAST ASIA
© 2017 Four Twenty Seven, Inc. All Rights Reserved.
100%
67%
5%2%1%0%
8.5%9.8%
-20.3% -17.2%
-30.5%-36.1%
Sh
are of aff
ected facilities
Sto
ck price variatio
n
Company
Samsung Electr. Lenovo Group ACER Samsung Electr. Delta Electronic. KCE Electornics
STOCK VARIATION
-36% 10%
Companies within the MSCI AC Far East ex-Jap Index, and the Technology hardware & Equipment Global Industry Classifictaion Standrad (GICS).Percentage of affected facilities computed per number of sites identified by Four Twenty Seven, Inc.Stock variation from 7/29/2011 to 11/30/2011.
SECTION II - CLIMATE RISK IN FAR EAST ASIA
Does climate change cause extreme weather events? Climate science and extreme event attribution
DR. MICHAEL WEHNER PhD, Lawrence Berkeley National Laboratory
Until recently, when scientists were asked whether climate change was the cause of an extreme weather event such as a heat wave or large flood, the reply would be “We can’t say anything about individual events but this event was consistent (or not) with climate change.” However, new techniques now shed light on how the human interference in the climate system has influenced specific, individual weather events. These “event attribution” techniques rely heavily on climate models to simulate both the actual world that the event occurred in as well as a coun-terfactual world to explicitly model the human-driven changes to the climate system. There are a number of methods available to make quantified assessments and scientists are extremely careful in choosing mo-dels capable of providing credible simulations.62
Two general types of statements can be made about whether a specific weather event might be attribu-ted to climate change: did climate change affect the probability of occurrence of this event, and was this event more intense or of greater magnitude because of climate change. The degree of confidence for these statements can vary for a single event. The current state of science does not allow scientists to establish
full causality, i.e. to state with certainty that a specific event would not have happened without climate change. No such event has yet been documented in the literature, but they are certainly plausible in the warmer future scenarios examined by the Intergover-nmental Panel on Climate Change.
Currently, confidence in probabilistic event attributi-on statements is highest for temperature extremes, both hot (increasing probability and magnitude) and cold (decreasing probability and magnitude). Intense storms and resultant flooding can be problematic as current generation climate models may not be able to reproduce precipitation amounts close to obser-vations due to limitations in model fidelity. Recently, more refined approaches involving high-resolution forecast models have proved useful in quantifying the human influence on intense storms, albeit with more conditions invoked.63
Event attribution is a rapidly developing science, and attribution of select events for the past year is now systematically assessed in the Supplement to the State of the Climate Reports, published annually since 2013 in the Bulletin of the American Meteorological Society. It is likely that confidence in extreme event attribution will continue to improve in the near future.64
Figure 10. Climate change shifts the odds for extreme weather events
Source: IPCC
Pro
bab
ility
of
occ
ure
nce
Less COLD Weather
More RECORD HOT Weather
Cold Hot
NEW CLIMATE
PREVIOUSCLIMATE
More HOT Weather
Increase in mean
Average
23

24
CONCLUSION
in Thailand, the Philippines, China, and Indonesia rank as lowest performers on the Country of Sales indicator, as they are vulnerable to shocks in their home country.
Utilities, in contrast, also don’t have a deep supply chain but they tend to be much more exposed to Operation Risk, especially as they operate water and energy inten-sive power plants. Just like banks, they depend on the market they serve – Figure 11 shows Kepco, the Korean utility scoring well above local utilities in Thailand and the Philippines. Lastly, companies in the food industry score consistently low for supply chain risk due to their de-pendency on agricultural supply chains, but show a wide range of market risk, depending on whether they cater to their domestic market like Robina Corp., or are focused on export agricultural goods like Thai Union Group.
Unabated climate change could severely affect Asia’s future growth, reverse current development gains, and degrade quality of life.65 Such sweeping impacts on soci-oeconomic development means companies are also exposed to diffuse risk to their markets and customers, in addition to localized, site-specific operational risk. Four Twenty Seven’s Country of Sales risk indicator is designed to capture this market risk. Figure 11 illustrates our findings for three sectors: Banks, Utilities, and Food.
Banks tend to be high performers on all metrics but one: Country of Sales. Banks don’t have much of a supply chain, and operate numerous branches across their markets, with high redundancies and therefore limited business impacts from local hazards. However, many banks serve only their domestic market, such that banks
Macroeconomic impacts and market risk
Figure 11. Market risk (Country of Sales Indicator) varies widely within each sector
Conclusion
Climate change has become a driver of risk and performance in financial markets, and the need to integrate company climate risk into investment decisions will only grow over time. Gaining greater visibility into these risks, which are currently not priced by financial markets, is a duty for all investors and corporate directors. Four Twenty Seven’s climate risk analytics open a unique window into the many dimensions of climate change impacts on value chains, empowering corporations, and investors alike to take action to mitigate risk and seize opportunities.
As regulators and institutional investors continue to exert pressure on portfolio companies for more disclosure, this dataset on corporate climate risk will gain nuance and granularity. Are companies properly insured for climate losses? What is the maximum potential loss from an extreme weather event on their top five facilities? Are they proactively assessing their long-term risk to build resilience at the company and site level?
Solutions exist. Leading companies are already engaging closely with local authorities to support local adaptation measures and foster resilience for their facilities, their employees, and the broader community.66 Better under-standing these risks need not be a driver of divestment and exclusion. Rather, it is the starting point to investing in resilience, supporting companies with stronger climate risk management approaches, and ensuring our broader economic system is protected from the worst impacts of climate change.
© 2017 Four Twenty Seven, Inc. All Rights Reserved.
SECTION II - CLIMATE RISK IN FAR EAST ASIA
25
Kepco Korea Elec. Power

COMPANY PROFILES, AUTHORS AND DISCLAIMER
26
REFERENCES
1 Hurricanes Irma and Harvey Mark the First Time Two Atlantic Category 4 U.S. Landfalls Have Occurred in the Same Year. (n.d.). Retrieved September 21, 2017, from https://weather.com/storms/hurricane/news/hurricane-irma-harvey-landfall-category-4-united- states- history?_escaped_fragment_2 Dolce, C. Three Category 4 Hurricanes Have Made a U.S. Landfall in 2017. Retrieved September 21, 2017 from https://weather.com/ storms/hurricane/news/hurricane-maria-irma-harvey-three-united-states-category-4-landfalls3 Irfan, U. (2017, September 18). The stunning price tags for Hurricanes Harvey and Irma, explained. Retrieved September 21, 2017, from https://www.vox.com/explainers/2017/9/18/16314440/disasters-are-getting-more-expensive-harvey-irma-insurance-climate4 Ciolli, J. (n.d.). Hurricanes Irma and Harvey cause Goldman Sachs to slash its outlook for the US economy. Retrieved September 21, 2017, from http://www.businessinsider.com/goldman-sachs-hurricane-irma-harvey-gdp-impact-2017-95 Raj, S., & Gettleman, J. (2017, September 7). They Thought the Monsoons Were Calm. Then Came the Deadly Floods. The New York Times. Retrieved from https://www.nytimes.com/2017/09/07/world/asia/bihar-india-monsoon-floods.html6 Over 200 dead in India, Bangladesh and Nepal floods | India News | Al Jazeera. (n.d.). Retrieved September 18, 2017, from http://www. aljazeera.com/news/2017/08/200-dead-india-bangladesh-nepal-floods-170815151106159.html7 Millions affected as monsoon floods ravage Nepal, India. (n.d.). Retrieved September 18, 2017, from http://www.aljazeera.com/ news/2017/08/floods-landslides-kill-dozens-nepal-india-170813132206327.html8 Global Adaptation & Resilience Investment Working Group. (2016). Bridging the Adaptation Gap. Approaches to measurement of physical climate risk and examples of investment in climate adaptation and resilience9 The challenges of accessing and manipulating climate data by anybody other than climate scientists is described with humor by UC Berkeley economist Maximilian Auffhammer, a leading researcher on the economic impacts of climate change, on the climate data blog G-feed, “An open letter to you climate people”, published September 2014 http://www.g-feed.com/2014/09/ (accessed September 21, 2017). While multiple tools have been developed since this article was written to help laypeople access climate data for specific sites, notably the World Bank Climate Knowledge Portal (http://climateknowledgeportal.worldbank.org) and the U.S. Climate Explorer (https:// toolkit.climate.gov/climate-explorer2/) the underlying difficulty in accessing climate data at scale over multiple locations remains.10 2° investment initiative. (2017). Asset-level data and climate-related financial analysis: A market survey.11 S&P Global. (2016). How Asset Level Data Can Improve the Assessment of Environmental Risk in Credit Analysis.12 Task Force on Climate-related Financial Disclosures. (2016). Phase I Report of the Task Force on Climate-Related Financial Disclosures.13 Ceres. (2014). Cool Response: The SEC & Corporate Climate Change Reporting.14 Investor Group on Climate Change. (2017). Transparency in action: A guide to investor disclosure on climate change.15 Deutsche Asset Management. (2017). Sustainable Finance Report. Issue #2.16 BlackRock. (2016). Adapting portfolios to climate change. Implications and strategies for all investors.17 Chan, E. (2017). State Street Asks Boards to Disclose More on Climate Preparation. Bloomberg Newsweek.18 Kerber, R. (2017). Vanguard seeks corporate disclosure on risks from climate change. Reuters19 Amundi. (2016). 2016 Corporate Social Responsibility Report.20 Wade, K., & Jennings, M. (2015, July). Climate change & the global economy: Quantifying the impact. Economic Views - Schroders21 Carney, M. (2015). Breaking the Tragedy of the Horizon – climate change and financial stability. Speech. Speech given by Mark Carney. Governor of the Bank of England. Chairman of the Financial Stability Board. London.22 Task Force on Climate-related Financial Disclosures. (2017). Recommendations of the Task Force on Climate-related Financial Disclosures.23 Forum pour l’Investissement Responsable. (2016). Article 173-VI: Understanding the French regulation on investor climate reporting.24 Cite American Climate Prospectus25 Burke, Marshall, Hsiang, S. and Miguel, E. Global non-linear effect of temperature on economic production, Nature 527, 235–239 (12 November 2015)26 Cicero. (2017). Shades of Climate Risk - Categorizing climate risk for investors. Retrieved from https://www.cicero.uio.no/en/ climateriskreport27 World Bank, Turn Down the Heat report series, 2012-2014.28 Heat stress incorporates cooling degree days (a proxy for cooling demand), maximum temperature, and frequency of warm days; extreme rainfall incorporates maximum 5-day precipitation (a proxy for flooding events), heavy precipitation days, and frequency of very wet days; water stress incorporates water demand and water supply; and sea level rise measures percentage of population living under 5m above sea level. Within a country, each metric is averaged within its high-level parent indicator, which are subsequently averaged to arrive at the final climate exposure score.29 Other sources include the Yale Environmental Index by Yale University, World Resources Institute, International Trade Union Confederation, the International Disaster Database by the Center for Research on the Epidemiology of Disasters, Transparency International, and the Institute for Economic and Peace.30 Johnston, GS, Burton, DL & Baker-Jones, M 2013 Climate Change Adaptation in the Boardroom, National Climate Change Adaptation Research Facility.31 Frey, B., Gardaz, A., Karbass, L., Goldberg, M., Luboyera, F., Fischer, R., … others. (2015). The Business Case for Responsible Corporate Adaptation: Strengthening Private Sector and Community Resilience.: A Caring for Climate Report. UN Global Compact. Retrieved from http://427mt.com/resources/corporate-climate-risk/responsible-corporate-adaptation/32 Kupers, R. (ed). (2014). Turbulence. A Corporate Perspective on Collaborating for Resilience. Amsterdam University Press, Amsterdam.33 World Economic Forum, World Economic Outlook, October 2017. Accessed at https://www.imf.org/en/Publications/WEO/ Issues/2017/09/19/world-economic-outlook-october-2017
References
27
Legal DisclaimerThe data provided in this report were prepared by Four Twenty Seven. Publications of Four Twenty Seven are for information purposes only. Other than disclosures relat-ing to Four Twenty Seven, the information contained in this publication has been obtained from sources that Four Twenty Seven believes to be reliable, but no representa-tion or warranty, express or implied, is made as to the accuracy, completeness, reliability or timeliness of any of the content or information contained herein. As such, the information provided ‘as-is,’ ‘with all faults’ and ‘as available.’ The opinions and views expressed in this pub-lication are those of Four Twenty Seven and are subject to change without notice, and Four Twenty Seven has no obligation to update either the information contained in this publication. Further, neither Four Twenty Seven nor its directors, officers, employees or agents shall be held liable for any improper or incorrect use of the informa-tion described and/or contained herein and assumes no responsibility for anyone’s use of the information. Under no circumstances shall Four Twenty Seven or any of its directors, officers, employees or agents be liable for any direct, indirect, incidental special, exemplary or conse-quential damages (including, but not limited to: procure-ment of substitute good or services; loss of use, data or profits; or business interruption) related to the content and/or to the user’s subsequent use of the information contained herein, however caused and on any theory of liability. User agrees to defend, indemnify, and hold harmless, Four Twenty Seven and its directors, officers, employees and agents from and against all claims and expenses, including attorneys’ fees, arising out of the use of information herein provided.
Authors Emilie Mazzacurati, Four Twenty SevenDaniela Vargas Mallard, Four Twenty SevenJoshua Turner, Four Twenty SevenNik Steinberg, Four Twenty SevenColin Shaw, Four Twenty Seven
Guest contributorsDr. Michael Wehner, PhD, Lawrence Berkeley National LaboratoryDr. Benjamin Strauss, PhD, Climate Central
About Four Twenty SevenFour Twenty Seven (www.427mt.com) is an award-win-ning market intelligence and research firm specialized on the economic risk of climate change. Four Twenty Seven’s data analytics solutions bring climate intelli-gence to economic and financial decision-makers. Four Twenty Seven provides financial portfolio climate risk as-sessments, development of climate resilience strategies, quantification of metrics and indices for benchmarking, monitoring and evaluation, and training and stakeholder engagement to Fortune 500 corporations and govern-ments worldwide.
Four Twenty Seven was a finalist for the prestigious Cartier Women’s Initiative Award (2014), earned Climate Change Business Journal Awards for Climate Risk Man-agement and Adaptation (2014 and 2015), took first prize in the ESRI Human Health and Climate Change Chal-lenge 2015, and won the Verdantix Environment, Health and Safety Information Management Award (2016). Its founder, Emilie Mazzacurati, was awarded the Berkeley Visionary Awards in 2016. The company was founded in 2012 and is headquartered in Berkeley, California with of-fices in Washington, DC and Paris, France.
Authors and Disclaimer

REFERENCES
28 29
References
34 Asian Development Bank and Potsdam Institute for Climate Impact Research, A Region at Risk: The Human Dimensions of Climate Change in Asia and the Pacific, July 2017, accessed at https://www.adb.org/publications/region-at-risk-climate-change.35 Climate Central, Rising Seas Threaten Land Home to Half a Billion, November 201536 Gateway to Guangdong, Guangzhou GDP up 8.2% to 1.96 trillion RMB in 2016, 26 January 2017, accessed September 21, 2017 at http://www.newsgd.com/news/2017-01/26/content_164431136.htm37 “Counting the Costs of Floods in China,” Policy Forum, July 21, 2016, https://www.policyforum.net/counting-costs-floods-china/.38 Huang, Z., Zong, Y., & Zhang, W. (2004). Coastal inundation due to sea level rise in the Pearl River Delta, China. Natural hazards, 33(2), 247-26439 Kopp RE, Horton RM, Little CM, Mitrovica JX, Oppenheimer M, Rasmussen DJ, Strauss BH, Tebaldi C. Probabilistic 21st and 22nd century sea-level projections at a global network of tide-gauge sites. Earth‘s future. 2014 Aug 1; 2(8):383-406. 40 DARA. “Climate Vulnerability Monitor 2nd Edition: A Guide to the Cold Calculus of a Hot Planet.” 2012.41 Meese, G. B. et al. “A Laboratory Study of the Effects of Moderate Thermal Stress on the Performance of Factory Workers∗.” Ergonomics 27.1 (1984): 19–43.42 Fisk, William J., and Arthur H. Rosenfeld. “Estimates of Improved Productivity and Health from Better Indoor Environments.” Indoor Air 7.3 (1997): 158–172.43 Sahu, Subhashis, Moumita Sett, and Tord Kjellstrom. “Heat Exposure, Cardiovascular Stress and Work Productivity in Rice Harvesters in India: Implications for a Climate Change Future.” Industrial Health 51.4 (2013): 424–431.44 Graff Zivin, Joshua, and Matthew Neidell. “Temperature and the Allocation of Time: Implications for Climate Change.” Journal of Labor Economics 32.1 (2014): 1–26.45 Kjellstrom, Tord, and Jennifer Crowe. “Climate Change, Workplace Heat Exposure, and Occupational Health and Productivity in Central America.” International Journal of Occupational and Environmental Health 17.3 (2011): 270–281.46 Asian Development Bank, op. cit.47 AON Benfield, “2011 Thailand Floods Event Recap Report,” March 2012, http://thoughtleadership.aonbenfield.com Documents/20120314_impact_forecasting_thailand_flood_event_recap.pdf.48 “Thailand - Worst Flood Crisis in 5 Decades.”49 AON Benfield, “2011 Thailand Floods Event Recap Report.”50 “Thailand - Worst Flood Crisis in 5 Decades.”51 “Factbox: Thailand’s Flood Crisis and the Economy,” Reuters, November 2, 2011, http://www.reuters.com/article/us-thailand- foods-factbox-idUSTRE7A11BC20111102.52 “Thailand - Worst Flood Crisis in 5 Decades: What Is the Impact?” Shares Investment, accessed July 19, 2017, http://www.sharesinv.com/articles/2011/12/28/thailand-worst-flood-crisis-in-5-decades-what-is-the-impact/.53 Lee Chyen and Huang Yuntao, “Update 1-Lenovo Q3 Net Slows for 3rd Straight Quarter,” Reuters, February 8, 2012, http://www.reuters.com/article/lenovo-results-idUSL4E8D869E20120209.54 Shades of climate risk: Categorizing climate risk for investors. (2017). Cicero. Oslo, Norway.55 Thai floods hit global hard drive production. (2011, October 20). Retrieved August 28, 2017, from https://www.ft.com/content/ f0f9a234-fb33-11e0-8756-00144feab49a56 At the time of the floods, the automotive industry accounted for 65% of sales (KCE Annual Report 2012).57 KCE Electronics - Company Initiation. (2015, September 16). Global Alliance Partners. Retrieved from https:/ globalalliancepartners.s3.amazonaws.com/propositions/bf0d39c32388739ed493d4d3b9f8e23d.pdf Today, KCE Electronics has a total of five manufacturing plants, all in Thailand.58 KCE Electronics - Company Initiation. (2015, September 16). Global Alliance Partners. Retrieved from https:/globalalliancepartners. s3.amazonaws.com/propositions/bf0d39c32388739ed493d4d3b9f8e23d.pdf59 KCE’s Q4 2011 Earnings Release - Data provided by FactSet, accessed August 22nd, 201760 2012 Exchange rate (1 USD = 30.6 Baht)61 KCE’s Annual Report for period end 12/31/2012 - Data provided by FactSet, accessed August 22nd, 201762 Pardeep Pall, Michael Wehner, Dáithí Stone (2014) Probabilistic Extreme Event Attribution in Dynamics and Predictability of Large-Scale, High-Impact Weather and Climate Events, Richard Grojahn, Jianping Li, Richard Swinbank, Hans Volkert, editors. Cambridge University Press. 37-46, ISBN 978-1-107-07142-1.63 P. Pall, C. M. Patricola, M. F. Wehner, D. A. Stone, C. Paciorek, W. D. Collins (2017) Diagnosing Anthropogenic Contributions to Heavy Colorado Rainfall in September 2013. To appear in Weather and Climate Extremes. 10.1016/j. wace.2017.03.00464 National Academies of Sciences, Engineering, and Medicine . Attribution of extreme weather events in the context of climate change. The National Academies Press, 2016. doi:10.17226/2185265 Asian Development Bank, op. cit.66 Frey, B.,et al., op. cit.
NOTES

NOTES
30

As
of: 1
1/20
17