measuring equity in health - world bank
TRANSCRIPT
_PS 2S55 0POLICY RESEARCH WORKING PAPER 2550
Measuring Equity in Health The WorldHealthOrganization's latest World
Care Financing Health Report proposes an
index of fairness in health
care financing. The tndex'sReflections on (and Alternatives to) chief weakness is that it
the World Health Organization's cannot discriminate among
Fairness of Financing Index progressive, regressive, and
horizontally inequitable health
Adam Wagstaff financing systems. Analternative approach
proposed in the early 1 990s is
shown to do a better job.
The World Bank
Development Research Group
Poverty and Human Resourcesand
Human Development Network
Health, Nutrition, and Population Team
February 2001
Pub
lic D
iscl
osur
e A
utho
rized
Pub
lic D
iscl
osur
e A
utho
rized
Pub
lic D
iscl
osur
e A
utho
rized
Pub
lic D
iscl
osur
e A
utho
rized

PotLICY RESEARCH WORKING PAPER 2550
Summary findings
In its latest World Health Report, the World Health With the WHO's index, progressiveness and
Organization (WHO) argues that a key dimension of a regressiveness are both treated as unfair. This makes no
health system's performance is the fairness of its sense, because policymakers who may be strongly aversefinancing system. The report discusses how policymakers to regressive payments (which worsen income
can improve this aspect of performance, proposes an distribution) may in the name of fairness be quite
index of fairness, discusses how it should be put into receptive to progressive payments (requiring that the
operation, and presents a league table of countries better-off, who may be willing to spend proportionatelyranked by the fairness with which their health services more on health care, are required to pay proportionately
are financed. more).Wagstaff shows that the WHO index cannot Wagstaff compares the WHO index with an alternative
discriminate between health financing systems that are and more illuminating approach developed in the incomeregressive and those that are progressive-and cannot redistribution literature in the early 1990s and used indiscriminate between horizontal inequity and the late 1990s to study the fairness of various OECD
progressiveness or regressiveness. health care financing systems.
The index cannot tell policymakers whether it deviates He illustrates the differences between the approachesfrom 1 (complete fairness) because households with with an empirical comparison, using data on out-of-similar incomes spend different amounts on health care pocket payments for health services in Vietnam for 1993(horizontal inequity) or because households with and 1998. This analysis is of some interest in its own
different incomes spend different proportions of their right, given the large share of health spending from out-income on health care (vertical inequity, given the of-pocket payments in Vietnam and the changes in fees
WHO's interpretation of the ability-to-pay principle)- and drug prices over the 1990s.although the two have different policy implications.
This paper-a product of Poverty and Human Resources, Development Research Group, and the Health, Nutrition, and
Population Team, Human Development Network-is part of a larger effort in the Bank to investigate the links between
health and poverty. Copies of the paper are available free from the World Bank, 1818 H Street NW, Washington, DC 20433.
Please contact Anna Marafion, room MC3-558, telephone 202-473-8009, fax 202-522-1153, email address
[email protected]. Policy ResearchWorkingPapers are also posted onthe Web at http://econ.worldbank.org. Theauthor may be contacted at [email protected]. February 2001. (21 pages)
The Policy Research Working Paper Series disseminates the findings of work in progress to encourage the exchange of ideas about
development issues. An objective of the series is to get the findings out quickly, even if the presentations are less than fully polished. The
papers carry the names of the authors and should be cited accordingly. The findings, interpretations, and conclusions expressed in thispaper are entirely those of the authors. They do not necessarily represent the view of the World Bank, its Executive Directors, or thecountries they represent.
Produced by the Policy Research Dissemination Center

Measuring Equity in Health Care Financing:Reflections on and Alternatives to the
World Health Organization's Fairness of Financing Index
Adam Wagstaff
Development Research Group and Human Development Network
World Bank
Without wishing to incriminate them in any way, I am grateful to Deon Filmer, Maureen Lewis, and MartinRavallion for comments on an earlier draft of this paper.


I
I. Introduction
In its latest World Health Report (WHR) Health Systems: Improving Performance, theWorld Health Organization [1] breaks new ground not only by focusing attention on theperformnance of health systems, but also by arguing that a key dimension of a health system'sperformance is the fairness of its financing system. In addition to discussing the wayspolicymakers can improve fairness in health financing, the report proposes an index of fairness,discusses how it should be operationalized, and goes on to present a league table of the world's191 countries ranked by the fairness with which their health services are financed. Apparently,the report has been the subject of a good deal of comment-favorable and unfavorable, itseems-but for the most part this appears to have been amongst journalists and policymakers.Critical assessments by researchers of the report's methods and results have been limited to date.Such assessments are, however, clearly important, given the potential impact the report and itsleague tables may have on policymakers and the international development community.
The aim of this paper is to provide an assessment of the report's quantitative work on thefairness of health care financing. Regrettably, the focus of the paper has been confined to theproperties of WHO's fairness index, since no details are available about the empirical work onfinancing presented in the report.' The only thing that can be said with any certainty is thatalthough values of the WHO fairness index are presented for 191 countries, in only 19 of thesewas the index computed from household survey data. Indeed, in all but one of the countriesranked in the top 40 (Colombia) the FFC index was "estimated". Whilst it is not unheard of tointerpolate "missing" data in this way, it is surprising that no documentation is available settingout the methods used. Perhaps even more surprising is that WHO should attach so muchimportance to the values of the index for the 172 countries where index values were estimated.2
The concerns that several health ministers have expressed about the WHR rankings are, in suchcircumstances, understandable.
The paper begins in section II with a discussion of the ethical premise underlying theWHO index-that households ought to be expected to pay for health care in line with theirability to pay. The paper suggests that the ability-to-pay principle is best understood in terms of adesire on the part of policymakers to limit the impact of health care payments on the distributionof disposable income. Whilst there appears to be a good deal of support for the generalprinciple, the proportionality version of it adopted by the WHO is harder to defend. The papergoes on in section III to draw out the properties of the WHO index and in section IV argues thatthey are highly unattractive. The index is unable to distinguish between progressive andregressive payments, and is also unable to distinguish between cases where households on
l Discussion papers have been promised but have yet to appear on the WHO website. One might even have hopedthat they would have been written and distributed in time to provide the basis for a discussion of the methods priorto the work being undertaken.
2 In the 1991 World Bank's World Development Report, for example, poverty indices were estimated for 22countries out of 86, but the 22 countries covered 76% of the population of the 86 countries, and only regionalaggregates were published (the country-specific values were never made public precisely because they were felt tobe too imprecise) (cf. Ravallion et al. 1991).

2
different incomes pay different shares of their income in health care payments and cases wherehouseholds at the same income pay different amounts for health care. The index is also sensitiveto the overall average share of income spent on health care. Section V outlines an alternativeapproach developed in the income redistribution literature and used in the health economicsliterature in the late 1 990s. This approach explicitly approaches the fairness of health financingin terms of its impact on the distribution of income, and allows one to show the separateredistributive effects of the average proportion of income spent on health care, the progressivityor regressiveness of the payment structure, the horizontal inequities in the financing system, andthe extent of reranking generated by it (well-off households becoming poor, and vice versa). Thepaper ends in section VI with an empirical illustration of this method using data on out-of-pocketpayments from Vietnam for two years-1993 and 1998. Though this is intended simply as anillustration of the two approaches, the analysis is of some interest from a policy perspective. Arecent assessment of the Vietnamese health sector [2] highlighted Vietnam's heavy reliance onout-of-pocket payments to finance health care-81% of health spending in Vietnam wasfinanced privately in 1997, and this was almost entirely paid out-of-pocket. The assessment alsohighlighted, however, two important changes over the course of the 1990s: rising user fees (evenat supposedly free commune health centers), offset-at least in part-by reductions in the cost ofmedicines.
II. Health Care Payments and Ability to Pay
WHO calls its index an index of fairness of financial contribution (FFC). The index aimsto capture empirically the financial protection issue highlighted in chapter 5 of the WHR. This isevidently only one aspect of fa&rness in health financing, since the way a country finances itshealth care-and in particular the balance it strikes between pre-payments and out-of-pocketpayments-has implications not just for how people pay for health care (the focus of the FFCindex) but also for whc uses health services, how often and how much. The FFC index does notcapture-and does not purport to capture-how fair a financing system is in terms of its impacton the distribution of access to and utilization of health services. The limited objective of theFFC index-and the alternative suggested below-needs to be borne in mind.
LINKING PAYMENTS TOABILITY TO PAY-WHY?
The WHR argues that a key dimension of performance in a health care system is howfairly it protects households financially. Underlying the FFC index is one particularinterpretation of the term "fairness in financial protection", namely that households ought to berequired to pay for health care in line with their ability-to-pay (ATP). There appears, in fact, tobe widespread support amongst policymakers and the public at large for the principle of linkinghealth care payments to ability to pay [3]. There has, however, been relatively little discussionof the rationale underlying this. As Culyer [4] notes, one obvious, reason that might be advancedin support of the principle is that policymakers are concerned that payments for health care affectpeople's ability to seek health care when ill. This concern stems from a more fundamentalconcern of policymakers with the distribution of health service utilization and ultimately with thedistribution of health itself. But this simply provides a rationale for de-linking payments andutilization-it does not provide a rationale for linking payments to ATP [5]. A flat-rate tax, for
3
example, would de-link payments from service utilization but would not link payments to abilityto pay.
There is, however, as Culyer notes, another reason why policymakers may be concernedto link payments for health services to ATP rather than to service usage, namely that paymentsfor health services reduce households' ability to buy other goods and services (e.g. food), andpolicymakers are concerned about the distribution of these as well as about the distribution ofhealth services. Policymakers, in other words, are not so much concerned about the distributionof health care payments per se. Rather they are concerned to ensure that this the distributiondoes not have an unduly adverse effect on the distribution of disposable income. It is in thissense that policymakers appear to wish to link payments for health care to households' ATP.
This begs the question, of course, of why policymakers appear to take the view that it isnot fair for a household's disposable income to be compromised by payments for health care butthat it is fair for a household's disposable income to be compromised by spending on, say, askiing vacation, or a gas-guzzling sports utility vehicle. The reason for this is probably thatpolicymakers see health care payments as an involuntary item of expenditure, brought about byan unwanted health shock and required in order to restore health status to its previous level, or asclose to it as is possible, and take the view that the community as a whole should jointly bear thefinancial burden of such shocks in order that the distributions of health status and disposableincome are not worsened.3
LINKING PAYMENTS TOABILITY TO PAY-HOW?
Requiring that health care payments be linked to ability to pay can be interpreted in termsof vertical equity (in this case the requirement that households of unequal ability to pay makeappropriately dissimilar payments) and horizontal equity (the requirement that households of thesame ability to pay make the same contribution) [3]. In the case of vertical equity, considerationhas to be given to the precise form that the differential treatment should take. Should better-offhouseholds be paying more than worse-off households in absolute terms or in proportionalterms? In the latter case, vertical equity would require that payments be progressive. In theformer case, payments could be proportional to ability-to-pay, or even regressive (poorerhouseholds paying a larger share of their income than better-off households). Though manypolicymakers appear to support the application of the ability-to-pay principle to health carefinance, rarely-if ever-do policies and policymakers specify the "appropriate" degree ofprogressivity.
In constructing its FFC index, the WHO starts from the premise that health care paymentsought to be proportional to ATP. In other words, everyone-irrespective of their ATP-oughtto pay the same proportion of their ATP on health care. We discuss below the appropriateness ofthis premise. Suffice to say for the moment that its adoption allows WHO to construct an indexthat simply focuses on disproportionality.
3 There are other possibilities with respect to the impact on incomes. One is that policymakers wish to reduce theimpact on poverty rather than income inequality-cf. Wagstaff, Watanabe and van Doorslaer (2000).

4
III. WHO's FFC Index and its Properties
Let us suppose for the moment that we have some measure of ability to pay. (Below wewill have something to say about WHO's approach to measuring ATP. We can safely put theseconcerns aside for the moment-if the index makes sense, it should not hinge on one particularoperationalization of the concept of ability to pay.) The WHO index computes, for eachhousehold, health care spending expressed as a proportion of the household's ability to pay. Thereport calls this ratio HFC-health financing contribution. The WHO index of fairness of thiscontribution captures the variation of HFC around its mean. Specifically, the index for a givencountry is the third absolute moment around the mean of HFC:
(1) FFC = 1-4 Eh,HFCHFC|I0.125H
where FFC is fairness of financial contribution, h indexes households, and H is the number ofhouseholds in the sarnple. The index is similar to the variance, but gives a greater weight tovalues far from the mean. It is expressed in such a way that it takes a value of one wheneveryone pays the same proportion of their ATP in health care payments, and has a value of lessthan one when there is inequality in health care payments as a proportion of ATP.
The FFC index has three noteworthy properties. The rest of this section sets these out.The next section discusses their desirability.
First, the FFC index reflects both vertical and horizontal inequity. If the index's value isless than one, this could be for one or both of two reasons. It could be that households withsimilar ATPs are spending different proportions of their ATP on health care (a violation of theprinciple of horizontal equity) or that households with different ATPs are spending differentproportions of their ATP on health care (a violation of the principle of vertical equity). A valueof FFC that is different from one could be because the system is horizontally inequitable, orvertically inequitable, or both.
The second property worth noting is that the index treats progressivity and regressivenesssymmetrically. The index is based on the premise that any violation of the vertical equityprinciple is bad. A value of FFC below one could arise because the better-off who pay a largerproportion of their ATP than the poor (the case of progressive payments), or because the poorpay a larger proportion of their ATP than the better-off (the case of regressive payments). Theindex does not allow us to know which.
The third noteworthy property is that, in general, the index will also reflect the averageproportion of ATP absorbed by health care payments. Except in the extreme case whereeveryone pays the same proportion of their ATP towards health care, the index is sensitive to theaverage proportion of ATP spent on health care. The index thus reflects not just vertical andhorizontal inequity, but also the proportion of ATP absorbed by health care. The index sharesthis property with the variance, which is sensitive to the mean of the variable whose variation isbeing measured.

5
These three properties are illustrated in Fig 1. The inverted u-shaped curves illustrate thefact that moving towards proportionality-by either reducing regresssiveness or by reducingprogressivity-moves the index towards its upper limit of one. The effect of reducing horizontalinequity is to push these curves upwards. In the limit, as horizontal inequities are eliminatedaltogether, the curve touches one at its upper point (i.e. where proportionality is achieved).
Fig 1: WHO Fair financing index
Fairness index
No horizontal inequities
With horizontal inequities
01regressive progressive
progressivity
IV. Are the Properties of WHO's FFC Index Attractive?
OUGHT PROGRESSIVITY TO BE TREA TED SYMMETRICALL Y TO REGRESSIVENESS?
It is convenient to take the second property first-the fact that the index treatsprogressivity and regressiveness symmetrically. This property follows logically from theproportionality version of the ability-to-pay principle, but it takes only a moment's reflection torealize just how unattractive it is. Progressive and regressive payments have opposite effects onthe distribution of income-progressive payments reduce income inequality, while regressivepayments increase it [6, 7]. In other words, under progressive payments, there will be lessinequality in postpayment income (i.e. the income households have available after paying forhealth care) than in prepayment income (i.e. the income they have available before paying forhealth care). Under regressive payments, there will be more inequality in postpayment incomethan in prepayment income.
It is hard to see why policymakers should view increases and decreases in incomeinequality brought about by health care payments as just as bad as one another. There is goodevidence that regressive payments are perceived by policymakers and the public at large as beingunfair. It is not at all clear that policymakers and the general public feel that progressivepayments are automatically unfair.

6
For one thing, the better-off may choose to spend a higher proportion of their incomethan the poor. Indeed, the WHR acknowledges this and concedes that this would probably not-at least for health financing purposes-be viewed as inequitable.4 Despite this, the fact remainsthat the FFC index treats progressive payments as automatically unfair. Thus two countriescould have the same value of the WHO index, but in one country the shortfall from one could bedue to the poor paying a larger proportion of their income in health care payments (presumably"involuntarily"), whilst in the other country, the shortfall from one could be due to the better-offspending (to a degree, presumably, voluntarily) a larger share of their income on health care thanthe poor.
There is another reason to think that policymakers and the public do not treat progressiveand regressive payments symmetrically, namely that they may want to see health care paymentsexerting an equalizing impact on the income distribution. If health care payments areproportional to prepayment income, all this means is that health care payments absorb the sameshare of a rich household's prepayment income as a poor household's. Both households, in otherwords, have the same percentage drop in their incomes, moving from the prepayment topostpayment distributions. Policymakers may quite reasonably take the view that even this maycompromise too much poor households' ability to purchase food and other key goods andservices. They might feel that a fairer scheme would be one in which the poor are not expectedto contribute anything to the financing of health care but the nonpoor are expected to shoulderthe burden of financing health care at least in proportion to their income.
All this suggests that an index that is blind between progressive and regressive healthcare payments is not especially useful. Having said, this it seems wise not to prejudge the issuetoo much. What seems best is to employ an index that allows policymakers to see howprogressive or regressive their health care financing system is. The approach outlined belowallows one to do preciselv this.
SHOULD VERTICAL AND HORIZONTAL INEQUITY BE TREA TED SIMILARLY?
As defined, the FFC index can take a value of less than one either because householdswith similar ATPs are spending different proportions of their ATP on health care (horizontalinequity) or because households with different ATPs are spending different proportions of theirATP on health care (vertical inequity, given the proportionality requirement). There are variousreasons why one would like to be able to discriminate empirically between these two types ofdisproportionality.
First, whilst horizontal inequity necessarily increases income inequality [8], verticalinequity (defined ai la WHO) can-as has been seen above-either reduce it or increase it,depending on whether payments are progressive or regressive. Suppose Transylvania has ahealth care financing system that displays a lot of horizontal inequity but is progressive. Thedisequalizing effect of the horizontal differences might well be offset by the equalizing effect ofthe progressive payment structure, so that distribution of postpayment income is no moreunequal than the distribution of prepayment income. The policymaker's fairness objective of
4 Confusingly, the report suggests that it is not inequitable, providing it is prepaid and not paid out-of-pocket.

7
ensuring that the health care financing system does not worsen the distribution of income is thussatisfied. And yet the FFC index classifies the Transylvanian system as unfair. Indeed, theindex would classify the system as more unfair than a proportional financing system thatcontains as much horizontal inequity as the Transylvanian system, and more unfair than ahorizontally equitable system with the same degree of progressivity as the Translyvanian system.If the concern ultimately is to know how a health care financing system impacts on thedistribution of disposable income, then disproportionality arising from horizontal inequity needsto be capable of being distinguished empirically from disproportionality arising fromprogressivity or regressiveness.
Second, even both types of disproportionality reinforce one another (i.e. horizontalinequity is reinforced by or reinforces regressiveness), it is important to be able to distinguishempirically between the cases. One reason is that horizontal equity and regressiveness typicallyimply different policy responses. Consider, for example, the case of social insurance. Reducinghorizontal inequity might involve reducing disparities in sickness fund contribution schedules, byfor example applying the same contribution schedule to civil servants as applies to stateenterprise workers, or by mandating that competing sickness funds use a national contributionschedule. By contrast, reducing regressiveness might involve turning a regressive schedule witha contribution ceiling into a proportional schedule without a contribution ceiling.
Another reason for wanting to distinguish between regressiveness and horizontal inequityis that some may argue that not all horizontal differences are inequitable. In the context of healthcare financing, horizontal differences might rise for a variety of different reasons. In directtaxation, which often contributes a sizeable share to public financing, equals can be treatedunequally due to, for example, tax deductibility of mortgage interest payments and healthinsurance premiums. In indirect tax payments, horizontal differences might arise throughdifferent spending levels at a given prepayment income level, but also through different spendingpatterns (some commodities attract higher indirect tax rates than others). In social insurance,different schemes sometimes have different contribution schedules, whilst in private insurancepremiums paid at a given income level may vary due to different risks, as well as different levelsof and type of coverage (including, of course non-coverage). In the context of out-of-pocketpayments, horizontal differences might arise because of different utilization levels at a givenprepayment income level (in part, of course, due to differences in illness), or because of differentprices paid per unit of service. The latter may reflect differences in quality, or-especially in thecharitable and public sectors-the existence of fee exemptions that are not income-related (e.g.linked to the existence of chronic conditions, pregnancy, or membership of certain groups suchas the armed services).
The issue arises as to whether all of these reasons for horizontal differences are likely tobe regarded as equally unfair by policymakers, or even unfair at all. One might argue that whilsttax relief on mortgage interest payments is inequitable, it is not inequitable if, in the context ofindirect taxation, some households spend more of their income than others, or that somehouseholds at a given income level spend a lot on goods and services attracting high tax rateswhilst others at the same income spend much less on these high-tax goods and services. Onemight argue that it was inequitable that, in China in the early 1990s, the cost of social healthinsurance coverage for civil servants was covered out of general taxation, whilst the socialinsurance scheme for state enterprise employees (which actually had less generous coverage)

8
was funded largely through contributions from the enterprises (with presumably some backwardsshifting onto wages). And one might argue that it is also inequitable if households struck byillness spend more out-of-pocket than households not struck by illness, but that it is notinequitable if an ill person on a given income wants to spend more on health care than a similarlyill person on the same income.
On other hand, it might be argued that it is the totality of health care payments thatmatters. Health care is financed from a mixture of taxes, social insurance, private insurance andout-of-pocket payments, and the concern is with the impact of all these payments combined onthe distribution of postpayment income. If horizontal differences increase the degree ofinequality in postpayment income, then all such differences are of equal concern. According tothis view, it does matter that a health care system relying almost entirely on indirect taxes tofinance it shows up as having a larger degree of horizontal inequity, other things equal, than asystem relying almost entirely on direct taxes. If we want to avoid an unduly large impact ofhealth care payments on the income distribution, then all horizontal differences in health carepayments are to be avoided wherever they arise in the health care financing system.
These two viewpoints obviously point towards different approaches, at least insofar asdata make this possible. The case-by-case approach points towards separating out horizontaldifferences that arise from unequal treatment of equals, and focusing only on these. The secondapproach points towards focusing on all horizontal differences and treating all on an equalfooting. The WHR takes the second approach. This is not an unreasonable position to adopt, butit is not uncontroversial.
SHOULD THE A VERA GE PA YMENTRA TE BE SUBSUMED WITH THE OTHER INFLUENCES?
As it stands, the index is sensitive to the average payment rate. Except in the extremecase where everyone pays the same proportion of their ATP towards health care, the index willreflect not just the extent of horizontal and vertical equity, but also the average proportion ofincome (or ATP) spent on health care. So, one cannot be sure how far countries have differentvalues of FFC because they have different degrees of inequality in the proportion of incomespent on health care or because the average proportion of income spent differs. As with theprevious two properties, this seems unattractive. It would seem much better to have an indexthat allowed one to separate out these two issues.
V. An Alternative Approach
There are, then, at least three unattractive features of WHO's FFC index: it does notdistinguish between progressivity and regressiveness; it does not distinguish between horizontaland vertical differences in the proportion of ATP spent on health care; nor does it allow theanalyst to discern how far countries differ in their indices because of different degrees ofinequality in payment rates or different average proportions of income spent on health care.What is called for is an approach that separates clearly these different issues and embeds themeasurement of fairness in financial contribution firmly in the overall policy concern, whichappears to be a concern to avoid health care payments having an undue adverse effect on the

9
distribution of income. Fortunately, an approach is available that does just this. Developed inthe public finance and income redistribution literature in the early 1990s [8], the approach wasused to measure equity in health care finance in several OECD countries in the latter part of the1990s [6, 7]. This section outlines the approach, and the next section applies it data on out-of-pocket payments from Vietnam.
DECOMPOSING REDISTRIBUTIVE EFFECT
The redistributive effect of a tax-i.e. the impact of a tax on the distribution of income-depends on four key factors [8]. The same reasoning can be applied to health care payments. Inthe case where income inequality is measured using the Gini coefficient, redistributive effect,RE, is simply the difference between the Gini coefficient for prepayment income Gpre, and theGini coefficient for postpayment income, Gp,,,. This has been shown by Aronson et al. to beequal to:
(2) RE = V-H-R,
where
1 -g
H la_,GF(X)
and
R- Gy p -Cx p
An explanation of these various indices and their interpretation follows.
VERTICAL INCOME REDISTRIB UTION-THE ROLE OF PROGRESSIVITY
The term V in eqn (2) represents vertical income redistribution-the change in incomeinequality that would have been brought about by health care payments if everyone at eachprepayment income level had paid the same amount towards health care. V depends on twothings, one of which is K. This is Kakwani's [9] index of progressivity, but computed on theassumption that at each income level everyone spends the same amount on health care.Kakwani's index, illustrated in Fig 3, is defined as twice the area between the prepaymentLorenz curve, Lpre, and the payment concentration curve, Lpay, the latter being the graph of thecumulative share of health care payments against the cumulative share of the population, rankedby prepayment income. Equivalently, K is the difference between the payment concentrationindex (defined analogously to the Gini coefficient but with reference to the paymentconcentration curve) and the Gini coefficient. A positive value of K indicates a progressivepayment structure (the case illustrated in Fig 2), whilst a negative value indicates a regressivestructure.
10
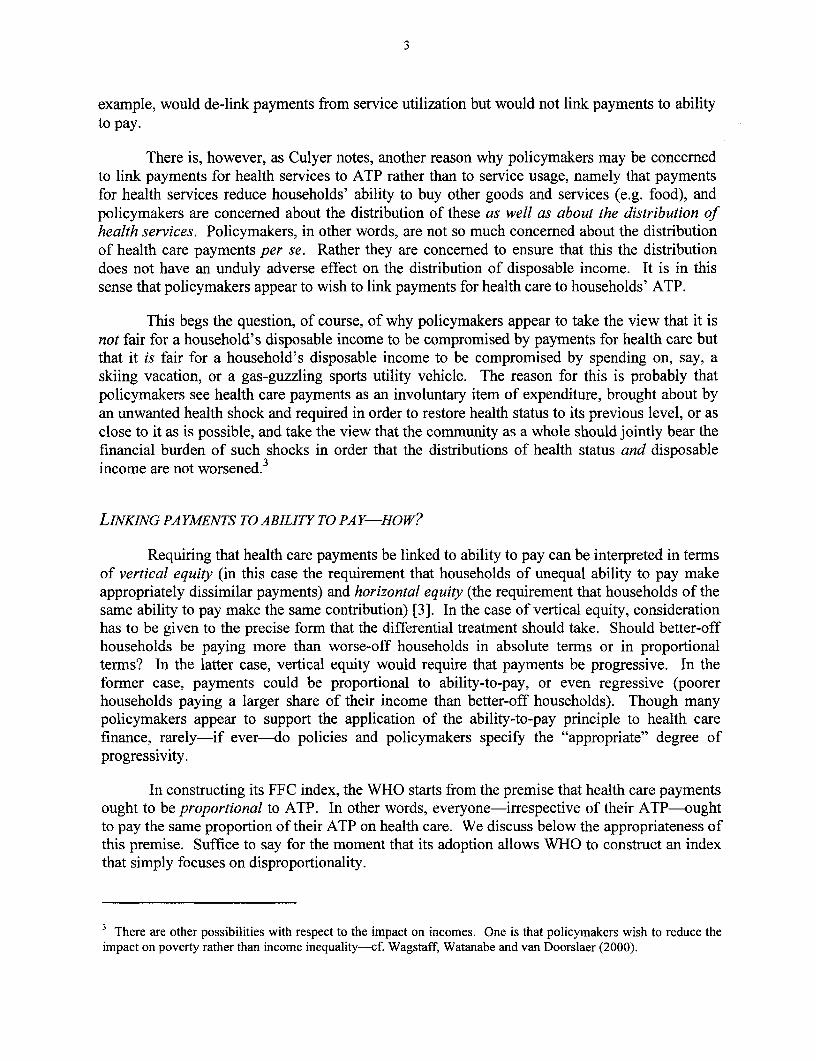
Fig 2:Kakwani index ofprogressivity, and the equalizing effect ofprogressive payments
100%
E
0%
Cumulative % of sample, ranked by income
Payments that are progressive on prepayment income will exert an equalizing effect onthe income distribution-the Lorenz curve for postpayment income, Lp,,, will lie above theLorenz curve for preprayment income, Lp,. By contrast, payments that are regressive onprepayment income will exert a disequalizing effect on the income distribution, so that Lpost willlie below Lp,e So, a policymaker who is concerned to ensure that health care payments do notadversely affect the distribution of postpayment income will clearly disfavor regressive healthcare payments.
It is thus the progressivity of payments on prepayment income that will determine, otherthings equal, the degree of inequality in postpayment income-i.e. the degree of inequality inhouseholds' ability to purchase things other than health care, such as food. This draws attentionto another defect of the WHO work, namely its definition of ATP in terms of income after food'pending. Clearly, in the light of the above, one needs to measure both prepayment and
postpayment income before food outlays. Knowing how progressive health care payments are onprepayment income defined net offood outlays tells us how health care payments influence thedistribution of income available to spend on things other than health care including food. Butthat misses the policymaker's concern entirely, which is precisely that poor households may havetoo little left after health care costs to purchase food. Looking at households' income after foodexpenses have been netted out conceals from us completely their ability to afford food.

11
VERTICAL INCOME REDISTRIBUTION-THE ROLE OF THE INCOME SHARE ABSORBED BY
PA YMENTS
The second component of V is g. This is the share of pre-payment income absorbed byhealth care payments. Other things equal, and except in the case where payments areproportional to prepayment income, the larger the share of prepayment income absorbed byhealth payments, the greater the impact of health care payments on the distribution of income.Thus, for example, in their study of redistributive effect of the health care financing systems ofthe OECD countries, van Doorslaer et al. [7] highlight the fact that although the share of healthcare payments financed out of general taxation in the United States is low by comparison withother OECD countries, because the US spends such a large proportion of its GDP on health care,the share of income spent on health care through the tax system (i.e. g) is relatively large. This,coupled with the fact that the progressivity of general taxation in the US appears to be fairly highby international standards, produces the somewhat surprising result that the taxes used to financehealth care produce more vertical income redistribution in the US than in other OECD countries.
The WHO index reflects the average proportion of prepayment income spent on healthcare. This is to be welcomed inasmuch as g is an important influence on redistributive effect notcaptured by progressivity. It is, however, clearly a separate issue from progressivity, andpolicies can be drawn up that alter g but not K, and vice versa. Thus the fact that, unlikeAronson et al.'s decomposition, the WHO index does not allow the analyst to know how farcross-country differences in FFC reflects differences in g or differences in departures fromproportionality seems an unattractive feature of the index.
HORIZONTAL INEQUITY
In eqn (2), H is classical horizontal inequity. In the Aronson et al. decomposition,households are divided into groups of prepayment equals, and then horizontal inequity isassessed in terms of the extent of inequality in postpayment income within each group. In eqn(2), at, is the product of the population share and postpayment income share of households withprepayment income x, while GF(X) is Gini coefficient for postpayment income for thesehouseholds. If at each prepayment income level, all households pay the same towards healthcare, inequality in postpayment income will be zero for each group of prepayment incomeequals. Any inequality within any group counts as horizontal inequity. Inequality inpostpayment income within each group is measured by the Gini coefficient GF(X), and a weightedsum of these Gini coefficients is constructed, where the weights are the a%'s. This weighted sumis H. Note that, because the Gini coefficients for each group of prepayment equals is non-negative, H is also non-negative. Note too that H appears in eqn (2) with a minus sign in front ofit. In other words, horizontal inequity necessarily reduces RE. This is simply a reflection of thefact that since horizontal inequity entails inequality in postpayment incomes within at least somegroups of prepayment equals, it will always leave the postpayment income distribution moreunequal than would have been the case in the absence of horizontal inequity.

12
AND WHAT OF RERANKING?
The V term in eqn (2) tells us how income inequality is reduced by virtue of theprogressivity or regressiveness of health care payments, on the assumption everyone at eachprepayment income level pays the same towards health care. The H term tells us that withhorizontal differences at each income level, the postpayment income distribution will be lessequal than V would suggest. In the case of regressive payments, H reinforces the disequalizingeffect of V, while in the case of progressive payments it offsets it.
The terms V and H together take us from the prepayment Lorenz curve to a new curve,where households are still ranked by their prepayment income, but where the value on thevertical axis tells us their postpayment income. This is the postpayment concentration curve,labeled CCp,, in Fig 3, and the index corresponding to it is Cx.p in eqn (2). This curve will onlycoincide with the Lorenz curve for postpayment income-in which, in contrast to thepostpayment concentration curve, households are ranked by postpayment income-if householdsdo not move up or down the income distribution as a result of health care payments. If there issome reranking in the move from the prepayment to postpayment distribution, the postpaymentconcentration curve will lie above the postpayment Lorenz curve. The reason is simple [10].Suppose there is reranking at all percentiles of the income distribution. Then some of thehouseholds who amongst the poorest 20% of households in the prepayment income distributionmay well not be amongst the poorest 20% of households in the postpayment income distribution.If this is the case, the share of total postpayment income accruing to the households who werethe poorest 20% in the prepayment distribution will be larger than the share of total postpaymentincome accruing to the households in the poorest fifth in the postpayment distribution. Thus theconcentration curve for postpayment income can never lie below the Lorenz curve forpostpayment income, and insofar as there is reranking will lie above the Lorenz curve. ThusCx p will never be larger than Gp,,t, and R will always be nonnegative.

13
Fig 3:Reranking, concentration and Lorenz curves
0% 100%
Cumulative % of sample, ranked by income
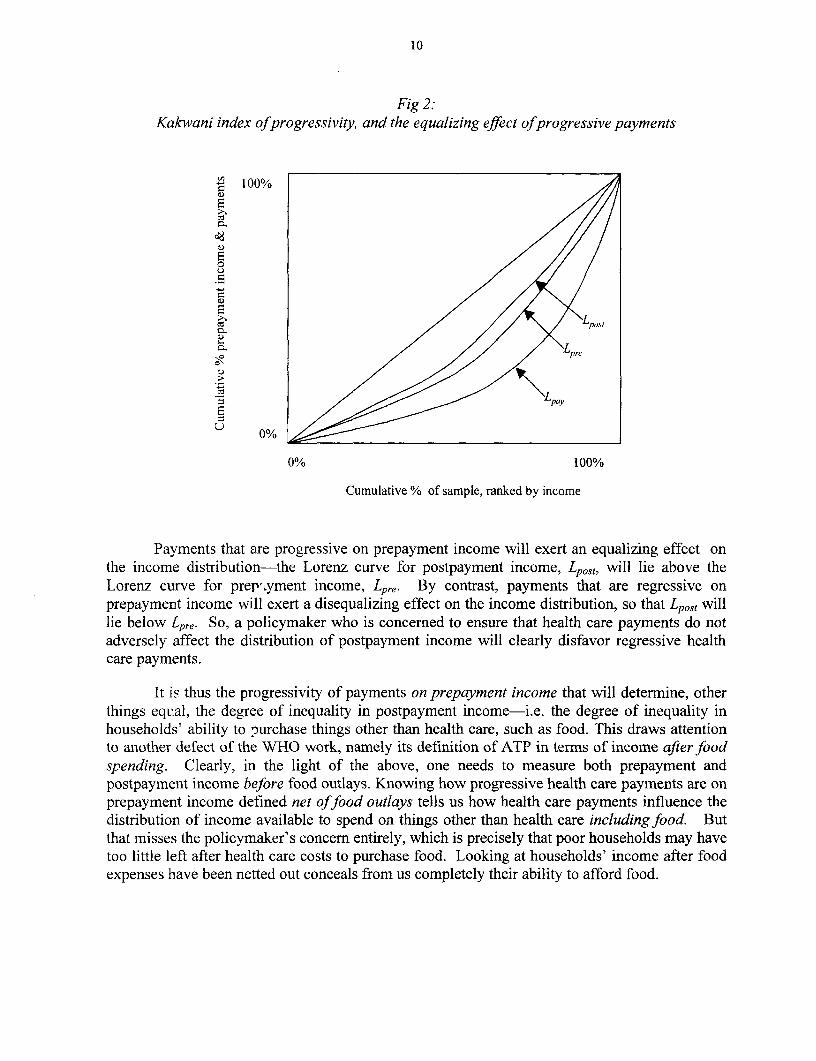
Reranking is quite likely. In principle, reranking could be for one or both of two reasons.The first, is that the marginal "tax" rate may exceed I100%. This is unlikely to be a very commonproblem. The more common reason for reranking is horizontal inequality. This is shown in Fig4 in the case where payments are progressive on prepayment income, X, and hence postpaymentincome, X-P, increases in prepayment income but at a decreasing rate. The average postpaymentincome at any level of prepayment income can be read off the function in Fig 4. There will,however, be variations around this mean. These variations are reflected in a "fan" emanatingfrom the point on the postpayment income function corresponding to the prepayment incomelevel in question, branching out to the postpayment income axis. For example, a household witha prepayment income of $1100 might pay $250 in health care payments, ending up in thepostpayment distribution behind the average household with a prepayment income of $1000,which spends only $ 1000.
14
Fig 4:Horizontal inequity and reranking
ostpaymentncome X-P
990 _ X
900 /_
850
1000 1 100 EPrepayment income X
In short, differences in health care payments at each income level be sufficiently large forhouseholds starting off close to one another in the prepayment distribution to change theirpositions in the move to the postpayment distribution. This possibility was illustrated vividly inthe World Bank's Voices of the Poor exercise [11], which reported that in Lao Cai, Vietnam, a26 year-old man had moved from being the richest man in his community to one of the poorestas a result of the large health care costs necessitated by his daughter's severe illness.
Such rerankings are captured in the move from the postpayment concentration curve tothe postpayment Lorenz curve. They are captured numerically by R in eqn (3). The overlappingof fans (causing households to move up or down the income distribution as a result of health carepayments) is conceptually distinct from horizontal inequity (the existence of fans). However, ifhorizontal differences are the usual source of non-zero values of R, it seems unwise to try tomake too much of the distinction between R and H. This is reinforced by the fact that althoughin the population at large there will be households on the same prepayment income, in ahousehold survey such instances are rare. In empirical work, it therefore becomes necessary todefine equals by reference to bands of prepayment income, within which, for the purpose of theexercise, households are deemed to be equal. The choice of bandwidth inevitably affects thecomputed value of H, but also affects the computed value of R. Specifically, it seems to be thecase that as the bandwidth is widened, H falls and R rises. However, the sum of H and R doesnot seem to change much. This coupled with the fact that it is typically horizontal differencesthat produce reranking, suggests that it may make sense to focus on the sum of H and R, and totreat the sum as capturing horizontal differences.
PUTTING ITALL TOGETHER
This section suggested that the most sensible way to approach equity in health carefinancing is to treat it explicitly as an income redistribution problem-policymakers are not

15
concerned with the distribution of health care payments per se, but rather with their effect on thedistribution of income. The decomposition proposed by Aronson et al. provides a usefulframework for assessing the merits of WHO's index. The decomposition emphasizes thatprogressive and regressive payments have different effects on income inequality, the formerreducing income inequality, the latter increasing it. The WHO index's inability to distinguishbetween progressive and regressive payments thus renders it incapable of distinguishing betweena health care financing system that reduces income inequality and one that increases it. If it istrue that the concern of policymakers lies with the impact of health care payments on incomeinequality, this is a serious limitation of the index. The decomposition also emphasizes that if wewish to examine the influence of health care payments on household's ability to purchase foodand other key goods and services, we need to assess the progressivity of health payments onprepayment income before food spending. Assessing the impact of health care payments onincome after food has already been netted out, as the WHR does, makes little sense. In addition,the decomposition provides a framework for empirically disentangling (a) the verticalredistribution associated with progressivity (K) from vertical redistribution associated with healthcare absorbing a larger share of income (g), and (b) redistribution attributable to verticaldifferences (V) from redistribution attributable to horizontal differences (H). Since the policyissues in each case are different, this seems to be a major advantage of the Aronson et al.decomposition and a major limitation of the WHO index.
VI. An Empirical Illustration:Out-of-Pocket Payments in Vietnam, 1993-98
In this final section, we compare empirically the usefulness of WHO's FFC index and thealternative Aronson et al. approach, using data on out-of-pocket payments in Vietnam as anillustration. As indicated in the Introduction, this is not an uninteresting case study, since around80% of health spending in Vietnam is paid out-of-pocket [2]. Furthermore, three key changesoccurred during the 1990s [2]. First, user fees in the public sector rose. The increase wasespecially pronounced for hospital care, where fees appear to have risen by over 1000% in realterms between 1993 and 1998, but were also noticeable in commune health centers even thoughthese were still supposed to be free in 1998. Second, there was a large rise in fees for privateclinics and doctors. These apparently rose by nearly 600% over the period 1993-98. Third,expenditures on drugs actuallyfell over the period 1993-98, due to a 30% fall in the real price ofmedicines during the period in question. The latter seems to have been due in part toderegulation of the pharmaceutical sector and in part to increased donor assistance in drugsupplies.
DATA, VARIABLE DEFINITIONSAND COMPUTATIONS
The data are taken from the 1992-93 and 1997-98 Living Standards MeasurementSurveys (LSMS) undertaken jointly by the government of Vietnam and the World Bank. For thepurpose of this exercise, the household is taken as the unit of analysis. After deletion of caseswith missing information, the sample contained 4800 households in 1993 and 5999 in 1998.Household prepayment income is measured by total household consumption, gross of out-of-pocket payments for health services. Household postpayment income is simply prepayment

16
income so defined net of out-of-pocket payments. For reasons indicated in section V,prepayment and postpayment income are both defined to be gross of food consumption-thisenables us to see in the case of postpayment income what households have available to spend onfood after paying for health services. Both prepayment and postpayment income are defined ona per capita basis. Out-of-pocket payments are derived in both years from two questions onhealth spending over the last 12 months, one specifically on hospital care, the other on all othergoods and services associated with the treatment and diagnosis of illness and injury.
The WHO FFC index is computed on the same data to provide the comparison with theAronson et al. approach. The FFC index is straightforward to compute. The Aronson et al.decomposition is more involved. RE can be computed simply as the difference between Gpre andGp,st. In each case, the convenient covariance approach was used on household-level data [121.The out-of-pocket share g is computed simply as mean out-of-pocket payments divided by meanprepayment income. To compute K (or more precisely the concentration index for out-of-pocketpayments, Cp) and Cx p one has to decide on appropriate groups of prepayment equals.5 In thisillustration, prepayment equals were defined by expressing prepayment income as a multiple ofthe poverty lines derived by Glewwe, Gragnolati and Zaman [131. Households below thepoverty line were divided into eight groups, the first comprising households with a prepaymentincome between 0% and 12.5% of the poverty line, the second comprising households with aprepayment income between 12.5% and 25% of the poverty line, and so on. Households with aprepayment income of between 100% and 200% of the poverty line were divided into just fourgroups, along similar lines, while those with prepayment incomes in excess of 200% of thepoverty line were divided into just three groups. To put this into perspective, nearly 60% ofhouseholds fell below the poverty line in 1993, and nearly 40% did in 1998. Obviously, othergroupings of prepayment equals are possible. If this were intended as anything other than anillustration, one would want to assess the sensitivity of the results to alternative groupings,though it seems likely that in this case as in other cases where the Aronson et al. decompositionhas been used, widening the bandwidth would be likely to reduce H, increase R, but probablyleave their sum relatively unaffected. With groups of prepayment equals defined, it isstraightforward to compute Cp on the grouped data, and to form the ranking variable to computeCxp. Using the former and Gpre, one can compute K, and using the latter and Gpost one cancompute R. This leaves H, which can be computed as a residual.
RESULTS
Using the definitions indicated above, the values of the WHO FFC index for out-of-pocket payments in Vietnam in 1993 and 1998 are 0.9557 and 0.9617 respectively (cf. Table 1).These are different from the number published in the WHR, in part because the FFC index hereis computed only for out-of-pocket payments (the WHR claims to allocate health revenues fromall sources) and in part because food consumption has not been netted out from totalconsumption in this exercise for the reasons indicated above. The change in the FFC indexsuggests a move towards greater fairness in the out-of-pocket payment component of the
5 Recall that the Kakwani index in eqn (2) needs to be computed on the assumption that everyone at each level ofprepayment income pays the same amount in health care. Hence the need for groups of prepayment equals even inthe computation of K.

17
Vietnamese health care financing system. However, the figures give us no clue as to the reasonsfor this change. Moreover, given that the index is blind as to who pays more as a share of theirincome, the increase in FFC is consistent with a change from quite progressive out-of-pocketpayments to slightly regressive out-of-pocket payments (cf Fig 1).
Table 1 also shows the values of the components of the Aronson et al. decomposition ofredistributive effect. The Gini coefficient for prepayment income increased somewhat (a 7%rise) between 1993 and 1998. In both years, out-of-pocket payments exerted a disequalizingeffect on the income distribution, but in neither year was the impact especially large. To putthese figures in perspective, van Doorslaer et al. [7], using somewhat different definitions,obtained values of RE for out-of-pocket payments for Portugal and the US of -0.0111 and-0.0128 respectively. However, although the magnitude of RE is not especially high in Table 1,what is noteworthy is that that it fell dramatically (by nearly 50%) between 1993 and 1998. Thiswas attributable to both changes in vertical redistribution (V) and changes in horizontaldifferences and reranking (H and R).
Table 1:FFC and RE decomposition for out-of-pocket payments in Vietnam, 1993 and 1998
1993 1998 % change
FFC 0.9557 0.9617 1%
Gp,, 0.3444 0.3700 7%
RE -0.0053 -0.0028 -48%
, 6.0% 5.5% -8%
K -0.0325 -0.0139 -57%
V -0.0021 -0.0008 -61%
H 0.0014 0.0007 -52%
R 0.0019 0.0013 -31%
H+R 0.0033 0.0020 -40%
V % 38.5% 29.2%
H % -25.8% -23.7%
R% -35.6% -47.1%
H+R % -61.5% -70.8%
The reduction in pro-rich redistribution was due in part to a reduction in the overall shareof prepayment income absorbed by out-of-pocket payments-from 6.0% of prepayment incometo 5.5%, a reduction of 8%. This is presumably a reflection of higher user fees at public facilitiesbeing more than offset by smaller outlays on medicines, the latter being due to the 30% reductionin their real price. But by far the bigger change was the reduction in the regressiveness of out-of-pocket payments. Over the period in question, the Kakwani index changed (became lessregressive) by nearly 60%. This presumably reflects the large share of out-of-pocketexpenditures absorbed by drugs (especially for the poor) and the fall in the real price of drugs.The offsetting effect of increased fees in public facilities may well have had little impact on thefinancing burden. By 1998 the fees in the public sector had become so high relative to the

18
average poor household's income that it seems likely that the rise in fees will simply havedeterred the poor from using services. This does not get reflected, of course, in the assessment offinancial fairness. Overall, V changed by 61% between 1993 and 1998-a larger percentagechange than in the case of RE.
The other determinants of redistributive effect were also important during the period inquestion, and also changed. In both years, there was more pro-rich income redistribution causedby horizontal inequity and reranking than there was caused by regressiveness. The term labeledV/o in Table 1 expresses V as a percentage of RE and helps us get a feel for the importance ofhorizontal differences and reranking. V tells us what RE would have been in the absence ofhorizontal differences and reranking. A value of PV/o of, say, 50% tells us that in absence ofhorizontal differences and reranking, the pro-rich income redistribution associated with out-of-pocket payments would have been only 50% of its actual value. In the event, the values of V/Oare between 30-40%, indicating that horizontal differences and reranking combined areresponsible for well over half of the pro-rich income redistribution associated with out-of-pocketpayments. Both figures are far smaller than the figures reported for the OECD countries in vanDoorslaer et al. (op. cit.)-70-97%. It is also worth noting that in both years, the majority of theadditional redistributive effect (i.e. that not due to progressivity) is due to reranking rather thanhorizontal inequity. The aforementioned Voices of the Poor tale of the impoverished Lao Caidoes not appear to be an isolated example by any means. The greater importance of rerankingover horizontal inequity is consistent with the results for out-of-pocket payments in theNetherlands reported in Wagstaff and van Doorslaer [6]. Also of note in Table 1 are thereductions in the values of H and R. The percentage reduction in H is larger, so that rerankingaccounts for an even larger share of the additional redistributive effect in 1998. Although H andR both decline, their overall decline (40%) is smaller than the change in V. Their contribution toredistributive effect, reflected in V°/0, inevitably therefore rises-horizontal differences andreranking were more important as sources of redistributive effect in 1998 than they were in 1993.
The overall picture, then, is one in which out-of-pocket payments absorb a sizeable shareof prepayment income but are not associated with a major impact on income inequality. (Itshould be emphasized that this statement refers to the impact of out-of-pocket payments onincome inequality, not on poverty.) Much of the impact of out-of-pocket payments on incomeinequality stem not from their regressiveness but rather from horizontal differences' andreranking. Between 1993 and 1998, the share of prepayment income absorbed by out-of-pocketpayments fell somewhat and their regressiveness was reduced by a much larger percentage.Over the same period, the redistributive effect associated with horizontal differences andreranking also fell but by smaller percentages, so that these were even more important sources ofredistributive effect in 1998 than in 1993.
Results such as these can help shape policy. Strengthening the user-fee exemptionsystem in Vietnam-especially as far as poor households are concerned-would reduce furtherthe degree of regressiveness of out-of-pocket payments. It would not, however, alter H and R,and it is these that remain the major factors behind the adverse effect of out-of-pocket paymentson income inequality in Vietnam. They tend to be driven largely by the unpredictability ofillness and by the size of payments involved when illness strikes. Additional reductions in thereal cost of drugs and medicines will help to further reduce H and R, but far bigger reductionsseem likely to come through a shifting away from out-of-pocket payments to pre-payment.

19
Though (social) insurance developed considerably in Vietnam between 1993 and 1998, itremains relatively small-scale and is more common amongst the better-off. Further expansioncan be expected to result in the less well-off being covered, and this in turn can be expected toreduce further the values of H and R for out-of-pocket payments, as well as making out-of-pocket payments less regressive.
VII. Conclusions
This paper has argued that the index of financial fairness proposed in the WHR isunattractive. It cannot allow the policymaker to know whether the index deviates from one(complete fairness) because households on similar incomes pay different amounts towards healthcare (horizontal inequity) or because households on different incomes pay different proportionsof their income on health care (vertical inequity, given WHO's interpretation of the ability-to-pay principle). And yet the two have quite different policy implications. Furthermore, and morecontroversially, the index treats progressivity as just as unfair as regressiveness. This is highlyunattractive, since though policymakers may be strongly averse to regressive payments (sincethey worsen the income distribution), they may-from a fairness in financing perspective-bequite willing to see progressive payments. Such payments may come about as the result of achoice by the better-off to spend proportionally more on health care than the worse-off, or as theresult of a deliberate policy to require that that the better-off pay more in proportional terms. Inother words, whilst it is probably accurate say that most policymakers feel comfortable with theability-to-pay principle as the underlying principle of health care finance, it seems most unlikelythat most-if any-interpret this in terms of a hard-and-fast rule on proportionality.
A more useful approach would be one that allows the policymaker to distinguish betweenhorizontal and vertical equity, and to see the degree of progressivity in the existing systemwithout having had the analyst specify in advance how large this should be. Such an approach isprovided by the decomposition framework proposed by Aronson et al. [8] in the early 1990s, andused in the health finance literature in the late 1990s [6, 7]. In this framework fairness isassessed explicitly in terms of the impact of health care financing on the distribution of income,since this is, after all, the ultimate concern amongst policymakers when they think aboutfinancial protection. In the approach, the change in the Gini coefficient for income caused byhealth care payments is decomposed into terms corresponding to changes attributable to overallshare of income absorbed by health care payments, changes brought about by the progressivity(or regressiveness) of the payment structure, changes brought about by horizontal inequities inthe system, and changes brought about by households changing their position in the incomedistribution as a result of health care payments.
In the last part of the paper, this method was illustrated using data on out-of-pocketpayments in Vietnam for the years 1993 and 1998. The WHO index simply indicated a movetowards greater fairness over the period in question, but this could have been because paymentsbecame more progressive, or became less regressive, or became progressive having beenregressive, or became regressive having been progressive, or because of greater differences inpayments at each income level. With the Aronson et al. approach, a much clearer pictureemerged. Over the period in question, health care payments impacted adversely on the incomedistribution in both years, but the degree of impact was smaller in 1998. This was due in part to

20
a reduction in the share of income absorbed by out-of-pocket payments, in part to a reduction inthe regressiveness of out-of-pocket payments, but also in part to reductions in horizontal inequityand reranking. Of the two broad components of redistributive effect-vertical and horizontalredistribution-it was the reduction in vertical redistribution that was more pronounced.
21
References
I. World Health Organization, The World Health Report 2000: Health Systems. 2000, Geneva: The WorldHealth Organization.
2. World_Bank, Vietnam Health Sector Review. 1999, The World Bank: Hanoi.
3. Wagstaff, A. and E. Van Doorslaer, Equity in the finance and delivery of health care: concepts anddefinitions, in Equity in the finance and delivery of health care: An international perspective, E. VanDoorslaer, A. Wagstaff, and F. Rutten, Editors. 1993, OUP: Oxford.
4. Culyer, A.J., Health, health expenditures, and equity, in Equity in the finance and delivery of health care,E. Van Doorslaer, A. Wagstaff, and F. Rutten, Editors. 1993, Oxford University Press: Oxford.
5. Wagstaff, A. and E. van Doorslaer, Equity in health care finance and delivery, in North Holland Handbookin Health Economics, A. Culyer and J. Newhouse, Editors. 2000, North Holland: Amsterdam, Netherlands.p. 1804-1862.
6. Aronson, J.R., P. Johnson, and P.J. Lambert, Redistributive effect and unequal tax treatment. EconomicJournal, 1994. 104: p. 262-270.
7. Wagstaff, A. and E. Van Doorslaer, Progressivity, horizontal equity and reranking in health care finance: adecomposition analysis for The Netherlands. Journal of Health Economics, 1997. 16: p. 499-516.
8. Van Doorslaer, E., et al., The redistributive effects of health care finance in 12 OECD countries. Journal ofHealth Economics, 1999. 18(3): p. 291-314.
9. Kakwani, N.C., Measurement of tax progressivity: An international comparison. Economic Journal, 1977.87(345): p. 71-80.
10. Lambert, P., The distribution and redistribution of income: A mathematical analysis. 2nd ed. 1993,Manchester: Manchester University Press.
11. Narayan, D., R. Chambers, M. Shah, and P. Petesch, Global synthesis: Consultations with the poor. 1999,World Bank: Washington DC.
12. Lerman, R.I. and S. Yitzhaki, A note on the calculation and interpretation of the Gini index. EconomicsLetters, 1984. 15: p. 363-368.
13. Glewwe, P., M. Gragnolati, and H. Zaman, Who gainedfrom Vietnam's boom in the 1990s?, PolicyResearch Working Paper. 2000, The World Bank: Washington DC.

Policy Research Working Paper Series
ContactTitle Author Date for paper
WPS2530 The Role of Nongovernmental Shanti Jagannathan January 2001 S. KumarOrganizations in Primary Education: 87021A Study of Six NGOs in India
WPS2531 Growth Implosions, Debt Explosions, William Easterly January 2001 K. Labrieand My Aunt Marilyn: Do Growth 31001Slowdowns Cause Public Debt Crises?
WPS2532 Market Presence, Contestability, and Maurice Schiff January 2001 L. Tabadathe Terns-of-Trade Effects of Won Chang 36896Regional Integration
WPS2533 How Much War Will We See? Ibrahim Elbadawi January 2001 H. SladovichEstimating the Incidence of Civil Nicholas SambanisWar in 161 Countries
WPS2534 Indigenous Ethnicity and Taye Mengistae January 2001 R. BonfieldEntrepreneurial Success in Africa: 31248Some Evidence from Ethiopia
WPS2535 Trade Policy Reform in the East Asian Will Martin January 2001 L. TabadaTransition Economies 36896
WPS2536 Malaysian Capital Controls Ron Hood January 2001 H. Abbey80512
WPS2537 Regulatory Reform in Mexico's Juan Rosell6n January 2001 K. NemesNatural Gas Industry: Liberalization Jonathan Halpern 85440In the Context of a Dominant UpstreamIncumbent
WPS2538 Designing Natural Gas Distribution Juan Rosell6n January 2001 K. NemesConcessions in a Megacity: Tradeoffs Jonathan Halpern 85440Between Scale Economies andInformation Disclosure in Mexico City
WPS2539 Disorganization or Self-Organization? Francesca Recanatini January 2001 M. JohnsonThe Emergence of Business Randi Ryterman 36320Associations in a Transition Economy
WPS2540 Recapitalizing Banking Systems: Patrick Honohan February 2001 A. YaptencoImplications for Incentives and Fiscal 31823and Monetary Policy
WPS2541 Household Schooling Decisions in Yasayuki Sawada February 2001 P. SaderRural Pakistan Michael Lokshin 33902

Policy Research Working Paper Series
ContactTitle Author Date for paper
WPS2542 Checks and Balances, Private Philip Keefer February 2001 P. Sintim-AboagyeInformation, and the Credibility of David Stasavage 37644Monetary Commitments
WPS2543 When Do Special Interests Run Philip Keefer February 2001 P. Sintim-AboagyeRampant? Disentangling the Role in 37644Banking Crises of Elections, IncompleteInformation, and Checks and Balances
WPS2544 The Uniqueness of Short-Term Leora Klapper February 2001 A. YaptencoCollateralization 31823
WPS2545 Financing the Future: Infrastructure Marianne Fay February 2001 A. FrangoisNeeds in Latin America, 2000-05 37841
WPS2546 Gender Dimensions of Pension Paulette Castel February 2001 J, SmithReform in the Former Soviet Union Louise Fox 87215
WPS2547 The Design of Incentives for Health Jeffrey S. Hammer February 2001 H. SladovichCare Providers in Developing William G. Jack 37698Countries: Contracts, Competition,and Cost Control
WPS2548 International Provision of Trade Alan V. Deardorff February 2001 L. TabadaServices, Trade, and Fragmentation 36896
WPS2549 Measuring Poverty Dynamics and Erzo F. P. Luttmer February 2001 C. WodonInequality in Transition Economies: 32542Disentangling Real Events fromNoisy Data