materials chemistry and performance of silicone-based...
TRANSCRIPT

SANDIA REPORTSAND2014-20003Unlimited ReleasePrinted November 2014
Materials Chemistry and Performance of Silicone-Based Replicating Compounds
Michael Brumbach, Michael Kalan, Alex Mirabal, Ana Trujillo, Kevin Hale
Prepared bySandia National LaboratoriesAlbuquerque, New Mexico 87185 and Livermore, California 94550
Sandia National Laboratories is a multi-program laboratory managed and operated by Sandia Corporation, a wholly owned subsidiary of Lockheed Martin Corporation, for the U.S. Department of Energy's National Nuclear Security Administration under contract DE-AC04-94AL85000.
Approved for public release; further dissemination unlimited.

2
Issued by Sandia National Laboratories, operated for the United States Department of Energy by Sandia Corporation.
NOTICE: This report was prepared as an account of work sponsored by an agency of the United States Government. Neither the United States Government, nor any agency thereof, nor any of their employees, nor any of their contractors, subcontractors, or their employees, make any warranty, express or implied, or assume any legal liability or responsibility for the accuracy, completeness, or usefulness of any information, apparatus, product, or process disclosed, or represent that its use would not infringe privately owned rights. Reference herein to any specific commercial product, process, or service by trade name, trademark, manufacturer, or otherwise, does not necessarily constitute or imply its endorsement, recommendation, or favoring by the United States Government, any agency thereof, or any of their contractors or subcontractors. The views and opinions expressed herein do not necessarily state or reflect those of the United States Government, any agency thereof, or any of their contractors.
Printed in the United States of America. This report has been reproduced directly from the best available copy.
Available to DOE and DOE contractors fromU.S. Department of EnergyOffice of Scientific and Technical InformationP.O. Box 62Oak Ridge, TN 37831
Telephone: (865) 576-2087Facsimile: (865) 576-5728E-Mail: [email protected] ordering: http://www.osti.gov/bridge
Available to the public fromU.S. Department of CommerceNational Technical Information Service5301 Shawnee RdAlexandria, VA 22312
Telephone: (800) 553-6847Facsimile: (703) 605-6900E-Mail: [email protected] order: http://www.ntis.gov/help/ordermethods.aspx#online

3
SAND2014-20003Unlimited Release
Printed November 2014
Materials Chemistry and Performance of Silicone-Based Replicating Compounds
Michael Brumbach, Michael Kalan, Alex Mirabal, Ana TrujilloMaterials Characterization and Performance
Sandia National LaboratoriesP.O. Box 5800
Albuquerque, New Mexico 87185-MS0886
Kevin HaleMilitary Liaison
Los Alamos National LaboratoriesP.O. Box 1663
Los Alamos, New Mexico 87185-MSA118
Abstract
Replicating compounds are used to cast reproductions of surface features on a variety of materials. Replicas allow for quantitative measurements and recordkeeping on parts that may otherwise be difficult to measure or maintain. In this study, the chemistry and replicating capability of several replicating compounds was investigated. Additionally, the residue remaining on material surfaces upon removal of replicas was quantified. Cleaning practices were tested for several different replicating compounds. For all replicating compounds investigated, a thin silicone residue was left by the replica. For some compounds, additional inorganic species could be identified in the residue. Simple solvent cleaning could remove some residue.

4
ACKNOWLEDGMENTS
We would like to thank Mark Rodriguez and James Griego for characterization with XRF, James Ohlhausen for analysis with ToF-SIMS, Steve Meserole and David Tallant for help with FTIR and Raman, Alice Kilgo for help with confocal microscopy, and Patti Sawyer for assistance with DSC. We would also like to thank James Aubert, Iliarys Matos, and Lysle Serna for additional support and advice.

5
CONTENTS
1. INTRODUCTION ......................................................................................................................9
2. METHODS ...............................................................................................................................11
2. MATERIAL ANALYSIS.........................................................................................................14
4. RESIDUE ANALYSIS.............................................................................................................22
4. RESOLUTION .........................................................................................................................29
5. CONCLUSIONS ......................................................................................................................35
4. REFERENCES .........................................................................................................................37
Distribution [can go on an even or an odd page]...........................................................................40
FIGURES
Figure 1. Catalyst samples were used to investigate settling of its constituents. In (A) catalyst from two different colors of replicating material were subjected to 45 minutes of centrifugation at 5000 rpm. Some noticeable separation was observed in both catalysts. Samples were also allowed to settle by keeping them vertical for 48 days, as shown in (B). Some separation was again evident. .................................................................................................................................14Figure 2. Raman spectra are shown for the black and grey resin along with the Raman spectrum from the catalyst. ...........................................................................................................................15Figure 3. An optical image of resin squeezed between two plates of KBr shows separation of clear constituents from colored components. (A) The corner shows a clear area where no resin is observed, only the KBr windows are present. (B) Clear areas are observed showing the colorless fluid component of the resin. (C) The lighter area is due to light form the microscope, however this area and the surrounding darker film (D) are colored resin between the KBr plates. Darks spots are likely aggregations of particles within the resin. .................................................16Figure 4. FTIR spectra are shown for two different catalyst samples, and regions of the grey and black resins where color was, and was not, observed....................................................................16Figure 5. An FTIR spectrum is shown for a cured replica showing strong similarities to PDMS........................................................................................................................................................17Figure 6. Images from XRF analysis are shown. (A) The optical image of three spots on a KBr plate is shown where (i) is black resin, (ii) is grey resin, and (iii) is catalyst from the grey sample. The red box indicates the area used for XRF spectral mapping. (B) shows the underlying potassium signal from XRF. The catalyst is clearly thinner less viscous than the two resin spots. (C) Silicon is observed in all three spots. (D) Titanium is only detected in the grey resin spot, likely as TiO2. ................................................................................................................................18Figure 7. ToF-SIMS spectra are shown for three different colors of resin. The resins were all determined to be silicone based polymers at the surface. No distinguishing characteristics could be determined between the different samples................................................................................19Figure 8. Isothermal DSC scans are shown for the curing of three resin samples conducted at 25°C. At t=0, catalyst and resin were mixed and the heat flow was recorded. The area under the isothermal curves was integrated to obtain the heat of reaction in mJ for the curing process. .....19

6
Figure 9. The heat of reaction (in mJ) is shown for tubes of various ages (A). The newest (June 2015) sample shows the highest heat of reaction. The heat of reaction is also shown for three different colors (B) showing that the white sample shows the most curing. .................................20Figure 10. The heat of reaction is shown for three different curing times of Product A. The curing time was the shortest for (I) and the longest for (III). The intermediate curing time sample (II) showed the lowest heat of reaction. The longest curing time sample (III) showed the most heat of reaction. .............................................................................................................................20Figure 11. ToF-SIMS spectral images are shown for the residue remaining on a surface of aluminum after removal of a replicating impression. (A) shows the Al+ signal across the aluminum coupon. The brightness corresponds to surface concentration, showing that the aluminum signal is attenuated by overlying residue in the dark balloon shape in the middle of the aluminum coupon. The corresponding silicone signature is shown in (B) for the ion fragment [(CH3)3SiO(CH3)2Si]+ (normalized to Al+ (m/z 147)). ..................................................................22Figure 12. The change in atomic concentrations due to residue is shown on aluminum substrates after repeated replications. The y-axis is the change in the sum of contaminant species (carbon and silicon atomic concentrations from XPS) from that of the as-received aluminum surface. Two trials were performed giving similar results..........................................................................23Figure 13. The change in atomic concentrations due to residue is shown on iron/nickel substrates after repeated replications. The y-axis is the change in the sum of contaminant species (carbon and silicon atomic concentrations from XPS) from that of the as-received surface. The residue increases with repeated applications..............................................................................................23Figure 14. The amount of silicone residue (C+Si) removed by various cleaning solvents is shown for residue on aluminum coupons. Isopropanol and toluene have an equivalent ability to remove residue, while hexane can remove slightly more contaminant. ........................................24Figure 15. The amount of carbon and silicon residue removed from iron-nickel substrates by various cleaning solvents is shown. Isopropanol and toluene removed C and Si equally well. Hexane effectively removed silicon- containing contamination, but had no effect on carbonaceous contamination. Overall, all three solvents were more effective on iron-nickel substrates than on aluminum. ........................................................................................................25Figure 16. (A) The increase in concentration of carbon and silicon due to residue from the replicating compound is shown for four different types of stainless steel (C, D, M, and N). Sample M showed no increase in residue concentration suggesting that the sample itself was already contaminated. (B) Cleaning with isopropanol (IPA) was successful at removing carbon and silicon on samples C and N, however, IPA had almost no effect on samples D and M. (C) Cleaning with toluene reduced the amount of carbon and silicon on samples D, M, and N, but had no effect on sample C. ............................................................................................................25Figure 17. The change in the sum of contaminant species (carbon and silicon atomic concentrations from XPS) on iron-nickel samples is shown after repeated replications using Product B. The concentrations are also shown for the samples after cleaning with isopropanol (IPA). .............................................................................................................................................26Figure 18. (A) The change in the sum of contaminant species (carbon and silicon atomic concentrations from XPS) on iron-nickel samples is shown after repeated replications with Product C. The concentrations are also shown for the samples after cleaning with isopropanol (IPA). (B) The concentration of copper is shown. (C) The concentration of chlorine is shown. (D) The concentration of nitrogen is shown. ................................................................................27

7
Figure 19. (A) The change in the sum of C, Si, Ca, and Sn concentrations after repeated replications of Product D are shown for iron-nickel substrates. After cleaning with toluene, the total concentration of residue species decreased. In (B) the Si and Sn concentrations are shown after toluene cleaning. Sn could not be completely removed by toluene rinsing. ........................28Figure 20. Scratches were made in aluminum spelling the letter S, N, and L as shown in the optical image (A). A silicone replication was made as show in (B) where the letters are reversed. The color contrast is as great in the replication. The corner of the letter L (C) was used for confocal microscopy characterization. In (D) the groove in the aluminum is shown using confocal microscopy. The replication of the corner is shown in (E)...........................................29Figure 21. AFM images are shown for a calibration grid (A) and the grid after removal of a replicating resin (B). The AFM image of the replica is shown in (C). A replication was also performed using an expired replicating compound as shown in the AFM image in (D). .............31Figure 22. Three line scans across the AFM images are shown for the calibration grid (A), the grid after removal of a replicating resin (B), the replica is shown in (C), and across a replica using an expired replicating compound (D). .................................................................................32Figure 23. AFM images are shown for a calibration grid (A) and a replica (B). Three lines scans across the AFM grid are shown in (C). Three line scans across the replica are shown in (D). In € selected line scans have been normalized and adjusted on the x-axis to align the line scans for the grid, the grid after removal of a replica, and for the replica. .........................................................34
TABLES
Table 1. Product Descriptions.......................................................................................................11Table 2. Peak Associations from Raman Spectra .........................................................................15Table 3. Dimensions from AFM Line Scans. ...............................................................................33

8
NOMENCLATURE
DOE Department of EnergySNL Sandia National LaboratoriesXRFDSCXPSToF-SIMSFTIRRamanPDMSResinCatalystMixed resinReplicaResidue

9
1. INTRODUCTION
Fast-curing impression materials are used to cast negative-mold replications of material surfaces. Impression materials (or replicating materials) are generally used when measurements cannot be taken directly on the surface of interest. Often a sample is too large to be placed within the confines of a measuring instrument (such as a microscope), the geometry of the sample is such that the area of interest is difficult to access (e.g. within a hole), or the temperature of sample must be preserved (e.g. ice). Additionally, replicas may be desired to physically record a surface feature for documentation purposes or historical archiving. Many applications of replicating compounds can be found including their use in forensics and dentistry.
Replicating materials usually come as a two part product, a resin and a catalyst. The resin and the catalyst are mixed and begin to cure via cross-linking of the polymer constituents of the catalyst and resin. The catalyst often contains an inorganic species, such as Pt or Sn, but other catalysts are possible, such as peroxide. The curing time of the replicating compound can be tuned from less than a minute to several hours according to the type and concentration of catalyst. Generally, replicating compounds are designed to cure quickly. Thus, the fluid mixture of catalyst and resin can be pressed into the surface features of a sample, allowed to cure/harden, and then removed within approximately 5 minutes.
Impression materials are designed to have low adhesion to substrate materials so they can be easily removed from the surface. This allows the replica to maintain the configuration of the surface and limits the amount of residue left on the initial part. For some applications, the residue remaining on the replicated part may be relevant. Also, in some cases, it may be desirable to make multiple replications which may compound the residue. In this study, the composition and quantity of the residue was of interest. The amount of residue was also tested on various substrates to determine if the substrate played any role in the quantity of residue. Simple cleaning procedures were tested to determine if there was a best practice for removing the residue from replicated surfaces.

10

11
2. METHODS
In this study four replicating compounds were investigated. The compounds are commercially available and will be referred to as Product A, B, C, and D according to the descriptions given in Table 1. Most of this report focuses on Product A; however the comparison to other replicating compounds is informative.
Table 1. Product Descriptions
Resin:Catalyst Application
Product A 10:1 Applicator gun with static nozzle
Product B 1:1 Applicator gun with static nozzle
Product C 2:1 Hand-mixing
Product D 10:1 Hand-mixing
There are a large number of commercially available replicating compounds. The term “impression” has generally been found to imply a dental application. From a mixing and application perspective there are two types of replicating compounds: 1) compounds that come in a cartridge system which can be squeezed out using an application gun (similar to a caulking gun), or 2) compounds that come in tubes and are mixed manually by hand. For Product A and B the catalyst and resin are squeezed out simultaneously using an applicator gun. The two compounds mix through a nozzle attached to the end of the tubes. The mixed material can be applied directly to a surface from the end of the nozzle. External pressure, by pressing on the mixed resin with a backing plate and finger pressure, molds the resin to the surface. For Products C and D, aliquots of the resin and catalyst are dispensed from separate tubes onto a disposable surface. The volume ratio and extent of mixing determine the ultimate curing time. The two aliquots are mixed with a disposable utensil, such as a wooden spatula, and the mixed resin can be applied to the surface of interest. The hand-mixing process is subjective, making reproducibility and consistency difficult. There is also generally more waste produced from the hand-mixing process than the static nozzle application.
The resin of Product A was homogeneous and viscous. The catalyst of Product A was also viscous, but there was observable separation of different fluids when stored in a clear vial. Product B also showed viscous fluids in both tubes, but separation of individual components was not investigated. The individual resin and catalyst components of Product C and D were also viscous; however, Product D contained an oily component that had to be intentionally mixed in with the more viscous constituents. Product D had a strong odor of organic solvents. Product C had a noxious fresh scent and changed color from blue to green during curing.
For analysis, a number of analytical techniques were employed to characterize the raw material resin and catalyst, the replica, and the residue. The raw materials of Product B, C, and D were not analyzed for their chemical constituents, but Product A was characterized and will be discussed below. FTIR was used to characterize components of the replicating compound and

12
the replica. FTIR was performed using a Thermo-Nicolet Model 6700 interferometer. Analysis conditions in most cases involved 256 to 1024 scans with NaCl or KBr windows. The transmission scans were from 740 to 4000 cm-1 using a MCT-A detector. The cured sample was analyzed using a Diamond DurasamplIR accessory, giving a single bounce ATR (Attenuated Total Reflectance).
Raman was performed using a Horiba Scientific LabRam 800HR instrument. The analysis conditions included ten scans with 10 second acquisitions (averaged) using a 532nm laser (set at 10mW) and a 50x objective. Scans were from 200 to 3300 cm-1 using a Synapse Array Detector.
Centrifugation on resin and catalyst from Product A was performed. Resin samples centrifuged at 4000 rpm for 30 minutes gave no separation. Catalyst centrifuged at 5000 rpm for 45 minutes gave a separation of components with a clearer fluid at the top. Catalyst samples were also allowed to settle by gravity in small clear vials. After 48 days, some separation could be observed.
Differential scanning calorimetry was performed using a TA Instruments DSC Q200. Isothermal scans were performed at 25oC. Aliquots of Product A were dispensed onto the analysis pan using the applicator gun and static mixing nozzle. The scan was started immediately after dispensing the material. Masses were measured after the scans were complete. ToF-SIMS was performed using and Ion-ToF ToF-SIMS. Surface analysis spectra were acquired on 3 random locations for each sample. The source was Bi1
+ at 25kV over a 100x100um2 area. Ten frames at 128x128 pixels with a random raster and charge compensation was employed. Positive secondary ions were collected. For imaging a stage raster of 13.2 x 13.2 mm using 25 kV Bi1
+ was used. 45 x 45 patches with 1980 x 1980 total pixels and 20 shots per pixel in 1 scan were used to compile the image.
XPS was performed using a Kratos Axis Ultra DLD spectrometer. Monochromatic Al K-alpha was used as the X-ray source. Survey scan were typically the most useful analysis for this study giving atomic concentrations of surface species. Survey scans were performed using a Pass Energy of 180 eV. Typically, three points on each sample were analyzed to get statistically relevant compositions.
XRF was performed using a Bruker M4 Tornado instrument. The source is a Rh X-ray Tube at 50 kV and 250 μA. The X-ray tube uses a 25 μm polycapillary focused spot. The analysis is run under vacuum at 20 mBar. Measurement parameters for area scans include spot to spot distance of 10 μm. The measurement time is 5 ms for time/pixel. Scan area sizes vary from 0.5 x 0.5 mm up to 200 x 160 mm.
ICP-MS was performed using a Perkin Elmer Elan 6100 DRC instrument. Samples were digested in a mixture of nitric acid and hydrofluoric acid at room temperature. Samples were analyzed semi-quantitatively by ICP-MS to identify metals that were present in the digested material. These identified metals were then quantitatively analyzed by ICP-MS. The values are the average and standard deviation of measurements made from triplicate samples.

13
AFM was performed using a Bruker Dimension Icon AFM. Analysis was performed in air using Scan Asyst in Peak Force Quantitative Nanomechanical analysis tapping mode. Zeiss LSM700 Confocal Microscope was used to image the topography of substrate and replica samples. Acquisition was performed using Z-stack mode, a 405 nm laser running at 3%, and a gain setting of 304. A pin hole 12 μm, 50x objective, 1x zoom was used.
An Electron Microscopy Sciences Planotec Silicon Test Specimen Grid was used as a calibration standard. Grid geometry consisted of a square mesh of course lines 500 µm spacing with 50 intermediate fine lines of 10 µm spacing etched into a single crystal silicon substrate.
For analysis of residue polished aluminum or iron-nickel coupons were used as substrates. The substrates were cleaned with a series of solvents and finally with UV/ozone. A replica was then prepared on the substrates. Replicas were allowed to cure and were then removed. The process was repeated on some substrates to evaluate the build-up of residue due to multiple replications on a single substrate. For cleaning studies, residue samples were characterized and were then sonicated in respective solvents for 10 minutes each. After drying, the samples were again characterized.

14
2. MATERIAL ANALYSIS
Resin, catalyst, and/or replicas were characterized using a number of techniques to examine the major constituents. Resin and catalyst were isolated in separate vials to characterize segregation of different viscosities. Resin was very viscous and homogeneous. Centrifugation of resin did not result in any separation. Catalyst from Product A however did reveal separable components. Figure 1 shows samples after centrifugation. A less viscous and more transparent constituent separated to the top of the fluid. The clear constituent could also be observed to segregate after gravitational settling over a prolonged storage period of 48 days.
Figure 1. Catalyst samples were used to investigate settling of its constituents. In (A) catalyst from two different colors of replicating material were subjected to 45 minutes of centrifugation at 5000 rpm. Some noticeable separation was observed in both catalysts.
Samples were also allowed to settle by keeping them vertical for 48 days, as shown in (B). Some separation was again evident.
Raman spectroscopy of several different colors of Product A is shown in Figure 2. The resin from is silicone based in all cases. Peaks labeled in Figure 2 are identified in Table 1. In the black resin carbon was identified as a filler material, giving its black color. In the grey resin, rutile TiO2 was identified. TiO2 is a white filler material and the combination of TiO2 and carbon give the grey resin its distinctive color. White resin would presumably only have TiO2 as a coloring filler. Raman scattering by silica would result in relatively low-intensity bands that would be obscured by other features of the Raman spectra. Consequently, the likely presence of fumed silica in the resin could not be confirmed via Raman.
Raman spectroscopy of the catalyst showed it was also silicone based without any significant filler additive. Spectroscopy of separated components of the catalyst was dominated by silicone peaks. The differences between separated components could not be clearly identified without further analyses.

15
0
5
10
15
20
25
30
35
40
45
50
200 700 1200 1700 2200 2700 3200
Inte
nsit
y (x
103 )
Wavenumbers (cm-1)
Black Resin
Grey Resin
Catalyst
490
708
446
1269
1414
2906
2964
613
790
1600
Figure 2. Raman spectra are shown for the black and grey resin along with the Raman spectrum from the catalyst.
Table 2. Peak Associations from Raman Spectra
peak constituent
446 TiO2
490 PDMS
613 TiO2
708 PDMS
790 PDMS
1269 PDMS
1414 PDMS
1600 carbon black
2906 PDMS
2964 PDMS
FTIR spectroscopy was also used to investigate the resin and catalyst. FTIR showed complementary results to those obtained with Raman. Figure 3 shows an optical image of resin compressed between two plates of KBr. Different components were observed to separate in the optical image and could be investigated independently. Figure 4 shows the resulting FTIR spectra from regions that appeared to be colored versus uncolored.

16
A BB
C
D
Figure 3. An optical image of resin squeezed between two plates of KBr shows separation of clear constituents from colored components. (A) The corner shows a clear area where no resin is observed, only the KBr windows are present. (B) Clear areas are observed showing the colorless fluid component of the resin. (C) The lighter area is due to light form the microscope, however this area and the surrounding darker film (D) are colored resin between the KBr plates. Darks spots are likely aggregations of particles
within the resin.
72512251725222527253225
Abs
orba
nce
Wavenumbers (cm-1)
Catalyst - from Grey
Catalyst - from Black
Grey Resin - no pigment
Grey Resin - pigmented
Black Resin - no pigment
Black Resin - pigmented
29
04
CH
3
29
64
CH
3
80
0 S
i-C
H3
12
61
Si-
CH
3
10
20
Si-
O-S
i
Figure 4. FTIR spectra are shown for two different catalyst samples, and regions of the grey and black resins where color was, and was not, observed.
As with Raman, FTIR shows that the resin and catalyst are predominantly silicone-based (PDMS). It is likely that the catalyst comprises a silicone based polymer with some reactive end

17
groups that allow for cross-linking. Small amounts of additional species in the catalyst, probably those listed in the MSDS, are indicated by the presence of methylene groups (-CH2-), which tended to concentrate in the bottom and middle portions of centrifuged samples. There were no indications of organic pigments in any of the samples. There was also no evidence of colorants in the catalyst. FTIR spectra of both the black and grey resin samples indicate the presence of a fumed silica additive.
Figure 5 shows the FTIR spectrum from ATR on a cured replica of Product A. The spectrum is dominated by PDMS peaks. No other significant species could be identified.
750125017502250275032503750
Abs
orba
nce
Wavenumbers (cm-1)
2964
CH
3
1261
Si-C
H3
800
Si-C
H3
1020
-10
94
Si-O
-Si
Figure 5. An FTIR spectrum is shown for a cured replica showing strong similarities to PDMS.
XRF was used to confirm the presence of TiO2 in the grey resin, as shown in Figure 6. The optical image shows a black resin sample, a grey resin sample, and a sample of catalyst. The catalyst is less viscous and flowed into a much larger spot. The large catalyst spot is apparent in the Si map where a large ring surrounds the more concentrated central spot. Si is clearly mapped for all three samples indicating the PDMS polymer and possibly fumed silica. The Ti map only shows titanium in the grey resin sample, consistent with the Raman results discussed above.

18
A B
C D
i
ii iii
Figure 6. Images from XRF analysis are shown. (A) The optical image of three spots on a KBr plate is shown where (i) is black resin, (ii) is grey resin, and (iii) is catalyst from the grey sample. The red box indicates the area used for XRF spectral mapping. (B) shows
the underlying potassium signal from XRF. The catalyst is clearly thinner less viscous than the two resin spots. (C) Silicon is observed in all three spots. (D) Titanium is only
detected in the grey resin spot, likely as TiO2.
To further compare different colors of Product A, ToF-SIMS was employed. Cured replicas were analyzed as shown in Figure 7. As with the spectroscopic techniques, only silicones were identified. Interestingly, even with the ppm detection limits of ToF-SIMS, no discernable differences could be observed between the various colored replicas. This discrepancy is due to the surface sensitivity of ToF-SIMS, suggesting that the replica surfaces are uniformly coated with silicone. The filler, or other constituents, are covered by silicone. This property lends to the low adhesion exhibited by these replicas and their relatively easy removal from substrates.

19
Mass (u)10 20 30 40 50 60 70 80 90
2x10
2.0
4.0
6.0
3x10
0.51.01.52.0
3x10
0.51.01.5
Inte
nsity
(cou
nts)
Black Microset Area 2 Pos_0
Grey Microset Area 2 Pos_0
White Microset Area 2 Pos_0
White
Grey
Black
Figure 7. ToF-SIMS spectra are shown for three different colors of resin. The resins were all determined to be silicone based polymers at the surface. No distinguishing
characteristics could be determined between the different samples.
The curing of Product A was evaluated using isothermal DSC. Three isothermal DSC curves are shown in Figure 8. The areas beneath the three curves were used to determine the energy released during curing. Since these materials cure rapidly, there is likely some curing that is not accounted for in these DSC curves. However, the analyses were performed consistently, so comparisons between samples should be valid.
Hea
t Flo
w (W
/g)
Figure 8. Isothermal DSC scans are shown for the curing of three resin samples conducted at 25°C. At t=0, catalyst and resin were mixed and the heat flow was recorded. The area under the isothermal curves was integrated to obtain the heat of reaction in mJ
for the curing process.

20
Curing studies revealed that expired tubes of Product A showed less curing than unexpired tubes, Figure 9. The DSC results suggest that some cross-linking may occur in either the catalyst or resin over time even in the sealed packaging. Alternatively, the catalyst may become less active over time due to some reaction and/or settling. The differences revealed by DSC are very small and would not be noticeable in a practical application. Curing of the different colors of Product A was also studied via DSC, Figure 9B. The white product showed more energy released during curing, possibly attributable to the presence of TiO2 or the viscosity of the white resin. Various curing times were analyzed via DSC, Figure 10. The longest curing time samples showed the most curing probably due to more cross-linking.
0
2
4
6
Jan. 2012 Feb. 2013 Mar. 2014 June 2015
Ener
gy (m
J)
Expiration Date
0
2
4
6
8
10
Grey Black White
Ener
gy (m
J)
Resin Color
A B
Figure 9. The heat of reaction (in mJ) is shown for tubes of various ages (A). The newest (June 2015) sample shows the highest heat of reaction. The heat of reaction is also shown for three different colors (B) showing that the white sample shows the most
curing.
0
2
4
6
8
10
12
14
I II III
Ener
gy (m
J)
Product A - Curing Time Type
Figure 10. The heat of reaction is shown for three different curing times of Product A. The curing time was the shortest for (I) and the longest for (III). The intermediate curing time sample (II) showed the lowest heat of reaction. The longest curing time sample (III)
showed the most heat of reaction.

21
Since many silicone-based chemistries utilize a platinum catalyst to initiate cross-linking, ICP-MS was used to evaluate the presence and quantity of platinum. Two samples of catalyst from Product A were analyzed. ICP-MS showed platinum at 3200 ± 80 ppm and lithium at 300 ± 40 ppm.

22
4. RESIDUE ANALYSIS
In the previous section the resin, catalyst, and replica materials were analyzed. The replicas are silicone based, so the adhesion to substrates is quite low such that replicas can be easily removed. However, there is an invisible residue in every case. Surface sensitive techniques can be used to characterize the residue. In this section, the residue from a cured replica is characterized along with methods for cleaning. Figure 11 shows a ToF-SIMS map for aluminum and silicone species on an aluminum coupon after removal of a replica. The replica was a balloon shape and the residue is clearly evident on the coupon corresponding to the previous location of the replica. On the aluminum coupon, the Al+ intensity is attenuated by overlying residue. The residue shows bright intensity in the silicone map directly corresponding to the residue.
12
10
8
6
4
2
012840mm
Si2OC5H15+ normalized to Al+MC: 7; TC: 1.841e+009
7.0
6.0
5.0
4.0
3.0
2.0
1.0
12
10
8
6
4
2
012840mm
Al+MC: 977; TC: 1.003e+008
800
600
400
200
0
A B
Figure 11. ToF-SIMS spectral images are shown for the residue remaining on a surface of aluminum after removal of a replicating impression. (A) shows the Al+ signal across the aluminum coupon. The brightness corresponds to surface concentration, showing that the aluminum signal is attenuated by overlying residue in the dark balloon shape in the middle of the aluminum coupon. The corresponding silicone signature is shown in
(B) for the ion fragment [(CH3)3SiO(CH3)2Si]+ (normalized to Al+ (m/z 147)).
The residue mapped in Figure 11 can be quantitatively evaluated with XPS to determine relative surface concentrations. In Figure 12, the increase in surface contamination is shown after repeated replications on a single substrate. Contamination is identified as the sum of silicon and carbon concentrations above that of background levels. The residue is observed to build-up on the surface after the initial 2-3 replications. Further replications do not show significant increases in residue. The amount of residue plateaus at about 25% C+Si. The accumulation of residue is a consistent process as shown by repeating the experiment a second time.
Figure 13 shows the build-up of residue on polished iron-nickel substrates. Residue accumulates on this substrate in a similar manner to that observed on aluminum. It is likely that the amount of residue is relatively insensitive to the substrate material.

23
0
10
20
30
40
50
60
0 1 2 3 4 5
Ato
mic
Con
cent
rati
on (
%)
Number of Applications
trial 1
trial 2
Figure 12. The change in atomic concentrations due to residue is shown on aluminum substrates after repeated replications. The y-axis is the change in the sum of
contaminant species (carbon and silicon atomic concentrations from XPS) from that of the as-received aluminum surface. Two trials were performed giving similar results.
0
10
20
30
40
50
60
0 1 2 3 4 5
Ato
mic
Con
cent
rati
on (
%)
Number of Applications
Figure 13. The change in atomic concentrations due to residue is shown on iron/nickel substrates after repeated replications. The y-axis is the change in the sum of
contaminant species (carbon and silicon atomic concentrations from XPS) from that of the as-received surface. The residue increases with repeated applications.
Since the residue is an extremely thin film of silicone, there are limited options for successfully removing the residue. Silicones are notoriously difficult to remove and many of the options that may be effective are necessarily readily available. Several simple solvent rinsing methods were investigated to evaluate their efficacy. Cleaning of residue was tested by sonicating coupons in isopropanol, toluene, or hexane. Figure 14 shows the change in contaminant species after sonication in the various solvents. All three of these solvents are relatively ineffective at removing the silicone contaminant. Only ~2% of the silicone contaminant could be removed

24
with isopropanol (IPA) or toluene. Hexane was slightly more effective than the other two solvents removing an additional 1% of the residue.
0
0.5
1
1.5
2
2.5
3
3.5
4
isopropanol toluene hexane aftertoluene
Ato
mic
Con
cent
rati
on (
%)
Cleaning Solvent
addit ional amount removed by hexane
Figure 14. The amount of silicone residue (C+Si) removed by various cleaning solvents is shown for residue on aluminum coupons. Isopropanol and toluene have an equivalent
ability to remove residue, while hexane can remove slightly more contaminant.
Figure 15 shows the relative efficacy of the solvent cleaning process on residue on iron-nickel substrates. Figure 15 shows the individual changes in carbon and silicon concentrations instead of the sum as shown in Figure 14. More residue could be removed from the iron-nickel substrates than from the aluminum substrates. Approximately 10-12% C+Si could be removed using isopropanol and toluene. Cleaning with hexane also removed silicone residue, as evidenced by the ~7% reduction in silicon atomic concentration. However, the carbon concentration was unchanged by hexane cleaning. This indicates that hexane is probably retained on the surface as a contaminant

25
-4
-2
0
2
4
6
8
10
12
isopropanol toluene hexane
Ato
mic
Con
cent
rati
on (
%)
Cleaning Solvent
Si
C
Figure 15. The amount of carbon and silicon residue removed from iron-nickel substrates by various cleaning solvents is shown. Isopropanol and toluene removed C and Si equally well. Hexane effectively removed silicon- containing contamination, but
had no effect on carbonaceous contamination. Overall, all three solvents were more effective on iron-nickel substrates than on aluminum.
-2
3
8
13
18
23
28
C D M N
Ato
mic
Con
cent
rati
on (%
) of
C +
Si a
dded
due
to r
esid
ue
-2
3
8
13
18
23
28
C D M N
Ato
mic
Con
cent
rati
on (%
) of
C +S
i rem
oved
usi
ng IP
A
-2
3
8
13
18
23
28
C D M N
Ato
mic
Con
cent
rati
on (%
) of
C+Si
rem
oved
usi
ng to
luen
e
A - residue B – IPA rinse C – toluene rinse
Figure 16. (A) The increase in concentration of carbon and silicon due to residue from the replicating compound is shown for four different types of stainless steel (C, D, M, and N). Sample M showed no increase in residue concentration suggesting that the sample itself was already contaminated. (B) Cleaning with isopropanol (IPA) was successful at removing carbon and silicon on samples C and N, however, IPA had almost no effect on samples D and M. (C) Cleaning with toluene reduced the amount of carbon and silicon
on samples D, M, and N, but had no effect on sample C.
A number of other stainless steel substrates were used to characterize residue and cleaning procedures, Figure 16. The samples are referred to as C, D, M, and N. Silicone residue (C+Si)
26
on C and N was nearly the same at about 15%. Sample D showed the most residue at 28% C+Si. Sample M showed no retention of a residue. Silicone was very effectively removed from Sample C using isopropanol. Sample N also showed a large reduction in silicone (~8%) after isopropanol rinsing. IPA had no effect on sample D and M. Toluene had some effect at cleaning sample D, M, and N. There may be experimental artifacts that are contributing to the erratic results observed in Figure 16. However, in general, a thin silicone residue is observed on stainless steel substrates and IPA or toluene can remove a fraction of the residue.
The results in Figure 16, along with those shown in Figures 14 and 15, probably demonstrate inconsistency in the cleaning practices but also exemplify the very small amount of material that is being evaluated. In all of these cases, the residue is thin enough to be semi-transparent in XPS analysis. This shows that the residue is much less than 5 nm thick. With such a thin layer of contaminant at the surface, any minor changes in handling, cleaning, or analysis location may lead to compounding interferences in the data interpretation. Since there is such a small amount of residue left by these replicating compounds, cleaning has limited utility and can even introduce additional contamination if not performed carefully. Perhaps the greatest motivation for a solvent cleaning process is to remove gross particulate contamination.
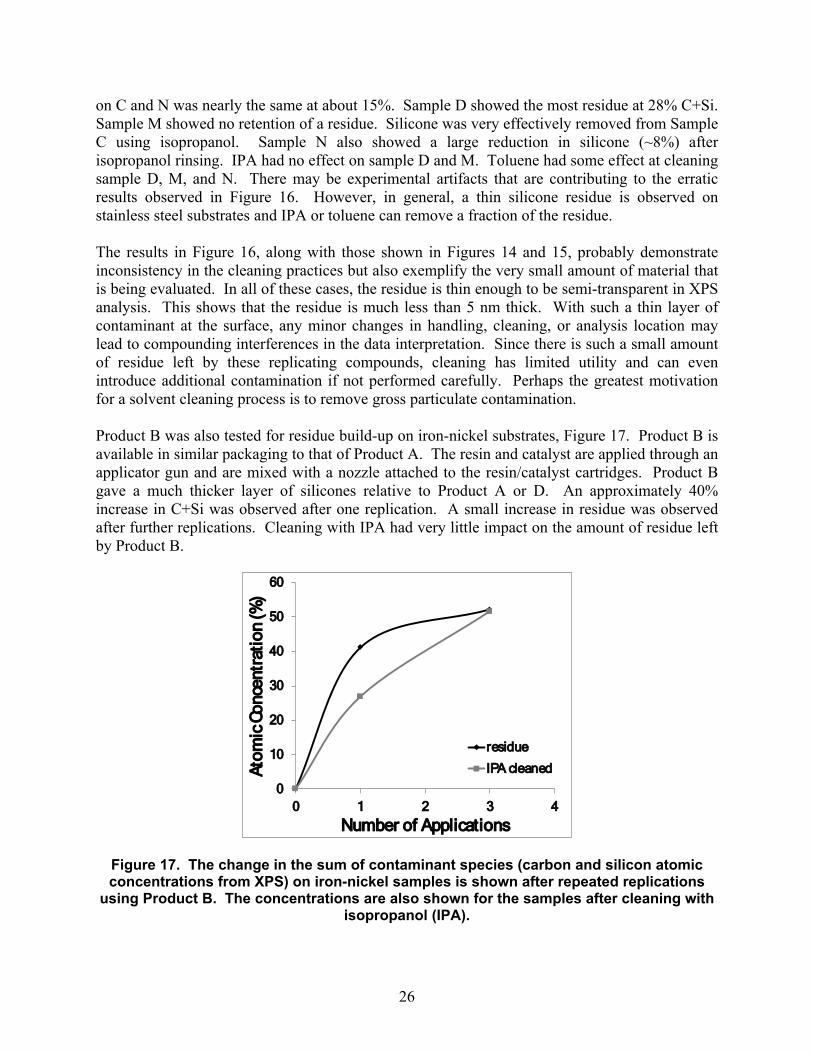
Product B was also tested for residue build-up on iron-nickel substrates, Figure 17. Product B is available in similar packaging to that of Product A. The resin and catalyst are applied through an applicator gun and are mixed with a nozzle attached to the resin/catalyst cartridges. Product B gave a much thicker layer of silicones relative to Product A or D. An approximately 40% increase in C+Si was observed after one replication. A small increase in residue was observed after further replications. Cleaning with IPA had very little impact on the amount of residue left by Product B.
0
10
20
30
40
50
60
0 1 2 3 4
Atom
ic C
once
ntra
tion
(%)
Number of Applications
residue
IPA cleaned
Figure 17. The change in the sum of contaminant species (carbon and silicon atomic concentrations from XPS) on iron-nickel samples is shown after repeated replications
using Product B. The concentrations are also shown for the samples after cleaning with isopropanol (IPA).

27
0
10
20
30
40
50
60
0 1 2 3 4
Atom
ic C
once
ntra
tion
(%)
Number of Applications
residue
IPA cleaned
0
0.5
1
1.5
2
2.5
3
0 1 2 3 4
Atom
ic C
once
ntra
tion
(%)
Number of Applications
0
0.5
1
1.5
2
2.5
3
0 1 2 3 4
Atom
ic C
once
ntra
tion
(%)
Number of Applications
0
0.5
1
1.5
2
2.5
3
0 1 2 3 4
Atom
ic C
once
ntra
tion
(%)
Number of Applications
A B
C D
Figure 18. (A) The change in the sum of contaminant species (carbon and silicon atomic concentrations from XPS) on iron-nickel samples is shown after repeated replications
with Product C. The concentrations are also shown for the samples after cleaning with isopropanol (IPA). (B) The concentration of copper is shown. (C) The concentration of
chlorine is shown. (D) The concentration of nitrogen is shown.
The residue from Product C was also analyzed as shown in Figure 18. There was only about a 20% increase in C+Si after one replication, however, the amount of residue increased dramatically from 1 to 3 replications. Rinsing with IPA was most effective for this product relative to the other three products. The amount of C+Si could be reduced to within 5% of the as-received levels. However, several other contaminant species were observed for this product, namely Cu, Cl, and N. Figure 18B shows the change in copper concentration after replications and after rinsing with IPA. Copper could not be completely removed from the surface. A significant amount of chlorine, nearly 3%, was observed after three replications. The amount of chlorine could be significantly reduced by IPA, but it also could not be completely removed. Nitrogen was also observed in the residue and was insensitive to cleaning.
A fourth replicating compound, Product D, was also analyzed for residue contamination, Figure 19, on iron-nickel substrates. The amount of residue for this compound was about the same as that of Product A, ~30% increase in C+Si. Calcium and tin were observed in the residue in addition to carbon and silicon. The amount of residue did not increase with additional replications. Toluene rinsing reduced the amount of residue on the surface. Figure 19B shows

28
the remaining silicon and tin concentrations after toluene rinsing. It is notable that tin in the residue from this product could not be completely removed.
0
10
20
30
40
50
60
0 1 2 3 4
Ato
mic
Con
cent
rati
on (%
)
Number of Applications
residuetoluene cleaned
0
0.2
0.4
0.6
0.8
1
1.2
1.4
0 1 2 3 4
Ato
mic
Con
cent
rati
on (%
)
Number of Applications
Si
Sn
A B
Figure 19. (A) The change in the sum of C, Si, Ca, and Sn concentrations after repeated replications of Product D are shown for iron-nickel substrates. After cleaning with toluene, the total concentration of residue species decreased. In (B) the Si and Sn
concentrations are shown after toluene cleaning. Sn could not be completely removed by toluene rinsing.

29
4. RESOLUTION
In addition to the material characterization results shown above, the resolution of Product A was tested using microscopy. A qualitative comparison was performed by replicating scratches prepared in a sample of polished aluminum as shown in Figure 20. The initial scratch and the replica were analyzed using optical microscopy. The replication was found to accurately represent the initial scratch.
Figure 20. Scratches were made in aluminum spelling the letter S, N, and L as shown in the optical image (A). A silicone replication was made as show in (B) where the letters
are reversed. The color contrast is as great in the replication. The corner of the letter L (C) was used for confocal microscopy characterization. In (D) the groove in the
aluminum is shown using confocal microscopy. The replication of the corner is shown in (E).
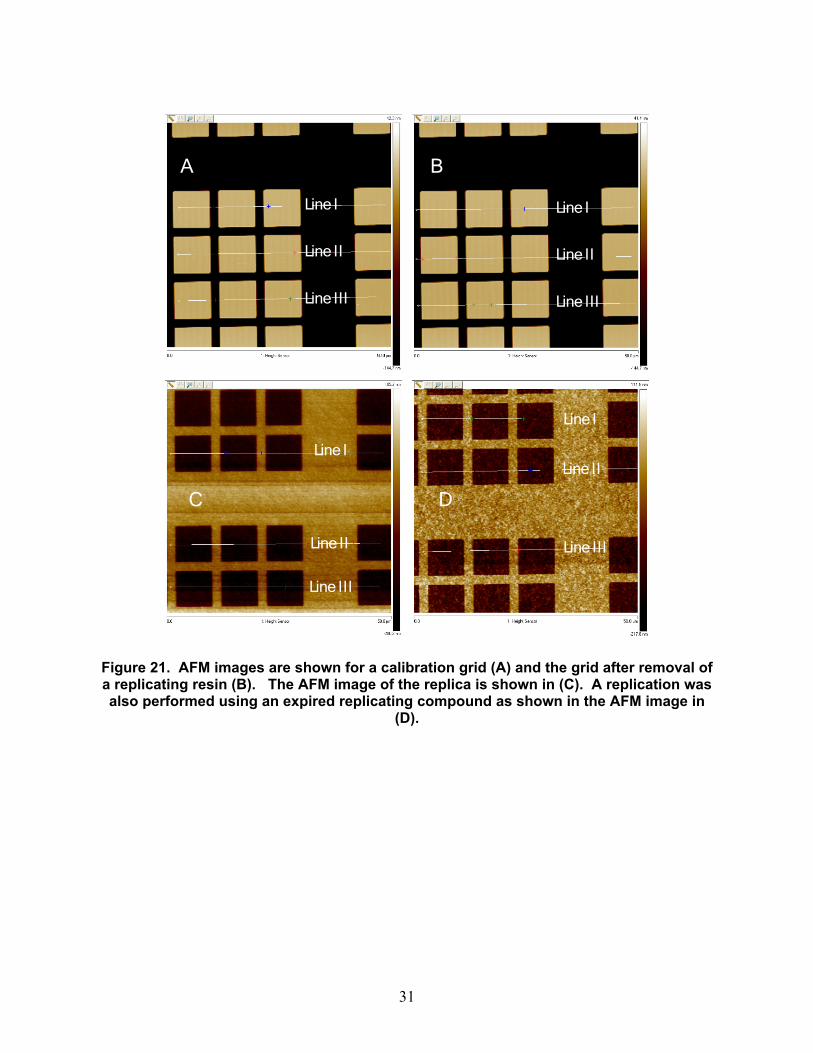
To more quantitatively evaluate the replication, a grid with micron-scale dimensions was used as the substrate of interest. AFM was used to characterize the grid and the respective replicas. AFM images for the grid and replicas are shown in Figure 21. Figure 22 shows line scans across the images. Table 2 gives the measured dimensions from the image line scans allowing comparisons between samples.
The grid was evaluated before and after removal of replicas. Figure 21A and B show images of the grid before and after replication. No film is obvious on the grid, nor are there any remaining large particles or debris from the replica. In the line scans, Figure 22A and B, no difference was observed in the depth of the grooves or the width of the features. This shows that the residual film is extremely thin and is negligible relative to the scale of the features measured.

30
Replication using an unexpired cartridge of Product A made an excellent replica of the grid. The replica gives the reverse image of the grid reproducing the depth and width of the features to an accuracy of 0.1 microns. Figure 23 shows the adjusted line scans from the replica such that the grid and replica can be directly compared. The replica shows more noise in the profiles than was observed on the grid. The difference in noise is likely due to the difference in stiffness between the grid and the replica, the replica being a much softer material.
The grid was also replicated using an expired cartridge of Product A. The replica produced using an expired cartridge of Product A gave a replication of the grid features, however, the noise observed in the line scans was significant. This may be due to the curing behavior of expired product. DSC results showed that expired product gave less heat of reaction during curing, possibly due to curing of the precursor materials inside the cartridge during storage. If some material is already cured, it may be possible that the replica will give a rougher surface. Additionally, if there is less cross-linking during replication, the replica may also be softer.
31
A B
C D
Line I
Line II
Line III
Line I
Line II
Line III
Line I
Line II
Line III
Line I
Line II
Line III
Figure 21. AFM images are shown for a calibration grid (A) and the grid after removal of a replicating resin (B). The AFM image of the replica is shown in (C). A replication was also performed using an expired replicating compound as shown in the AFM image in
(D).

32
Width
Width
Line I = blueLine II = redLine III = green
A
B
C
D
Figure 22. Three line scans across the AFM images are shown for the calibration grid (A), the grid after removal of a replicating resin (B), the replica is shown in (C), and
across a replica using an expired replicating compound (D).

33
Table 3. Dimensions from AFM Line Scans.
Line I Depth (nm)
Line II Depth (nm)
Line III Depth (nm)
Width (nm)
Silicon grid 141 142 142 8.0
Silicon grid after one replication
142 143 143 8.0
Replica 140 139 138 8.2
Replica using expired resin
149 142 135 7.9

34
-17
3
23
43
63
83
103
123
1430
40
80
120
160
0 10 20 30 40 50
Dep
th (n
m)
Distance Across Sample (µm)
AFM Measured Topography of Grid & Replica Grid Original Grid After 1 Application Replica of Grid
50µm 0.1µm
Width
Width
A B
C
D
E
Figure 23. AFM images are shown for a calibration grid (A) and a replica (B). Three lines scans across the AFM grid are shown in (C). Three line scans across the replica are
shown in (D). In € selected line scans have been normalized and adjusted on the x-axis to align the line scans for the grid, the grid after removal of a replica, and for the replica.

35
5. CONCLUSIONS
Replicating compounds provide a method for accurately recording surface features. Replicating compounds have low adhesion to the surfaces and can be easily removed. A nanoscale silicone-based residual film is retained on the original substrate surface. Various substrate materials were tested, however, the amount of residue was relatively insensitive to the substrate material. Simple solvent rinsing did not completely remove the residual film.

36

37
DISTRIBUTION
1 Los Alamos National Laboratory Attn: Kevin HaleP.O. Box 1663, MS A118Los Alamos, NM
1 MS0899 Technical Library 9536 (electronic copy)

38
