#marketbeat q1 2016 russia
TRANSCRIPT

COMMERCIAL REAL ESTATE | RUSSIA
# MARKETBEATCushman & Wakefield Research
Q1 2016

#MARKETBEAT | Q1 2016
CUSHMAN & WAKEFIELD RESEARCH DEPARTMENT | 2#MARKETBEAT | Q3 2015 CUSHMAN & WAKEFIELD RESEARCH DEPARTMENT | 2
CONTENTS
03
SECTION 1
OUTLOOK
Major economic trends of current period, market review and forecast
17
SECTION 2
COMMERCIAL REAL
ESTATE
Macroeconomic and analytic review of various commercial real estate market sectors
28 | Retail
17 | Office
40 | Warehouse & Industrial
47
SECTION 3
APPENDIX
Major indicators of Moscow commercial real estate market, standard commercial lease terms
51
SECTION 4
OUR TEAM
Information about Cushman & Wakefield in Russia, Research department contact details
05 | Macroreview
12 | Capital Markets
47 | Market Indicators
49 | Lease Terms
03 | Outlook
04 | Regulation

#MARKETBEAT | Q1 2016
CUSHMAN & WAKEFIELD RESEARCH DEPARTMENT | 3
Russian economy is stagnating. Even slight RUB appreciation does not relief inflation pressure.
Business activity is low and consumer market is under pressure.
Decreasing household income and conservative adaptation strategies adopted by population suggest that sales will continue to diminish.
CONSUMER MARKET
MAY FORM SECOND
WAVE OF DECLINE
By the end of Q1 2016 business generally adapted to new norm by cutting expenses, optimizing volumes and headcounts.
In Q2 we expect low business activity to remain. Real estate indicators (vacancies, rents, take up) will be stable, but still in the red zone.
Many factors suggest that we are close to the bottom of the cycle, however major threat now comes from consumer market. If it sustains for Q2 there will be more evidence of the recovery.
Russian population adopted survival adaptation strategy: people are slashing expenditures to compensate decreasing incomes without any significant efforts to maintain lifestyle. Today 72% of households have absolutely no savings, and together with inflating consumer prices this may lead to further contraction of consumer market.
OUTLOOK

#MARKETBEAT | Q1 2016
CUSHMAN & WAKEFIELD RESEARCH DEPARTMENT | 4
Last year the Ministry of Trade scared business community with its plan to ban commercial rents nominated in any foreign currency.
Recently they pulled back with the initiative and switched towards recommendation practice.
Together with the fact that Vympelcom case did not stand appeal in the higher court, this suggests that government will not push forward with involuntary “dedollarisation”.
DEDOLLARIZATION OFF
THE AGENDA
The Moscow government slashed property tax rate from planned 1.5% to 1.3% of cadastral value. This shows their concern about the property market performance. However, no other stimulus package is being discussed.
On one hand the Moscow authorities are trying to create attractive environment for citizens by offering public spaces, pedestrian zones, etc. But on the other hand they are very unwelcome to any sort of non organized activities including street musicians and micro retail.
This will create opportunity for empty offices to be used for public events and social projects.
REGULATION

#MARKETBEAT | Q1 2016
CUSHMAN & WAKEFIELD RESEARCH DEPARTMENT | 5
MACROREVIEW
2016 2017 2018 2019
2016 2017 2018 2019
2016 2017 2018 2019
2016 2017 2018 2019
2016 2017 2018 2019
2016 2017 2018 2019
BUDGET DEFICIT (% of GDP)
RUB/USD EXCHANGE RATE
REAL WAGES8
CPI
PERSONAL CONSUMPTION
MACRO FORECAST
GDP GROWTH
MACROREVIEW | CAPITAL MARKETS | OFFICES | RETAIL | WAREHOUSES
Source: Oxford Economics (02/2016), the Ministry Of Economics (03/2016)*
Consumer market remains weak. Most likely domestic demand will contract till 2018.
-2.4% 0.8% 1.8% 2.1%
67.4 57.1 56.761.7
-4.6% -1.8% -0.4%-3.9%
-4.2% 2.2% 3.8%-0.7%
7.8% 5.2% 4.6%5.6%
-2.9% 2.1% 2.0%1.7%

#MARKETBEAT | Q1 2016 CUSHMAN & WAKEFIELD RESEARCH DEPARTMENT | 6
GDP GROWTH
While the Ministry of Economics expect that GDP will contract by -0.3% with rapid recovery in 2017, Oxford Economics insists on the -2.4% in 2016 with recovery only in 2018.
Even looking back at 2015 CPI estimates vary from 12.9% to 15.5%
Economists continue to downgrade outlook for the Russian economy, and this is one of the signs that we are still in the decline phase.
Also there is a growing gap between official and independent forecasts that reflects p0orer transparency of the Russian economy.
2016: THE SECOND YEAR OF RECESSION. AUTHORITIES
ARE STILL OPTIMISTIC
MACRO SUMMARY
INFLATION
According to Oxford
Economics
-2.4%
According to the
Ministry of Economics
-0.3%
GDP growth outlook for 2016
GDP growth outlook for 2016
MACROREVIEW | CAPITAL MARKETS | OFFICES | RETAIL | WAREHOUSES
SUMMARY | CONSUMER MARKET | CORPORATE| CURRENCY
5,2%
-7,8%
4,5% 4,3%
3,4%
1,3%
0,6%
-3,7%
-0,3%
1,5%
2,3% 2,5%
-2,4%
0,8%1,8%
2,1%
2008 2009 2010 2011 2012 2013 2014 F2015 F2016 F2017 F2018 F2019
GDP Growth | Рост ВВП, %
Base case forecast | Базовый прогноз, (03/2016)
Oxford Economics (02/2016) 4%
6%
8%
10%
12%
14%
16%
18%
2008 2009 2010 2011 2012 2013 2014 F2015 F2016 F2017 F2018 F2019
CPI | ИПЦ, %
Oxford Economics (02/2016)
Base case forecast | Базовый прогноз, (03/2016)
Source: Rosstat, the Ministry of Economics, Oxford Economics

#MARKETBEAT | Q1 2016 CUSHMAN & WAKEFIELD RESEARCH DEPARTMENT | 7
CONSUMER DEMAND
There is a risk of further decline in consumer demand in Q2 2016. Savings are almost exhausted and even appreciation of RUB will play against consumers because it will devaluate their foreign currency reserves.
Conservative adaptation model is a major threat for consumer market stability. People will be expecting the government to support them instead of looking for alternative sources of income. Additional social programs will ask for increasing taxation.
Household consumption will be under pressure until 2018.
Three years of recession in consumer market will lead to structural shots in consumption patterns and supply chains.
CONSUMER MARKET COLLAPSE IS A MAJOR RISK FACTOR
FOR REAL ESTATE
Over the last 3 years the share of households possessing savings decreased from 72% to 27%. This means that savings will no longer support household budgets and people will have to slash spending.
CONSUMER MARKET
Contracted in 2015
-9.4%
Contracted in 2015
-0,4%
Household consumption
Government consumption
MACROREVIEW | CAPITAL MARKETS | OFFICES | RETAIL | WAREHOUSES
SUMMARY | CONSUMER MARKET | CORPORATE| CURRENCY
13,7%
-5,1%
6,5%7,1%
6,3%
3,9%
2,5%
-10,0%
-3,3%
1,5%
3,5% 3,7%
2008 2009 2010 2011 2012 2013 2014 2015 F2016 F2017 F2018 F2019
Disposable income | Раcполагаемые доходы
Retail trade | Оборот розничной торговли

#MARKETBEAT | Q1 2016 CUSHMAN & WAKEFIELD RESEARCH DEPARTMENT | 8
CONSUMER CREDIT SLOWS DOWN. MORTGAGE GROWS
In December 21015 decrease of debt was registered. His means that even the New Year period did not provoke spending. In February debt decreased even further.
CREDIT MARKET
Decrease in residential prices makes apartments more affordable for population. Households consider this period as a window of opportunity to upgrade living space and they appreciate state support for mortgage rate.
The side effect of these long term obligations will be a drainage of money available for retail spending.
While overall debt is shrinking, there is a substantial increase in mortgage loans. Over the last 3 years a share of mortgage had risen from 25% to 37% of total household debt.
State support is a major facilitator for mortgage loans.
In total debt
37%
AVERAGE HOUSEHOLD
DEBT
188
Share of mortgage
‘000 RUB
Household debt m-o-m change Total debt Share of overdue debt
CONSUMER CREDITS IN RUSSIA
MACROREVIEW | CAPITAL MARKETS | OFFICES | RETAIL | WAREHOUSES
SUMMARY | CONSUMER MARKET | CORPORATE| CURRENCY
Source: The Central Bank of the Russian Federation
-1,5%
-1,0%
-0,5%
0,0%
0,5%
1,0%
1,5%
2,0%
01-1
4
03-1
4
05-1
4
07-1
4
09-1
4
11-1
4
01-1
5
03-1
5
05-1
5
07-1
5
09-1
5
11-1
5
01-1
6
03-1
6
-15 000
-10 000
-5 000
0
5 000
10 000
15 000
20 000
25 000
01-1
4
03-1
4
05-1
4
07-1
4
09-1
4
11-1
4
01-1
5
03-1
5
05-1
5
07-1
5
09-1
5
11-1
5
01-1
6
03-1
6
Personal savings, bn RUR | Накопления, млрд. руб.Total Debt, bn RUB | Задолженность, млрд. руб.
3%
4%
5%
6%
7%
8%
9%
01-1
4
03-1
4
05-1
4
07-1
4
09-1
4
11-1
4
01-1
5
03-1
5
05-1
5
07-1
5
09-1
5
11-1
5
01-1
6
03-1
6

#MARKETBEAT | Q1 2016 CUSHMAN & WAKEFIELD RESEARCH DEPARTMENT | 9
CORPORATE AND CONSTRUCTION DEBT
Surprisingly over 22% of RUB construction debt is overdue, while only 4% of foreign currency debt is not serviced. Probably a few of large scale RUB borrowers experience problems with their debts.
Construction debt is stagnating since mid 2015. Minordecrease of the RUB debt is compensated by modestincrease of the foreign currency debt.
However total corporate debt in nominal Rubles grows steadily.
CONSTRUCTION IS UNDER PRESSURE
CREDITS
OVERDUE DEBT
IS OVERDUE
20%
IS OVERDUE
7%
Of construction debt
Of all corporate debt
MACROREVIEW | CAPITAL MARKETS | OFFICES | RETAIL | WAREHOUSES
SUMMARY | CONSUMER MARKET | CORPORATE| CURRENCY
0%
5%
10%
15%
20%
25%
Ja
n-1
4
Ma
r-1
4
Ma
y-1
4
Ju
l-1
4
Se
p-1
4
No
v-1
4
Ja
n-1
5
Ma
r-1
5
Ma
y-1
5
Ju
l-1
5
Se
p-1
5
No
v-1
5
Ja
n-1
6
Ma
r-1
6
% of overdue debt | Общая доля просроченных кредитов, %
Overdue debt in construction | Просроченные кредиты на строительство
5,0%
5,2%
5,4%
5,6%
5,8%
6,0%
6,2%
6,4%
6,6%
6,8%
7,0%
20 000
22 000
24 000
26 000
28 000
30 000
32 000
Jan-1
4
Ma
r-1
4
Ma
y-1
4
Jul-1
4
Sep-1
4
No
v-1
4
Jan-1
5
Ma
r-1
5
Ma
y-1
5
Jul-1
5
Sep-1
5
No
v-1
5
Jan-1
6
Ma
r-1
6Total Corporate debt (bn RUR) | Все кредиты, млрд.руб
Share of debt for construction | Доля кредитов на строительство, %

#MARKETBEAT | Q1 2016
CUSHMAN & WAKEFIELD RESEARCH DEPARTMENT | 10
0%
50%
100%
150%
200%
250%
300%
350%
Aggregated CPI | ИПЦ нарастающим итогом
RUB/USD
USD inflation in Russia | Инфляция доллара в РФ
In 2004 prices USD in
2016 costs 22 Rubles.
Ruble and Dollar inflation in Russia
INFLATION IS A MAJOR FACTOR FOR COMMERCIAL REAL
ESTATE MARKET
CURRENCY
37%Loss of the USD purchasing power in Russia since 1004
MACROREVIEW | CAPITAL MARKETS | OFFICES | RETAIL | WAREHOUSES
SUMMARY | CONSUMER MARKET | CORPORATE | CURRENCY

#MARKETBEAT | Q1 2016
CUSHMAN & WAKEFIELD RESEARCH DEPARTMENT | 11
Growth of nominal
USD nominated rents
driven by RUR
appreciation and
inflation make
commercial real
estate very attractive
for foreign
investment. However
if the market will be
switched to Rubles –
this investment
opportunity will be
lost.
Nominal and real office rents indices
IN SPITE OF THE MAJOR CHANGE IN NOMINAL RENTS, CORRECTION IN
REAL TERMS IS RELATIVELY INSIGNIFICANT
CURRENCY
Nominal and real office rents reached historical minimum by March 2016
MACROREVIEW | CAPITAL MARKETS | OFFICES | RETAIL | WAREHOUSES
SUMMARY | CONSUMER MARKET | CORPORATE | CURRENCY
0%
50%
100%
150%
200%
250%
300%
Jan-04 Jan-05 Jan-06 Jan-07 Jan-08 Jan-09 Jan-10 Jan-11 Jan-12 Jan-13 Jan-14 Jan-15 Jan-16
Constant price office rents indeх | Индекс офисных ставок в постоянных ценах
USD Office rents index relative to 01.2004 | Индекс долларовых офисных ставок к январю 2004 г.

#MARKETBEAT | Q1 2016 CUSHMAN & WAKEFIELD RESEARCH DEPARTMENT | 12
CAPITAL
MARKETS
Source: Cushman & Wakefield
PRIME CAPITALIZATION RATES
ACTUAL INVESTMENT VOLUMES
EXPECTED TOTAL INVESTMENTS
OFFICES
SHOPPING CENTERS
WAREHOUSES
MACROREVIEW | CAPITAL MARKETS | OFFICES | RETAIL | WAREHOUSES
2.8
3.5
11.00% 11.00%
12.75% 12.75%
10.50% 10.50%
Q1 2016
Q1 2016
Q1 2016
Q4 2015
Q4 2015
Q4 2015
2015
2016
In Q1 2016, the total volume invested in the Russian commercial real estate was US$ 2.5 bn. We expect US$ 3.5 bn of investments by the end of 2016 .
2016
2.5 US$ bn US$ bn
US$ bn

#MARKETBEAT | Q1 2016 CUSHMAN & WAKEFIELD RESEARCH DEPARTMENT | 13
CAPITALIZATION RATES
In March 2016, the Central Bank of the Russian Federation made a decision to keep the key rate at 11.00% per annum. The previous change took place in June 2015 – the key rate was decreased 0.50 pp from 11.50 to 11.00. The regulatory authority promises to revise the key rate to the downside as soon as inflation slows down firmly.
In Q1 2016, we kept capitalization rates at the same level. All the indicated capitalization rates are applicable to the objects with dollar cash-flow. In Q1 2016, tenants kept popping more and more objects into ruble zone. Comparing to Q4 2015 the total amount of ruble deals increased.
CAPITALIZATION RATES REMAIN UNCHANGED
CAPITALIZATION RATES
CBR KEY RATE, CBR REFINANCING RATE
CAPITALIZATION RATE
FOR OFFICE OBJECTS
10.5%
CBR KEY RATE
11.0%
CAPITALIZATION RATES | INVESTMENT VOLUMES | INVESTMENT STRUCTURE | BIGGEST DEALS
MACROREVIEW | CAPITAL MARKETS | OFFICES | RETAIL | WAREHOUSES
11,00%
10,00%
13,00%
8,75%
7,75%
8,00%
8,25%
8,25%
17,00%
11,00%
11,00%
0%
2%
4%
6%
8%
10%
12%
14%
16%
18%
Q1
2006 2007 2008 2009 2010 2011 2012 2013 2014 2015 2016
CBR REFINANCING RATE CBR KEY RATE
0%
2%
4%
6%
8%
10%
12%
14%
16%
Q1
2006 2007 2008 2009 2010 2011 2012 2013 2014 2015 2016
OFFICES SHOPPING CENTERS WAREHOUSES

#MARKETBEAT | Q1 2016 CUSHMAN & WAKEFIELD RESEARCH DEPARTMENT | 14
INVESTED VOLUMES, US$ MN
In Q1 2016, the total volume invested in the Russian commercial real estate was US$ 2.5 bn. The bigger volumes were registered only twice during the last ten years – in Q2 2012 and Q1 2013. Such a big volume of investments may be explained with prolongation of transaction completions. The investors believe office objects are overestimated by vendors. The latter do not rebate. The threat of increasing vacancy rate in shopping centers and economy mode as a de facto behavior model of Russian consumers make the segment unattractive for potential investors. The industrial segment keptto be the most predictable one. The market players believe the market meets minimum in the nearest months which may be qualified as a prerequisite of revival. We revised our 2016 forecast expecting US$ 3.5 bn by the end of the year.
THE MARKET STALLS
No bad news is the best news.
INVESTMENT VOLUMES
2016 FORECAST
3.5US$ bn
MACROREVIEW | CAPITAL MARKETS | OFFICES | RETAIL | WAREHOUSES
CAPITALIZATION RATES | INVESTMENT VOLUMES | INVESTMENT STRUCTURE | BIGGEST DEALS
0
1000
2000
3000
4000
5000
6000
7000
8000
9000
2006 2007 2008 2009 2010 2011 2012 2013 2014 2015 2016
OFFICE RETAIL INDUSTRIAL OTHER FORECAST

#MARKETBEAT | Q1 2016 CUSHMAN & WAKEFIELD RESEARCH DEPARTMENT | 15
CASH FLOWS
In Q1 2016, the foreign companies refrained from active investment activities. Welcome but modest (just US$ 50 mn) entering the market by Mubadalaof UAE is to be mentioned. The lion share of all the investment volume – US$ 2.43 bn – are the purchases by domestic companies. And the major part of them – US$ 1.74 bn – is the investment in office segment. Domestic companies spent US$ 1.47 bn for buying office properties for their own needs. There were no landmark deals with retail properties by neither domestic nor foreign companies.
NO SIGNIFICANT SHIFTS
60% of money spent in Q1 2016 are invested in offices for owner occupation.
INVESTMENT STRUCTURE
INVESTED IN OFFICE
SEGMENT
1739
US$ mn
MACROREVIEW | CAPITAL MARKETS | OFFICES | RETAIL | WAREHOUSES
CAPITALIZATION RATES | INVESTMENT VOLUMES | INVESTMENT STRUCTURE | BIGGEST DEALS
UAE
RUSSIA
USAFINLAND
AUSTRIA
RUSSIA
HOTELS
OFFICES
INDUSTRIAL
RETAIL
23
US$ mn
INVESTED IN RETAIL
SEGMENT
INVESTOR VENDORSEGMENT

#MARKETBEAT | Q1 2016 CUSHMAN & WAKEFIELD RESEARCH DEPARTMENT | 16
THE BIGGEST DEAL
THE FIVE TOP DEALS OF Q1 2016 – US$ 2.3 BN
THE BIGGEST DEALS
1140
US$ mn
SEGMENT QUARTER PROPERTY INVESTORAMOUNT, US$
MN
OFFICES Q1 EVOLUTION TRANSNEFT 1140
OFFICES Q1 EURASIA VTB 300
OFFICES Q1 AVRORA BUSINESS PARK O1 PROPERTIES 250
RETAIL Q1 METRIKA (ST. PETERSBURG) KESKO 10
WAREHOUSES Q1PNK - CHEKHOV 3
PNK - SEVERNOYE SHEREMETYEVO
RDIF
MUBADALA100
WAREHOUSES Q1 BIN GROUP NIKOLSKOYE LOGOPARK (DMITROV) 50
НОТЕLS Q1 KURORT PLUS KRASNAYA POLYANA (SOCHI) 500
НОТЕLS Q1 APART GROUP NOVY ARBAT 15 35
MACROREVIEW | CAPITAL MARKETS | OFFICES | RETAIL | WAREHOUSES
CAPITALIZATION RATES | INVESTMENT VOLUMES | INVESTMENT STRUCTURE | BIGGEST DEALS

#MARKETBEAT | Q1 2016 CUSHMAN & WAKEFIELD RESEARCH DEPARTMENT | 17
OFFICES%
Source: Cushman & Wakefield
mn sq m
TOTAL STOCK
VACANT
OFFICES
VACANCY
RATE
SHARE OF VACANT OFFICE SPACES
CONSTRUCTION
NET ABSORBTION
TAKE-UP
mn sq m
SQ M
SQ M
SQ M
MACROREVIEW | CAPITAL MARKETS | OFFICES | RETAIL | WAREHOUSES
3.1
19.3
Following tough 2015, Q1 2016 continues the descent. We expect market indicators to keep consistently low in 2016.
16
63,000
-21,500
360,000
RENTAL RATES
$433 $193 $249
CLASS A CLASS B CLASS A&B
#MARKETBEAT | Q1 2016 CUSHMAN & WAKEFIELD RESEARCH DEPARTMENT | 18
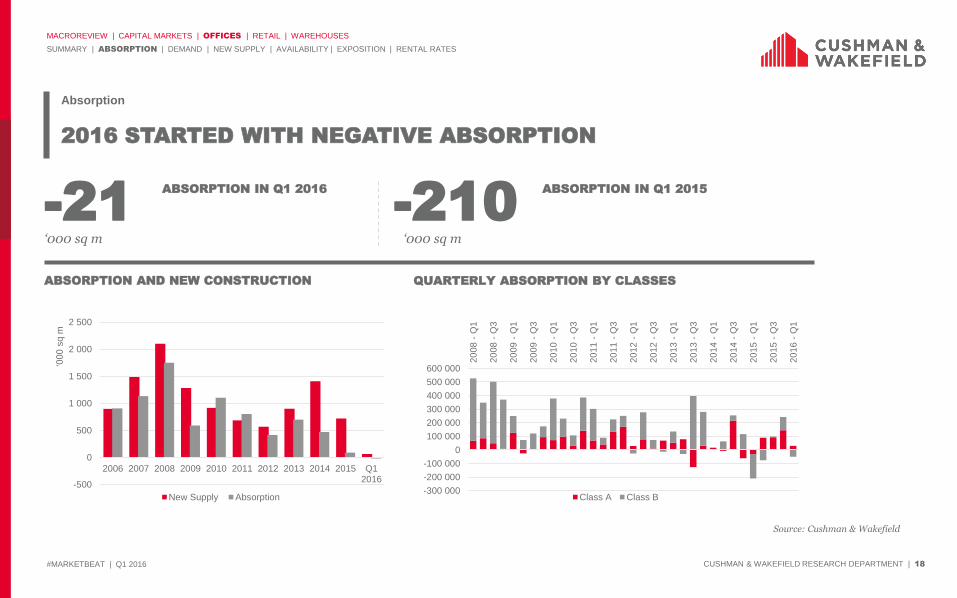
-21 -210ABSORPTION IN Q1 2015 ABSORPTION IN Q1 2016
2016 STARTED WITH NEGATIVE ABSORPTION
Absorption
ABSORPTION AND NEW CONSTRUCTION QUARTERLY ABSORPTION BY CLASSES
‘000 sq m ‘000 sq m
Source: Cushman & Wakefield
SUMMARY | ABSORPTION | DEMAND | NEW SUPPLY | AVAILABILITY | EXPOSITION | RENTAL RATES
MACROREVIEW | CAPITAL MARKETS | OFFICES | RETAIL | WAREHOUSES
-500
0
500
1 000
1 500
2 000
2 500
2006 2007 2008 2009 2010 2011 2012 2013 2014 2015 Q12016
‘000 s
qm
New Supply Absorption-300 000
-200 000
-100 000
0
100 000
200 000
300 000
400 000
500 000
600 000
20
08
- Q
1
20
08
- Q
3
20
09
- Q
1
20
09
- Q
3
20
10
- Q
1
20
10
- Q
3
20
11
- Q
1
20
11
- Q
3
20
12
- Q
1
20
12
- Q
3
20
13
- Q
1
20
13
- Q
3
20
14
- Q
1
20
14
- Q
3
20
15
- Q
1
20
15
- Q
3
20
16
- Q
1
Class A Class B

#MARKETBEAT | I КВАРТАЛ 2016 ОТДЕЛ ИССЛЕДОВАНИЙ CUSHMAN & WAKEFIELD | 19
405 +70%TAKE UP IN Q1 2016
COMPARED TO Q1 2015
TAKE UP REMAINS AT THE SAME LEVEL FOR THREE QUARTERS
DEMAND
MAJOR DEALS IN Q1 2016
New deals
COMPANY AREA BUILDING CLASS / SUBMARKET
VTB 93,878 sq m Eurasia A / Central
Moscow
Government
31,860 sq m ОКО А / Central
Philip Morris 4,784 sq m Kuntsevo Plaza A / OTA
Rusatom
Overseas
3,010 sq m Simonov Plaza B+ / OTA
Tele2 2,208 sq m Vodny A / OTA
INTREK 2,068 sq m WTC III A / Central
Source: Cushman & Wakefield
In Q1 2016 the total volume of office take-up amounted to 360,000 sq m which is stable for three quarters in a row already. Considerable growth of the indicator in Q1 2016 compared to Q1 2015 is due to low base effect.
However the absorption was negative coming to -21,500 sq m. Negative absorption is generally caused by low business activity in the beginning of the year and does not imply negative trend, especially with quite high activity on the background.
Low new construction volume in Moscow maintains the balance of supply and demand and keeps the stability of the market .
SUMMARY | ABSORPTION | DEMAND | NEW SUPPLY | AVAILABILITY | EXPOSITION | RENTAL RATES
MACROREVIEW | CAPITAL MARKETS | OFFICES | RETAIL | WAREHOUSES

#MARKETBEAT | Q1 2016 CUSHMAN & WAKEFIELD RESEARCH DEPARTMENT | 20
NEW CONSTRUCTION BY CLASSES
SIGNIFICANT DECREASE IN CONSTRUCTION ACTIVITY
New construction volume will remain low for upcoming two or three years.
NEW SUPPLY
In Q1 2016 no new class A office buildings were delivered to the market. 63,000 sq m of the delivered space are class B office buildings located outside of the city centre.
As it was expected, at the beginning of 2016 delivery dates of the majority of projects under construction were postponed. Delivery of many projects was moved to 2017. Some were converted from offices to residential projects.
There is still a lot of office space (around one million sq m) under construction. However construction activity is very low so we don’t expect these projects to be delivered to the market in a short time period.
By the end of 2016 new construction volume is expected to reach 300,000 sq m.
The vast majority of projects to be completed in 2016 and 2017 were initially planned for commissioning in 2015.
SUMMARY | ABSORPTION | DEMAND | NEW SUPPLY | AVAILABILITY | EXPOSITION | RENTAL RATES
MACROREVIEW | CAPITAL MARKETS | OFFICES | RETAIL | WAREHOUSES
131275 331 403
292 297 219 225
714
327150
765
1 212
1 768
881
623386
348
674
693
394
63150
0
500
1 000
1 500
2 000
2 500
2006 2007 2008 2009 2010 2011 2012 2013 2014 2015 Q12016
2016f
Th
ousands
sq m
Class A Class B (B+&B-)
Source: Cushman & Wakefield

#MARKETBEAT | Q1 2016 CUSHMAN & WAKEFIELD RESEARCH DEPARTMENT | 21
VACANCY RATES
Considering low volume of new construction, we expect the indicator to be at the similar level during 2016 and no significant increase in 2017.
However, vacancy rate is not likely to decrease significantly in the upcoming 2-3 years.
Vacancy rate has been increasing every month since the beginning of economic downturn. By the end of 2015 average level for classes A and B almost reached 20% and then the growth has stopped. It was the first time in history of the Moscow office market when the vacancy rate reached that high.
EVERY FIFTH SQUARE METER OF THE EXISTING OFFICES IS VACANT
AVAILABILITY
VACANT PREMISES
VACANCY RATE
IN Q1 2016
19.3
EXISTING
AVAILABILITY
3.1
%
mn sq m
SUMMARY | ABSORPTION | DEMAND | NEW SUPPLY | AVAILABILITY | EXPOSITION | RENTAL RATES
MACROREVIEW | CAPITAL MARKETS | OFFICES | RETAIL | WAREHOUSES
28,93%
16,33%
0%
5%
10%
15%
20%
25%
30%
35%
2006 2007 2008 2009 2010 2011 2012 2013 2014 2015 Q12016
Class A Class B (B+&B-)
0
500
1 000
1 500
2 000
2 500
3 000
3 500
2006 2007 2008 2009 2010 2011 2012 2013 2014 2015 Q12016
Thousands s
q m
Class A Class B (B+&B-)
Source: Cushman & Wakefield

#MARKETBEAT | Q1 2016 CUSHMAN & WAKEFIELD RESEARCH DEPARTMENT | 22
SOME PREMISES HAVE BEEN VACANT FOR 3 YEARS AND MORE
EXPOSITION
-39 -40 -50-20
13
173
317275
192168
210
273
780
1,95%
3,68%
2,81%
4,17%
7,00%
13,09%12,48%
10,36% 10,14%
11,29%
13,14%
18,5%
0%
2%
4%
6%
8%
10%
12%
14%
16%
18%
20%
-100
0
100
200
300
400
500
600
700
800
900
2004 2005 2006 2007 2008 2009 2010 2011 2012 2013 2014 2015 Vacancies
Exposition period, days Vacancy rate, %
SUMMARY | ABSORPTION | DEMAND | NEW SUPPLY | AVAILABILITY | EXPOSITION | RENTAL RATES
MACROREVIEW | CAPITAL MARKETS | OFFICES | RETAIL | WAREHOUSES
Source: Cushman & Wakefield

#MARKETBEAT | Q1 2016 CUSHMAN & WAKEFIELD RESEARCH DEPARTMENT | 23
Source: Cushman & Wakefield
RENTAL RATES
DEDOLLARIZATION
SUMMARY | ABSORPTION | DEMAND | NEW SUPPLY | AVAILABILITY | EXPOSITION | RENTAL RATES
MACROREVIEW | CAPITAL MARKETS | OFFICES | RETAIL | WAREHOUSES
US CPI
indexation
Russian CPI ~ 12.5%
Splits risk between
landlord and tenant
Lease
Discount
USD
RUB
Exchange risk
management
Triple net
OpEx+VAT
All inclusive
USD at fixed rate
Corridor
RUB rate reverted to
USD after fixed periodSplits risk over time

#MARKETBEAT | Q1 2016 CUSHMAN & WAKEFIELD RESEARCH DEPARTMENT | 24
RENTAL RATES IN RUSSIAN ROUBLES VALUERENTAL RATES IN US DOLLARS VALUE
In Q1 2016 rental rates in dollar equivalent again showed the historically lowest figures. Both rouble and dollar rates are dropping down.
We expect that stable USD currency exchange rate in 2016 will keep rental rates at the same level during the whole year.
Lease agreements with rents nominated in rubles or with special conditions of payment for dollar-nominated rental rates will be a market tendency in the upcoming years.
RENTAL RATES* IN US DOLLARS EQUIVALENT ARE
SETTING NEW NEGATIVE RECORDS
RENTAL RATES
94
SHARE OF RUSSIAN
ROUBLE DEALS IN Q1
2016
%
SUMMARY | ABSORPTION | DEMAND | NEW SUPPLY | AVAILABILITY | EXPOSITION | RENTAL RATES
MACROREVIEW | CAPITAL MARKETS | OFFICES | RETAIL | WAREHOUSES
$433
$193 $-
$200
$400
$600
$800
$1 000
$1 200
Class A Class B (B+&B-)
31 828 rub.
14 214 rub.
- rub.
5 000 rub.
10 000 rub.
15 000 rub.
20 000 rub.
25 000 rub.
30 000 rub.
35 000 rub.
40 000 rub.
Class A Class B (B+&B-)
*hereinafter all rental rates are net of OPEX and VAT
Source: Cushman & Wakefield

#MARKETBEAT | Q1 2016 CUSHMAN & WAKEFIELD RESEARCH DEPARTMENT | 25
433 14 214ROUBLE EQUIVALENT
ALL DEALS IN B CLASS
DOLLAR EQUIVALENT
ALL A CLASS DEALS
DOLLAR IS STEPPING BACK
ROUBLES VS DOLLARS
ROUBLE DEALS VS DOLLAR DEALS DEMAND AND RATES
US Dollars per sq m per annum Roubles per sq m per annum
Source: Cushman & Wakefield
Class Deal
Currency
Deals Volume,
sq m
Rate
А USD 17 433 $564
RUB 161 978 27 454 roubles
BB USD 2 584 $563
RUB 175 502 14 082 roubles
SUMMARY | ABSORPTION | DEMAND | NEW SUPPLY | AVAILABILITY | EXPOSITION | RENTAL RATES
MACROREVIEW | CAPITAL MARKETS | OFFICES | RETAIL | WAREHOUSES
0
50
100
150
200
250
300
350
400
450
Q12014
Q22014
Q32014
Q42014
Q12015
Q22015
Q32015
Q42015
Q12016
Thousands s
q m
RUB Deals USD Deals

#MARKETBEAT | Q1 2016 CUSHMAN & WAKEFIELD RESEARCH DEPARTMENT | 26
$0
$200
$400
$600
$800
$1 000
$1 200
$1 400
$1 600
$1 800
$2 000
2004 2005 2006 2007 2008 2009 2010 2012 2013 2014 2015 2016
Ren
tal ra
te, U
SD
/sq
m/ А
ре
нд
на
я с
та
вка
, д
ол
л. за
кв
.м.
Deal date / Дата сделки
Class B / Класс B
Class A / Класс А
Weighted average A class rent / Среднее взвешенное значение за год, Класс А
Weighted average B class rent / Среднее взвешенное значение за год, класс B
37 000DEALS
СДЕЛОК
Moscow office lease deals by rent and transaction date bubble size reflects deal size Сделки аренды на московском рынке по дате заключенияи арендной ставке.размер точки соответствует площади сделки
( = 10 000 sq m)
Source: Cushman & Wakefield

#MARKETBEAT | Q1 2016 CUSHMAN & WAKEFIELD RESEARCH DEPARTMENT | 27
$10
0$30
0$50
0$70
0$9
00
$1 100
$1 300
0 5 10 15 20 25
Renta
l ra
te U
SD
/sq
.m (
3 y
ear
avera
ge)
Distance from city center, km
CLASS A
CLASS B+
CLASS B- and C
Log. (CLASS A)
Log. (CLASS B+)
Log. (CLASS B- and C)
MOSCOW OFFICE MARKET LOCATION AND QUALITY PREMIUMS
CBD
MO
SC
OW
CIT
Y
Qualitypremium
MKAD
Source: Cushman & Wakefield

#MARKETBEAT | Q1 2016 CUSHMAN & WAKEFIELD RESEARCH DEPARTMENT | 28
RETAIL
MN SQ M
VACANCY RATE
(all shopping centers, Moscow)
%
PRIME RENTAL RATE INDICATOR
TOTAL QUALITY STOCK, MOSCOW
(Quality shopping malls, mixed-use buildings, outlets,
and retail parks)
TOTAL QUALITY STOCK, MOSCOW
(Quality shopping malls, mixed-use buildings, outlets,
and retail parks)
Source: Cushman & Wakefield Research
‘000 RUB
QUALITY PROJECTS
MACROREVIEW | CAPITAL MARKETS | OFFICES | RETAIL | WAREHOUSES
At the beginning of 2016 market slowed down falling, market players are noticing relative stabilization.
Shrinking consumer market remains the main risk factor. Considering continuing inflation, income level drop and high household debt load, we expect consumer activity to decline. Asa result, there is a potential of tenants’ activity decrease and shopping centers vacancy rate growth.
12
145
116
4.6

#MARKETBEAT | Q1 2016 CUSHMAN & WAKEFIELD RESEARCH DEPARTMENT | 29
VAGUE BALANCE WITH UNCLEAR PERSPECTIVES
Unpredictable depth of consumer market decrease and limited financial resources are base factors influencing the market.
SUMMARY
• Consumers reduce costs.
• Owners have provided maximum of personalized conditions.
The market came to a vague balance by the end of 2015 – rapid decrease of the main market indicators slowed down showing all market players being in consensus with noticeably changed circumstances. However, there are still no basic trends preparing basics for confident optimism - shrinking consumer market and hard-to-reach financing as well as stagnation in economics in general.
Rotation of the tenants in sustainable shopping centers continues, but not massive and total occupancy rate keeps relatively stable. Newly opened properties are moving to higher occupation. Exposition period of vacant premises is now longer, but properties opened in 2014-2015 attract new operators. Some of them have noticeably decreased vacancy rates, others keep stable.
We see activity on the market - retailers still consider opportunities for development, but lease terms are carefully negotiated. Developers consider personally tailored terms for each tenant.
Last year turned the market from a market of developer to a market of tenant, now consumer is the main focus of attention. Applying a conservative scenario, the decrease of money amount that is redistributed between different formats and categories of operators can lead to vacancy rate growth as the number of chain retailers’ stores will decrease and new shopping centreswill be opened with high vacancy rate. Large players and food retailers will remain active in this situation.
SUMMARY | RETAILERS | SHOPPING CENTRES | COMMERCIAL TERMS
MACROREVIEW | CAPITAL MARKETS | OFFICES | RETAIL | WAREHOUSES

#MARKETBEAT | Q1 2016 CUSHMAN & WAKEFIELD RESEARCH DEPARTMENT | 30
FOOTFALL CHANGE BY SHOPPING CENTRE
SIZE (Q1 2016 TO Q1 2015)
-10%
-8%
-6%
-4%
-2%
0%
2%
4%
5-20 000 20-40 000 40-80 000 >80 000
St. Petersburg Moscow
Moscow market has shown bigger changes in consumer behaviour – Muscovites have always been aggressive in consumption, so consumer habits correction is more evident.
According to Watcom data in Q1 2016 footfall in shopping centres keeps decreasing (the trend has been noticed since 2015). The most sustainable format is a neighborhood shopping centre. In St. Petersburg football decrease is less noticeable due to low base effect.
CONSUMER ACTIVITY DECREASE IS MOSTLY NOTICEABLE
IN LARGE CITIES
CONSUMER MARKET
CONSUMER MARKET,
2015 COMPARED TO 2014
-6%
-10%
-5%
-12%
-8%
-14%
Catering turnover
Retail trade turnover
Moscow St. Petersburg Russia
Average monthly
footfall change in
Moscow shopping
centres*
-3.6%
Average monthly
footfall change in St.
Petersburg shopping
centres*
-2.5
Q1 2016
Q1 2016
SUMMARY | RETAILERS | SHOPPING CENTRES | COMMERCIAL TERMS
MACROREVIEW | CAPITAL MARKETS | OFFICES | RETAIL | WAREHOUSES
Source: Watcom, Cushman & Wakefield calculationSource: Rosstat
Source: Watcom, Cushman & Wakefield calculation

#MARKETBEAT | Q1 2016 CUSHMAN & WAKEFIELD RESEARCH DEPARTMENT | 31
Another obvious tendency is expansion of entertainment areas in shopping centres – they are aimed to increase footfall and create identity of the project, decrease vacancy.
Perception and approach to development of these areas is changing. Instead of traditional ice-rings, bowling, gaming machines new formats are becoming more popular – contact zoos, edutainment centres, rope parks, trampoline centres, quests, thematic theatres, exhibitions and hobby goods shops. New children entertainment centre Fiesta Park is entering the Moscow market, Leonardo retail chain is expanding, the store with radio control models Pilotage was opened in a new format (with training tracks and areas for competitions and master classes) in Aviapark shopping centre.
Retailers’ activity is much lower than it was before 2014. If developer is interested in brand attraction, some preferences can be given to tenant (fit-out compensation, discount period).
Mostly, food retail chains, fast-food / café / confectionary operators, DIY and alcoholic stores announce their expansion plans.
Developers continue the trend to create own brands (Aviapark starts operating a 6,000 sq m department store).
Some operators have financial difficulties (for example, Sbarro, Moon Accessorize, Deti, Centrobuv’).
Luxury brands report on sales growth and new shops openings. Among possible reasons of this trend there are: increase of Chinese tourists flow and currency exchange rate growth that made it cheaper to buy luxury brands in Russia.
NEW OPENINGS WITH NEW TERMS
Many tenants are considering new openings, however they are trying to minimize costs and expansion risks.
RETAILERS
NEW RETAILERS
EXPANSION
SUMMARY | RETAILERS | SHOPPING CENTRES | COMMERCIAL TERMS
MACROREVIEW | CAPITAL MARKETS | OFFICES | RETAIL | WAREHOUSES

#MARKETBEAT | Q1 2016 CUSHMAN & WAKEFIELD RESEARCH DEPARTMENT | 32
Average market
vacancy rate
VACANCY RATE LEVEL TENDS TO GROW
SHOPPING CENTRES. MOSCOW
12%
2016 forecast:
14-15%.
The possibility of
further growth is high
as new projects with
high vacancy rate will
be opening and there
will be further
rotation of tenants in
existing shopping
centres.
SUMMARY | RETAILERS | SHOPPING CENTRES | COMMERCIAL TERMS
MACROREVIEW | CAPITAL MARKETS | OFFICES | RETAIL | WAREHOUSES
*Calculation is based on the actual vacant space in shopping centres, and not according to signed lease contracts.
Opened in 2014-2015: 25-30%
Prime: 2-3%
Sustainable: 7-8%
Announced to be opened in 2016: 35-40%
Size of a bubble is a size of each shopping center.
Vacancy rate* by shopping center type:

#MARKETBEAT | Q1 2016 CUSHMAN & WAKEFIELD RESEARCH DEPARTMENT | 33
Aviapark, March 2015
Projects constructed over the past two years that had high vacancy rate at the opening, are slowly decreasing the vacancy level. Retailers activity dropped noticeably and exposition period increased. Preferences that tenants receive for opening and for the initial lease period is an important driver to decrease the vacancy rate.
Vacancy rate in sustainable shopping centres(opened more than 2 years ago, with loyal target audience and balanced tenant mix) hasn’t changed significantly during past year.
Prime shopping centres (successful projects in prime locations) show high occupancy rate consistently, though the rotation of tenants is registered.
ALMOST 25% OF TOTAL MOSCOW RETAIL SPACE WAS
CONSTRUCTED OVER THE PAST TWO YEARS
SHOPPING CENTRES. MOSCOW
Aviapark, March 2016
Share of sustainable
shopping centres
70%
of total retail space
was constructed in
2014-2015
23%
SUMMARY | RETAILERS | SHOPPING CENTRES | COMMERCIAL TERMS
MACROREVIEW | CAPITAL MARKETS | OFFICES | RETAIL | WAREHOUSES

#MARKETBEAT | Q1 2016 CUSHMAN & WAKEFIELD RESEARCH DEPARTMENT | 34
NEW CONSTRUCTION IN RUSSIA,
‘000 SQ M
4 shopping centres with total GLA of 204,500 sq m were opened in Q1 2016. Shopping centres keep opening with low occupancy of retail gallery. Developers tend to open the projects in phases. For example, in MegaGRINNmixed-use complex in Kursk several floors were partially opened, launch of the rest of the complex (including entertainment, sports areas, hotel) is expected later in 2016.
Construction of smaller size shopping centres instead of large-scale projects has become a trend. Average size of existing shopping centre is 36,000 sq m, of a shopping centre to be delivered in 2016 – 31,000 sq m. Half of retail space planned for delivery to the market in 2016 is being constructed in the cities with population of less than one million people.
Due to the high level of retail space density in the cities with population of more than one million people, 25% of the space planned for delivery to the market in such cities in 2016 are new phases of existing retail projects.
4 SHOPPING CENTRES WERE OPENED IN Q1 2016 IN RUSSIA
Average size of shopping centre decreases as well as construction volumes.
SHOPPING CENTRES. MOSCOW AND REGIONS
EXISTING QUALITY
RETAIL SPACE IN
SHOPPING CENTRES
18.6mn sq m
SUMMARY | RETAILERS | SHOPPING CENTRES | COMMERCIAL TERMS
MACROREVIEW | CAPITAL MARKETS | OFFICES | RETAIL | WAREHOUSES
QUALITY SHOPPING
CENTRES IN RUSSIA
460

#MARKETBEAT | Q1 2016 CUSHMAN & WAKEFIELD RESEARCH DEPARTMENT | 35
REGIONAL MARKETS ARE MORE SENSITIVE TO THE CHANGES
IN DEMAND FROM POTENTIAL TENANTS
SHOPPING CENTRES. REGIONS OF RUSSIA
Absorption potential of regional markets is lower than in larger markets of Moscow and Saint Petersburg, so even delivery of one large-scale shopping center with high vacancy rate to the market affects indicators of the whole market significantly. For example, after the opening of Galereya Novosibirsk shopping centre in Novosibirsk, average market vacancy rate grew up to 15%, but as there were no more new large-scale projects opened, average market vacancy rate returned to the level of 8-10% during the year.
In the big cities where no large-scale projects were opened in 2015, we observe tenants rotation in existing shopping centers, but vacancy rate remains at the level of 10% (for example, in Saint Petersburg, Kazan, Ekaterinburg). In the key and most successful projects vacancy rate remains low (2-3%).
MegaGRINN (Kursk)
OkhtaMall (St. Petersburg)
Good’OK (Samara)
Star City Mall (Tumen)
SUMMARY | RETAILERS | SHOPPING CENTRES | COMMERCIAL TERMS
MACROREVIEW | CAPITAL MARKETS | OFFICES | RETAIL | WAREHOUSES

#MARKETBEAT | Q1 2016 CUSHMAN & WAKEFIELD RESEARCH DEPARTMENT | 36
NEW CONSTRUCTION IN MOSCOW AND MOSCOW
REGION, ‘000 SQ M
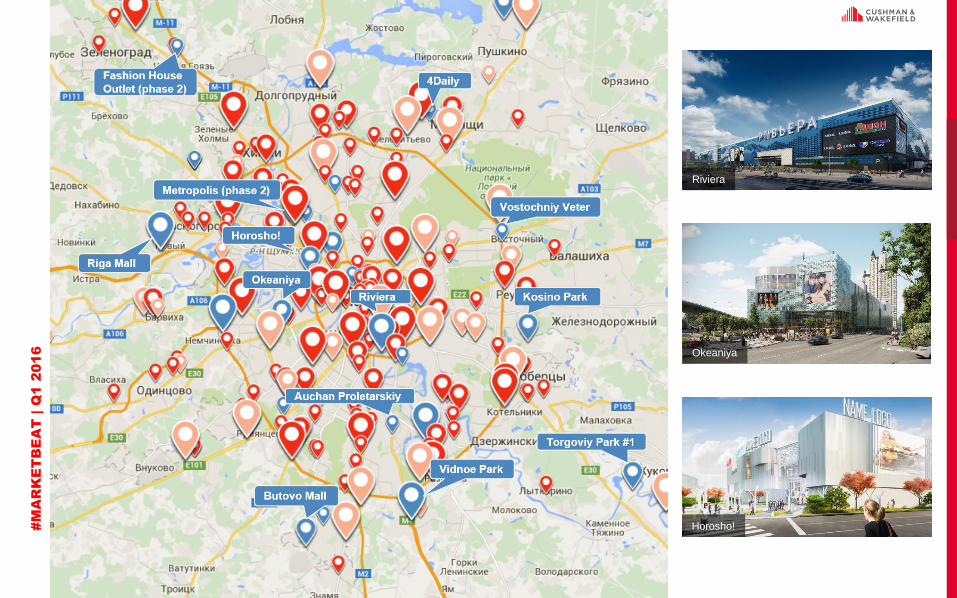
No new shopping centres were opened in Moscow in Q1 2016. Riviera shopping centre, which was planned for delivery to the market in March, was opened in April 2016.
Delivery dates of the majority of projects were postponed for 2-3 months. However we expect large projects such as Okeaniya, Horosho!, Butovo Mall, second phase of Metropolis shopping centre to be delivered to the market till the end of the year.
Shopping centres will keep opening with high vacancy rate despite the fact that the number of lease contacts signed is more than the actual number of shops opened. Tenants will occupy the shopping centers step by step after the opening.
New shopping centres are being announced, however in general these are small projects or support retail objects inside mixed-use complexes or transport transit hubs.
NO NEW SHOPPING CENTRES WERE OPENED
IN Q1 2016
SHOPPING CENTRES. MOSCOW AND MOSCOW REGION
QUALITY RETAIL
SPACE IN SHOPPING
CENTRES
4.6
mn sq m
SUMMARY | RETAILERS | SHOPPING CENTRES | COMMERCIAL TERMS
MACROREVIEW | CAPITAL MARKETS | OFFICES | RETAIL | WAREHOUSES
QUALITY SHOPPING
CENTRES
116
MOSCOW:

#MARKETBEAT | Q1 2016 CUSHMAN & WAKEFIELD RESEARCH DEPARTMENT | 37
SHOPPING CENTRES DELIVERED TO THE MARKET IN
Q1 2016 AND PIPELINE FOR 2016
SHOPPING CENTRES. MOSCOW AND REGIONS
LOCATION PROPERTY NAMERETAIL
GLA, SQ MDELIVERY
Kursk MegaGRINN 129,000 Q1
Pskov Aquapolis 34,000 Q1
Ekaterinburg Akademicheskiy 30,000 Q1
Balakovo Green House (phase 2) 11,500 Q1
Total GLA Russia (without Moscow and Moscow region), 2016 204,500
Vladivostok Sedanka-City 45,000 Q2
Samara Good'Ok 115,000 Q3
Saint Petersburg Okhta Mall 78,000 Q3
Lipetsk Riviera 61,000 Q3
Voronezh Chizhov Gallery (phase III) 60,000 Q3
Arkhangelsk Maxi 49,243 Q3
Nizhniy Tagil Retail Park Depo 40,000 Q3
Kursk Evropa Phase 2 107,000 Q4
Tumen Star City Mall 53,000 Q4
Orenburg Armada Capital 51,000 Q4
Novosibirsk Evropeyskiy 45,000 Q4
Ekaterinburg Greenvich (phase V) 41,836 Q4
Total GLA Russia (without Moscow and Moscow region),
announced development plans for 20161,637,477
SUMMARY | RETAILERS | SHOPPING CENTRES | COMMERCIAL TERMS
MACROREVIEW | CAPITAL MARKETS | OFFICES | RETAIL | WAREHOUSES
LOCATION PROPERTY NAMERETAIL GLA,
SQ MDELIVERY
Moscow Riviera 100,000 Q2
Moscow Kosino Park 39,000 Q2
Moscow Okeaniya 60,000 Q3
Moscow Butovo Mall 57,000 Q3
Moscow Horosho! 50,000 Q3
Moscow Metropolis (Phase 2) 40,000 Q3
Moscow Auchan Proletarskiy 14,877 Q4
Moscow Fashion House Outlet (Phase 2) 4,500 Q4
Total GLA Moscow, 2016 392,763
Zhukovsky Torgovy Park N1 45,488 Q2
Balashikha Vostochniy veter 10,000 Q2
Krasnogorsk Riga Mall 80,000 Q3
Mytischi 4Daily 25,000 Q3
Vidnoe Vidnoe Park 70,000 Q4
Total GLA Moscow Region, 2016 230,488
Total GLA Moscow and Moscow Region, 2016 623,251
The table includes all major quality projects in Moscow and Moscow Region planned for delivery in 2016.
The table includes all quality projects completed in Q1 2016 and the largest (GLA 40,000+ sq. m ) projects announced for delivery later in 2016.
#M
AR
KE
TB
EA
T | Q
1 2016
Riviera
Okeaniya
Horosho!

#MARKETBEAT | Q1 2016 CUSHMAN & WAKEFIELD RESEARCH DEPARTMENT | 39
In shopping centres that are currently under construction rent is calculated on the basis of a percentage of projected tenant turnover, however maximum(% of turnover with maximum fixed payment) or minimum limit (% of turnover, but no less than a fixed amount) is fixed in agreements.
In new agreements with preferential payment structure lease period tend to be reduced– from 5 to 3 years (for retail gallery operators).
Percentage of turnover that is fixed in the agreements remains the same: 3-7% for anchor tenants of retail gallery, 12-15% for retail gallery operators, 10-15% for food-court operators and restaurants, 1-3% for large anchor tenants (hypermarkets).
For the first time in the history of the retail market research, prime rental rate indicator is nominated in rubles.
In fact, even if principal lease contracts are nominated in foreign currency rental payments are temporarily fixed in rubles.
From the middle of the last year rent indicator in rubles hasn’t shown any significant changes – this is applicable for both Moscow and regional markets. In sustainable shopping centers, preferences in existing leases that were agreed last year are being extended (usually a discount on fixed rent or exchange rate fixation).
RELATIVE STABILIZATION OF RENTAL RATE INDICATOR IN
RUBLES
In 2015 short-term agreements fixing rates in rubles were signed in addition to existing contracts. In new projects nominating rents in foreign currency is a rare, almost unique case.
COMMERCIAL TERMS
Prime shopping mall
indicator*, Moscow,
Q1 2016
145
‘000 rub / sq m / year
SUMMARY | RETAILERS | SHOPPING CENTRES | COMMERCIAL TERMS
MACROREVIEW | CAPITAL MARKETS | OFFICES | RETAIL | WAREHOUSES
* Prime shopping mall indicator - base asking rental rate for a 100 sq m gallery unit on the ground floor of prime shopping centres.

#MARKETBEAT | Q1 2016
CUSHMAN & WAKEFIELD RESEARCH DEPARTMENT | 40
WAREHOUSE
& INDUSTRIAL
Source: Cushman & Wakefield
NEW CONSTRUCTION (CLASS A AND B)
TAKE UP (CLASS A AND B)
NEW CONSTRUCTION (CLASS A AND B)
TAKE UP (CLASS A AND B)
MACROREVIEW | CAPITAL MARKETS | OFFICES | RETAIL | WAREHOUSES
• In Q1 2016 average rental rates have been decreased.
• Vacancy rate level remains stable.
• Demand is supported by retail chains.
• Large share of deals are relocations in order to improve commercial terms.
• Tenants are very active in lease terms renegotiation.
FORECAST 2016
4858
218279
MOSCOWRUSSIA
RUSSIA MOSCOW
‘000 sq m
‘000 sq m
‘000 sq m
‘000 sq m
10
REGIONS
‘000 sq m
61
REGIONS
‘000 sq m
0.831.30
MOSCOWRUSSIA
mn sq mmn sq m
0.47
REGIONS
mn sq m
0.851.30
MOSCOWRUSSIA
mn sq mmn sq m
0.45
REGIONS
mn sq m
2016 Q1

#MARKETBEAT | Q1 2016
CUSHMAN & WAKEFIELD RESEARCH DEPARTMENT | 41
VACANCY RATE, CLASS A
In order to increase occupation quickly, some landlords decreased rental rates. In Q1 2016 rental rate in Moscow region dropped by 3-5% and now comprises 3,800 –4,000 rub per square meter per year. Lease term is getting shorter.
High vacancy rate is a key factor influencing the warehouse market. During the past 6 months vacancy rate in Moscow remains stable at the level of 10%. Vacancy rate is not decreasing because of high construction volumes and extra warehouse space that came back to the market after space optimization by tenants .
IN Q1 2016 AVERAGE RENTAL RATE DECREASED. VACANCY
RATE REMAINS STABLE
TRENDS. MOSCOW REGION
NET RENTAL RATE IN RUBLES
(RUB/ SQ M/ YEAR) TAKE-UP Q1 2016
218
The warehouse real estate segment is influenced by the situation in the consumer sector of the Russian economy.
RUB / sq m / year
CURRENT RENTAL
RATE, EXCLUDING
OPERATIONAL
EXPENCES, UTILITY
COSTS AND VAT
4 000
MACROREVIEW | CAPITAL MARKETS | OFFICES | RETAIL | WAREHOUSES
Source: Cushman & Wakefield Research
TRENDS | NEW CONSTRUCTION | DEMAND | REGIONS
2.0%
13.5%
3.9%
1.0%1.0%1.5%
7.0%
10.0% 10.5%
0%
2%
4%
6%
8%
10%
12%
14%
2008 2009 2010 2011 2012 2013 2014 2015 2016F
‘000 sq m
3 325
3 480
3 331
3 341
3 820
4 198
4 299
4 500
4 150
4 000
3 000
3 250
3 500
3 750
4 000
4 250
4 500
2007 2008 2009 2010 2011 2012 2013 2014 2015 2016F

#MARKETBEAT | Q1 2016
CUSHMAN & WAKEFIELD RESEARCH DEPARTMENT | 42
NEW CONSTRUCTION, CLASSES A AND B
In Q1 2016 47,000 sq m of quality warwhouse space was delivered to the market. Developers announce 824,000 sq m of warehouse premises be delivered to the market by the end of 2016 which is the same as in 2015. Only 20% of the new space are new projects, the rest of them are new phases of existing warehouses.
Vacancy rate hasn’t changed in Q1 2016 and is now at the level of 10%. By the end of the year we forecast vacancy rate to remain the same and to be at the level of 9.5– 10.5%.
NEW CONSTRUCTION VOLUME REMAINS AT THE LEVEL OF 2015
After the peak of development activity in 2014, the volume of construction decreased twice in2015. Downward trend in activity retains in 2016.
NEW CONSTRUCTION. MOSCOW REGION
NEW CONSTRUCTION,
Q1 2016
47
NEW CONSTRUCTION,
2016F
824
‘000 sq m
‘000 sq m
MACROREVIEW | CAPITAL MARKETS | OFFICES | RETAIL | WAREHOUSES
Source: Cushman & Wakefield Research
TRENDS | NEW CONSTRUCTION | DEMAND | REGIONS
0
200
400
600
800
1 000
1 200
1 400
1 600
1 800
2007 2008 2009 2010 2011 2012 2013 2014 2015 2016F
'00
0 s
q m
Actual Construction Forecast

#MARKETBEAT | Q1 2016
CUSHMAN & WAKEFIELD RESEARCH DEPARTMENT | 43
TAKE UP, CLASSES A AND B, ‘000 sq m Volume of lease and purchase transactions in Q1 2016 exceeds the average of 2008-2015 by 60% and comprises 218,000 sq m. Demand is supported by retail chains specializing in food and household goods. Though price of warehouse premises is now low, consumers prefer rather lease than purchase, in Q1 2016 only 6% of space was purchased.
Tenants benefit from low rental rates nominated in rubles and sufficient availability of vacant space –they are more active in renegotiation of existing lease contracts, relocation to projects with higher quality, consolidation of warehouse space.
TAKE UP REMAINS HIGH
Demand is mostly supported by retail chains specializing in food and household goods.
DEMAND. MOSCOW REGION
TAKE UP, Q1 2016
218
850
‘000 sq m
MACROREVIEW | CAPITAL MARKETS | OFFICES | RETAIL | WAREHOUSES
Source: Cushman & Wakefield Research
TRENDS | NEW CONSTRUCTION | DEMAND | REGIONS
TAKE UP, 2016F
‘000 sq m
0
200
400
600
800
1 000
1 200
1 400
2009 2010 2011 2012 2013 2014 2015 2016FMoscow Forecast

#MARKETBEAT | Q1 2016
CUSHMAN & WAKEFIELD RESEARCH DEPARTMENT | 44
NEW CONSTRUCTION, CLASSES A AND B,
‘000 sq m
In Q1 2016 take up exceeds the average indicator of 2008-2015 by 10% and comprises 61,000 sq m. We forecast the volume of lease and purchase transactions to be the same as in 2015 and to comprise around 450,000 sq m.
New construction decreases in the regions. We forecast around 470,000 sq m of quality warehouse space to be constructed by the end of the year, which is 40% lower than last year.
Local developers continue to construct small warehouse projects (less than 30,000 sq m). Large federal developers offer build-to-suit options on their land plots.
NEW CONSTRUCTION DECREASES, TAKE UP REMAINS
STABLE
REGIONS
TAKE UP, CLASSES A AND B, ‘000 sq m
TAKE-UP, 2016F
0
100
200
300
400
500
600
2009 2010 2011 2012 2013 2014 2015 2016F
Regions Forecast
TAKE-UP, Q1 2016
61‘000 sq m
470
‘000 sq m
MACROREVIEW | CAPITAL MARKETS | OFFICES | RETAIL | WAREHOUSES
Source: Cushman & Wakefield Research
TRENDS | NEW CONSTRUCTION | DEMAND | REGIONS
0
200
400
600
800
1 000
1 200
2009 2010 2011 2012 2013 2014 2015 2016F
Actual Construction Forecast

#MARKETBEAT | Q1 2016
CUSHMAN & WAKEFIELD RESEARCH DEPARTMENT | 45
mn sq m
THE BIGGEST WAREHOUSE PROJECTS TO BE COMPLETED
IN 2016
NEW CONSTRUCTION, MOSCOW AND REGIONS
1.3
NEW
CONSTRUCTION,
2016F
MACROREVIEW | CAPITAL MARKETS | OFFICES | RETAIL | WAREHOUSES
PROJECT HIGHWAY REGION
DISTANCE
FROM
CITY, KM
TOTAL
AREA,
‘000 SQ M
DELIVERY
Mihaylovskaya sloboda Novoryazanskaya Moscow 20 70.3 Q1, Q2
Logopark Sever II Leningradskoye Moscow 30 105.6 Q2, Q3
PNK – Valischevo Kashirskoye Moscow 39 117.9 Q3, Q4
Industrial Park South
GateKashirskoye Moscow
30 100Q4
Klin logistic park Leningradskoye Moscow 65 57.5 Q4
A Plus Shushary Moscovskoye St. Petersburg 20 95.0 Q2
Fright Village Vorsino Kievskoye Kaluga 67 35.6 Q2
Aviapolis YankovskiyVladivostok-port
VostochniyVladivostok
30 28Q2
A Plus Park Perm Zapadniy obhod Perm 19 26.4 Q3
Octavian Toksovskoye St. Petersburg 11 53 Q3, Q4
TRENDS | NEW CONSTRUCTION | DEMAND | REGIONS

#MARKETBEAT | Q1 2016 CUSHMAN & WAKEFIELD RESEARCH DEPARTMENT | 46CUSHMAN & WAKEFIELD RESEARCH DEPARTMENT | ‹#›
Market indicators
Standard lease terms
Interactive services
Cushman & Wakefield Research Department provides clients with the most detailed information on the market indicators, including average rental and vacancy rates split by metro stations, administrative districts and submarkets in Moscow, as well as data on planned projects and projects under construction in Russia.If you need more detailed information please contact the Research Department.
APPENDIX

#MARKETBEAT | Q1 2016 CUSHMAN & WAKEFIELD RESEARCH DEPARTMENT | 47
OFFICES AND SHOPPING CENTRES
The forecast is based on the conservative macroeconomic scenario.
COMMERCIAL REAL ESTATE MARKET INDICATORS (1)
APPENDIX
INDICATORS | STANDARD COMMERCIAL LEASE TERMS | INTERACTIVE SERVICES
MOSCOW REAL ESTATE MARKET INDICATORS FORECAST/ПРОГНОЗ
2006 2007 2008 2009 2010 2011 2012 2013 2014 2015 2016 2016 2017 2018
Q1
Average annual exchange rate RUB/USD 27,1 25,6 24,9 31,8 30,4 29,4 31,1 31,9 38,6 61,3 74,9 67,4 61,7 57,1
MOSCOW OFFICES
Stock class A, EOP '000 sq m 720 995 1 326 1 729 2 021 2 318 2 536 2 684 3 416 3 821 3 821 3 971 4 071 4 171
Stock class B (B+ and B-), EOP '000 sq m 5 297 6 509 8 277 9 158 9 781 10 167 10 515 11 227 11 838 12 132 12 195 12 282 12 382 12 482
New construction, A, '000 sq m 131 275 331 403 292 297 219 225 714 327 0 150 100 100
New construction, B (B+ and B-), '000 sq m 765 1 212 1 768 881 623 386 348 674 693 394 63 150 100 100
Vacancy rate class A 3,9% 4,8% 12,8% 23,6% 22,5% 16,8% 14,6% 17,6% 23,8% 31,1% 28,9% 32,9% 32,6% 31,8%
Vacancy rate class B (B+ and B-) 2,7% 4,1% 6,1% 11,1% 10,4% 8,9% 9,1% 9,8% 10,8% 14,4% 16,3% 16,6% 16,9% 16,8%
Take up class A, '000 sq m 287 487 456 183 388 638 459 361 324 427 179 300 200 250
Take up class B (B+ and B-), '000 sq m 863 1 024 1 237 558 911 1 224 1 398 1 205 937 872 180 700 800 850
Rental rates class A, USD/sq m pa $714 $934 $1 092 $729 $645 $733 $790 $867 $772 $549 $433 $450 $470 $500
Rental rates class B (B+ and B-), RUB/sq m pa 14 337 16 486 20 240 16 141 12 671 13 370 14 624 17 041 18 699 17 820 14 214 13 480 13 574 14 275
Prime capitalization rate 8,25% 7,25% 12,00% 13,00% 9,00% 8,50% 8,75% 8,50% 11,00% 10,50% 10,50% 10,50% 10,50% 9,50%
MOSCOW QUALITY SHOPPING CENTERS
Total stock, EOP, '000 sq m 1 477 1 696 2 052 2 569 2 957 3 147 3 297 3 482 4 129 4 555 4 555 4 912 5 112 5 212
New construction, '000 sq m 369 219 356 517 388 190 150 185 647 426 0 360 200 100
Prime vacancy rate, EOP 0,7% 1,0% 3,0% 5,0% 2,1% 0,4% 0,5% 1,2% 1,5% 2,0% 2,5% 3,0% 2,5% 2,0%
Prime rental rate indicator, RUB/sq m pa* 94 990 91 980 99 480 87 368 88 102 105 804 114 959 121 258 127 380 159 432 145 000 145 000 145 000 160 000
(until 2016 nominated in USD, paid in RUB by offical exchange rate)
Prime capitalization rate 9,50% 9,00% 12,00% 13,00% 10,00% 9,25% 9,50% 9,00% 11,00% 11,00% 11,00% 11,00% 11,00% 10,50%

#MARKETBEAT | Q1 2016 CUSHMAN & WAKEFIELD RESEARCH DEPARTMENT | 48
WAREHOUSE AND INDUSTRIAL, INVESTMENTS
The forecast is based on the conservative macroeconomic scenario.
COMMERCIAL REAL ESTATE MARKET INDICATORS (2)
APPENDIX
INDICATORS | STANDARD COMMERCIAL LEASE TERMS | INTERACTIVE SERVICES
MOSCOW REAL ESTATE MARKET INDICATORS FORECAST/ПРОГНОЗ
2006 2007 2008 2009 2010 2011 2012 2013 2014 2015 2016 2016 2017 2018
Q1
WAREHOUSES, MOSCOW REGION
Stock, class A, EOP '000 sq m 1 943 3 129 3 723 4 352 4 676 4 933 5 598 6 456 7 852 8 669 8 716 9 433 9 933 10 483
Stock, class B, EOP '000 sq m 1 789 1 978 2 060 2 109 2 157 2 264 2 317 2 409 2 688 2 690 2 690 3 060 3 100 3 145
New construction, class A, '000 sq m 863 1 186 594 629 324 257 664 858 1 396 817 47 764 500 550
New construction, class B, '000 sq m 126 188 82 49 48 107 53 92 279 2 0 62 40 45
Vacancy rate class A 2,0% 2,0% 2,0% 10,5% 8,0% 1,0% 1,0% 1,5% 7,0% 10,0% 10,0% 10,5% 9,0% 8,0%
Vacancy rate class B 2,0% 2,0% 2,0% 5,9% 6,1% 1,5% 1,5% 2,0% 5,0% 8,0% 8,0% 9,0% 8,0% 6,0%
Net Absorption Class A, '000 sq m 846 1 162 582 247 409 580 658 817 944 500 42 640 596 605
Net Absorption Class B, '000 sq m 123 185 80 -33 40 205 53 78 192 -79 0 56 67 104
Rental rates class A, RUB/sq m pa 3 691 3 322 3 482 3 336 3 342 3 968 4 194 4 308 4 500 4 150 4 000 3 900 4 000 4 100
Rental rates class B, RUB/sq m pa 3 284 2 989 3 109 2 859 2 795 3 821 4 039 4 148 4 000 3 800 3 700 3 600 3 700 3 800
Prime capitalization rate 10,50% 9,25% 13,00% 14,00% 10,50% 10,50% 11,50% 11,00% 13,00% 12,75% 12,75% 12,75% 12,75% 12,25%
INVESTMENTS
TOTAL, MN US$ 4 560 5 354 5 798 2 256 3 994 7 657 7 458 8 066 4 309 2 828 2 517 3 500 3 000 4 000
Office, US$ mn 1 244 1 719 3 149 1 998 3 282 3 432 2 854 3 517 2 230 1 198 1 739
Retail, US$ mn 2 224 2 216 2 029 30 459 1 767 2 585 2 798 639 731 23
Warehouse, US$ mn 616 723 110 81 1 080 660 1 395 363 584 202
Other, US$ mn 476 696 510 228 172 1 379 1 358 355 1 076 315 553
* Base rental rate for 100-150 sq m unit on
the ground floor of retail gallery of prime
shopping mall for fashion retailer

#MARKETBEAT | Q1 2016 CUSHMAN & WAKEFIELD RESEARCH DEPARTMENT | 49
STANDARD COMMERCIAL LEASE TERMS
APPENDIX
INDICATORS | STANDARD COMMERCIAL LEASE TERMS | INTERACTIVE SERVICES
LEASE TERMS
DURATION OF LEASE
Office: 5 years
Industrial: either short-term (1-3 years) or long-term
(5+ years)
Retail: 3-5 years, anchor tenants - 10-25 years.
BREAK OPTIONS
Offices: Possible after 3 years with deposit withdrawal
as penalty. After crises has become very popular. Notice
period is 6-9 months. When there is an option to review
the rent after the third year, contract can be terminated
from both sides.
Retail: a standard lease agreement is not supposed to
include break option.
RENTAL PAYMENTS
RENT PAYMENT AND FREQUENCY
Offices and retail: RUB or US$ per square meter per year, payable due
monthly or quarterly in advance.
Industrial: Rubles.
RENT DEPOSIT
Offices: 1-3 months rent equivalent (bank guarantee optional, very seldom
however).
Retail: 1-2 months rent equivalent (bank guarantee optional).
Industrial: 1-3 months rent equivalent (bank guarantee optional, very seldom
however as landlords as landlords prefer the deposit)
RENT REVIEWS
After crises have become more popular, negotiable.
INDEXATION
Offices: 7-10% for RUB agreements; 3-5% or at the level of USA / EU CPI.
Retail: if rents in US$ – US CPI or 5%; if rents are in RUB – Russia’ CPI or 8-
9%.
Industrial: 8-10%
ENTRANCE FEE
It is possible to pay extra-fee to “enter the project” – applicable only for prime
projects.
Turnover rents (only in Retail):
Compound rental rates (fixed rent and a percentage of turnover) are almost
always used in shopping centers. Normally, the percentage of turnover varies
between 10 %- 15% (fashion), 2-5% for anchors.
DISPOSAL OF LEASES
ASSIGNMENT AND SUB-LETTING
Offices & Industrial: Usually possible, but subject to negotiation.
Retail: Not common.
SERVICE CHARGES, REPAIRS & INSURANCE
REPAIRS
Tenant: Internal repairs and maintenance.
Landlord: Structural repairs, common areas.
INSURANCE
Tenant: Contents insurance.
Landlord: Building insurance which is normally charged back to tenant via the service charge.
SERVICE CHARGES
Service charge is payable by the tenant at either an ‘open book’ basis or as a fixed cost.
UTILITY EXPENSES
Often included to service charges, but depends on landlord and different types of projects.
TAXATION
REAL ESTATE TAX
Tenant: None.
Landlord: For office and industrial the amount of tax depends on the region. In Moscow: 1.2%
of cadastral value in 2015, 1.3% in 2016, 1.4% in 2017 and 1.5% in 2018.
VAT: 18%
MEASUREMENT PRACTICE
Space is measured generally on the BOMA system. Some Landlords have apply BTI (Bureau of
Technical Inventory) measurements.

#MARKETBEAT | Q1 2016 CUSHMAN & WAKEFIELD RESEARCH DEPARTMENT | 50
CUSHMAN & WAKEFIELD
MOBILE APPS
CUSHMAN & WAKEFIELD IN RUSSIA
APPENDIX
INDICATORS | STANDARD COMMERCIAL LEASE TERMS | INTERACTIVE SERVICES
The only commercial real estate app in Russia
CUSHMAN AND WAKEFIELDC&W INTERACTIVE MAPS
Commercial real estate and infrastructure interactive maps
• Moscow offices• Shopping centers in Russia• Warehouses• Hotels• Infrastructure development
www.interactivemaps.ru

#MARKETBEAT | Q1 2016 CUSHMAN & WAKEFIELD RESEARCH DEPARTMENT | 51
RESEARCH DEPARTMENT
CUSHMAN & WAKEFIELD, RUSSIA
DENIS SOKOLOV
Partner, Head of Research
YULIA BOGOMOL
Associate Director
TATYANA DIVINA
Associate Director,Deputy Head of Research
ALEXANDER KUNTSEVICH
Senior Analyst
ANDREY VLADIMIRSKY
Analyst
The information provided in this report is intended for informational purposes only and should not be relied on by any party without further independent verification. Classifications of individual buildings are reviewed on a continuing basis and are subject to change. The standards used in this process are consistent with those used by Moscow Research Forum and in the United States by the Society of Industrial and Office Realtors (SIOR) and BOMA International. Reproduction of this report in whole or part is permitted only with written consent of Cushman & Wakefield. Data from this report may be cited with proper acknowledgment given.
For more information and contacts please visit CWRUSSIA.RU
EVGENIYA SAFONOVA
Junior analyst
OUR TEAM
RESEARCH DEPARTMENT | CUSHMAN & WAKEFIELD IN RUSSIA

#MARKETBEAT | Q1 2016 CUSHMAN & WAKEFIELD RESEARCH DEPARTMENT | 52CUSHMAN & WAKEFIELD RESEARCH DEPARTMENT | ‹#›
СUSHMAN & WAKEFIELD,
RUSSIA
Cushman & Wakefield is a global leader in commercial real estate services, helping clients transform the way people work, shop, and live. The firm’s 43,000 employees in more than 60 countries provide deep local and global insights that create significant value for occupiers and investors around the world. Cushman & Wakefield is among the largest commercial real estate services firms with revenues of $5 billion across core services of agency leasing, asset services, capital markets, facility services (branded C&W Services), global occupier services, investment management (branded DTZ Investors), project & development services, tenant representation and valuation & advisory.
OUR TEAM
RESEARCH DEPARTMENT | CUSHMAN & WAKEFIELD IN RUSSIA