realtor.com market outlook · 2014 was best year for growth in 25-34 employment since 1987 20 26%...
TRANSCRIPT

© 2015 Move, Inc. All rights reserved. Do not copy or distribute. 1
REALTOR.COM® MARKET OUTLOOK Jonathan Smoke Chief Economist
June 2, 2015

© 2015 Move, Inc. All rights reserved. Do not copy or distribute. 2
NATIONAL CONTEXT

© 2015 Move, Inc. All rights reserved. Do not copy or distribute.
JOB EXPANSION MODE After cold start to year, April back up to 223,000 jobs created
3
-
2.0
4.0
6.0
8.0
10.0
12.0
122.0
124.0
126.0
128.0
130.0
132.0
134.0
136.0
138.0
140.0
142.0
144.0
2000
.01
2000
.05
2000
.09
2001
.01
2001
.05
2001
.09
2002
.01
2002
.05
2002
.09
2003
.01
2003
.05
2003
.09
2004
.01
2004
.05
2004
.09
2005
.01
2005
.05
2005
.09
2006
.01
2006
.05
2006
.09
2007
.01
2007
.05
2007
.09
2008
.01
2008
.05
2008
.09
2009
.01
2009
.05
2009
.09
2010
.01
2010
.05
2010
.09
2011
.01
2011
.05
2011
.09
2012
.01
2012
.05
2012
.09
2013
.01
2013
.05
2013
.09
2014
.01
2014
.05
2014
.09
2015
.01
Mill
ions
Employment and Unemployment Nonfarm Employment Unemployment Rate
Source: Bureau of Labor Statistics
© 2015 Move, Inc. All rights reserved. Do not copy or distribute.
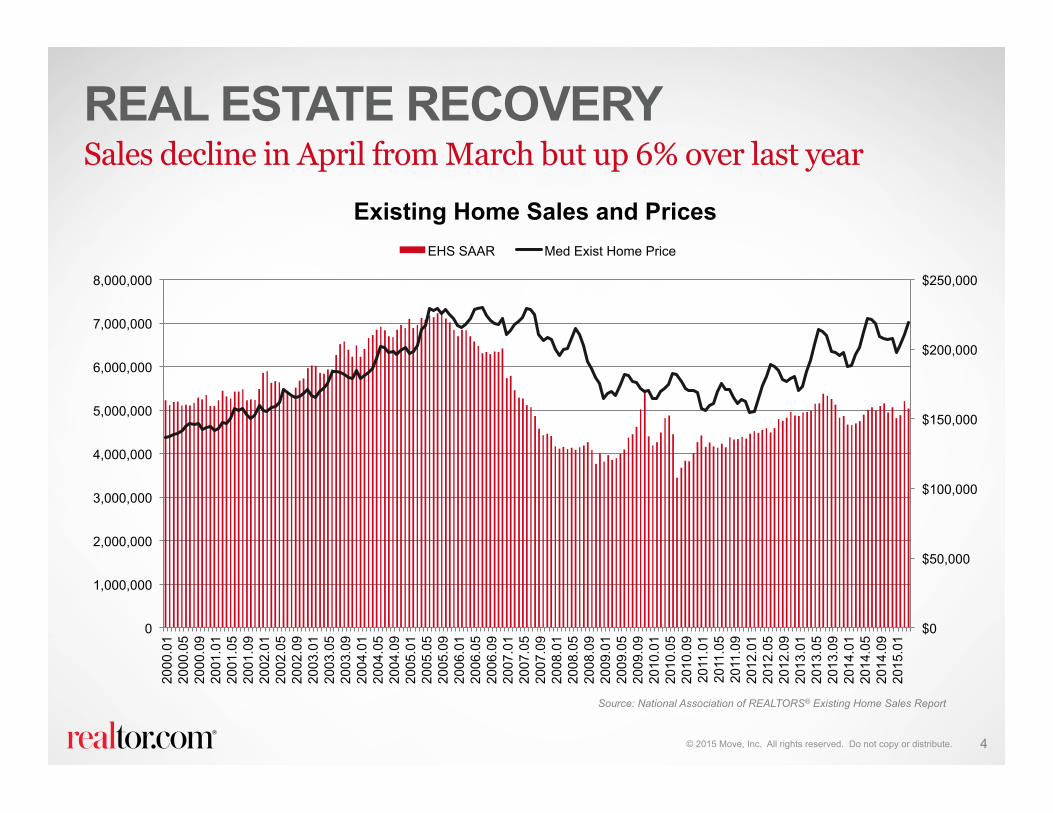
REAL ESTATE RECOVERY Sales decline in April from March but up 6% over last year
4
Source: National Association of REALTORS® Existing Home Sales Report
$0
$50,000
$100,000
$150,000
$200,000
$250,000
0
1,000,000
2,000,000
3,000,000
4,000,000
5,000,000
6,000,000
7,000,000
8,000,000
2000
.01
2000
.05
2000
.09
2001
.01
2001
.05
2001
.09
2002
.01
2002
.05
2002
.09
2003
.01
2003
.05
2003
.09
2004
.01
2004
.05
2004
.09
2005
.01
2005
.05
2005
.09
2006
.01
2006
.05
2006
.09
2007
.01
2007
.05
2007
.09
2008
.01
2008
.05
2008
.09
2009
.01
2009
.05
2009
.09
2010
.01
2010
.05
2010
.09
2011
.01
2011
.05
2011
.09
2012
.01
2012
.05
2012
.09
2013
.01
2013
.05
2013
.09
2014
.01
2014
.05
2014
.09
2015
.01
Existing Home Sales and Prices EHS SAAR Med Exist Home Price

© 2015 Move, Inc. All rights reserved. Do not copy or distribute.
COMPOSITION RETURNING TO NORMAL Distress activity down substantially
5
Source: National Association of REALTORS® Monthly Realtor Confidence Survey
0%
10%
20%
30%
40%
50%
60%
70%
80%
90%
100%
2008
.10
2008
.12
2009
.02
2009
.04
2009
.06
2009
.08
2009
.10
2009
.12
2010
.02
2010
.04
2010
.06
2010
.08
2010
.10
2010
.12
2011
.02
2011
.04
2011
.06
2011
.08
2011
.10
2011
.12
2012
.02
2012
.04
2012
.06
2012
.08
2012
.10
2012
.12
2013
.02
2013
.04
2013
.06
2013
.08
2013
.10
2013
.12
2014
.02
2014
.04
2014
.06
2014
.08
2014
.10
2014
.12
2015
.02
2015
.04
Composition of Sales by Type Foreclosed Short Sale Normal

© 2015 Move, Inc. All rights reserved. Do not copy or distribute.
INVENTORY HAS BEEN A CONSTRAINT Demand continues to exceed supply
6
Source: National Association of REALTORS®, Commerce Department
0.0
2.0
4.0
6.0
8.0
10.0
12.0
14.0
2000
.01
2000
.05
2000
.09
2001
.01
2001
.05
2001
.09
2002
.01
2002
.05
2002
.09
2003
.01
2003
.05
2003
.09
2004
.01
2004
.05
2004
.09
2005
.01
2005
.05
2005
.09
2006
.01
2006
.05
2006
.09
2007
.01
2007
.05
2007
.09
2008
.01
2008
.05
2008
.09
2009
.01
2009
.05
2009
.09
2010
.01
2010
.05
2010
.09
2011
.01
2011
.05
2011
.09
2012
.01
2012
.05
2012
.09
2013
.01
2013
.05
2013
.09
2014
.01
2014
.05
2014
.09
2015
.01
Months' Supply of Homes for Sale Existing New

© 2015 Move, Inc. All rights reserved. Do not copy or distribute.
NEW CONSTRUCTION SLOW AGAIN Another harsh winter but strong 20% rebound in April
7
Source: Commerce Department
0
500
1000
1500
2000
2500
Residential Construction Single-Family Starts Multi-Family Starts

© 2015 Move, Inc. All rights reserved. Do not copy or distribute.
HOMEOWNERSHIP STILL FALLING Households growing again but with more renters
8
Source: Census Bureau
60.0
61.0
62.0
63.0
64.0
65.0
66.0
67.0
68.0
69.0
70.0
90,000
95,000
100,000
105,000
110,000
115,000
120,000
Households and Home Ownership Households Home Ownership Rate

© 2015 Move, Inc. All rights reserved. Do not copy or distribute.
INVENTORY IS TIGHT Age of inventory consistently lower year-over-year
9
0
20
40
60
80
100
120
-
500,000
1,000,000
1,500,000
2,000,000
2,500,000
Listings and Median Age of Inventory Listings Median Age of Inventory
Source: Realtor.com®

© 2015 Move, Inc. All rights reserved. Do not copy or distribute.
ASKING PRICES AND RENTS UP Rents and home prices both accelerating growth this year
10
Source: Realtor.com® and Altos Research
$1,350
$1,400
$1,450
$1,500
$1,550
$1,600
$1,650
$1,700
$1,750
160000
170000
180000
190000
200000
210000
220000
230000
National Home Price and Rent Trends Median Existing List Price Median Asking Rent
© 2015 Move, Inc. All rights reserved. Do not copy or distribute. 11
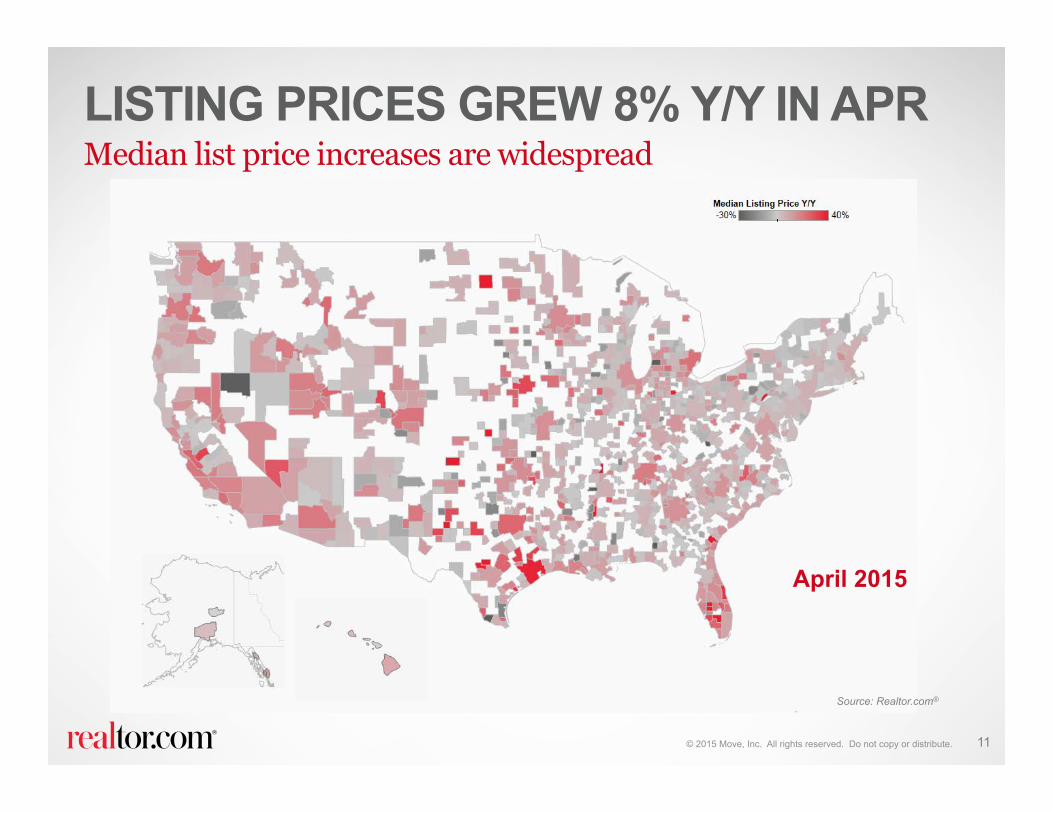
LISTING PRICES GREW 8% Y/Y IN APR Median list price increases are widespread
April 2015
Source: Realtor.com®
© 2015 Move, Inc. All rights reserved. Do not copy or distribute. 12
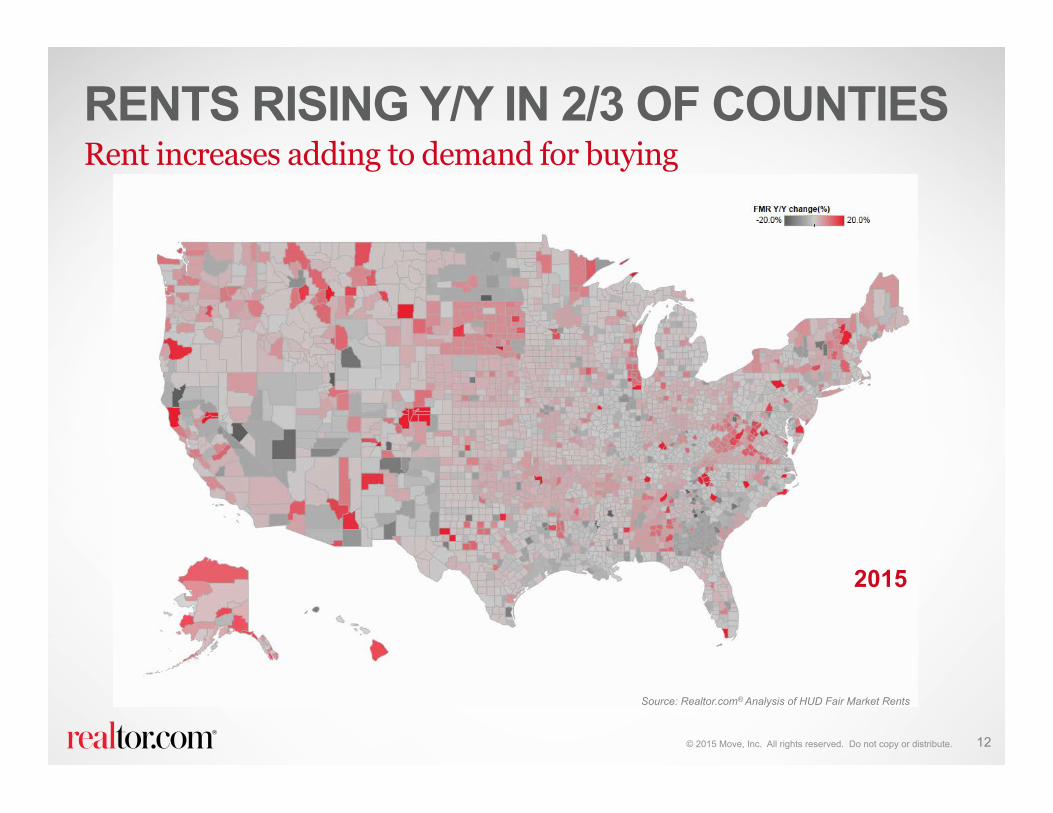
RENTS RISING Y/Y IN 2/3 OF COUNTIES Rent increases adding to demand for buying
2015
Source: Realtor.com® Analysis of HUD Fair Market Rents

© 2015 Move, Inc. All rights reserved. Do not copy or distribute.
AFFORDABILITY REMAINS STRONG Low rates have enabled purchasing power but now weakening
13
0.0
50.0
100.0
150.0
200.0
250.0
$0
$10,000
$20,000
$30,000
$40,000
$50,000
$60,000
$70,000
2000
.01
2000
.05
2000
.09
2001
.01
2001
.05
2001
.09
2002
.01
2002
.05
2002
.09
2003
.01
2003
.05
2003
.09
2004
.01
2004
.05
2004
.09
2005
.01
2005
.05
2005
.09
2006
.01
2006
.05
2006
.09
2007
.01
2007
.05
2007
.09
2008
.01
2008
.05
2008
.09
2009
.01
2009
.05
2009
.09
2010
.01
2010
.05
2010
.09
2011
.01
2011
.05
2011
.09
2012
.01
2012
.05
2012
.09
2013
.01
2013
.05
2013
.09
2014
.01
2014
.05
2014
.09
2015
.01
Income and Affordability Median Family Income Affordability Index
Source: Commerce Department and National Association of REALTORS®
© 2015 Move, Inc. All rights reserved. Do not copy or distribute. 14
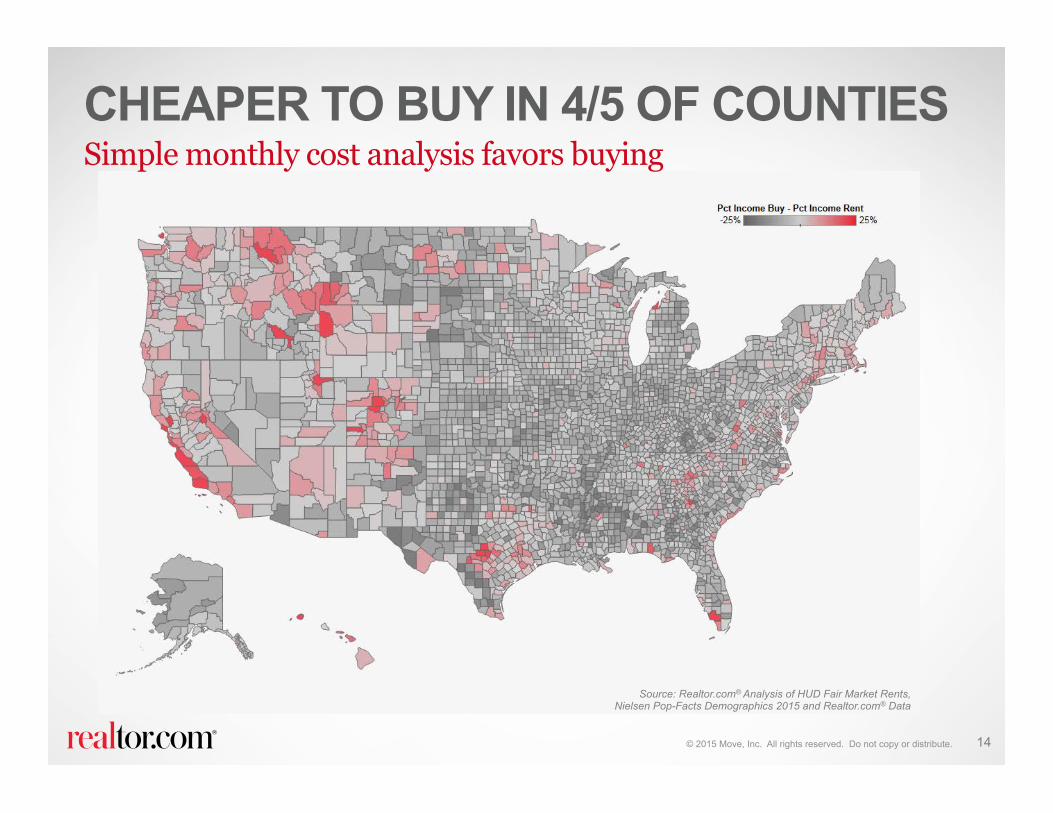
CHEAPER TO BUY IN 4/5 OF COUNTIES Simple monthly cost analysis favors buying
Source: Realtor.com® Analysis of HUD Fair Market Rents, Nielsen Pop-Facts Demographics 2015 and Realtor.com® Data

© 2015 Move, Inc. All rights reserved. Do not copy or distribute. 15
HOME OWNERSHIP BUILDS WEALTH Over 30 years, buying now would create over $200k on average
Realtor.com®

© 2015 Move, Inc. All rights reserved. Do not copy or distribute.
INCREDIBLE RATES REMAIN Last call for a once-in-a-lifetime opportunity
16
Source: Freddie Mac
0.00
1.00
2.00
3.00
4.00
5.00
6.00
7.00
8.00
9.00
Published Mortgage Rates
30 yr Fixed 1 Yr Adj

© 2015 Move, Inc. All rights reserved. Do not copy or distribute. 17
DEMAND DRIVERS

© 2015 Move, Inc. All rights reserved. Do not copy or distribute. 18
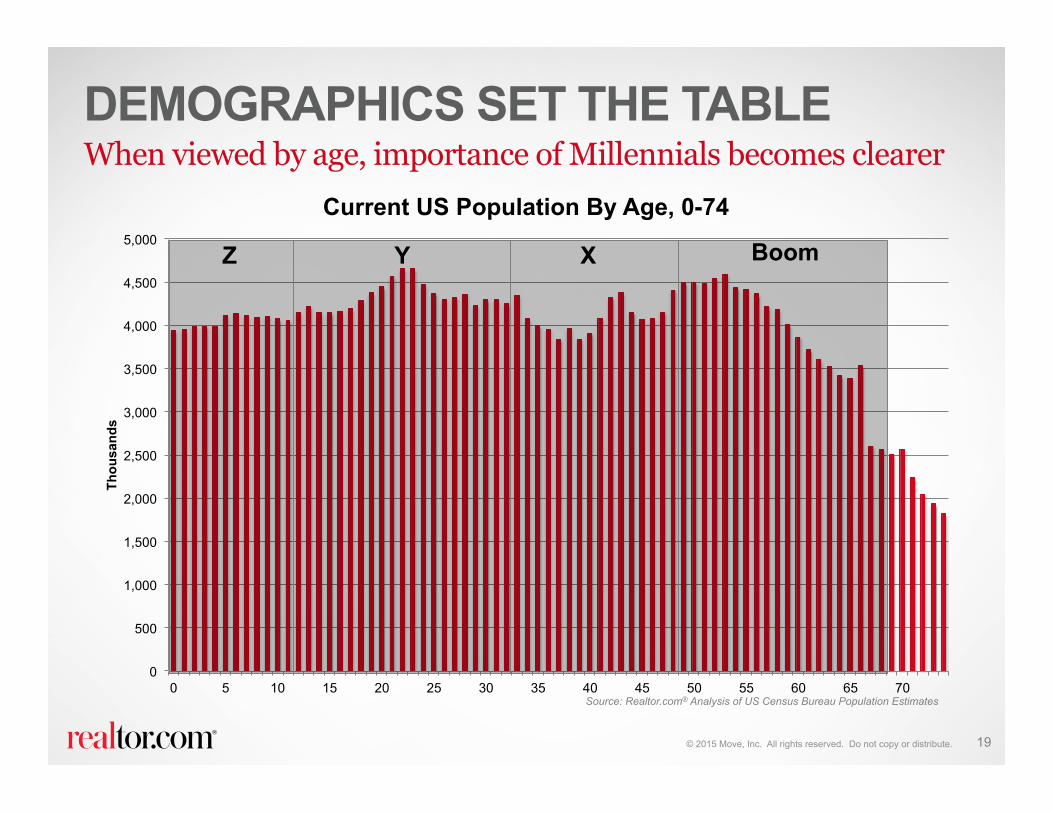
DEMOGRAPHICS SET THE TABLE Population and its composition define the future
0
500,000
1,000,000
1,500,000
2,000,000
2,500,000
3,000,000
3,500,000
4,000,000
4,500,000
5,000,000
US Live Births by Year and Generation
Boom X Y Z
Source: Realtor.com® Analysis of US National Center for Health Statistics
© 2015 Move, Inc. All rights reserved. Do not copy or distribute.
0
500
1,000
1,500
2,000
2,500
3,000
3,500
4,000
4,500
5,000
0 5 10 15 20 25 30 35 40 45 50 55 60 65 70
Thou
sand
s
Current US Population By Age, 0-74
19
DEMOGRAPHICS SET THE TABLE When viewed by age, importance of Millennials becomes clearer
Source: Realtor.com® Analysis of US Census Bureau Population Estimates
Boom X Y Z
© 2015 Move, Inc. All rights reserved. Do not copy or distribute.
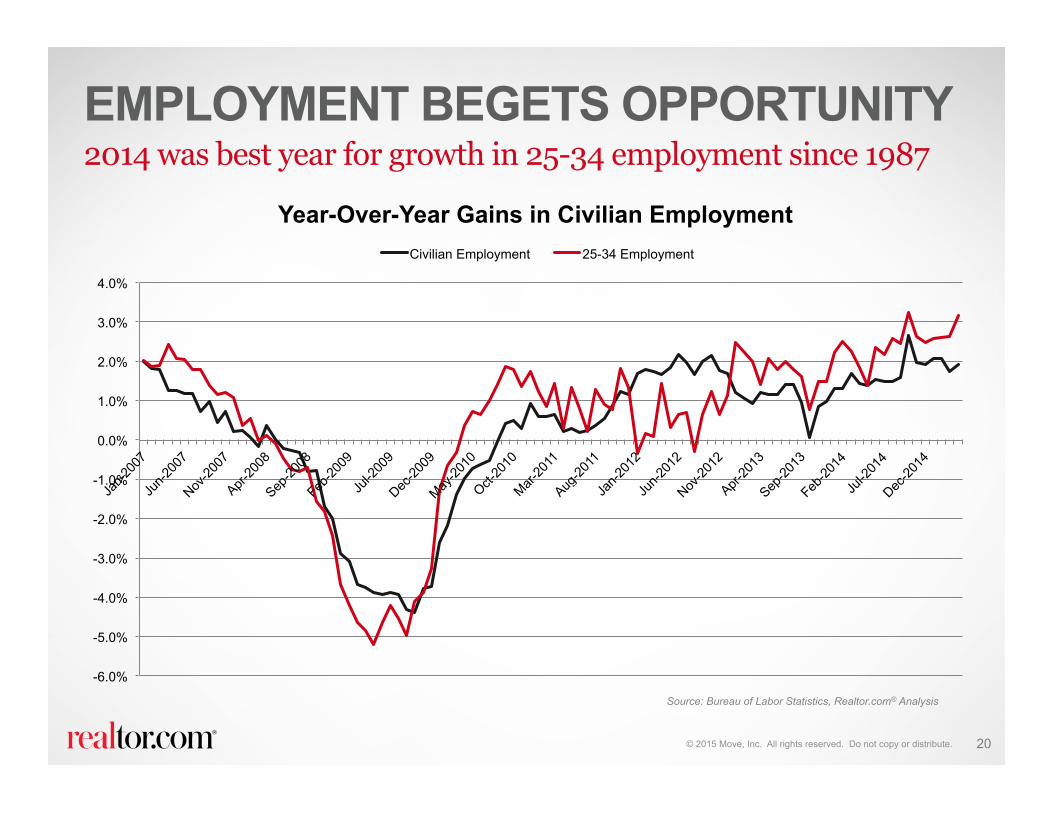
EMPLOYMENT BEGETS OPPORTUNITY 2014 was best year for growth in 25-34 employment since 1987
20
26%
13%
33%
30%
25%
13%
32%
Source: Bureau of Labor Statistics, Realtor.com® Analysis
-6.0%
-5.0%
-4.0%
-3.0%
-2.0%
-1.0%
0.0%
1.0%
2.0%
3.0%
4.0%
Year-Over-Year Gains in Civilian Employment Civilian Employment 25-34 Employment

© 2015 Move, Inc. All rights reserved. Do not copy or distribute. 21
MILLENNIAL OWNERSHIP VARIES Strong correlation with affordable markets
Source: Nielsen Demographics PopFacts 2015, Realtor.com® Analysis

© 2015 Move, Inc. All rights reserved. Do not copy or distribute. 22
LIFE DRIVES HOUSING DEMAND Millennial are building families
26%
13%
33%
30%
25%
13%
32%
Source: BDX June 2014 Home Shopper Study
13
14
15
15
16
17
25
26
15
31
17
17
18
19
23
28
30
30
32
32
0% 25% 50%
Desire to live closer to good schools
Change of job/job location
Increase in family size
Getting married/moving in with partner
Increasing rent
Increase in income
Favorable home prices
Favorable interest rates
Planning to increase to family size
Tired of current home
% of respondents
Top 10 millennial triggers
86% of Millennial shoppers indicate
some form of change in family size* as a trigger
*Change in Family Size includes: Change of family circumstances/composition, Increase in family size, Decrease in family size, Planning to increase family size, upcoming decrease in family size, older parent moving into my home, getting married/moving in with partner.
ALL MILLENNIAL

© 2015 Move, Inc. All rights reserved. Do not copy or distribute. 23
BOOMERS KEEP DISTURBING Boomer wave is causing a major population shift
0
50,000,000
100,000,000
150,000,000
200,000,000
250,000,000
300,000,000
350,000,000
2015 2020
Population by Age (United States) Under 25 25-34 35-54 55+
Over the next 5 years:
Population grows 4%
55+ grows 12%
35-54 declines 1%
25-34 grows 1%
Under 25 grows 1%
27%
26%
13%
33%
30%
25%
13%
32%
Source: Nielsen Demographics Pop-Facts 2015

© 2015 Move, Inc. All rights reserved. Do not copy or distribute. 24
WE COULD DO MORE

© 2015 Move, Inc. All rights reserved. Do not copy or distribute.
ACCESS TO CREDIT REMAINS AN ISSUE Mortgage access up 7% year-over-year in April
25
26%
13%
33%
30%
25%
13%
32%
Source: Mortgage Bankers Association, Haver Analytics
0
100
200
300
400
500
600
700
800
900
1000
Mortgage Credit Availability Index Mar-2012=100

© 2015 Move, Inc. All rights reserved. Do not copy or distribute. 26
CREDIT ACCESS HAS BEEN A PROBLEM In April the average FICO score on a closed mortgage loan was 729; the average denied score fell to 674
26%
13%
33%
30%
25%
13%
32%
Source: Ellie Mae and Fair Isaac Corporation
300-499 5.8 500-549
8.4
550-599 9.8
600-649 10.2
650-699 12.7 700-749
16.3
750-799 18.4
800-850 18.6
FICO Population Distribution (2013)
300
350
400
450
500
550
600
650
700
750
800
2011
.08
2011
.10
2011
.12
2012
.02
2012
.04
2012
.06
2012
.08
2012
.10
2012
.12
2013
.02
2013
.04
2013
.06
2013
.08
2013
.10
2013
.12
2014
.02
2014
.04
2014
.06
2014
.08
2014
.10
2014
.12
2015
.02
2015
.04
Average FICO Score by Closed and Denied Applications
Closed Denied 2013 Median FICO (711)

© 2015 Move, Inc. All rights reserved. Do not copy or distribute.
• More jobs • Millennials reaching tipping point of key 25-34 year range • More households • More life events
• Mortgage rates on the move up from historic lows • Qualification standards should loosen in a risk-appropriate way • New conventional 3% down payment mortgages • Lower FHA insurance premiums
• This is the perfect year to list
27
KEY FACTORS COMING TOGETHER More demand and recovery in first-time buyers

© 2015 Move, Inc. All rights reserved. Do not copy or distribute.
2015 OFF TO A STRONG START Traffic up to 15% over April 2015; 21-34 year olds up 32%
28
26%
13%
33%
30%
25%
13%
32%
Source: Realtor.com® Analysis of comScore Media Metrix® Real Estate Category Unique Visitor Data
0
20,000
40,000
60,000
80,000
100,000
120,000
0
5,000
10,000
15,000
20,000
25,000
30,000
35,000
40,000
45,000
Thou
sand
s
Thou
sand
s
Real Estate Web Unique Visitors by Age 21-34 35-54 55+ All Traffic (Right Axis)
32% of 55+, 50% of 35-54, and 62% of 21-34 in April

© 2015 Move, Inc. All rights reserved. Do not copy or distribute.
IMPEDIMENTS TO PURCHASE Biggest issues are supply, time and down payment
29
26%
13%
33%
30%
25%
13%
32%
Source: Realtor.com Survey of Buyer Traffic, April 2015
0% 5% 10% 15% 20% 25% 30% 35% 40% 45%
Have not yet found a house that meets my needs
Cannot find a good house in my budget range
Always overbid by other buyers
Just starting to explore
Haven't decided on a specific neighborhood/town
Need to improve credit score
Lack enough funds for down payment
I owe more on my current home than it is worth
Can't sell current home
Currently on a lease
Having difficulty qualifying for a mortgage
What's Getting in the Way of Making a Home Purchase? Repeat First-Time All Buyers

© 2015 Move, Inc. All rights reserved. Do not copy or distribute. 30
REMEMBER THESE THEMES
1. Mortgage rates and home prices are solidly on an upward trajectory
2. Affordability and impact of mortgage options will greatly influence demand
3. Behold the enormous impact of Millennials and Boomers and what that means for demand
4. The real estate market is returning to a normal rhythm—life drives demand but supply impacts the results

© 2015 Move, Inc. All rights reserved. Do not copy or distribute. 31
THERE IS NO SUCH THING AS A US HOUSING MARKET

© 2015 Move, Inc. All rights reserved. Do not copy or distribute.
EVEN MORTGAGE RATES VARY Pennsylvania Close to National Averages
32
Source: Realtor.com

© 2015 Move, Inc. All rights reserved. Do not copy or distribute.
JOBS RECOVERED Unemployment rate back down and better than US overall
33
Source: BLS, Moody’s Analytics
0.00
1.00
2.00
3.00
4.00
5.00
6.00
7.00
8.00
9.00
10.00
5,400,000
5,450,000
5,500,000
5,550,000
5,600,000
5,650,000
5,700,000
5,750,000
5,800,000
5,850,000
5,900,000
Jan-
00
Jun-
00
Nov
-00
Apr
-01
Sep
-01
Feb-
02
Jul-0
2 D
ec-0
2 M
ay-0
3 O
ct-0
3 M
ar-0
4 A
ug-0
4 Ja
n-05
Ju
n-05
N
ov-0
5 A
pr-0
6 S
ep-0
6 Fe
b-07
Ju
l-07
Dec
-07
May
-08
Oct
-08
Mar
-09
Aug
-09
Jan-
10
Jun-
10
Nov
-10
Apr
-11
Sep
-11
Feb-
12
Jul-1
2 D
ec-1
2 M
ay-1
3 O
ct-1
3 M
ar-1
4 A
ug-1
4 Ja
n-15
Pennsylvania Employment and Unemployment Rate Non-Farm Employment (SA) Unemployment Rate (%, SA)

© 2015 Move, Inc. All rights reserved. Do not copy or distribute.
PRICES NEARLY RECOVERED Existing home prices near peak but affordability remains strong
34
Source: National Association of Realtors®, Moody’s Analytics
0
50
100
150
200
250
300
$0
$20,000
$40,000
$60,000
$80,000
$100,000
$120,000
$140,000
$160,000
$180,000
Existing Home Prices and Affordability Median Existing Home Price Affordability Index
© 2015 Move, Inc. All rights reserved. Do not copy or distribute.
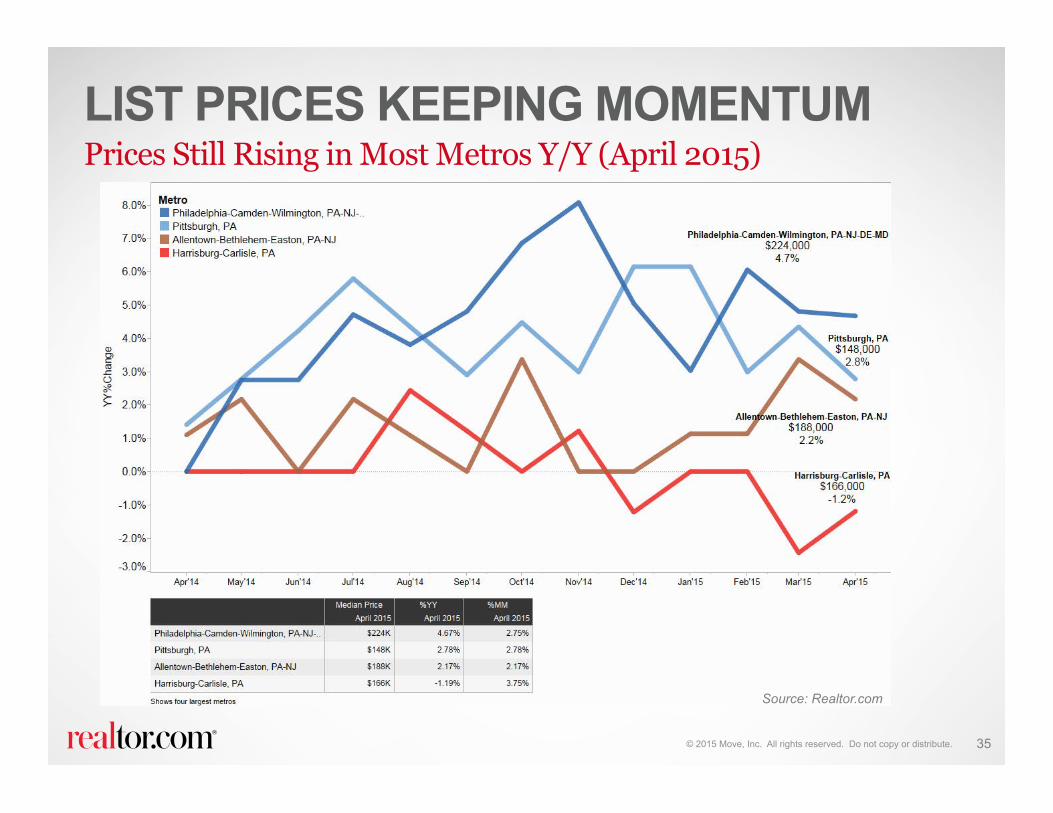
LIST PRICES KEEPING MOMENTUM Prices Still Rising in Most Metros Y/Y (April 2015)
35
Source: Realtor.com

© 2015 Move, Inc. All rights reserved. Do not copy or distribute.
Y/Y PRICE VARIATION IN APRIL Top Metros Experiencing Growth Y/Y (April 2015)
36
Source: Realtor.com

© 2015 Move, Inc. All rights reserved. Do not copy or distribute.
FOCUS ON HARRISBURG Wide Variation in Y/Y Price Growth (April 2015)
37
Source: Realtor.com

© 2015 Move, Inc. All rights reserved. Do not copy or distribute.
INVENTORY STILL TIGHT Only Pittsburgh Metro is Seeing Y/Y Growth (April 2015)
38
Source: Realtor.com

© 2015 Move, Inc. All rights reserved. Do not copy or distribute.
TWO METROS DOMINATE INVENTORY Half of Active Inventory in Pittsburgh/Philly (April 2015)
39
Source: Realtor.com

© 2015 Move, Inc. All rights reserved. Do not copy or distribute.
AGE OF INVENTORY Inventory Moving Faster and Faster (April 2015)
40

© 2015 Move, Inc. All rights reserved. Do not copy or distribute.
FOCUS ON HARRISBURG Median Age in Harrisburg Metro is 80 Days (April 2015)
41

© 2015 Move, Inc. All rights reserved. Do not copy or distribute.
PENNSYLVANIA INTEREST BY ZIP Most Viewed Zips YTD 2015
42
Source: Realtor.com

© 2015 Move, Inc. All rights reserved. Do not copy or distribute.
HOTTEST ZIPS YEAR-TO-DATE 2015 Adjusting Interest by Household Count
43

© 2015 Move, Inc. All rights reserved. Do not copy or distribute.
HARRISBURG HOTTEST ZIPS YTD Where Interest Outpaces Size
44
Source: Realtor.com

© 2015 Move, Inc. All rights reserved. Do not copy or distribute.
HOTTEST HOMES MAY 2015 60 of the Top 300 Hottest Listings are in Pennsylvania
45

© 2015 Move, Inc. All rights reserved. Do not copy or distribute.
HOTTEST HOMES MAY 2015 Five of the Top 300 Hottest Listings are in Harrisburg
46
Source: Realtor.com

© 2015 Move, Inc. All rights reserved. Do not copy or distribute.
RENT PRICES STABLE Rents Virtually Flat Year-Over-Year in 2/3 Counties
47
Source: Realtor.com® Analysis of HUD Fair Market Rents

© 2015 Move, Inc. All rights reserved. Do not copy or distribute.
CHEAPER TO BUY IN 4/5 COUNTIES Relative to Income, Monthly Costs Favor Buying
48
Source: Realtor.com® Analysis of Nielsen Pop-Facts Demographics, HUD Fair Market Rents and Realtor.com Data

© 2015 Move, Inc. All rights reserved. Do not copy or distribute.
OLDER SHIFT IN PENNSYLVANIA TOO Population growth because of Boomers and Millennials only
49
Source: Nielsen Demographics Pop-Facts 2015
0
2,000,000
4,000,000
6,000,000
8,000,000
10,000,000
12,000,000
14,000,000
2015 2020
Population by Age (Pennsylvania) Under 25 25-34 35-54 55+
27%
26%
13%
33%
30%
25%
13%
32%
Over the next 5 years:
Population grows 1%
55+ grows 9%
35-54 declines 6%
25-34 grows 1%
Under 25 declines 2%

© 2015 Move, Inc. All rights reserved. Do not copy or distribute.
HOME OWNERSHIP IS STRONG Ownership Rate in PA (70%) is 5% higher than US average (64%)
50
Source: Nielsen Demographics Pop-Facts 2015

© 2015 Move, Inc. All rights reserved. Do not copy or distribute.
MILLENNIAL OWNERSHIP Ownership Rate (46%) also 5% higher than US average (41%)
51
Source: Nielsen Demographics Pop-Facts 2015

© 2015 Move, Inc. All rights reserved. Do not copy or distribute.
HOUSEHOLD GROWTH 2015-2020 Growth hot spots throughout the state
52
Source: Nielsen Demographics Pop-Facts 2015
© 2015 Move, Inc. All rights reserved. Do not copy or distribute.
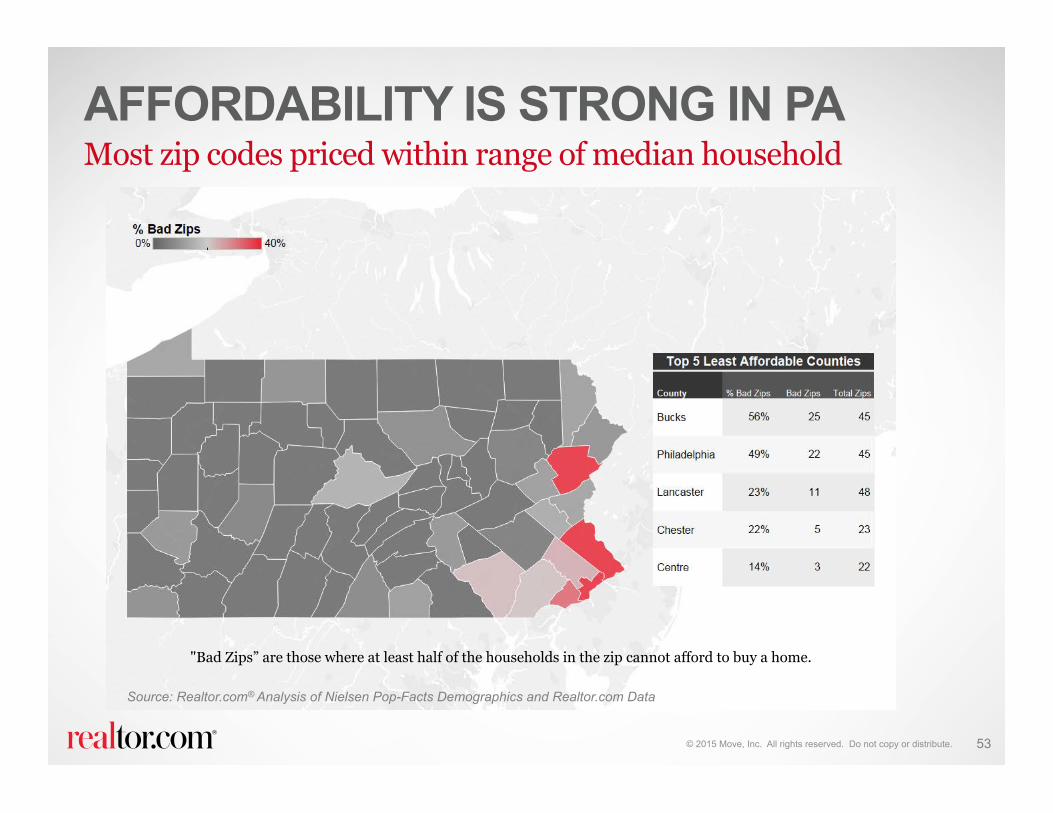
AFFORDABILITY IS STRONG IN PA Most zip codes priced within range of median household
53
"Bad Zips” are those where at least half of the households in the zip cannot afford to buy a home.
Source: Realtor.com® Analysis of Nielsen Pop-Facts Demographics and Realtor.com Data
© 2015 Move, Inc. All rights reserved. Do not copy or distribute.
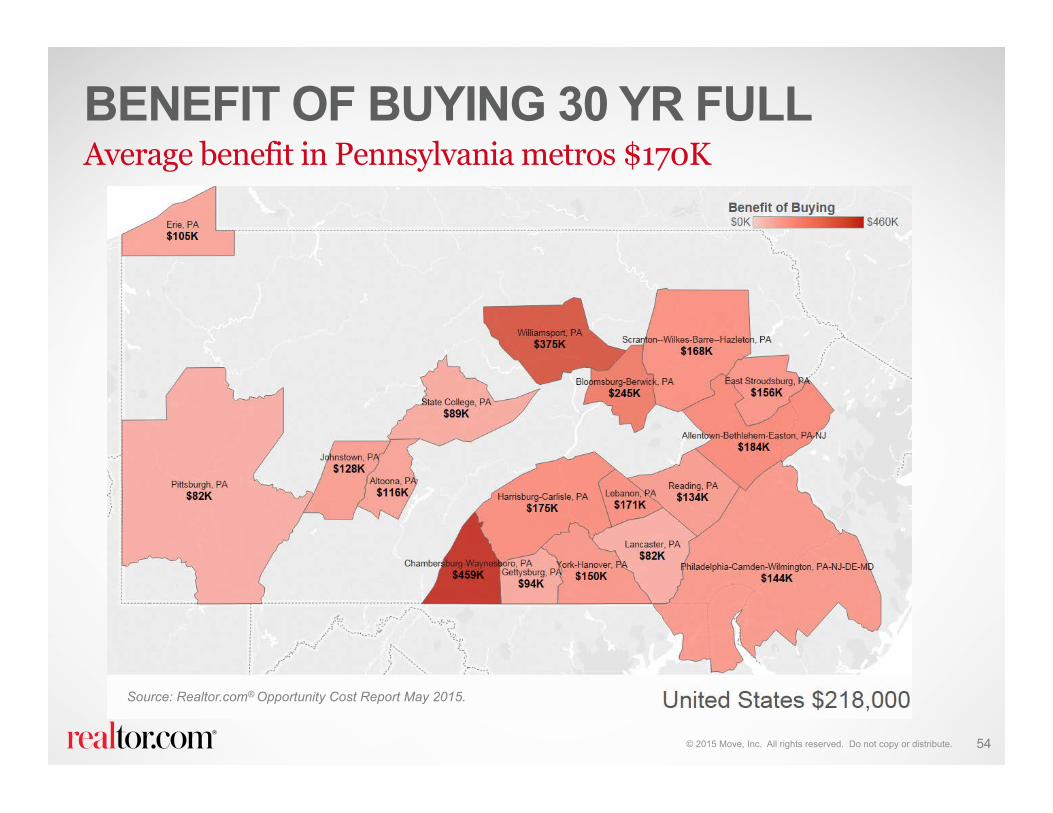
BENEFIT OF BUYING 30 YR FULL Average benefit in Pennsylvania metros $170K
54
Source: Realtor.com® Opportunity Cost Report May 2015.

© 2015 Move, Inc. All rights reserved. Do not copy or distribute.
OPPORTUNITY COST FOR DELAY 1 YR Average opportunity cost in Pennsylvania metros $13K
55
Source: Realtor.com® Opportunity Cost Report May 2015.

© 2015 Move, Inc. All rights reserved. Do not copy or distribute.
• GDP grows 2.6% • Payroll growth of 3 million jobs • 1.3 million household formations
• Home prices appreciate 5.4% on median existing home price • Existing home sales grow 6% to 5. 2 million • New home sales grow 18% to 516,000 • Housing starts increase 14% to 1.14 million • 30-year fixed rate ends year at 4.45%
• Affordability declines 4%
56
REALTOR.COM® 2015 FORECAST Key economic and housing metrics

© 2015 Move, Inc. All rights reserved. Do not copy or distribute. 57
Jonathan Smoke Chief Economist
realtor.com® [email protected]
@SmokeonHousing 703.634.9193

THANK YOU
© 2015 Move, Inc. All rights reserved. Do not copy or distribute. 58