manuscript final - aberdeen university research archive
TRANSCRIPT

1
A comparison of cortical and trabecular bone from
C57 Black 6 mice using Raman spectroscopy
Simon R Goodyear1, Iain R Gibson
2, 3, Janet M S Skakle
3, Richard P K Wells
3, Richard M
Aspden1
1 Bone and Musculoskeletal Programme, Division of Applied Medicine, University of
Aberdeen, United Kingdom
2 School of Medical Sciences, University of Aberdeen, United Kingdom
3 Department of Chemistry, University of Aberdeen, United Kingdom
Corresponding Author: Simon R Goodyear
Address: Bone and Musculoskeletal Programme
Division of Applied Medicine
University of Aberdeen
IMS 2.26
Foresterhill
Aberdeen
AB25 2ZD
Telephone Number: +44 (0)1224 554910
Fax Number: +44 (0)1224 559533
Email address: [email protected]

2
Abstract
Cortical and trabecular bone are both produced and maintained by the same cell types. At the
microscopic scale they have a similar lamellar structure but at a macroscopic scale they are
very different. Raman microscopy has been used to investigate compositional differences in
the two bone types using bone from standard laboratory mice in physiological conditions.
Clear differences were observed when complete spectra were compared by principal
component analysis (PCA). Analysis of individual bands showed cortical bone to have
compositional characteristics of older bone when compared with trabecular material, possibly
due to the higher bone turnover traditionally reported in the trabecular compartment.

3
Keywords
Cortical bone, trabecular bone, mouse, Raman spectroscopy, composition

4
Introduction
The mammalian skeleton contains two different forms of bone, cortical and trabecular.
Cortical, or compact, bone is found mainly in the shafts of long bones and accounts for
roughly 80% of bone mass [1]. Trabecular bone is found in vertebrae and the ends of long
bones and is, in contrast, a porous foam-like structure with voids filled with bone marrow.
Both bone types are created by osteoblasts and resorbed by osteoclasts, and the controlled
interaction of both cell types enables bone growth during development and damage repair at
maturity to maintain mechanical strength. A hierarchy of structures can be seen in cortical and
trabecular bone at successively smaller length scales (see e.g. [1,2] for further details). At the
macroscopic scale bone types appear vastly different with cortical bone comprising
cylindrical osteons (in mice the osteonal structure is not present and the cortex resembles a
“super osteon” as bone is not remodelled, probably because of its small size compared to
osteoclasts and osteoblasts [3]) and trabecular bone forming a lattice of plates and rods. In
contrast, both bone types appear very similar at the molecular scale, being composed of
mineralised collagen fibrils laid down with a preferred orientation in lamellae. Trabecular
bone with its large surface area is more metabolically active than cortical bone [4] and is the
type of bone in which the quickest response to external factors is seen. For instance, studies
have shown athletic training in rodents [5] and man [6], ovariectomy [7], cathepsin K
overexpression [8] and parathyroid hormone deficiency and excess [9] have a more
immediate effect in trabecular bone. In osteoporosis, a major disease of bone, fractures occur
mostly in the hip, wrist and spine, areas with a high trabecular bone content [10].
A number of studies have examined cortical and trabecular bone types using a variety of
methods. Gong et al. compared their compositions in mammals by ashing and found that ash
to organic fraction ratios were higher in cortical bone [11]; although cortical and trabecular
samples were taken from different anatomical sites in the animal and it is not clear how much

5
of the difference could be a site variation. Differences in the mineral content have been
measured in whole bone by micro-computed tomography [12] and X-ray diffraction, infra-red
(IR) spectroscopy and chemical means [13]. Both of these studies showed cortical bone to be
more mineralised than trabecular bone. A chemical technique, used to measure collagen
cross-linking in demineralised bone, showed cortical material to have more mature,
pyridinium type cross-links than trabecular bone [14]. The elastic properties of both bone
types have been measured using nanoindentation [15,16], acoustic microscopy [17] or both
[18], or back-calculated by comparing experimental results with finite element predictions
[19]. Generally, cortical bone has been found to have a greater modulus than trabecular
material. The picture is clouded, however, by orientation effects, with cortical bone being
stiffer longitudinally than transversely. To date the transverse modulus in a single trabecula
has not been measured because of difficulties due to its small size.
Raman microscopy provides a powerful way of determining the chemical properties of
materials with a spatial resolution approaching a micrometre. In bone this enables the study of
biologically relevant locations, structures and process on this scale, often difficult with
Fourier-transform infra-red spectroscopy (FTIR) because of the inferior resolution associated
with this technique [20-24]. As Raman is a scattering phenomenon it can be used in reflection
mode on solid samples. In contrast to FTIR, this technique is relatively insensitive to water,
allowing the analysis of fully hydrated samples, and its non-destructive nature means the
same sample can be examined using a variety of different techniques. A further advantage is
that it can simultaneously measure organic and mineral phases. The Raman signal, however,
depends not only on the composition but also the local orientation of fibres or crystals with
respect to a polarised illuminating source, making interpretation of spectra from bone more
complicated than from isotropic materials. Previous studies have used Raman
microspectroscopy to compare bone from wild type and knock out animals to determine the

6
effect of particular genes on bone e.g. [25,26], and to monitor the process of mineralisation in
osteoblasts over time both in vitro [27] and in vivo [28]. The effect of aging has been
investigated by observing changes in collagen band positions [29,30]. Lamellae in osteons
have been mapped by observing changes in the magnitude of the Amide I band [31] or from
measurements in two orthogonal planes in cortical bone [32]. Although cortical and trabecular
bone have been studied separately, there appears to have been no direct comparison between
them from closely related sites in the same animals. This study used Raman microscopy to
compare cortical and trabecular bone tissue from the same femur and tibia of standard
laboratory mice, C57 Black 6 (C57Bl6). To keep the bones in their physiological condition,
sample preparation was kept to a minimum and was restricted to soft tissue removal and
cutting to expose the cross section.
Materials and Methods
Materials
Cortical and trabecular samples were taken from the distal femur and proximal tibia from ten
5-month-old, male, C57Bl6 mice. The bones had previously been broken in a 3-point bending
test and, because of difficulties holding the relevant section for cutting, samples were
obtained from 5 of the tibiae only. Skeletal maturity in terms of mechanical properties is
reached at about 4 months [33]. Following soft tissue removal, 1.5 mm long transverse
sections were cut using a mineralogical saw (Accutom 2, Struers, Glasgow) fitted with an
aluminium oxide cut-off wheel under constant irrigation with distilled water. Slices were then
glued to a microscope slide with cyanoacrylate adhesive (Locktite) for acquiring spectra.
Slides were kept submerged in phosphate buffered saline (PBS) prior to and during testing.

7
Raman microscopy
A Renishaw inVia microscope (Renishaw plc, Gloucestershire, UK) fitted with a 300 mW,
785 nm laser and x63/0.95 numerical aperture Achroplan immersion objective lens (Zeiss)
was used to acquire spectra from the submerged bone samples. At the beginning of each
imaging session the laser was checked for alignment with the optical axis of the microscope
and the wavenumber datum verified against a silicon internal standard. Care was also taken to
ensure that the silicon band intensity was the same each time, thus ensuring comparability of
spectral intensities. Data were recorded between 300 and 1800 cm-1
at a resolution of better
than 4 cm-1
. Between 10 and 40 spectra were recorded from random sites on each sample.
Each spectrum was the result of 10 accumulations each with a 10 second exposure time. The
spectra from each bone sample were averaged to give a representative spectrum for that bone.
In cortical regions spectra were taken at spots around the whole circumference of the bone
and averaged, effectively removing any orientation effect due to the preferred orientation of
either collagen or apatite and the polarisation vector of the incident laser beam. Spectra from
trabecular bone were acquired from a number of locations within the field of view however
the orientation of lamellae could not be discerned so it is possible some orientation bias
remained after averaging.
Preprocessing
Cosmic ray artefacts were removed manually from each spectrum using WIRE 2.0 software
(Renishaw plc, Gloucestershire, UK). Noise was removed using a wavelet technique [34,35]
and the underlying background signal subtracted from each spectrum using an iteratively
fitted polynomial [36]. Preprocessing was performed using custom written procedures in
Matlab (the Mathworks, Inc., Natick, MA, USA). Both peak heights and peak areas were

8
calculated but the analysis showed no difference in the results. We chose then to present only
the heights as these were simpler to derive, and there is precedence in the literature {{}}.
Spectra were then analysed in 3 different ways: by direct comparison between spectra from
cortical and trabecular bone, by comparison of parameters derived from peak intensities and,
finally, using principal components analysis (PCA). At no point were the spectra normalised.
Difference spectra
Average spectra were calculated for each bone type by summing all the spectra (e.g. for
trabecular bone) and dividing by the number of spectra for that type of bone. A difference
spectrum was found by subtracting the intensity of the trabecular spectrum from the cortical
spectrum at each wave number. The significance of any difference was determined by
comparing the average spectra from cortical and trabecular bone using Student’s t-test.
Peak Parameters
A typical spectrum from bone is shown in Figure 1 with the relevant band assignments
marked. The band at 961 cm-1
corresponds to the symmetric stretching vibration (v1) of the
phosphate ion and is the strongest marker of bone mineral. The phosphate bending vibrations
v2 and v4 appear at 438 cm-1
and 589 cm-1
respectively while the non symmetric stretch (v3)
causes a band at about 1040 cm-1
. A peak due to a superposition of carbonate and phosphate
v3 appears at 1070 cm-1
. The high frequency peaks arise from the organic phase and these are
the amide III (~1260 cm-1
) and amide I (~1680 cm-1
) peaks, which arise largely from the
collagen [37], and the CH2 peak which is present in both collagenous and non-collagenous
organic molecules. Bone is laid down in lamellae, in both cortical and trabecular bone, and
within each lamella collagen fibrils are partially aligned with the direction of preferred
orientation usually at angle to the bone or trabecular axis [2]. The triple helical arrangement
of the collagen molecule constrains the positions of the amide bonds with respect to the

9
molecular axis. Within this bond the chemical groups contributing to the Amide I band
(predominantly C=O) lie in a plane perpendicular to the molecular axis, while those
contributing to the Amide III band (mostly C-N) are both perpendicular and along this axis.
Mineral crystals are found within the collagen matrix with their crystallographic c-axis
aligned with the collagen fibres [2]. It has been shown that the maximum Raman signal is
produced when the polarisation of the exciting radiation is parallel with this axis [38].
Our experimental arrangement may result in trabecular samples having a preferred orientation
with respect to the incident laser beam. This factor can influence the intensity of a Raman
signal in addition to any compositional affect. We have used a method derived from the
published literature [39] to reduce the effect of orientation so we could attribute any
difference between readings from cortical and trabecular bone to differences in composition.
The intensity of the phosphate v4 peak was taken as an indicator of mineral content, in
preference to any of the other phosphate bands, as it has been shown to be less susceptible to
orientation effects [39] and as an asymmetric bend it is less affected by polarisation [40]. For
similar reasons the Amide III peak was used as a measure of collagen content [39]. The
mineral to matrix ratio was calculated from the intensity of the phosphate v4 (mineral) peak
divided by Amide III (matrix) peak. While the peak at 1070 cm-1
is a formed by contributions
from both carbonate and phosphate v3, it has been shown to be a good measure of the
carbonate content of bone [58]. The carbonate to phosphate ratio was, therefore, calculated by
dividing the value from the carbonate peak (1070 cm-1
) by the phosphate v4 peak and the
relative amount of HPO42-
by dividing the amplitude of this peak (1003 cm-1
) by that of the
phosphate v4 peak [37]. Values for the intensity of the carbonate and HPO42-
peaks were
found by curve fitting to remove any possible contribution from the phosphate v1 (960 cm-1
)
and v3 (1040 cm-1
) bands. Two peaks can be fitted to the Amide I band, each indicative of a
different secondary structure within the collagen matrix. The ratio of these two peaks gives an

10
indication of the abundance of each structure. In FTIR spectroscopy, this ratio has been
shown to give a measure of mature, trivalent bonds compared with the immature, divalent
variety [41] while others have used it to show the change in collagen structure following
loading beyond the yield point in a Raman experiment [20]. As bone matures so the size of
the individual mineral crystals increases, contributing to a narrower, more intense v1 peak,
while at the same time increased substitutions into the crystal lattice by carbonate and other
ions reduce the purity of the crystal so reducing the peak height and increasing its width. The
full width at half maximum height of this peak taken together with the degree of substitution
values (carbonate to phosphate ratio) give an indication of the degree of crystallinity of the
mineral part of the bone [42].
Principal component analysis
Spectra were presented for PCA following background subtraction and removal of
wavenumbers with an average intensity remaining of less than 100 counts. Deleting these
regions has no effect on peaks associated with bone. The components or variables generated
from the PCA are common to femur and tibia as well as cortical and trabecular bone. After
reference to a scree plot [43] scores for the first 6 coefficients from cortical and trabecular
bone were then compared using Student’s t-test as described below.
Statistics
Data were found to be normally distributed (P>0.05 from Kolmogorov-Smirnov test) so mean
values from each parameter were compared using 2-way ANOVA using bone type
(cortical/trabecular) and sample origin (femur/tibia) as the two independent variables. No
interaction was found between these variables so results from femur and tibia were analyzed
separately using Student’s t-tests. Due to the different number of spectra recorded from each
sample a weighted comparison of means was used to calculate the P-value [44]. Results were

11
considered significant if P<0.05. A custom script was written in Matlab (R2006b, the
MathWorks, Inc) to perform t-tests and Sigmastat (Version 3.5, Systat Software Inc.) was
used for other tests.
Results
Difference spectra
Plots of the average spectra from cortical and trabecular bone from femur and tibia are shown
together with their difference (Figure 2). For the femur the intensity of the signal coming from
trabecular bone (maximum v1 7400) was larger than that from the cortex (maximum v1 5800)
(Figure 2A) and the difference was negative over the whole spectrum (Figure 2E). This
difference was not statistically significant in any regions corresponding to major peaks
(Figure 2B). In the tibia this pattern was reversed; trabecular bone had a maximum signal for
v1 of 9900 compared with v1 of 16200 from the cortical bone (Figure 2C), so the difference
was positive (Figure 2E). Overall, the magnitude of the difference in the tibia was about 3
times that seen in the femur and was significant (P < 0.05) at almost all wave numbers (Figure
2D).
Peak parameters
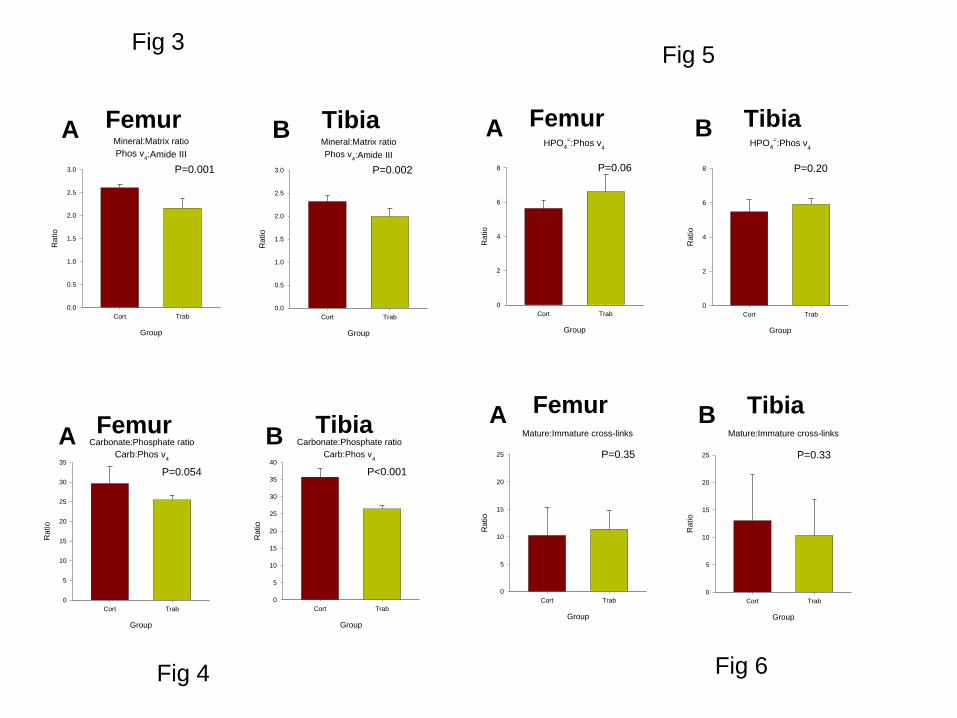
The mineral to matrix ratio (phosphate v4/Amide III) was significantly greater in cortical bone
than in trabecular bone for both the femur (P=0.001) and the tibia (P=0.002) (Figures 3A and
3B, respectively). The carbonate to phosphate ratio was also greater in cortical than trabecular
bone (Figure 4). The difference was significant in tibia (P<0.001), while in femur the
significance reached P=0.054, marginally outside the traditional threshold. The ratio of
hydrogen phosphate to phosphate was bigger in trabecular bone in both femur and tibia
although the difference was not significant (Figure 5). There were no significant differences
in the ratio of intensities of peaks fitted within the amide I band (Figure 6) or the FWHM of

12
the phosphate v1 peak (Figure 7) between cortical and trabecular bone, in either the femur or
the tibia.
PCA
The first principal component (PC) (Figure 8) accounted for 99% of the variance within the
data. It corresponds very closely with a Raman spectrum from bone. Scores from this
component from cortical and trabecular bone were significantly different in tibia (25200 and -
900, P=0.01) but not in femur (-16800 and -10500, P=0.27).
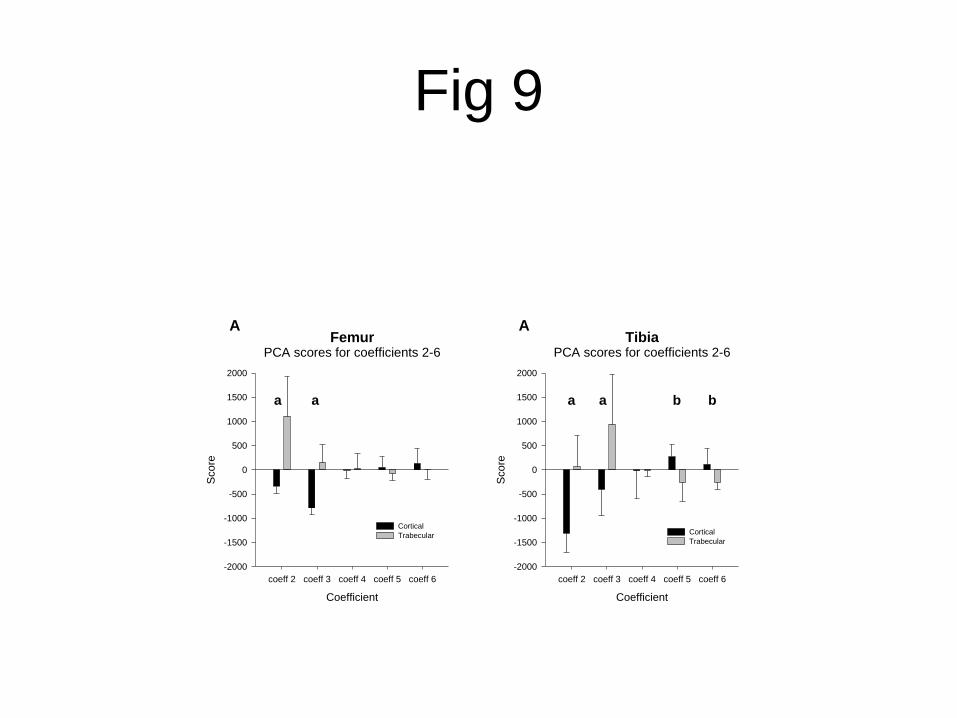
Average scores for PCs 2-6 are displayed in Figure 9. Scores for PCs 2 and 3 for trabecular
bone were positive and significantly (P<0.01) different from those from cortical bone, which
were negative, in both femur and tibia. The position was reversed for PCs 5 and 6 where the
scores for trabecular bone were negative while those from cortical bone were positive,
although this difference was only significant (P<0.05) in tibia but not in femur. The PCs
mentioned are plotted in Figure 10 below and show where the main differences lie in relation
to a typical bone spectrum.
Discussion
Raman microscopy has been used to investigate the differences in bone chemistry between
cortical and trabecular bone from C57Bl6 mice. Our results show the bone types are different,
with cortical bone being more mineralized and with a greater carbonate content. These
differences are consistent with cortical bone appearing “older” than trabecular material [45] as
traditionally believed from other studies of bone turnover (refs?)
The laser used for Raman excitation is linearly polarised. In addition, bone contains lamellae
which themselves contain oriented collagen fibres and mineral crystallites. This means that
many of the Raman bands are sensitive to the orientation of the sample with respect to the

13
polarisation of the beam. This has been almost unrecognised in the mineralised tissue
literature in spite of many publications investigating bone composition using a similar
experimental arrangement to ours. Because we recognised this issue late in our experimental
work and had not included polarising optics in the beam path, we tried to take steps to
minimise the effects by selecting bands that are reported to be least sensitive to polarisation
[39]. This is a complicated problem and a full treatment is beyond the scope of this article.
Difference
The intensity of a Raman signal is primarily due to the number of scattering centres excited
within the sample [46,47]. This can be affected by a number of factors including the
orientation of the molecules with respect to a polarised incident beam [39], the mode of
molecular vibration [40], and the presence of other atoms or scattering centres, though each of
these is likely to affect particular bands in the spectrum.
With the experimental arrangement used in this study, the sampling volume was full of bone
in all cases and care was taken to ensure that the laser intensity remained constant, as judged
by the silicon standard. If, therefore, the bone material was the same in all cases, a similar
signal intensity from both cortical and trabecular bone and from tibia and femur would be
expected. Having taken these precautions in the recording of the spectra, normalisation of the
spectra was not undertaken in order to obtain a direct measure of the composition of the bone
matrix in each type of bone in each of the femur and tibia.
The measured intensities and difference spectra above show some unexpected results: a
significantly larger signal was obtained from both the cortical and trabecular bone from the
tibia than the femur, with the biggest difference being found in cortical bone in which
approximately 3 times the signal was measured from the tibia than from the femur. Signal

14
from trabecular bone was similar in both femur and tibia. In the femur, the cortical signal was
slightly, but not significantly, smaller than that from trabecular bone, whereas in the tibia this
was reversed, with cortical bone yielding a much higher signal. Some of the difference may
be due to the different loading regimes experienced by the two bones (new ref?), although
there are likely to be other factors which are currently under investigation.
Band intensity parameters
Mineralization of the collagen matrix is reported to be a two stage process occurring outside
the osteoblast. An initial mineralisation phase of a few months is followed by a longer more
gradual phase resulting in fully mineralised bone [4]. As the mineralisation process proceeds
so the chemistry of the mineral alters with the carbonate content increasing and the
monohydrogen phosphate (HPO42-
) content decreasing [45,48]. An assessment of the relative
amounts of these materials - mineral to matrix ratio, carbonate to phosphate ratio, HPO42-
to
phosphate ratio – would give an indication of the age of the bone being investigated. The
intensity of any of the three phosphate peaks have been used widely as indicators of mineral
content in bone, while the Amide I or III bands are markers of collagen [20,37,49,50] (see
Figure 1 above). We have selected the phosphate v4 mode and the Amide III band because of
their insensitivity to orientation and polarisation effects [39,40]. The carbonate ion is a natural
part of bone mineral, substituting for hydroxide (A-type) and phosphate (B-type) [51,52].
Both types can be detected in a Raman spectrum of bone with B-type producing a band at
~1070 cm-1
and the A type a weak shoulder at ~1104 cm-1
[28] (see Figure 1). We have used
the B-type substitution as an indicator of carbonate content because of its association with
aging [45,48]. Our measure of mineral to matrix ratio shows cortical bone was more
mineralised than trabecular material, in agreement with other studies [11-13]. Taken with the
higher carbonate to phosphate ratio and lower HPO42-
to phosphate ratio we found in cortical

15
bone these results suggest cortical bone is older than trabecular material, a finding consistent
with the lower turnover of bone observed in the cortical compartment [53].
Comparing the intensity of the profiles fitted within the main bands of a Raman spectrum
yields further information about the nature of the collagen and mineral within the sample. For
example, the ratio of two profiles centred at 1670 and 1690 cm-1
fitted within the Amide I
band in an FTIR spectrum gives a measure of the degree of collagen cross-linking in the bone
[41] with an increase in the ratio indicative of a greater proportion of mature or trivalent
cross-links. Other authors have also used this measure in Raman spectroscopy [22,54,55]
although this has never been shown experimentally, so it is probably more accurate to
attribute the two peaks to different collagen secondary structures. Our investigation showed
no differences in the organisation of the mineral or matrix compartments of bone from
cortical and trabecular regions.
PCA
PCA assesses intensities at all wavenumbers simultaneously and generates ordered
components or variables that account for the variance within the data analysed. The first few
components describe the majority of the variance and so can be used instead of the original
variables (wavenumbers in this case) to analyse the data. Typically, of the order of ten new
variables, the modes of variation or principal components, are used to replace the vast number
of original variables. Due to the nature of PCA these new variables are orthogonal, or
independent. Each mode is assigned a score that describes the spectrum from each sample and
this smaller number of variables can be treated as any other data.
In this study, Coefficient 1 is very similar to a typical Raman spectrum from bone and the
score represents a signal magnitude for each sample. This arises because the data are not

16
normalised during analysis as described above. 99% of the variance is explained by this
variable indicating signal strength is the biggest difference between individual measurements.
As can be seen in Figure 10, the Amide I band is the only complete band seen in PC2.
Adjacent positive and negative peaks seen in the phosphate v1, v2 and v4 bands are suggestive
of peak wavenumber shifts or changes in relative intensities of sub bands. Analysis of profile
centres indicates that sub-bands from cortical bone occur at a slightly higher wavenumbers
than corresponding sub-bands from trabecular bone. A similar finding was made when
measuring the effect of compression on bone using Raman microscopy [56]. This may
suggest cortical bone is preloaded, possibly as a form of protection against excessive loads, in
a similar way to wood in the trunk of trees [57].
PC3 has bands coinciding with those arising from collagen in bone. An inverted carbonate
peak is also seen along with a negative spike centred at about 954 cm-1
, usually assigned to a
carbonate substituted apatite [48] or octacalcium phosphate (OCP) [24]. This coefficient
could be thought of as an inverse mineral: matrix ratio and as the scores from trabecular bone
are higher (see Figure 9) would suggest the mineral: matrix ratio is lower in trabecular bone.
This is in agreement with the mineral: matrix ratio derived from individual peaks (see Figure
3).
Coefficients 5 and 6 are very similar with negative portions in the phosphate v2 and v4 and
amide I regions and positive sections in proline (840-900 cm-1
), B type carbonate, Amide III
and CH2 bands. The major difference is in the phosphate v1 band where the adjacent positive
and negative peaks are inverted between the two PCs. Unsurprisingly, the scores from these
PCs are similar in each sample.
Taken together, these results show there are differences in the Raman scattering between
cortical and trabecular bone from the mice examined in this paper, reflecting differences

17
found using other techniques. Cortical bone appears “older” than trabecular bone and this
could arise from the lower turnover generally reported in cortical bone [4]. The different
signals found between femoral and tibial bone were a surprise, as was also the inversion of
the ratio of cortical to trabecular signal in going from femur to tibia. Further studies are
underway to try to understand the origins of these results.

18
References
[1] Cowin SC. Bone mechanics handbook. Boca Raton, FL: CRC Press; 2001:
[2] Rho J-, Kuhn-Spearing L, Zioupos P. Mechanical properties and the hierarchical structure
of bone. Medical Engineering and Physics 1998;20:92-102.
[3] Bianco P, Gehron Robey P. Marrow stromal stem cells. J Clin Invest 2000;105:1663-8.
[4] Favus MJ, American Society for Bone and Mineral Research. Primer on the metabolic
bone diseases and disorders of mineral metabolism. Philadelphia ; London: Lippincott
Williams & Wilkins; 1999:502.
[5] Warner SE, Shea JE, Miller SC, Shaw JM. Adaptations in cortical and trabecular bone in
response to mechanical loading with and without weight bearing. Calcified Tissue
International 2006;79:395-403.
- , Benhamou C-, Courteix D. Short-term and
long-term site-specific effects of tennis playing on trabecular and cortical bone at the distal
radius. Journal of Bone and Mineral Metabolism 2006;24:484-90.
[7] Michalsky M, Norrissuarez K, Bettica P, Pecile A, Moro L. Rat cortical and trabecular
bone collagen glycosylation are differently influenced by ovariectomy. Biochemical and
Biophysical Research Communications 1993;192:1281-8.
[8] Morko J, Kiviranta R, Hurme S, Rantakokko J, Vuorio E. Differential turnover of cortical
and trabecular bone in transgenic mice overexpressing cathepsin K. Bone 2005;36:854-65.
[9] Duan Y, De Luca V, Seeman E. Parathyroid hormone deficiency and excess: Similar
effects on trabecular bone but differing effects on cortical bone. Journal of Clinical
Endocrinology and Metabolism 1999;84:718-22.

19
[10] Genant HK, Guglielmi G, Jergas M. Bone densitometry and osteoporosis. Berlin ; New
York: Springer; 1998:602.
[11] Gong JK, Arnold JS, Cohn SH. Composition of trabecular and cortical bone. Anat Rec
1964;149:325-31.
[12] Mulder L, Koolstra JH, De Jonge HW, Van Eijden TMGJ. Architecture and
mineralization of developing cortical and trabecular bone of the mandible. Anatomy and
Embryology 2006;211:71-8.
[13] Bigi A, Cojazzi G, Panzavolta S, et al. Chemical and structural characterization of the
mineral phase from cortical and trabecular bone. Journal of Inorganic Biochemistry
1997;68:45-51.
[14] NorisSuarez K, Romanello M, Bettica P, Moro L. Collagen type I of rat cortical and
trabecular bone differs in the extent of posttranslational modifications. Calcified Tissue
International 1996;58:65-9.
[15] Zysset PK, Edward Guo X, Edward Hoffler C, Moore KE, Goldstein SA. Elastic
modulus and hardness of cortical and trabecular bone lamellae measured by nanoindentation
in the human femur. Journal of Biomechanics 1999;32:1005-12.
[16] Rho J-, Tsui TY, Pharr GM. Elastic properties of human cortical and trabecular lamellar
bone measured by nanoindentation. Biomaterials 1997;18:1325-30.
[17] Bumrerraj S, Katz JL. Scanning acoustic microscopy study of human cortical and
trabecular bone. Annals of Biomedical Engineering 2001;29:1034-42.

20
[18] Turner CH, Rho J, Takano Y, Tsui TY, Pharr GM. The elastic properties of trabecular
and cortical bone tissues are similar: Results from two microscopic measurement techniques.
Journal of Biomechanics 1999;32:437-41.
[19] Bayraktar HH, Morgan EF, Niebur GL, Morris GE, Wong EK, Keaveny TM.
Comparison of the elastic and yield properties of human femoral trabecular and cortical bone
tissue. Journal of Biomechanics 2004;37:27-35.
[20] Carden A, Rajachar RM, Morris MD, Kohn DH. Ultrastructural changes accompanying
the mechanical deformation of bone tissue: A raman imaging study. Calcified Tissue
International 2003;72:166-75.
[21] Crane NJ, Morris MD, Ignelzi Jr. MA, Yu G. Raman imaging demonstrates FGF2-
induced craniosynostosis in mouse calvaria. Journal of Biomedical Optics 2005;10:1-8.
[22] Dehring KA, Crane NJ, Smukler AR, McHugh JB, Roessler BJ, Morris MD. Identifying
chemical changes in subchondral bone taken from murine knee joints using raman
spectroscopy. Applied Spectroscopy 2006;60:1134-41.
[23] Dehring KA, Smukler AR, Roessler BJ, Morris MD. Correlating changes in collagen
secondary structure with aging and defective type II collagen by raman spectroscopy. Applied
Spectroscopy 2006;60:366-72.
[24] Crane NJ, Popescu V, Morris MD, Steenhuis P, IgnelziJr. MA. Raman spectroscopic
evidence for octacalcium phosphate and other transient mineral species deposited during
intramembranous mineralization. Bone 2006;39:434-42.

21
[25] Kozloff KM, Carden A, Bergwitz C, et al. Brittle IV mouse model for osteogenesis
imperfecta IV demonstrates postpubertal adaptations to improve whole bone strength. Journal
of Bone and Mineral Research 2004;19:614-22.
[26] Silva MJ, Brodt MD, Wopenka B, et al. Decreased collagen organization and content are
associated with reduced strength of demineralized and intact bone in the SAMP6 mouse.
Journal of Bone and Mineral Research 2006;21:78-88.
[27] Redey SA, Nardin M, Bernache-Assolant D, et al. Behavior of human osteoblastic cells
on stoichiometric hydroxyapatite and type A carbonate apatite: Role of surface energy.
Journal of Biomedical Materials Research 2000;50:353-64.
[28] Penel G, Delfosse C, Descamps M, Leroy G. Composition of bone and apatitic
biomaterials as revealed by intravital raman microspectroscopy. Bone 2005;36:893-901.
[29] Ager JW, Nalla RK, Breeden KL, Ritchie RO. Deep-ultraviolet raman spectroscopy
study of the effect of aging on human cortical bone. Journal of Biomedical Optics 2005;10:1-
8.
[30] Akkus O, Adar F, Schaffler MB. Age-related changes in physicochemical properties of
mineral crystals are related to impaired mechanical function of cortical bone. Bone
2004;34:443-53.
[31] Hofmann T, Heyroth F, Meinhard H, Franzel W, Raum K. Assessment of composition
and anisotropic elastic properties of secondary osteon lamellae. Journal of Biomechanics
2006;39:2282-94.
[32] Kazanci M, Wagner HD, Manjubala NI, et al. Raman imaging of two orthogonal planes
within cortical bone. Bone 2007;41:456-61.

22
[33] Somerville JM, Aspden RM, Armour KE, Armour KJ, Reid DM. Growth of C57Bl/6
mice and the material and mechanical properties of cortical bone from the tibia. Calcified
Tissue International 2004;74:469-75.
[34] Cai TT, Zhang D, Ben-Amotz D. Enhanced chemical classification of raman images
using multiresolution wavelet transformation. Applied Spectroscopy 2001;55:1124-30.
[35] Barclay VJ, Bonner RF, Hamilton IP. Application of wavelet transforms to experimental
spectra: Smoothing, denoising, and data set compression. Analytical Chemistry 1997;69:78-
90.
[36] Lieber CA, Mahadevan-Jansen A. Automated method for subtraction of fluorescence
from biological raman spectra. Applied Spectroscopy 2003;57:1363-7.
[37] Timlin JA, Carden A, Morris MD. Chemical microstructure of cortical bone probed by
raman transects. Applied Spectroscopy 1999;53:1429-35.
[38] Tsuda H, Arends J. Orientational micro-raman spectroscopy on hydroxyapatite single
crystals and human enamel crystallites. Journal of Dental Research 1994;73:1703-10.
[39] Kazanci M, Roschger P, Paschalis EP, Klaushofer K, Fratzl P. Bone osteonal tissues by
raman spectral mapping: Orientation-composition. J Struct Biol 2006;156:489-96.
[40] Banwell CN, McCash EM. Fundamentals of molecular spectroscopy. London ; New
York: McGraw-Hill; 1994:308.
[41] Paschalis EP, Verdelis K, Doty SB, Boskey AL, Mendelsohn R, Yamauchi M.
Spectroscopic characterization of collagen cross-links in bone. Journal of Bone and Mineral
Research 2001;16:1821-8.

23
[42] Freeman JJ, Wopenka B, Silva MJ, Pasteris JD. Raman spectroscopic detection of
changes in bioapatite in mouse femora as a function of age and in vitro fluoride treatment.
Calcified Tissue International 2001;68:156-62.
[43] Hair JF. Multivariate data analysis. Upper Saddle River, N.J.: Prentice Hall; 1998:
[44] Bland JM, Kerry SM. Statistics notes: Weighted comparison of means. British Medical
Journal 1998;316:129.
[45] Akkus O, Polyakova-Akkus A, Adar F, Schaffler MB. Aging of microstructural
compartments in human compact bone. Journal of Bone and Mineral Research 2003;18:1012-
9.
[46] Smith E. Modern raman spectroscopy : A practical approach. Chichester: John Wiley;
2005:210.
[47] Baranska H. Laser raman spectrometry : Analytical applications. Horwood; 1987:
[48] Tarnowski CP, Ignelzi Jr. MA, Morris MD. Mineralization of developing mouse calvaria
as revealed by raman microspectroscopy. Journal of Bone and Mineral Research
2002;17:1118-26.
[49] Timlin JA, Carden A, Morris MD, et al. Spatial distribution of phosphate species in
mature and newly generated mammalian bone by hyperspectral raman imaging. Journal of
Biomedical Optics 1999;4:28-34.
[50] Morris MD, Finney WF. Recent developments in raman and infrared spectroscopy and
imaging of bone tissue. Spectroscopy 2004;18:155-9.

24
[51] Mkukuma LD, Skakle JMS, Gibson IR, Imrie CT, Aspden RM, Hukins DWL. Effect of
the proportion of organic material in bone on thermal decomposition of bone mineral: An
investigation of a variety of bones from different species using thermogravimetric analysis
coupled to mass spectrometry, high-temperature X-ray diffraction, and fourier transform
infrared spectroscopy. Calcified Tissue International 2004;75:321-8.
. Human tooth enamel: A raman polarized approach.
Applied Spectroscopy 2002;56:1030-4.
[53] Ferguson N. Osteoporosis in focus. London: Pharmaceutical Press; 2004:229.
[54] Pelton JT, McLean LR. Spectroscopic methods for analysis of protein secondary
structure. Analytical Biochemistry 2000;277:167-76.
[55] Chi Z, Chen XG, Holtz JSW, Asher SA. Uv resonance raman-selective amide vibrational
enhancement: Quantitative methodology for determining protein secondary structure.
Biochemistry 1998;37:2854-64.
[56] De Carmejane O, Morris MD, Davis MK, et al. Bone chemical structure response to
mechanical stress studied by high pressure raman spectroscopy. Calcified Tissue International
2005;76:207-13.
[57] Burgert I, Eder M, Gierlinger N, Fratzl P. Tensile and compressive stresses in tracheids
are induced by swelling based on geometrical constraints of the wood cell. Planta
2007;226:981-7.
[58] Awonusi A, Morris MD, Tecklenburg MMJ. Carbonate assignment and calibration in the
raman spectrum of apatite. Calcified Tissue International 2007;81:46-52.

25
Acknowledgements
The authors would like to thank the BBSRC for funding of the Raman microscope
(BBC5125101), the College of Life Sciences and Medicine and the College of Physical
Sciences at the University of Aberdeen for funding of a studentship (SG) and Dr R. J. Van'T
Hof of the University of Edinburgh for providing the mouse bone.

26
Figure Legends Figure 1
A typical Raman spectrum from bone showing the major peaks and their molecular origins.
Background signal has been removed.
Figure 2
Average spectra from cortical and trabecular bone from femur (A) and tibia (B) and their
differences (E). Wavenumbers where the differences are significant are plotted in the right
hand panels (B and D).
Figure 3
The mineral to matrix ratio showing the comparison between cortical and trabecular bone
from femur (A) and tibia (B).
Figure 4
Carbonate to phosphate ratio showing the comparison between cortical and trabecular bone
from femur (A) and tibia (B).
Figure 5
Hydrogen phosphate (HPO42-
) to phosphate ratio showing the comparison between cortical
and trabecular bone from femur (A) and tibia (B).
Figure 6
Ratio of intensities of peaks centred at 1670 and 1690 cm-1
, fitted within the Amide I band,
indicating different secondary structures in the collagen matrix (femur (A) and tibia (B)).
Figure 7
Mineral crystallinity measured by the FWHM of the phosphate v1 peak. A narrower peak is
indicative of purer mineral with larger crystal (femur (A) and tibia (B)).

27
Figure 8
PCA component 1. Coefficient 1 from the PCA accounts for 99% of the variance and
represents a magnitude effect. This is present because data were not normalised. Note the
similarity to the spectrum from bone plotted in Figure 1.
Figure 9
PCA scores for coefficients 2-6 for femur (A) and tibia (B). a - P<0.01, b - P<0.05.
Figure 10
PCA components with a significant difference between cortical and trabecular bone.
Coefficients 2 and 3 (A and B) were significantly different in femur and tibia while
coefficients 5 and 6 (C and D) were significantly different in tibia only. Vertical lines mark
the position of peak maxima in a typical Raman spectrum from bone.

Fig 1
Wavenumber cm-1
400 600 800 1000 1200 1400 1600 1800
Inte
nsity C
oun
ts
0
5000
10000
15000
20000
25000
Phos v2 Phos v4
Phos v1
Carb v1/
Phos v3
Amide IIICH2 wag
Amide I
Mineral Peaks Matrix peaks

Fig 2
Femur
Wavenumber (cm-1)
400 600 800 1000 1200 1400 1600 1800
Inte
nsity (
Counts
)
0
2000
4000
6000
8000
Cort
Trab
Femur Significance of Difference
Wavenumber (cm-1)
400 600 800 1000 1200 1400 1600 1800
Inte
nsity (
Counts
)
0
2000
4000
6000
8000
10000Bone spectrum
p < 0.05
Difference (Cortical - Trabecular)
Wavenumber (cm-1)
400 600 800 1000 1200 1400 1600 1800
Diffe
rence in Inte
nsity (
Counts
)
-1000
0
1000
2000
3000
4000
5000
6000 Femur (Ct - Tb)
Tibia (Ct - Tb)
Tibia
Wavenumber (cm-1)
400 600 800 1000 1200 1400 1600 1800
Inte
nsity (
Counts
)
0
2000
4000
6000
8000
10000
12000
14000
16000
Cort
Trab
Tibia Significance of Difference
Wavenumber (cm-1)
400 600 800 1000 1200 1400 1600 1800
Inte
nsity (
Counts
)
0
2000
4000
6000
8000
10000
Col 10 vs Col 11
Col 12
A B
C D
E
TibiaFemurMineral:Matrix ratio
Phos v4:Amide III
Group
Cort Trab
Ra
tio
0.0
0.5
1.0
1.5
2.0
2.5
3.0 P=0.001
Mineral:Matrix ratio
Phos v4:Amide III
Group
Cort Trab
Ra
tio
0.0
0.5
1.0
1.5
2.0
2.5
3.0 P=0.002
A B
Femur TibiaCarbonate:Phosphate ratio
Carb:Phos v4
Group
Cort Trab
Ratio
0
5
10
15
20
25
30
35
P=0.054
Carbonate:Phosphate ratio
Carb:Phos v4
Group
Cort Trab
Ratio
0
5
10
15
20
25
30
35
40
P<0.001
A B
FemurAHPO
4
=:Phos v
4
Group
Cort Trab
Ra
tio
0
2
4
6
8 P=0.06
TibiaBHPO
4
=:Phos v
4
Group
Cort Trab
Ra
tio
0
2
4
6
8 P=0.20
TibiaBFemurAMature:Immature cross-links
Group
Cort Trab
Ra
tio
0
5
10
15
20
25 P=0.35
Mature:Immature cross-links
Group
Cort Trab
Ra
tio
0
5
10
15
20
25 P=0.33
Fig 3
Fig 4 Fig 6
Fig 5

Fig 7
FemurAFull Width at Half Maximum Height
of Phosphate v1 peak
Group
Cort Trab
FW
HM
cm
-1
0
2
4
6
8
10
12
14
16
18
20 P=0.08
TibiaBFull Width at Half Maximum Height
of Phosphate v1 peak
Group
Cort Trab
FW
HM
cm
-1
0
2
4
6
8
10
12
14
16
18
20 P=0.06

Fig 8
PCA Coefficient 1
Wavenumbers cm-1
400 600 800 1000 1200 1400 1600 1800
0.00
0.05
0.10
0.15
0.20
0.25
TibiaPCA scores for coefficients 2-6
Coefficient
coeff 2 coeff 3 coeff 4 coeff 5 coeff 6
Sco
re
-2000
-1500
-1000
-500
0
500
1000
1500
2000
Cortical
Trabecular
a a bb
FemurPCA scores for coefficients 2-6
Coefficient
coeff 2 coeff 3 coeff 4 coeff 5 coeff 6
Sco
re
-2000
-1500
-1000
-500
0
500
1000
1500
2000
Cortical
Trabecular
a a
A A
Fig 9

Fig 10
Wavenumber (cm-1)-0.15
-0.10
-0.05
0.00
0.05
0.10
0.15
400 600 800 1000 1200 1400 1600
Coefficient 2
Bone spectrum
Wavenumber (cm-1)-0.15
-0.10
-0.05
0.00
0.05
0.10
0.15
400 600 800 1000 1200 1400 1600
Coefficient 3
Bone spectrum
Wavenumber (cm-1)-0.15
-0.10
-0.05
0.00
0.05
0.10
0.15
400 600 800 1000 1200 1400 1600
Coefficient 5
Bone spectrum
Wavenumber (cm-1)-0.15
-0.10
-0.05
0.00
0.05
0.10
0.15
400 600 800 1000 1200 1400 1600
Coefficient 6
Bone spectrum
A B
C D