local government energy audit pdfs/lgea final...final report by: trc energy services 11/04/2016...
TRANSCRIPT

Local Government Energy Audit: Energy Audit Report
Copyright ©2016 TRC Energy Services. All rights reserved.
Reproduction or distribution of the whole, or any part of the contents of this document without written permission of TRC is prohibited. Neither TRC nor any of its employees makes any warranty, express or implied, or assumes any legal liability or responsibility for the accuracy, completeness, or usefulness of any data, information, method, product or process disclosed in this document, or represents that its use will not infringe upon any privately-owned rights, including but not limited to, patents, trademarks or copyrights.
Falcon Ness Park Borough of Folsom
1700 12th Street
Folsom, NJ 08037
November 4, 2016
Final Report by:
TRC Energy Services

11/04/2016
Disclaimer The intent of this energy analysis report is to identify energy savings opportunities associated with recommended upgrades to the facility’s systems at this site. Approximate saving are included in this report to make decisions about reducing energy use at the facility. This report, however, is not intended to serve as a detailed engineering design document. It should be noted that detailed design efforts are required in order to implement several of the improvements evaluated as part of this energy analysis.
The energy conservation measures and estimates of energy consumption contained in this report have been reviewed for technical accuracy. However, all estimates contained herein of energy consumption at the site are not guaranteed, because energy consumption ultimately depends on behavioral factors, the weather, and many other uncontrollable variables. The energy assessor and New Jersey Board of Public Utilities (NJBPU) shall in no event be liable should the actual energy consumption vary from the estimated consumption shown herein.
Estimated installation costs are based on a variety of sources, including our own experience at similar facilities, our own pricing research using local contractors and vendors, and cost estimating handbooks such as those provided by RS Means. The cost estimates represent our best judgment for the proposed action. The Owner is encouraged to independently confirm these cost estimates and to obtain multiple estimates when considering measure installations. Since actual installed costs can vary widely for a particular installation, and for conditions which cannot be known prior to in-depth investigation and design, the energy assessor does not guarantee installed cost estimates and shall in no event be liable should actual installed costs vary from the estimated costs herein.
New Jersey’s Clean Energy Program (NJCEP) incentive values provided in this report are estimates and are based on program information available at the time this report is written. The NJBPU reserves the right to extend, modify, or terminate programs without prior or further notice, including incentive levels and eligibility requirements. The Owner should review available program incentives and requirements prior to selecting and/or installing any recommended measures.

LGEA: Energy Audit Report – Falcon Ness Park 3
Table of Contents
1 Executive Summary ...................................................................................................................... 6
1.1 Facility Summary ....................................................................................................................... 6 1.2 Your Cost Reduction Opportunities........................................................................................... 6
Energy Conservation Measures.......................................................................................................................... 6 Energy Efficient Practices ................................................................................................................................... 7
1.3 Implementation Planning .......................................................................................................... 7 2 Facility Information and Existing Conditions ................................................................................. 9
2.1 Project Contacts ........................................................................................................................ 9 2.2 General Site Information ........................................................................................................... 9 2.3 Occupancy ................................................................................................................................. 9 2.4 Building Envelope ...................................................................................................................... 9 2.5 Energy-Using Systems ............................................................................................................. 10
Lighting System ................................................................................................................................................ 10 Plug load & Vending Machines ........................................................................................................................ 10
2.6 Water-Using Systems .............................................................................................................. 10 3 Site Energy Use and Costs........................................................................................................... 11
3.1 Total Cost of Energy ................................................................................................................ 11 3.2 Electricity Usage ...................................................................................................................... 12 3.3 Benchmarking .......................................................................................................................... 13 3.4 Energy End-Use Breakdown .................................................................................................... 15
4 Energy Conservation Measures .................................................................................................. 16
4.1 Lighting Upgrades .................................................................................................................... 16
ECM 1: Install LED Fixtures ............................................................................................................................... 16 5 Energy Efficient Practices ........................................................................................................... 17
Perform Proper Lighting Maintenance............................................................................................................. 17 Develop a Lighting Maintenance Schedule ...................................................................................................... 17 Ensure Lighting Controls Are Operating Properly ............................................................................................ 17 Plug Load Controls............................................................................................................................................ 17 Water Conservation ......................................................................................................................................... 17
6 On-site generation Measures ..................................................................................................... 19
6.1 Photovoltaic............................................................................................................................. 19 6.2 Wind Generation .................................................................................................................... 20 6.3 Combined Heat and Power .................................................................................................... 20
7 Demand Response ..................................................................................................................... 21 8 Project Funding / Incentives ....................................................................................................... 22
8.1 SmartStart ............................................................................................................................... 22 8.2 SREC Registration Program...................................................................................................... 23 8.3 Energy Savings Improvement Program ................................................................................... 24

LGEA: Energy Audit Report – Falcon Ness Park 4
9 Energy Purchasing and Procurement Strategies .......................................................................... 25
9.1 Retail Electric Supply Options.................................................................................................. 25 9.2 Retail Natural Gas Supply Options .......................................................................................... 25
Appendix A: Equipment Inventory & Recommendations
Appendix B: EPA Statement of Energy Performance

LGEA: Energy Audit Report – Falcon Ness Park 5
Table of Figures
Figure 1 –12 Month Utility Costs .................................................................................................................. 6
Figure 2 – Potential Post-Implementation Costs .......................................................................................... 6
Figure 3 – Summary of Energy Reduction Opportunities ............................................................................. 7
Figure 4 – Project Contacts ........................................................................................................................... 9
Figure 5 - Schedule ........................................................................................................................................ 9
Figure 6 - Utility Summary .......................................................................................................................... 11
Figure 7 - Energy Cost ................................................................................................................................. 11
Figure 8 - Graph of 12 Months Electric Usage & Demand .......................................................................... 12
Figure 9 - Table of 12 Months Electric Usage & Demand ........................................................................... 12
Figure 10 - Energy Use Intensity Comparison – Existing Conditions........................................................... 13
Figure 11 - Energy Use Intensity Comparison – Following Installation of Recommended Measure .......... 13
Figure 12 - Energy Balance (kBtu/SF and %) ............................................................................................... 15
Figure 13 – Lighting Upgrade ECM .............................................................................................................. 16
Figure 14 - Photovoltaic Screening ............................................................................................................. 19
Figure 15 - ECM Incentive Program Eligibility ............................................................................................. 22

LGEA: Energy Audit Report – Falcon Ness Park 6
1 EXECUTIVE SUMMARY The New Jersey Board of Public Utilities (NJBPU) has sponsored this Local Government Energy Audit (LGEA) Report for Falcon Ness Park.
The goal of a LGEA is to provide you with information on how your facility uses energy, identify energy conservation measures (ECMs) that can reduce your energy use, and put you in a position to implement the ECMs. The LGEA also sets you on the path to receive financial incentives from New Jersey’s Clean Energy Program (NJCEP) for implementing the ECMs.
This study was conducted by TRC Energy Services, as part of a comprehensive effort to assist The Borough of Folsom in controlling energy costs and protecting our environment by offering a full spectrum of energy management options.
1.1 Facility Summary
Falcon Ness Park is a community recreation area that consists mainly of athletic fields. There is a concessions focused facility which is approximately 160 square feet. The facility is used on a seasonal basis during athletic events for the purposes of providing snacks and refreshments for attendees.
Falcon Ness Park energy end users consists mostly of aging and inefficient outdoor lighting. A more detailed description of the facility and our observations are located in Section 2, “Facility Information and Existing Conditions”.
1.2 Your Cost Reduction Opportunities
Energy Conservation Measures
TRC Energy Services evaluated one (1) project which represents an opportunity for Falcon Ness Park to reduce annual energy costs by an estimated $4,687. The measure would pay for itself in roughly 25 years. The breakdown of the existing and potential utility cost is illustrated in Figure 1 and Figure 2, respectively. This project represents an opportunity to reduce Falcon Ness Park’s annual energy use by an estimated 80%, and results in a reduction in greenhouse gas (GHG) emissions of 11,214 lbs of CO2e.
Figure 1 –12 Month Utility Costs
Figure 2 – Potential Post-Implementation Costs
Electric, $1,141, 100%
$1,141

LGEA: Energy Audit Report – Falcon Ness Park 7
A detailed description of Falcon Ness Park’s existing energy use can be found in Section 3, “Site Energy Use and Costs”.
The evaluated measure is listed as shown in Figure 3. A brief description of the category can be found below and a description of the savings opportunity can be found in Section 4, “Energy Conservation Measures”.
Figure 3 – Summary of Energy Reduction Opportunities
Lighting Upgrades generally involve the replacement of existing lighting components such as lamps and ballasts (or the entire fixture) with higher efficiency lighting components. These measure saves energy by reducing the power used by the lighting components due to improved electrical efficiency.
Energy Efficient Practices
TRC Energy Services also identified five (5) no/low cost energy efficient practices. A facility’s energy performance can be significantly improved by employing certain behavioral and operational adjustments as well as performing routine maintenance on building systems. Through these practices equipment lifetime can be extended; occupant comfort, health and safety can be improved; and annual energy, operation, and maintenance costs can be reduced. Opportunities identified at Falcon Ness Park include:
• Perform Proper Lighting Maintenance • Develop a Lighting Maintenance Schedule • Ensure Lighting Controls Are Operating Properly • Install Plug Load Controls • Water Conservation
For details on these Energy Efficient Practices, please refer to section 5, “Energy Efficient Practices”.
1.3 Implementation Planning
To realize the energy savings from the ECM in this report, the equipment change outlined needs to be selected and installed through project implementation. A major consideration is if there is capital available for project implementation. Another consideration is whether to pursue a comprehensive approach wherein the ECM is pursued potentially in conjunction with other facility projects or improvements.
Rebates, incentives, and financing are available from the NJBPU, NJCEP, as well as some of the state’s investor-owned utilities, to help reduce the costs associated with the implementation of energy efficiency projects. Prior to implementing any project, please review the appropriate incentive program guidelines before proceeding. This is important because in most cases you will need to submit an application for the incentives before purchasing materials and beginning installation.
Annual Electric Savings
(kWh)
Peak Demand Savings
(kW)
Annual Energy Cost
Savings($)
Estimated Install Cost
($)
Estimated Incentive
($)*
Estimated Net Cost
($)
Simple Payback Period(yrs)**
CO2e Emissions Reduction
(lbs)11,136 0.0 $4,687.25 $123,429.24 $6,400.00 $117,029.24 24.97 11,214
ECM 1 Install LED Fixtures 11,136 0.0 $4,687.25 $123,429.24 $6,400.00 $117,029.24 24.97 11,21411,136 0.0 $4,687.25 $123,429.24 $6,400.00 $117,029.24 24.97 11,214
* - All incentives presented in this table are based on NJ Smart Start Building equipment incentives and assume proposed equipment meets minimum performance criteria for that program.** - Simple Payback Period is based on net measure costs (i.e. after incentives).
TOTALS
Energy Conservation Measure
Lighting Upgrades

LGEA: Energy Audit Report – Falcon Ness Park 8
The ECM outlined in this report may qualify under the following program(s):
• SmartStart (SS) • Energy Savings Improvement Program (ESIP)
For facilities with capital available for implementation of selected individual measures or phasing implementation of selected measures over multiple years, incentives are available through the SmartStart program. To participate in this program you may utilize internal resources, or an outside firm or contractor, to design the ECM(s), select the equipment and apply for the incentive(s). Program pre-approval is required for some SS incentives, so only after receiving approval may the ECM(s) be installed. The incentive values listed above in Figure 3 represent the SS program and will be explained further in Section 8, “Project Funding/Incentives”, as well as the other programs as mentioned below.
For facilities without capital available to implement ECMs, project financing may be available through the Energy Savings Improvement Program (ESIP). Supported directly by the NJBPU, ESIP provides government agencies with external project development, design, and implementation services as well as financing for implementing ECMs. This LGEA report is the first step for participating in ESIP and should help you determine next steps. Refer to Section 8.3, “Energy Savings Improvement Program” for additional information on the ESIP Program.
Additional descriptions of all relevant incentive programs are located in Section 8,”Project Funding/Incentives”. You may also check the following website for further information on available rebates and incentives:
www.NJCleanEnergy.com/CI
To ensure projects are implemented such that maximum savings and incentives are achieved, bids and specifications should be reviewed by your procurement personnel and/or consultant(s) to ensure that selected equipment coincides with LGEA recommendations, as well as applicable incentive program guidelines and requirements.

LGEA: Energy Audit Report – Falcon Ness Park 9
2 FACILITY INFORMATION AND EXISTING CONDITIONS
2.1 Project Contacts Figure 4 – Project Contacts
2.2 General Site Information
On May 12, 2016, TRC Energy Services performed an energy audit at Falcon Ness Park located in Folsom NJ. TRC Energy Services’ team met with John LaPollo, Public Works Supervisor, to review the facility operations and focus the investigation on specific energy-using systems.
Falcon Ness Park constructed in 1999 is a park that houses two sports fields as well as a 160 square foot concession stand. The park is used in the spring, summer, and fall (excluding the month of July), for sports games and practices. The majority of the energy use comes from field lighting which uses 1500 Watt Metal Halide Lamps
2.3 Occupancy
The park is used throughout the year except for the winter months and in the month of July. The concession stand is occupied only during formal events. The typical schedule is presented in the table below.
Figure 5 - Schedule
2.4 Building Envelope
Being an outdoor park, the concession stand is the only structure on site. The concession stand is unconditioned, uninsulated, and of wood framed construction.
Name Role E-Mail Phone #
Patricia Gatto Municipal Clerk [email protected] 609-561-3178
John LaPolloPublic Works Supervisor
N/A N/A
Ignacio Badilla Auditor [email protected] 212-221-7822
Customer
Designated Representative
TRC Energy Services
Park Name Weekday/Weekend Operating ScheduleFalcon Ness Park Weekday 6pm - 10pmFalcon Ness Park Weekend 7pm - 11pm
Occupancy Schedule

LGEA: Energy Audit Report – Falcon Ness Park 10
2.5 Energy-Using Systems
Lighting System
The exterior park lighting is provided by 1500 Watt Metal Halide fixtures controlled by switches. The field also has a concession stand that is lit by two 2 lamp standard wattage T8 fixtures. The concession lighting is also controlled by a switch.
Plug load & Vending Machines
The facility’s plug loads, are all located in the concession stand. They consist of small kitchen equipment and refrigeration.
2.6 Water-Using Systems
There were no restrooms observed at the park, and we did not observe an irrigation system for the athletic fields. Therefore, there are no water-using systems recommendations.
Please refer to Appendix A: Equipment Inventory & Recommendations for an inventory of all of your equipment.
Pole Fixture with 9 Lamps 1500 Watt Metal Halide Lamp

LGEA: Energy Audit Report – Falcon Ness Park 11
3 SITE ENERGY USE AND COSTS Utility data for Electricity was analyzed to identify opportunities for savings. In addition, data for Electricity was evaluated to determine the annual energy performance metrics for the building in energy cost/ft2 and energy use/ft2. These energy use indices are indicative of the relative energy effectiveness of this building. There are a number of factors that could cause the energy use of this building to vary from the “typical” energy use for other facilities identified as: park specific local climate conditions, daily occupancy hours of the facility, seasonal fluctuations in occupancy, daily operating hours of energy use systems, and the behavior of the occupants with regard to operating systems that impact energy use such as turning off appliances and leaving windows open. Please refer to the Benchmarking section within Section 3.3 for additional information.
3.1 Total Cost of Energy
The following energy consumption and cost data is based on 12 months of utility usage data that was provided for the utility. The annual consumption and cost was developed from this information.
Figure 6 - Utility Summary
The current utility cost for this site is $5,829 as shown in the chart below.
Figure 7 - Energy Cost
Usage Cost13,848 kWh $5,829
$5,829
Utility Summary for Falcon Ness ParkFuel
TotalElectricity

LGEA: Energy Audit Report – Falcon Ness Park 12
3.2 Electricity Usage
Electricity is provided by Atlantic City Electric. The average electric cost (combined for commodity, transmission and distribution) for 12 months of provided data is $0.421/kWh, which is the blended rate used throughout the analyses in this report. The monthly electricity consumption and peak demand is represented graphically in the chart below. Falcon Ness Park doesn’t have a 3rd party electric supplier
Figure 8 - Graph of 12 Months Electric Usage & Demand
Figure 9 - Table of 12 Months Electric Usage & Demand
0
20
40
60
80
100
120
140
0500
1,0001,5002,0002,5003,0003,5004,000
Pea
k D
eman
d(k
W)
Ele
ctri
c Co
nsum
ptio
n(k
Wh)
Electric Usage & Demand
Electric Consumption (kWh) Peak Demand (kW)
Period Ending
Days in Period
ElectricUsage(kWh)
Demand (kW) Demand Cost Total Electric Cost
2/19/16 29 379 1 $0 $741/21/16 31 412 1 $0 $81
12/21/15 32 459 1 $0 $9011/19/15 28 1,162 115 $0 $69810/22/15 24 1,548 114 $0 $8669/28/15 38 1,099 74 $0 $5488/21/15 24 397 1 $0 $797/28/15 0 947 76 $0 $5547/28/15 69 1,008 115 $0 $7705/20/15 26 3,354 118 $0 $1,0454/24/15 32 2,750 117 $0 $9413/23/15 30 257 0 $0 $50Totals 363 13,772 118.31 $0 $5,797Annual 365 13,848 118.31 $0 $5,829
Electric Billing Data for Falcon Ness Park

LGEA: Energy Audit Report – Falcon Ness Park 13
3.3 Benchmarking
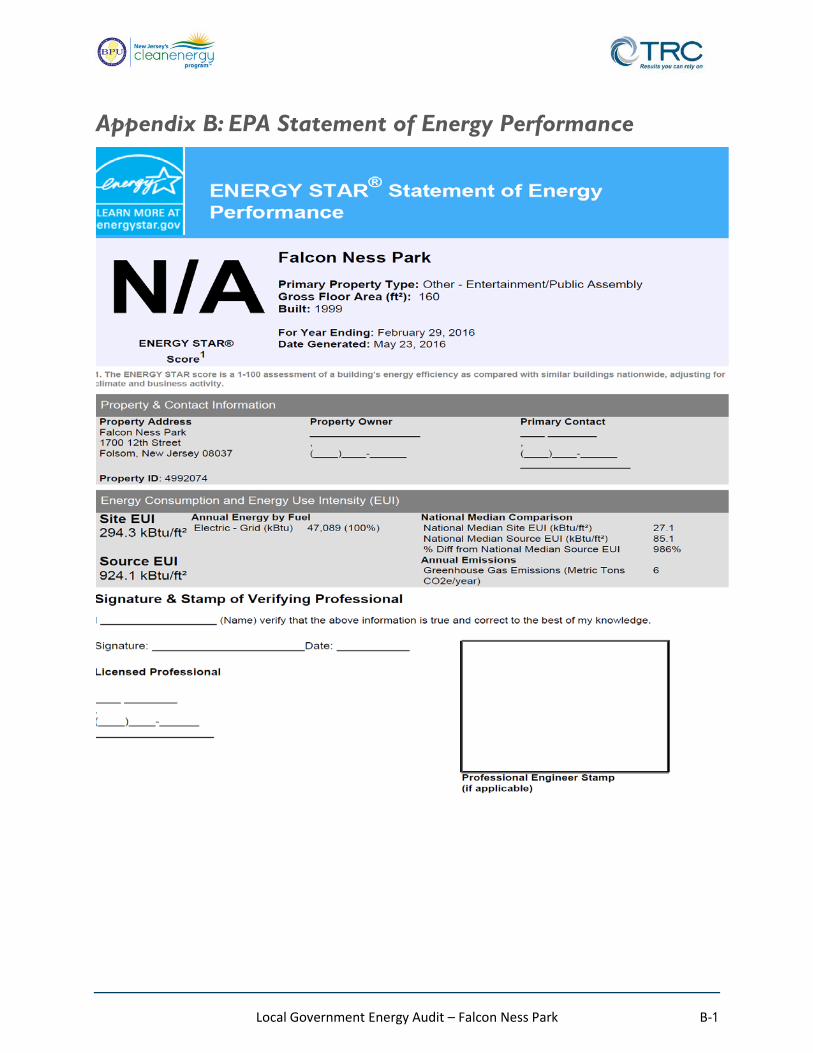
This facility was benchmarked through Portfolio Manager, an online tool created and managed by the United State Environmental Protection Agency (EPA) through the ENERGY STAR® program. Portfolio Manager analyzes your building’s consumption data, cost information, and operational use details and compares its performance against a yearly baseline, national medians, or similar buildings in your portfolio. Metrics used in this comparison are the energy use intensity (EUI) and ENERGY STAR® Score.
Energy use intensity is a measure of a facility’s energy consumption per square foot, and it is the standard metric for comparing buildings’ energy performance. Comparing the EUI of a building with the national median EUI for that building type illustrates whether that building uses more energy than similar buildings on a square foot basis or if that building performs better than the median. EUI is presented in both site energy and source energy. Site energy is the amount of fuel and electricity consumed by a building as reflected in utility bills. Source energy is the raw fuel consumed to generate the energy consumed at the site, factoring in energy production and distribution losses.
Figure 10 - Energy Use Intensity Comparison – Existing Conditions
By implementing all recommended measures covered in this reporting, the Project’s estimated post-implementation EUI improves as shown in the Table below:
Figure 11 - Energy Use Intensity Comparison – Following Installation of Recommended Measure
Many buildings can also receive a 1 – 100 ENERGY STAR® score. This score compares your building’s energy performance to similar buildings nationwide. A score of 50 represents median energy performance, while a score of 75 means your building performs better than 75 percent of all similar buildings nationwide — and may be eligible for ENERGY STAR® certification. This building type does not currently qualify to receive a score
The Portfolio Manager, Statement of Energy Performance can be found in Appendix B: EPA Statement of Energy Performance.
A Portfolio Manager account has been created for you, and you will be provided with your login information. We encourage you to keep up with updating your utility information in Portfolio Manager,
Falcon Ness ParkNational Median
Building Type: OtherSource Energy Use Intensity (kBtu/ft2) 927.3 261.9Site Energy Use Intensity (kBtu/ft2) 295.3 111.1
Energy Use Intensity Comparison - Existing Conditions
Falcon Ness ParkNational Median
Building Type: OtherSource Energy Use Intensity (kBtu/ft2) 181.6 261.9Site Energy Use Intensity (kBtu/ft2) 57.8 111.1
Energy Use Intensity Comparison - Following Installation of Recommended Measures

LGEA: Energy Audit Report – Falcon Ness Park 14
so that you can keep track of your building’s performance. There is free training available from Energy Star Portfolio Manager, which you can access at the following website:
https://www.energystar.gov/buildings/training

LGEA: Energy Audit Report – Falcon Ness Park 15
3.4 Energy End-Use Breakdown
In order to provide a complete overview of energy consumption across building systems, an energy balance was performed at this facility. An energy balance utilizes standard practice engineering methods to evaluate all components of the various electric and fuel-fired systems found in a building and determine their proportional contribution to overall building energy usage. This visual representation of energy end uses highlights systems that may benefit most from energy efficiency projects.
Figure 12 - Energy Balance (kBtu/SF and %)
280.12, 91%
29.26, 9%
Energy Intensity by End Use (kBtu/sqft)
Lighting Systems
Plug Loads

LGEA: Energy Audit Report – Falcon Ness Park 16
4 ENERGY CONSERVATION MEASURES Level of Analysis
The goal of this audit report is to identify potential energy projects, help prioritize specific measures for implementation, and set Falcon Ness Park on the path to receive financial incentives. For this audit report, most measures have received only a preliminary analysis of feasibility which identifies expected ranges of savings and costs. This level of analysis is considered sufficient to make “Go/No-Go” decisions and to prioritize energy projects. Savings are based on the New Jersey Board of Public Utilities New Jersey Clean Energy Program Protocols to Measure Resource Savings dated March 17, 2014. Further analysis or investigation may be required to calculate more accurate savings to support any custom SmartStart, Pay for Performance, or Large Energy Users incentive applications. Financial incentive for the ECM- identified in this report has been calculated based the NJ prescriptive SmartStart program. Depending on your implementation strategy, the project may be eligible for more lucrative incentives through other programs as identified in Section 8, “Project Funding/Incentives”.
The following section describes the evaluated measure.
4.1 Lighting Upgrades
ECM 1: Install LED Fixtures
Summary of Measure Economics
Figure 13 – Lighting Upgrade ECM
Measure Description
This measure evaluates replacing the existing metal halide fixtures with new high performance LED light fixtures. This measure saves energy by installing LED sources which use less power than other technologies with a comparable light output.
Maintenance savings are anticipated since LED sources have burn hours which are generally more than twice that of a fluorescent source and more than 10 times incandescent sources. Maintenance savings may be partially offset by the higher material costs associated with LED sources.
Energy Conservation MeasureInterior/ Exterior
Annual Electric Savings
(kWh)
Peak Demand Savings
(kW)
Annual Fuel
Savings(MMBtu)
Annual Energy Cost
Savings($)
Estimated Install Cost
($)
Estimated Incentive
($)
Estimated Net Cost
($)
Simple Payback Period(yrs)
CO2e Emissions Reduction
(lbs)
Install LED Fixtures Exterior 11,136 0.0 0.0 $4,687.25 $123,429.24 $6,400.00 $117,029.24 24.97 11,214

LGEA: Energy Audit Report – Falcon Ness Park 17
5 ENERGY EFFICIENT PRACTICES In addition to the quantifiable savings estimated in Section 4, “Energy Conservation Measures” a facility’s energy performance can also be improved through application of low or no-cost efficiency strategies. By employing certain behavioral and operational adjustments as well as performing routine maintenance on building systems, equipment lifetime can be extended; occupant comfort, health and safety can be improved; and annual energy, operation, and maintenance costs can be reduced. The recommendations below are provided as a framework for developing a whole building maintenance plan that is customized to your facility. Consult with qualified equipment specialists for details on proper maintenance and system operation.
Perform Proper Lighting Maintenance
In order to sustain optimal lighting levels, lighting fixtures should undergo routine maintenance. Light levels decrease over time due to lamp aging, lamp and ballast failure, and buildup of dirt and dust on lamps, fixtures and reflective surfaces. Together, these factors can reduce total illumination by 20% - 60% or more, while operating fixtures continue drawing full power. To limit this reduction, lamps, reflectors and diffusers should be thoroughly cleaned of dirt, dust, oil, and smoke film buildup approximately every 6 – 12 months.
Develop a Lighting Maintenance Schedule
In addition to routine fixture cleaning, development of a maintenance schedule can both ensure maintenance is performed regularly and can reduce the overall cost of fixture re-lamping and re-ballasting. By re-lamping and re-ballasting fixtures in groups, lighting levels are better maintained and the number of site visits by a lighting technician or contractor can be minimized, decreasing the overall cost of maintenance. If the LED fixture replacement recommendation in this report is implemented, ballasts will no longer need to be replaced, and your maintenance schedule will involve fixture cleaning only.
Ensure Lighting Controls Are Operating Properly
Lighting controls are very cost effective energy efficient devices, when installed and operating correctly. As part of a lighting maintenance schedule, lighting controls should be tested annually to ensure proper functioning. For occupancy sensors, this requires triggering the sensor and verifying that the sensor’s timer settings are correct. For daylight sensors, maintenance involves cleaning of sensor lenses and confirming setpoints and sensitivity are appropriately configured.
Plug Load Controls
There are a variety of ways to limit the energy use of plug loads including increasing occupant awareness, removing under-utilized equipment, installing hardware controls, and using software controls. Some control steps to take are to enable the most aggressive power settings on existing devices or install load sensing or occupancy sensing (advanced) power strips. For additional information refer to “Assessing and Reducing Plug and Process Loads in Office Buildings” http://www.nrel.gov/docs/fy13osti/54175.pdf, or “Plug Load Best Practices Guide” http://www.advancedbuildings.net/plug-load-best-practices-guide-offices
Water Conservation
Efficient use of water and avoiding waste are essential aspects of water conservation. Having a basic understanding of how your facility uses water will help identify opportunities for conserving water.

LGEA: Energy Audit Report – Falcon Ness Park 18
Conserving water is very closely linked to saving energy; electricity or gas is used to heat water, so the less hot water used, the less energy is needed to heat the water. Water conservation reduces the significant energy demands of local water companies to treat and pump water to your facilities, and to treat sewage. So, water conservation helps to reduce the system-wide demand for energy which helps control utility costs for everyone.
The following are tips that can set you on a path towards water conservation/efficiency:
• Audit your current water use: Energy Star Portfolio Manager can be used to track and understand your water use.
• Repair leaking pipes, fixtures, and seals. Small leaks can add up to many gallons of water and dollars wasted.
• Use water-saving faucets, showerheads, and toilets/urinals. • In kitchen areas, use low-flow pre-rinse spray valves. • Choose WaterSense® labelled equipment and appliances
(https://www3.epa.gov/watersense/products) • Set water temperature only as hot as needed. A hot water setting of 110-120 degrees is
recommended to prevent scalds and save energy • Educate employees about the importance of water conservation. • When landscaping, choose plants native to the climate that require minimal watering. If local code
allows, consider diverting “gray water” (i.e. runoff collected from rooftops) for irrigation. • Lawns and gardens require 1/5 inch of water per day during warm weather, less during spring, fall
or cool weather. Water lawns every three to five days, rather than for a short period every day, and try and water during the cooler part of the day (morning or evening). Use sprinkler timers (shut-off/on-off) if possible, and do not leave sprinklers on all day!
• Cover your pool: The average pool takes 22,000 gallons of water to fill, and if it is not covered, hundreds of gallons of water per month can be lost due to evaporation.

LGEA: Energy Audit Report – Falcon Ness Park 19
6 ON-SITE GENERATION MEASURES On-site generation measures include both renewable (e.g., solar, wind) and non-renewable (e.g., microturbines) on-site technologies that generate power to meet all or a portion of the electric energy needs of a facility, often repurposing any waste heat where applicable. Also referred to as distributed generation, these systems contribute to Greenhouse Gas (GHG) emission reductions, demand reductions and reduced customer electricity purchases, resulting in the electric system reliability through improved transmission and distribution system utilization.
The State of New Jersey’s Energy Master Plan (EMP) encourages new distributed generation of all forms and specifically focuses on expanding use of combined heat and power (CHP) by reducing financial, regulatory and technical barriers and identifying opportunities for new entries. The EMP also outlines a goal of 70% of the State’s electrical needs to be met by renewable sources by 2050.
Preliminary screenings were performed to determine the potential that a generation project could provide a cost-effective solution for your facility. Before making a decision to implement, a feasibility study should be conducted that would take a detailed look at existing energy profiles, siting, interconnection, and the costs associated with the generation project including interconnection costs, departing load charges, and any additional special facilities charges.
6.1 Photovoltaic
Sunlight can be converted into electricity using photovoltaics (PV) modules. Modules are racked together into an array that produces direct current (DC) electricity. The DC current is converted to alternating current (AC) through an inverter. The inverter is interconnected to the facility’s electrical distribution system. The amount of unobstructed area available determines how large of a solar array can be installed. The size of the array combined with the orientation, tilt, and shading elements determines the energy produced.
As requested by the customer, the installation of a PV system was evaluated, and a preliminary screening done. Based on the facility’s electric demand, size and location of free area, and shading elements shows that the facility has a Low potential for installing a PV array.
The majority of the ground space available at Falcon Ness is used for athletic events. In order to be cost-effective, a solar PV array generally needs a minimum of 4,000 sq ft of flat or south-facing rooftop, or other unshaded space (based on installing a 50kW array), on which to place the PV panels. In our opinion, the facility does appear not meet these minimum criteria for cost-effective PV installation. If Falcon Ness Park is interested in pursuing the installation of PV, we recommend a full feasibility study be conducted.
Figure 14 - Photovoltaic Screening
5 0 0 0 0 00
102030405060708090
ElectricDemand
Free Area Shading Location Engagement Site Total
PV Screening Results
HIGH
MED
LOW
LGEA: Energy Audit Report – Falcon Ness Park 20
Rebates are not available for solar projects, but owners of solar projects MUST register their projects in the SREC Registration Program prior to the start of construction in order to establish the project’s eligibility to earn SRECs. Registration of the intent to participate in New Jersey's solar marketplace provides market participants with information about the pipeline of anticipated new solar capacity and insight into future SREC pricing. Refer to Section 8.2, “SREC Registration Program” for additional information.
For more information on solar PV technology and commercial solar markets in New Jersey, or to find a qualified solar installer, who can provide a more detailed assessment of the specific costs and benefits of solar develop of the site, please visit the following links below:
- Basic Info on Solar PV in NJ: http://www.njcleanenergy.com/whysolar - NJ Solar Market FAQs: http://www.njcleanenergy.com/renewable-energy/program-updates-and-background-
information/solar-transition/solar-market-faqs - Approved Solar Installers in the NJ Market: http://www.njcleanenergy.com/commercial-industrial/programs/nj-
smartstart-buildings/tools-and-resources/tradeally/approved_vendorsearch/?id=60&start=1
6.2 Wind Generation
According to information published by National Renewable Energy Lab (NREL), NJ is generally not a good candidate for wind power, however. For further information on wind power, contact the NREL.
6.3 Combined Heat and Power
CHP systems are typically used to produce a portion of the electricity needed by a facility, with the balance of electric needs satisfied by purchase from the grid. The heat is used to supplement (or supplant) existing boilers for the purpose of space heating and/or domestic hot water heating. Waste heat can also be routed through absorption chillers for the purpose of space cooling. The key criteria used for screening, however, is the amount of time the system operates at full load and the facility’s ability to use the recovered heat. Facilities with continuous use for large quantities of waste heat are the best candidates for CHP.
A preliminary screening based on heating and electrical demand, siting, and interconnection shows that the facility has a limited to low potential for installing a cost-effective CHP system.

LGEA: Energy Audit Report – Falcon Ness Park 21
7 DEMAND RESPONSE Demand Response (DR) is a program designed to reduce consumer electric load when electric wholesale prices are high or when the reliability of the electric grid is threatened due to peak demand. DR service providers (a.k.a. Curtailment Service Providers) are registered with PJM, the independent system operator (ISO) for mid-Atlantic state region that is charged with maintaining electric grid reliability locally.
Typically an electric customer needs to be capable of reducing their electric demand, within minutes, by at least 100 kW or more in order to participate in a DR program.
Due to a lack of energy use during peak demand hours, there is limited to no opportunity to employ a Demand Response (DR) program.

LGEA: Energy Audit Report – Falcon Ness Park 22
8 PROJECT FUNDING / INCENTIVES The NJCEP is able to provide the incentive programs described below, and others, because of the Societal Benefits Charge (SBC) Fund. The SBC was created by the State of New Jersey’s 1999 Electricity Restructuring Law which requires all customers of investor-owned electric and gas utilities to pay this charge on their monthly energy bills. As a contributor to the fund you were able to participate in the LGEA program and are also eligible to utilize the equipment incentive programs. Also available through the NJBPU are some alternative financing programs described later in this section. Please refer to Figure 15 for a list of the eligible programs identified for each ECM.
Figure 15 - ECM Incentive Program Eligibility
SmartStart (SS) is generally well suited for implementation of individual or small sets of measures, with the flexibility to install projects at your own pace using in-house staff or a preferred contractor. Direct Install (DI) caters to small to mid-size facilities to bundle measures and simplify participation, but requires the use of pre-approved contractors. The Pay for Performance (P4P) program is a “whole-building” energy improvement program designed for larger facilities and requires implementation of multiple measures meeting minimum savings thresholds, as well as use of pre-approved consultants. The Large Energy Users Program (LEUP) is available to New Jersey’s largest energy users giving them flexibility to install as little or as many measures, in a single facility or several facilities, with incentives capped based on the entity’s annual energy consumption; applicants can use in-house staff or preferred contractor.
Generally, the incentive values provided throughout the report assume the SS program is utilized because it provides a consistent comparison of available incentives.
Brief descriptions of all relevant alternative financing and incentive programs are located in the sections below. You may also check the following website for further information, including most current program availability, requirements, and incentive levels: www.NJCleanEnergy.com/CI
8.1 SmartStart
Overview
The SmartStart (SS) program is comprised of New Construction and Retrofit components that offer incentives for installing prescriptive and custom energy efficiency measures at your facility. Routinely the program adds, removes or modifies incentives for various energy efficiency equipment based on national/market trends, new technologies or changes in efficiency baselines.
Prescriptive Equipment Incentives Available:
• Electric Chillers • Electric Unitary HVAC • Gas Cooling • Gas Heating • Gas Water Heating
• Ground Source Heat Pumps • Lighting • Lighting Controls • Refrigeration Doors • Refrigeration Controls
SmartStart Prescriptive
SmartStart Custom
Direct Install
Pay For Performance
Existing Buildings
Large Energy Users
Program
Combined Heat &
Power and Fuel Cell
ECM 1 Install LED Fixtures x
Energy Conservation Measure

LGEA: Energy Audit Report – Falcon Ness Park 23
• Refrigerator/Freezer Motors • Food Service Equipment
• Variable Frequency Drives
All customer sizes and types may be served by this program. This program provides an effective mechanism for securing incentives for individual projects that may be completed at once or over several years.
Incentives
The prescriptive path provides fixed incentives for specific energy efficiency measures whereas the custom measure path provides incentives for unique or specialized technologies that are not addressed through prescriptive offerings.
Since your facility is an existing building, only the Retrofit incentives have been applied in this report. Custom Measure incentives are calculated at $0.16/kWh and $1.60/therm based on estimated annual savings, capped at the lesser of 50% of the total installed incremental project cost, or a buy down to a one year payback. Program incentives are capped at $500,000 per electric account and $500,000 per natural gas account, per fiscal year.
How to Participate
To participate in the SmartStart program you will need to submit an application for the specific equipment to be installed. Many applications are designed as rebates, although others require application approval prior to installation. Applicants may work with a contractor of their choosing and can also utilize internal personnel, which provides added flexibility to the program. Using internal personnel also helps improve the economics of the ECM by reducing the labor cost that is included in the tables in this report.
Detailed program descriptions, instructions for applying and applications can be found at: www.NJCleanEnergy.com/SSB
8.2 SREC Registration Program
The SREC Registration Program (SRP) is used to register the intent to install solar projects in New Jersey. Rebates are not available for solar projects, but owners of solar projects MUST register their projects in the SRP prior to the start of construction in order to establish the project’s eligibility to earn SRECs. Registration of the intent to participate in New Jersey's solar marketplace provides market participants with information about the pipeline of anticipated new solar capacity and insight into future SREC pricing.
After the registration is accepted, construction is complete, and final paperwork has been submitted and is deemed complete, the project is issued a New Jersey certification number which enables it to generate New Jersey SRECs. SREC’s are generated once the solar project has been authorized to be energized by the Electric Distribution Company (EDC).
Each time a solar installation generates 1,000 kilowatt-hours (kWh) of electricity, an SREC is earned. Solar project owners report the energy production to the SREC Tracking System. This reporting allows SREC’s to be placed in the customer's electronic account. SRECs can then be sold on the SREC Tracking System, providing revenue for the first 15 years of the project's life.
Electricity suppliers, the primary purchasers of SRECs, are required to pay a Solar Alternative Compliance Payment (SACP) if they do not meet the requirements of New Jersey’s Solar RPS. One way they can meet the RPS requirements is by purchasing SRECs. As SRECs are traded in a competitive market, the price may

LGEA: Energy Audit Report – Falcon Ness Park 24
vary significantly. The actual price of an SREC during a trading period can and will fluctuate depending on supply and demand.
Information about the SRP can be found at: www.NJCleanEnergy.com/SREC
8.3 Energy Savings Improvement Program
The Energy Savings Improvement Program (ESIP) is an alternate method for New Jersey’s government agencies to finance the implementation of energy conservation measures. An ESIP is a type of “performance contract”, whereby school districts, counties, municipalities, housing authorities and other public and state entities enter in to contracts to help finance building energy upgrades. This is done in a manner that ensures that annual payments are lower than the savings projected from the ECMs, ensuring that ESIP projects are cash flow positive in year one, and every year thereafter. ESIP provides government agencies in New Jersey with a flexible tool to improve and reduce energy usage with minimal expenditure of new financial resources. NJCEP incentive programs can be leveraged to help further reduce the total project cost of eligible measures.
This LGEA report is the first step to participating in ESIP. Next, you will need to select an approach for implementing the desired ECMs:
(1) Use an Energy Services Company or “ESCO”; (2) Use independent engineers and other specialists, or your own qualified staff, to provide and
manage the requirements of the program through bonds or lease obligations; (3) Use a hybrid approach of the two options described above where the ESCO is utilized for some
services and independent engineers, or other specialists or qualified staff, are used to deliver other requirements of the program.
After adopting a resolution with a chosen implementation approach, the development of the Energy Savings Plan (ESP) can begin. The ESP demonstrates that the total project costs of the ECMs are offset by the energy savings over the financing term, not to exceed 15 years. The verified savings will then be used to pay for the financing.
The ESIP approach may not be appropriate for all energy conservation and energy efficiency improvements. Entities should carefully consider all alternatives to develop an approach that best meets their needs. A detailed program descriptions and application can be found at: www.NJCleanEnergy.com/ESIP.
Please note that ESIP is a program delivered directly by the NJBPU and is not an NJCEP incentive program. As mentioned above, you may utilize the incentive programs to help further reduce costs when compiling the ESP. You should refer to the ESIP guidelines at the link above for further information and guidance on next steps.

LGEA: Energy Audit Report – Falcon Ness Park 25
9 ENERGY PURCHASING AND PROCUREMENT STRATEGIES
9.1 Retail Electric Supply Options
In 1999, New Jersey State Legislature passed the Electric Discount & Energy Competition Act (EDECA) to restructure the electric power industry in New Jersey. This law deregulated the retail electric markets, allowing all consumers to shop for service from competitive electric suppliers. The intent was to create a more competitive market for electric power supply in New Jersey. As a result, utilities were allowed to charge Cost of Service and customers were given the ability to choose a third party (i.e. non-utility) energy supplier.
Energy deregulation in New Jersey has increased energy buyers’ options by separating the function of electricity distribution from that of electricity supply. So, though you may choose a different company from which to buy your electric power, responsibility for your facility’s interconnection to the grid and repair to local power distribution will still reside with the traditional utility company serving your region.
If your facility is not purchasing electricity from a third party supplier, consider shopping for a reduced rate from third party electric suppliers. If your facility is purchasing electricity from a third party supplier, review and compare prices at the end of the current contract or every couple years.
A list of third party electric suppliers, who are licensed by the state to provide service in New Jersey, can be found online at: www.state.nj.us/bpu/commercial/shopping.html.
9.2 Retail Natural Gas Supply Options
The natural gas market in New Jersey has also been deregulated. Most customers that remain with the utility for natural gas service pay rates that are market-based and that fluctuate on a monthly basis. The utility provides basic gas supply service (BGSS) to customers who choose not to buy from a Third Party Supplier for natural gas commodity.
A customer’s decision about whether to buy natural gas from a retail supplier is typically dependent upon whether a customer seeks budget certainty and/or longer-term rate stability. Customers can secure longer-term fixed prices by signing up for service through a third party retail natural gas supplier. Many larger natural gas customers may seek the assistance of a professional consultant to assist in their procurement process.
If your facility is not purchasing natural gas from a third party supplier, consider shopping for a reduced rate from third party natural gas suppliers. If your facility is purchasing natural gas from a third party supplier, review and compare prices at the end of the current contract or every couple years.
A list of third party natural gas suppliers, who are licensed by the state to provide service in New Jersey, can be found online at: www.state.nj.us/bpu/commercial/shopping.html.

Local Government Energy Audit – Falcon Ness Park A-1
Appendix A: Equipment Inventory & Recommendations Lighting Inventory & Recommendations
LocationFixture
QuantityFixture Description
Control System
Watts per Fixture
Annual Operating
Hours
Fixture Recommendation
Add Controls?
Fixture Quantity
Fixture DescriptionControl System
Watts per Fixture
Annual Operating
Hours
Total Peak kW Savings
Total AnnualkWh
Savings
Total Annual MMBtu
Savings
Total Annual Energy Cost
Savings
Total Installation
Cost
Total Incentives
Simple Payback w/ Incentivesin Years
Field 18 Metal Halide: (1) 1500W Lamp None 1,610 128 Fix ture Replacement No 18LED - Fix tures: Outdoor Pole/Arm-Mounted
Area/Roadway Fix tureNone 400 128 17.72 3,150 0.0 $1,325.97 $35,153.87 $1,800.00 25.15
Field 12 Metal Halide: (1) 1500W Lamp None 1,610 128 Fix ture Replacement No 12LED - Fix tures: Outdoor Pole/Arm-Mounted
Area/Roadway Fix tureNone 400 128 11.81 2,100 0.0 $883.98 $23,435.92 $1,200.00 25.15
Field 14 Metal Halide: (1) 1500W Lamp None 1,610 128 Fix ture Replacement No 14LED - Fix tures: Outdoor Pole/Arm-Mounted
Area/Roadway Fix tureNone 400 128 13.78 2,450 0.0 $1,031.31 $27,341.90 $1,400.00 25.15
Field 8 Metal Halide: (1) 1500W Lamp None 1,610 128 Fix ture Replacement No 8LED - Fix tures: Outdoor Pole/Arm-Mounted
Area/Roadway Fix tureNone 400 128 7.88 1,400 0.0 $589.32 $15,623.94 $800.00 25.15
Field 7 Metal Halide: (1) 1500W Lamp None 1,610 128 Fix ture Replacement No 7LED - Fix tures: Outdoor Pole/Arm-Mounted
Area/Roadway Fix tureNone 400 128 6.89 1,225 0.0 $515.66 $13,670.95 $700.00 25.15
Field 4 Metal Halide: (1) 1500W Lamp None 1,610 128 Fix ture Replacement No 4LED - Fix tures: Outdoor Pole/Arm-Mounted
Area/Roadway Fix tureNone 400 128 3.94 700 0.0 $294.66 $7,811.97 $400.00 25.15
Concessions 1 Metal Halide: (1) 175W Lamp None 215 672 Fix ture Replacement No 1LED - Fix tures: Outdoor Wall-Mounted Area
Fix tureNone 70 672 0.12 110 0.0 $46.35 $390.68 $100.00 6.27
Concessions 1 Linear Fluorescent - T8: 4' T8 (32W) - 2L Wall Switch 62 134 None No 1 Linear Fluorescent - T8: 4' T8 (32W) - 2L Wall Switch 62 134 0.00 0 0.0 $0.00 $0.00 $0.00 0.00
Existing Conditions Proposed Conditions Energy Impact & Financial Analysis

Local Government Energy Audit – Falcon Ness Park A-2
Plug Load Inventory
Location Quantity Equipment DescriptionEnergy
Rate(W)
ENERGY STAR
Qualified?Concession 1 hotdog heater 800.0 NoConcession 1 hotplate 1,100.0 NoConcession 1 Crockpot 1,200.0 NoConcession 1 Refrigerator 500.0 NoConcession 1 Freezer 180.0 NoConcession 1 Refrigerator 250.0 No
Existing Conditions
Local Government Energy Audit – Falcon Ness Park B-1
Appendix B: EPA Statement of Energy Performance