local government energy audit - nj clean energy participant lists/lgea...the intent of this energy...
TRANSCRIPT

Local Government Energy Audit: Energy Audit Report
Copyright ©2016 TRC Energy Services. All rights reserved.
Reproduction or distribution of the whole, or any part of the contents of this document without written permission of TRC is prohibited. Neither TRC nor any of its employees makes any warranty, express or implied, or assumes any legal liability or responsibility for the accuracy, completeness, or usefulness of any data, information, method, product or process disclosed in this document, or represents that its use will not infringe upon any privately‐owned rights, including but not limited to, patents, trademarks or copyrights.
Clayton High School Clayton Public Schools 350 East Clinton Street Clayton, NJ 08312 September 5, 2017 Report by: TRC Energy Services

9/5/2017
Disclaimer The intent of this energy analysis report is to identify energy savings opportunities associated with recommended upgrades to the facility’s systems at this site. Approximate savings are included in this report to make decisions about reducing energy use at the facility. This report, however, is not intended to serve as a detailed engineering design document. It should be noted that detailed design efforts are required in order to implement several of the improvements evaluated as part of this energy analysis.
The energy conservation measures and estimates of energy consumption contained in this report have been reviewed for technical accuracy. However, all estimates contained herein of energy consumption at the site are not guaranteed, because energy consumption ultimately depends on behavioral factors, the weather, and many other uncontrollable variables. The energy assessor and New Jersey Board of Public Utilities (NJBPU) shall in no event be liable should the actual energy consumption vary from the estimated consumption shown herein.
Estimated installation costs are based on a variety of sources, including our own experience at similar facilities, our own pricing research using local contractors and vendors, and cost estimating handbooks such as those provided by RS Means. The cost estimates represent our best judgment for the proposed action. The Owner is encouraged to independently confirm these cost estimates and to obtain multiple estimates when considering measure installations. Since actual installed costs can vary widely for a particular installation, and for conditions which cannot be known prior to in‐depth investigation and design, the energy assessor does not guarantee installed cost estimates and shall in no event be liable should actual installed costs vary from the estimated costs herein.
New Jersey’s Clean Energy Program (NJCEP) incentive values provided in this report are estimates and are based on program information available at the time this report is written. The NJBPU reserves the right to extend, modify, or terminate programs without prior or further notice, including incentive levels and eligibility requirements. The Owner should review available program incentives and requirements prior to selecting and/or installing recommended measures.
LGEA: Energy Audit Report – Clayton High School 3
Table of Contents
1 Executive Summary ....................................................................................................................... 6
1.1 Facility Summary ....................................................................................................................... 6 1.2 Your Cost Reduction Opportunities........................................................................................... 7
Energy Conservation Measures .......................................................................................................................... 7 Energy Efficient Practices ................................................................................................................................... 8 Self‐Generation Measures ................................................................................................................................. 9
1.3 Implementation Planning .......................................................................................................... 9
2 Facility Information and Existing Conditions ................................................................................ 11
2.1 Project Contacts ...................................................................................................................... 11 2.2 General Site Information ......................................................................................................... 11 2.3 Building Occupancy ................................................................................................................. 12 2.4 Building Envelope .................................................................................................................... 12 2.5 On‐site Generation .................................................................................................................. 12 2.6 Energy‐Using Systems ............................................................................................................. 13
Lighting System ................................................................................................................................................ 13 Hot Water / Steam System ............................................................................................................................... 13 Air Conditioning (DX) ........................................................................................................................................ 14 Building Energy Management System ............................................................................................................. 14 Domestic Hot Water ......................................................................................................................................... 15 Food Service & Laundry Equipment ................................................................................................................. 15 Refrigeration .................................................................................................................................................... 16 Plug Load & Vending Machines ........................................................................................................................ 16
2.7 Water‐Using Systems .............................................................................................................. 16
3 Site Energy Use and Costs ............................................................................................................ 17
3.1 Total Cost of Energy ................................................................................................................ 17 3.2 Electricity Usage ...................................................................................................................... 18 3.3 Natural Gas Usage ................................................................................................................... 19 3.4 Benchmarking .......................................................................................................................... 20 3.5 Energy End‐Use Breakdown .................................................................................................... 21
4 Energy Conservation Measures .................................................................................................... 22
4.1 Recommended ECMs .............................................................................................................. 22 4.1.1 Lighting Upgrades .................................................................................................................... 23
ECM 1: Install LED Fixtures ............................................................................................................................... 23 ECM 2: Retrofit Fixtures with LED Lamps ......................................................................................................... 23 ECM 3: Install LED Exit Signs ............................................................................................................................. 24
4.1.2 Lighting Control Measures ...................................................................................................... 25
ECM 4: Install Occupancy Sensor Lighting Controls ......................................................................................... 25
4.1.3 Variable Frequency Drive Measures ....................................................................................... 26
ECM 5: Install VFDs on Hot Water Pumps ........................................................................................................ 26

LGEA: Energy Audit Report – Clayton High School 4
4.1.4 Domestic Water Heating Upgrade .......................................................................................... 26
ECM 6: Install Low‐Flow DHW Devices ............................................................................................................. 27
4.1.5 Plug Load Equipment Control ‐ Vending Machine .................................................................. 27
ECM 7: Vending Machine Control .................................................................................................................... 27
5 Energy Efficient Practices ............................................................................................................. 28
Reduce Air Leakage .......................................................................................................................................... 28 Close Doors and Windows ............................................................................................................................... 28 Perform Proper Lighting Maintenance ............................................................................................................. 28 Ensure Lighting Controls Are Operating Properly ............................................................................................ 28 Perform Routine Motor Maintenance ............................................................................................................. 28 Ensure Economizers are Functioning Properly ................................................................................................. 29 Assess Chillers & Request Tune‐Ups ................................................................................................................ 29 Clean Evaporator/Condenser Coils on AC Systems .......................................................................................... 29 Clean and/or Replace HVAC Filters .................................................................................................................. 29 Check for and Seal Duct Leakage ..................................................................................................................... 29 Perform Proper Boiler Maintenance ................................................................................................................ 29 Perform Proper Water Heater Maintenance ................................................................................................... 30 Plug Load Controls............................................................................................................................................ 30 Water Conservation ......................................................................................................................................... 30
6 Self‐Generation Measures ........................................................................................................... 31
6.1 Photovoltaic............................................................................................................................. 31 6.2 Combined Heat and Power ..................................................................................................... 32
7 Project Funding / Incentives ........................................................................................................ 34
7.1 SmartStart ............................................................................................................................... 35 7.2 Pay for Performance ‐ Existing Buildings ................................................................................. 36 7.3 Energy Savings Improvement Program ................................................................................... 37
8 Energy Purchasing and Procurement Strategies ........................................................................... 38
8.1 Retail Electric Supply Options.................................................................................................. 38 8.2 Retail Natural Gas Supply Options .......................................................................................... 38
Appendix A: Equipment Inventory & Recommendations
Appendix B: ENERGY STAR Statement of Energy Performance
LGEA: Energy Audit Report – Clayton High School 5
Table of Figures
Figure 1 – Previous 12 Month Utility Costs ................................................................................................... 7
Figure 2 – Potential Post‐Implementation Costs .......................................................................................... 7
Figure 3 – Summary of Energy Reduction Opportunities ............................................................................. 8
Figure 4 – Project Contacts ......................................................................................................................... 11
Figure 5 ‐ Building Schedule ........................................................................................................................ 12
Figure 6 ‐ Utility Summary .......................................................................................................................... 17
Figure 7 ‐ Energy Cost Breakdown .............................................................................................................. 17
Figure 8 ‐ Electric Usage & Demand ............................................................................................................ 18
Figure 9 ‐ Electric Usage & Demand ............................................................................................................ 18
Figure 10 ‐ Natural Gas Usage ..................................................................................................................... 19
Figure 11 ‐ Natural Gas Usage ..................................................................................................................... 19
Figure 12 ‐ Energy Use Intensity Comparison – Existing Conditions........................................................... 20
Figure 13 ‐ Energy Use Intensity Comparison – Following Installation of Recommended Measures ........ 20
Figure 14 ‐ Energy Balance (% and kBtu/SF) ............................................................................................... 21
Figure 15 – Summary of Recommended ECMs ........................................................................................... 22
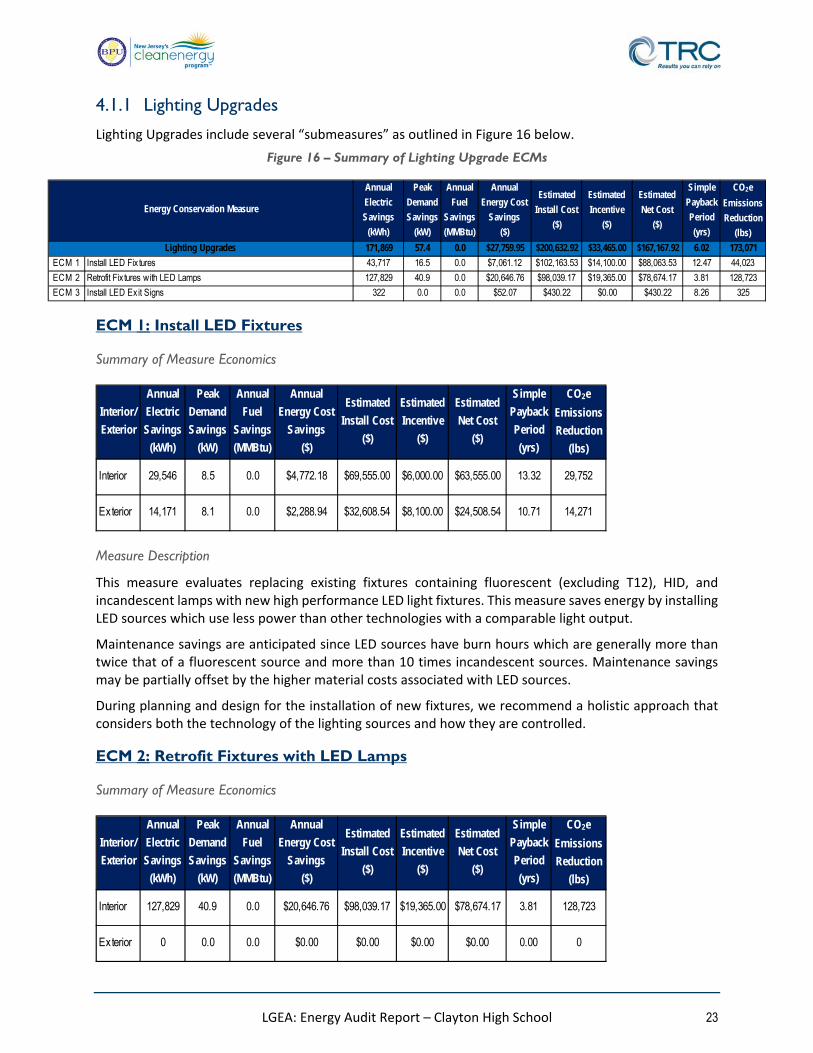
Figure 16 – Summary of Lighting Upgrade ECMs ........................................................................................ 23
Figure 17 – Summary of Lighting Control ECMs ......................................................................................... 25
Figure 18 – Summary of Variable Frequency Drive ECMs .......................................................................... 26
Figure 19 ‐ Summary of Domestic Water Heating ECMs ............................................................................ 26
Figure 20 ‐ Photovoltaic Screening ............................................................................................................. 31
Figure 21 ‐ Combined Heat and Power Screening ...................................................................................... 33
Figure 22 ‐ ECM Incentive Program Eligibility ............................................................................................. 34

LGEA: Energy Audit Report – Clayton High School 6
1 EXECUTIVE SUMMARY The New Jersey Board of Public Utilities (NJBPU) has sponsored this Local Government Energy Audit (LGEA) Report for Clayton Public Schools.
The goal of a LGEA is to provide you with information on how your facility uses energy, identify energy conservation measures (ECMs) that can reduce your energy use, and put you in a position to implement the ECMs. The LGEA also sets you on the path to receive financial incentives from New Jersey’s Clean Energy Program (NJCEP) for implementing the ECMs.
This study was conducted by TRC Energy Services, as part of a comprehensive effort to assist New Jersey local government in controlling energy costs and protecting our environment by offering a full spectrum of energy management options.
1.1 Facility Summary
Clayton Public Schools form a comprehensive community public school district that serves students in pre‐kindergarten through 12th grade from the town of Clayton, located in Gloucester County, New Jersey. The schools provide a variety of opportunities for students in academics, co‐curricular activities, athletics, communication, technology, fine and performing arts, and schools‐base student services.
The Clayton High School complex houses the Clayton Board of Education, the middle school (grade 6‐8), and the high school (grade 9‐12). The school complex is a 150,000 square foot facility comprised of various space types. The building was constructed in 1950. The building is a single floor and includes classrooms, offices, a gymnasium, an auditorium, a cafeteria, a library, a kitchen, locker rooms, a maintenance shop and storage. The building’s foundation consists of concrete perimeter foundation. Exterior walls are finished with brick masonry. The building has a flat roof covered with a black membrane that is in good condition. The roof top membrane was recently replaced. The windows throughout the facility are double pane single hung. They are in good condition and show no signs of outside air infiltration. Exterior doors are constructed of metal and are in good condition. Clayton Public Schools installed a 260 kW solar energy project in 2010. The project includes photovoltaic (PV) arrays on the roof.
The facility interior lighting system consists mainly of T8 fluorescent lamps and fixtures with both electronic and magnetic ballasts. Lighting control is provided by both occupancy sensors (high school portion of building) and manual wall switches (middle school and Board of Education portions of building). Exit signs throughout the facility are LED fixtures. The facility has exterior lighting which consists of high intensity discharge (HID) and compact fluorescent and are controlled with photocells. The facility’s HVAC system consists of two (2) Weil McLain non‐condensing gas‐fired boiler, (2) Aerco condensing gas‐fired boiler and 23 roof top units (RTUs) ranging from 2 to 25 tons they are controlled by a building energy management system located in the boiler room. A portions of the school classrooms have unit ventilators that are equipped with hot water coils for space heating and DX coils for cooling and dehumidification.
A thorough description of the facility and our observations are located in Section 2, “Facility Information and Existing Conditions”.

LGEA: Energy Audit Report – Clayton High School 7
1.2 Your Cost Reduction Opportunities
Energy Conservation Measures
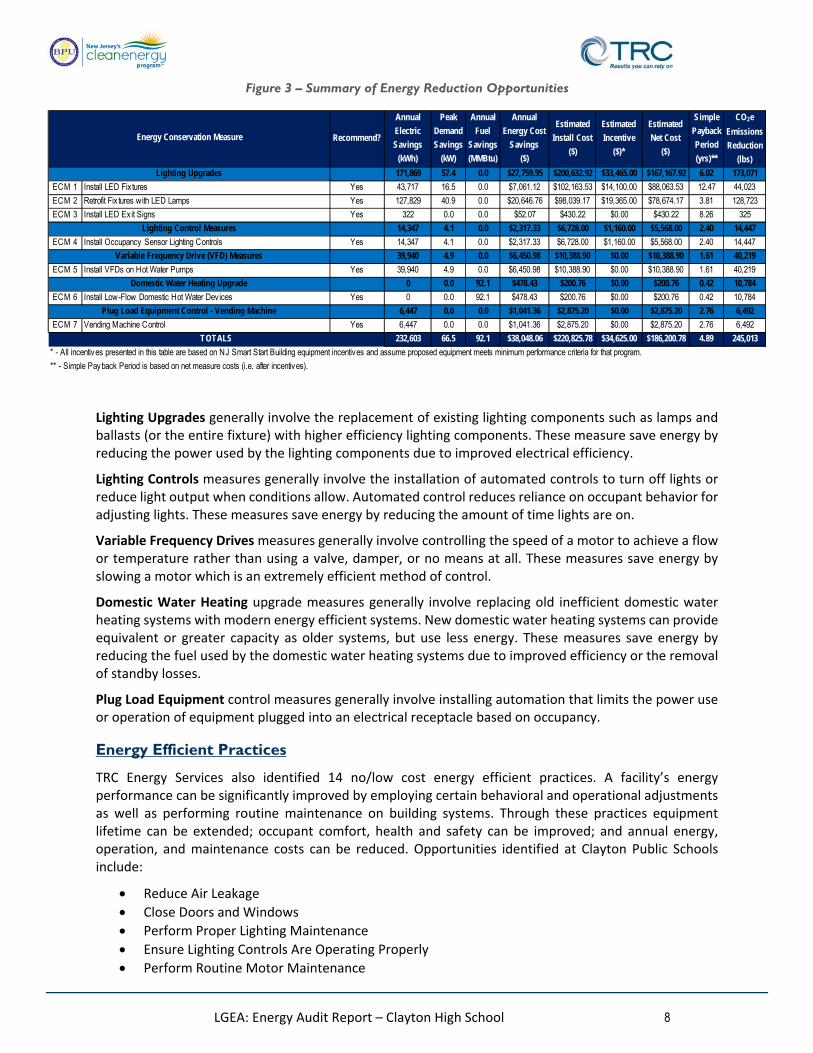
TRC Energy Services evaluated seven (7) projects which represent an opportunity for Clayton High School to reduce annual energy costs by roughly $38,048 and annual greenhouse gas emissions by 245,013 lbs CO2e. The measures would pay for themselves in roughly 4.89 years. The breakdown of existing and potential utility costs is illustrated in Figure 1 and Figure 2, respectively. These projects represent an opportunity to reduce Clayton High School’s annual energy use by 15%.
Figure 1 – Previous 12 Month Utility Costs
Figure 2 – Potential Post-Implementation Costs
A detailed description of Clayton High School’s existing energy use can be found in Section 3, “Site Energy Use and Costs”.
The evaluated measures have been listed and grouped into major categories as shown in Figure 3. Brief descriptions of the categories can be found below and descriptions of the individual opportunities can be found in Section 4, “Energy Conservation Measures”. Measures without an “ECM #” in the table below have been evaluated, but are not recommended for implementation.
Electric$258,394
90%
Gas$29,95910%
$288,352
Electric$215,711
88%
Gas$29,48012%
$245,191
LGEA: Energy Audit Report – Clayton High School 8
Figure 3 – Summary of Energy Reduction Opportunities
Lighting Upgrades generally involve the replacement of existing lighting components such as lamps and ballasts (or the entire fixture) with higher efficiency lighting components. These measure save energy by reducing the power used by the lighting components due to improved electrical efficiency.
Lighting Controls measures generally involve the installation of automated controls to turn off lights or reduce light output when conditions allow. Automated control reduces reliance on occupant behavior for adjusting lights. These measures save energy by reducing the amount of time lights are on.
Variable Frequency Drives measures generally involve controlling the speed of a motor to achieve a flow or temperature rather than using a valve, damper, or no means at all. These measures save energy by slowing a motor which is an extremely efficient method of control.
Domestic Water Heating upgrade measures generally involve replacing old inefficient domestic water heating systems with modern energy efficient systems. New domestic water heating systems can provide equivalent or greater capacity as older systems, but use less energy. These measures save energy by reducing the fuel used by the domestic water heating systems due to improved efficiency or the removal of standby losses.
Plug Load Equipment control measures generally involve installing automation that limits the power use or operation of equipment plugged into an electrical receptacle based on occupancy.
Energy Efficient Practices
TRC Energy Services also identified 14 no/low cost energy efficient practices. A facility’s energy performance can be significantly improved by employing certain behavioral and operational adjustments as well as performing routine maintenance on building systems. Through these practices equipment lifetime can be extended; occupant comfort, health and safety can be improved; and annual energy, operation, and maintenance costs can be reduced. Opportunities identified at Clayton Public Schools include:
Reduce Air Leakage
Close Doors and Windows
Perform Proper Lighting Maintenance
Ensure Lighting Controls Are Operating Properly
Perform Routine Motor Maintenance
Recommend?
Annual
Electric
Savings
(kWh)
Peak
Demand
Savings
(kW)
Annual
Fuel
Savings
(MMBtu)
Annual
Energy Cost
Savings
($)
Estimated
Install Cost
($)
Estimated
Incentive
($)*
Estimated
Net Cost
($)
Simple
Payback
Period
(yrs)**
CO2e
Emissions
Reduction
(lbs)
171,869 57.4 0.0 $27,759.95 $200,632.92 $33,465.00 $167,167.92 6.02 173,071
ECM 1 Install LED Fixtures Yes 43,717 16.5 0.0 $7,061.12 $102,163.53 $14,100.00 $88,063.53 12.47 44,023
ECM 2 Retrofit Fix tures with LED Lamps Yes 127,829 40.9 0.0 $20,646.76 $98,039.17 $19,365.00 $78,674.17 3.81 128,723
ECM 3 Install LED Ex it Signs Yes 322 0.0 0.0 $52.07 $430.22 $0.00 $430.22 8.26 325
14,347 4.1 0.0 $2,317.33 $6,728.00 $1,160.00 $5,568.00 2.40 14,447
ECM 4 Install Occupancy Sensor Lighting Controls Yes 14,347 4.1 0.0 $2,317.33 $6,728.00 $1,160.00 $5,568.00 2.40 14,447
39,940 4.9 0.0 $6,450.98 $10,388.90 $0.00 $10,388.90 1.61 40,219
ECM 5 Install VFDs on Hot Water Pumps Yes 39,940 4.9 0.0 $6,450.98 $10,388.90 $0.00 $10,388.90 1.61 40,219
0 0.0 92.1 $478.43 $200.76 $0.00 $200.76 0.42 10,784
ECM 6 Install Low-Flow Domestic Hot Water Devices Yes 0 0.0 92.1 $478.43 $200.76 $0.00 $200.76 0.42 10,784
6,447 0.0 0.0 $1,041.36 $2,875.20 $0.00 $2,875.20 2.76 6,492
ECM 7 Vending Machine Control Yes 6,447 0.0 0.0 $1,041.36 $2,875.20 $0.00 $2,875.20 2.76 6,492
232,603 66.5 92.1 $38,048.06 $220,825.78 $34,625.00 $186,200.78 4.89 245,013
* - All incentives presented in this table are based on NJ Smart Start Building equipment incentives and assume proposed equipment meets minimum performance criteria for that program.
** - Simple Payback Period is based on net measure costs (i.e. after incentives).
Energy Conservation Measure
Domestic Water Heating Upgrade
Plug Load Equipment Control - Vending Machine
Lighting Upgrades
Lighting Control Measures
Variable Frequency Drive (VFD) Measures
TOTALS

LGEA: Energy Audit Report – Clayton High School 9
Ensure Economizers are Functioning Properly
Assess Chillers & Request Tune‐Ups
Clean Evaporator/Condenser Coils on AC Systems
Clean and/or Replace HVAC Filters
Check for and Seal Duct Leakage
Perform Proper Boiler Maintenance
Perform Proper Water Heater Maintenance
Install Plug Load Controls
Water Conservation
For details on these Energy Efficient Practices, please refer to Section 5.
Self-Generation Measures
TRC evaluated the potential for installing self‐generation sources for Clayton High School. Based on the configuration of the site and its loads there is a low potential for installing any additional PV or combined heat and power self‐generation measures.
For details on our evaluation and the self‐generation potential, please refer to section 6.
1.3 Implementation Planning
To realize the energy savings from the ECMs listed in this report, the equipment changes outlined for each ECM need to be selected and installed through project implementation. One of the first considerations is if there is capital available for project implementation. Another consideration is whether to pursue individual ECMs, a group of ECMs, or a comprehensive approach wherein all ECMs are pursued, potentially in conjunction with other facility projects or improvements.
Rebates, incentives, and financing are available from the NJBPU, Clean Energy Program, as well as some of the state’s investor‐owned utilities, to help reduce the costs associated with the implementation of energy efficiency projects. Prior to implementing a project, please review the appropriate incentive program guidelines before proceeding. This is important because in most cases you will need to submit an application for the incentives before purchasing materials and beginning installation.
The ECMs outlined in this report may qualify under the following program(s):
SmartStart
Pay for Performance ‐ Existing Building (P4P EB)
Energy Savings Improvement Program (ESIP)
For facilities with capital available for implementation of selected individual measures or phasing implementation of selected measures over multiple years, incentives are available through the SmartStart program. To participate in this program you may utilize internal resources, or an outside firm or contractor, to design the ECM(s), select the equipment and apply for the incentive(s). Program pre‐approval is required for some SS incentives, so only after receiving approval may the ECM(s) be installed. The incentive values listed above in Figure 3 represent the SmartStart program and will be explained further in Section 7, as well as the other programs as mentioned below.
For facilities with capital available and an interest in a comprehensive, holistic approach to energy conservation should consider participating in the P4P EB program. This program has minimum savings requirements and the incentives are based on actual measured performance savings. The application

LGEA: Energy Audit Report – Clayton High School 10
process is more involved, and requires working with an eligible contractor, but may result in more lucrative incentives up to 50% of total project cost.
For facilities without capital available to implement ECMs, project financing may be available through the Energy Savings Improvement Program (ESIP). Supported directly by the NJBPU, ESIP provides government agencies with external project development, design, and implementation services as well as financing for implementing ECMs. This LGEA report is the first step for participating in ESIP and should help you determine next steps. Refer to Section 7.3 for additional information on the ESIP Program.
The Demand Response Energy Aggregator is a program (non‐NJCEP) designed to reduce consumer electric load when wholesale electricity prices are high or when the reliability of the electric grid is threatened due to peak demand. Demand Response (DR) service providers (a.k.a. Curtailment Service Providers) are registered with PJM, the independent system operator (ISO) for mid‐Atlantic state region that is charged with maintaining electric grid reliability locally. By enabling grid operators to call upon Curtailment Service Providers and energy consumers to reduce electric usage during times of peak demand, the grid is made more reliable and overall transmission costs are reduced for all ratepayers. Curtailment Service Providers provide regular payments to medium and large consumers of electric power for their participation in Demand Response programs. Program participation is voluntary and participants will receive payments whether or not their facility is called upon to curtail their load. Refer to Section Error! Reference source not found. for additional information on this program.
Additional descriptions of all relevant incentive programs are located in Section 7 or www.njcleanenergy.com/ci. To ensure projects are implemented such that maximum savings and incentives are achieved, bids and specifications should be reviewed by your procurement personnel and/or consultant(s) to ensure that selected equipment coincides with LGEA recommendations, as well as applicable incentive program guidelines and requirements.

LGEA: Energy Audit Report – Clayton High School 11
2 FACILITY INFORMATION AND EXISTING CONDITIONS
2.1 Project Contacts Figure 4 – Project Contacts
2.2 General Site Information
On October 10, 2016, TRC performed an energy audit at Clayton High School located in Clayton, New Jersey. TRC’s auditor met with Facilities Technician Ted Bowman, to review the facility operations and focus the investigation on specific energy‐using systems.
Clayton Public Schools form a comprehensive community public school district that serves students in pre‐kindergarten through twelfth (12th) grade. The schools provide a variety of opportunities for students in academics, co‐curricular activities, athletics, communication, technology, fine and performing arts, and schools‐base student services.
The Clayton High School complex houses the Clayton Board of Education, the middle school (grades 6‐8), and the high school (grades 9‐12). The school complex is a 150,000 square foot facility comprised of various space types. The building was constructed in 1950. The building is a single floor and includes classrooms, offices, a gymnasium, an auditorium, a cafeteria, a library, a kitchen, locker rooms, a maintenance shop and storage. The building’s foundation consists of concrete perimeter foundation. Exterior walls are finished with brick masonry. The building has a flat roof covered with a black membrane that is in good condition. The roof top membrane was recently replaced. The windows throughout the facility are double pane single hung. They are in good condition and show no signs of outside air infiltration. Exterior doors are constructed of metal and are in good condition. Clayton Public Schools installed a 260 kW solar energy project in 2010. The project included photovoltaic (PV) arrays on the roof.
The facility interior lighting system consists mainly of T8 fluorescent lamps and fixtures with both electronic and magnetic ballasts. Lighting control is provided by both occupancy sensors (High School portions) and manual wall switches (middle school and Board of Education portions). Exit signs throughout the facility are LED fixtures. The facility has exterior lighting which consists of high intensity discharge (HID) and compact fluorescent and are controlled with photocells. The facility’s HVAC system consists of two (2) Weil McLain non‐condensing gas‐fired boiler, two (2) Aerco condensing gas‐fired boiler and 23 roof top units (RTUs) ranging from 2 to 25 tons, they are controlled by a building energy management
Name Role E-Mail Phone #
Fran Adler Business Administrator [email protected] (856) 881-8700 Ext.3056
Ted Bowman Facility Technician [email protected] (609) 805-7812
Moussa Traore Auditor [email protected] (732) 855-2879
Customer
Designated Representative
TRC Energy Services

LGEA: Energy Audit Report – Clayton High School 12
system located in the boiler room. A portions of the school classrooms have unit ventilators that are equipped with hot water coils for space heating and DX coils for cooling and dehumidification.
2.3 Building Occupancy
The school building is open Monday through Saturday. The typical schedule is presented in the table below
Figure 5 - Building Schedule
2.4 Building Envelope
The building’s foundation consists of concrete perimeter foundation. Exterior walls are finished with brick masonry. The building has a flat roof covered with a black membrane that is in good condition. There are several solar panels installed on the roof.
The windows throughout the facility are a combination of fixed pane windows and small operable windows for ventilation. The windows are double pane with slightly tinted glass that are in good condition and show no signs of outside air infiltration. Exterior doors are constructed of metal and in good condition. The building envelop was found to be in good condition. The building envelope is in good condition.
2.5 On-site Generation
The Clayton Board of Education installed a 260 kW solar energy project in 2010. The project included photovoltaic (PV) arrays on the roof.

LGEA: Energy Audit Report – Clayton High School 13
2.6 Energy-Using Systems
Lighting System
The facility interior lighting system consists mainly of T8 fluorescent lamps and fixtures with both electronic and magnetic ballasts. Most of the building spaces use 2, 3, and 4‐lamp, 4‐foot long recessed troffers with diffusers. The gymnasium and auxiliary gymnasium are lit with 400 Watts and 250 Watts high intensity discharge (HID) lamps respectively. The library has 12 recessed compact fluorescent lamps. The remaining area of the school complex is lit with T8 fluorescent lamps and fixtures. Lighting control is provided by both occupancy sensors (high school portions) and manual wall switches (middle school and Board of Education portions). The facility perimeter and parking lot lighting consists of HID and halogen incandescent and are controlled with photocells.
Significant energy saving could be achieved by replacing the existing lighting system with LED linear tubes and LED lamps fixtures. Installing occupancy sensors in select areas will yield additional energy savings
Hot Water / Steam System
The hot water system consists of two (2)Areco 975 kBtu/hr output, condensing hot water boilers and two (2) Weil McLain 4,090 Kbtu/hr output, non‐condensing hot water boilers The boilers have a nominal combustion efficiency of 92% and 84% respectively. Hot water is supplied at 180°F when the outside air temperature is below 50°F and the setpoint is reset to 155°F when the outside air is above 65°F. Each boiler plant is outfitted with hot water circulating pumps. The boilers provide hot water to air handlers and the classrooms unit ventilators that are equipped with hot water coils for space heating and DX coils for cooling and dehumidification. They are controlled by an Aerco building energy management system located in the boiler room. The boilers are in good condition and well maintained.

LGEA: Energy Audit Report – Clayton High School 14
Air Conditioning (DX)
There are a total of 23 roof top units (RTUs) ranging from 2 to 25 tons. The main gymnasium and the auxiliary gymnasium have two (2) 25‐ton and two 10‐ton carrier packaged AC units. The cafeteria and the kitchen have one 25‐ton Aaon packaged AC and one‐7.5 ton Reznor packaged AC. The Board of Education offices have two 3‐ton Lennox packaged AC. The Aaon rooftop units are high efficiency packaged systems with built‐in energy recovery wheels, airside economizer functionality, premium efficiency motors and high efficiency compressors with R410a refrigerant.
A large portion of the facility classrooms are heated and cooled with based mounted unit ventilators. The main gymnasium make‐up air is provided by one Greenheck unit equipped with a heating coil only. The high school bathrooms also have one Greenheck make‐up air unit equipped with both a heating and cooling coil. The facility also has ductless split air conditioners providing supplemental cooling to the various spaces including main server room, classrooms 202, 204, 206, 208, and kitchen.
Air is exhausted from the toilet rooms, corridors, classrooms, meeting and dining areas through the roof exhausters. Some of the exhaust fans are interlocked with the economizer fans and dampers of the rooftop air conditioners. The exhaust fans operate based on the facility occupancy schedule. All the units appear to be in good condition.
Building Energy Management System
The majority of the facility is controlled with an Aerco building energy management system (BMS). It is a computerized HVAC controller that operates the direct digital control (DDC) system.

LGEA: Energy Audit Report – Clayton High School 15
Domestic Hot Water
The domestic hot water system for the facility consists of three (3) A. O. Smith gas‐fired condensing hot water heaters with an input rating of 250 kBtu/hr each and a nominal efficiency of 95%. One (1) additional Bradford White gas‐fired non‐condensing hot water heater with an input rating of 60 Kbtu/hr and a nominal efficiency of 68% serves a portion of the high school.
The Board of Education break room and bathroom have 5 gallon and 2.5 gallon electric water heater. Domestic water heater distribution pipe is improperly sized in this portion of the building.
Food Service & Laundry Equipment
The school has a mixed electric and gas fired kitchen that is used to prepare approximately 500 lunches per day for the students. The ovens, range tops and griddle are all gas fired.

LGEA: Energy Audit Report – Clayton High School 16
Refrigeration
There are two cold storage areas: a walk‐in cooler area and a walk‐in freezer area. The cooler area is maintained at a constant temperature of 40°F and the freezer area is maintained at a constant 0°F.
The cooler area is served by four (4) evaporators and the freezer area is served by two (2) evaporators each having a single 1/2 HP fan. There are two (2) 5 HP condensing units with reciprocating compressors connected to evaporators serving the cooler section and there is a single 5 HP condensing units connected to evaporators serving the freezer area. The kitchen also has five (5) free standing commercial size freezers and one commercial ice machine.
Plug Load & Vending Machines
There are 325 computer work stations throughout the facility, roughly 99% of which are desktop units with LCD monitors.
In addition to the main server, there are several server closets scattered throughout the facility. The main server has a dedicated 1.5 ton Daikin Industries split system. The remaining use air provided by the main RTUs. The facility has 4 refrigerated beverage vending machines.
2.7 Water-Using Systems
There are 18 restrooms at this facility. A sampling of restrooms found that all of the faucets are rated for 2.5 gpm, the toilets are rated at 2.2 gallons per flush and the urinals are rated at 2 gallons per flush. The kitchen has faucets that are rated for 3.5 gpm. The bathrooms are clean and well maintained.

LGEA: Energy Audit Report – Clayton High School 17
3 SITE ENERGY USE AND COSTS Utility data for electricity and natural gas was analyzed to identify opportunities for savings. In addition, data for electricity and natural gas was evaluated to determine the annual energy performance metrics for the building in energy cost/ft2 and energy use/ft2. These energy use indices are indicative of the relative energy effectiveness of this building. There are a number of factors that could cause the energy use of this building to vary from the “typical” energy use for other facilities identified as: school (K‐12). Specific local climate conditions, daily occupancy hours of the facility, seasonal fluctuations in occupancy, daily operating hours of energy use systems, and the behavior of the occupants with regard to operating systems that impact energy use such as turning off appliances and leaving windows open. Please refer to the Benchmarking section within Section 3.4 for additional information.
3.1 Total Cost of Energy
The following energy consumption and cost data is based on the last 12 month period of utility usage data that was provided for each utility. The annual consumption and cost was developed from this information.
Figure 6 - Utility Summary
The current utility cost for this site is $288,352 as shown in the chart below.
Figure 7 - Energy Cost Breakdown
Usage Cost
1,565,208 kWh $258,394
57,672 Therms $29,959
$288,352
Natural Gas
Total
Electricity
Utility Summary for Clayton Public School
Fuel
Electric$258,394
90%
Gas$29,95910%
$288,352

LGEA: Energy Audit Report – Clayton High School 18
3.2 Electricity Usage
Electricity is provided by Atlantic City Electric. The average electric cost (combined for commodity, transmission and distribution) for the past 12 months is $0.162/kWh, which is the blended rate used throughout the analyses in this report. The monthly electricity consumption and peak demand is represented graphically in the chart below.
Figure 8 - Electric Usage & Demand
Figure 9 - Electric Usage & Demand
Period
Ending
Days in
Period
Electric
Usage
(kWh)
Demand (kW) Demand Cost Total Electric Cost
TRC
Estimated
Usage?
3/31/15 31 131,348 282 $417 $10,946 No
4/30/15 30 126,944 292 $406 $10,907 No
5/31/15 31 148,583 368 $495 $21,675 No
6/30/15 30 30,935 257 $298 $3,434 No
7/31/15 31 159,467 306 $535 $27,909 No
8/31/15 30 155,670 285 $497 $27,053 No
9/30/15 30 154,904 388 $656 $36,304 No
10/31/15 31 131,244 386 $519 $23,531 No
11/30/15 30 130,406 329 $473 $23,756 No
12/31/15 31 139,017 319 $459 $25,535 No
1/31/16 31 129,985 282 $379 $23,292 No
2/29/16 29 126,705 314 $451 $24,054 No
Totals 365 1,565,208 387.9 $5,585 $258,394 0
Annual 365 1,565,208 387.9 $5,585 $258,394
Electric Billing Data for Clayton Public School

LGEA: Energy Audit Report – Clayton High School 19
3.3 Natural Gas Usage
Natural gas is provided by South Jersey Gas. The average gas cost for the past 12 months is $0.519/therm, which is the blended rate used throughout the analyses in this report. The monthly gas consumption is represented graphically in the chart below.
Figure 10 - Natural Gas Usage
Figure 11 - Natural Gas Usage
Period
Ending
Days in
Period
Natural Gas
Usage
(Therms)
Natural Gas Cost
TRC
Estimated
Usage?
6/16/15 31 1,282 $726 No
7/20/15 30 1,205 $679 No
8/18/15 31 772 $442 No
9/18/15 30 889 $509 No
10/16/15 31 1,533 $833 No
11/16/15 30 4,575 $2,382 No
12/17/16 30 6,734 $3,491 No
1/18/16 31 9,641 $4,989 No
2/16/15 29 11,360 $5,868 No
3/16/16 31 8,180 $4,235 No
4/14/16 31 7,052 $3,603 No
5/17/16 30 4,449 $2,203 No
Totals 365 57,672 $29,959 0
Annual 365 57,672 $29,959
Gas Billing Data for Clayton Public School

LGEA: Energy Audit Report – Clayton High School 20
3.4 Benchmarking
This facility was benchmarked through Portfolio Manager, an online tool created and managed by the United States Environmental Protection Agency (EPA) through the ENERGY STAR® program. Portfolio Manager analyzes your building’s consumption data, cost information, and operational use details and compares its performance against a yearly baseline, national medians, or similar buildings in your portfolio. Metrics used in this comparison are the energy use intensity (EUI) and ENERGY STAR® Score.
The EUI is a measure of a facility’s energy consumption per square foot, and it is the standard metric for comparing buildings’ energy performance. Comparing the EUI of a building with the national median EUI for that building type illustrates whether that building uses more energy than similar buildings on a square foot basis or if that building performs better than the median. EUI is presented in both site energy and source energy. Site energy is the amount of fuel and electricity consumed by a building as reflected in utility bills. Source energy is the raw fuel consumed to generate the energy consumed at the site, factoring in energy production and distribution losses.
Figure 12 - Energy Use Intensity Comparison – Existing Conditions
By implementing all recommended measures covered in this reporting, the project’s estimated post‐implementation EUI improves as shown in the Table below:
Figure 13 - Energy Use Intensity Comparison – Following Installation of Recommended Measures
Many buildings can also receive a 1 – 100 ENERGY STAR® score. This score compares your building’s energy performance to similar buildings nationwide. A score of 50 represents median energy performance, while a score of 75 means your building performs better than 75 percent of all similar buildings nationwide and may be eligible for ENERGY STAR® certification. This facility has a current score of 62.
The Portfolio Manager, Statement of Energy Performance found in Appendix B: ENERGY STAR®
Statement of Energy Performance.
Clayton Public SchoolsNational Median
Building Type: School (K-12)
Source Energy Use Intensity (kBtu/ft2) 152.2 141.4
Site Energy Use Intensity (kBtu/ft2) 74.1 58.2
Energy Use Intensity Comparison - Existing Conditions
Clayton Public SchoolsNational Median
Building Type: School (K-12)
Source Energy Use Intensity (kBtu/ft2) 134.9 141.4
Site Energy Use Intensity (kBtu/ft2) 68.1 58.2
Energy Use Intensity Comparison - Following Installation of Recommended Measures

LGEA: Energy Audit Report – Clayton High School 21
3.5 Energy End-Use Breakdown
In order to provide a complete overview of energy consumption across building systems, an energy balance was performed at this facility. An energy balance utilizes standard practice engineering methods to evaluate all components of the various electric and fuel‐fired systems found in a building and determine their proportional contribution to overall building energy usage. This visual representation of energy end uses highlights systems that may benefit most from energy efficiency projects.
Figure 14 - Energy Balance (% and kBtu/SF)
LGEA: Energy Audit Report – Clayton High School 22
4 ENERGY CONSERVATION MEASURES
Level of Analysis
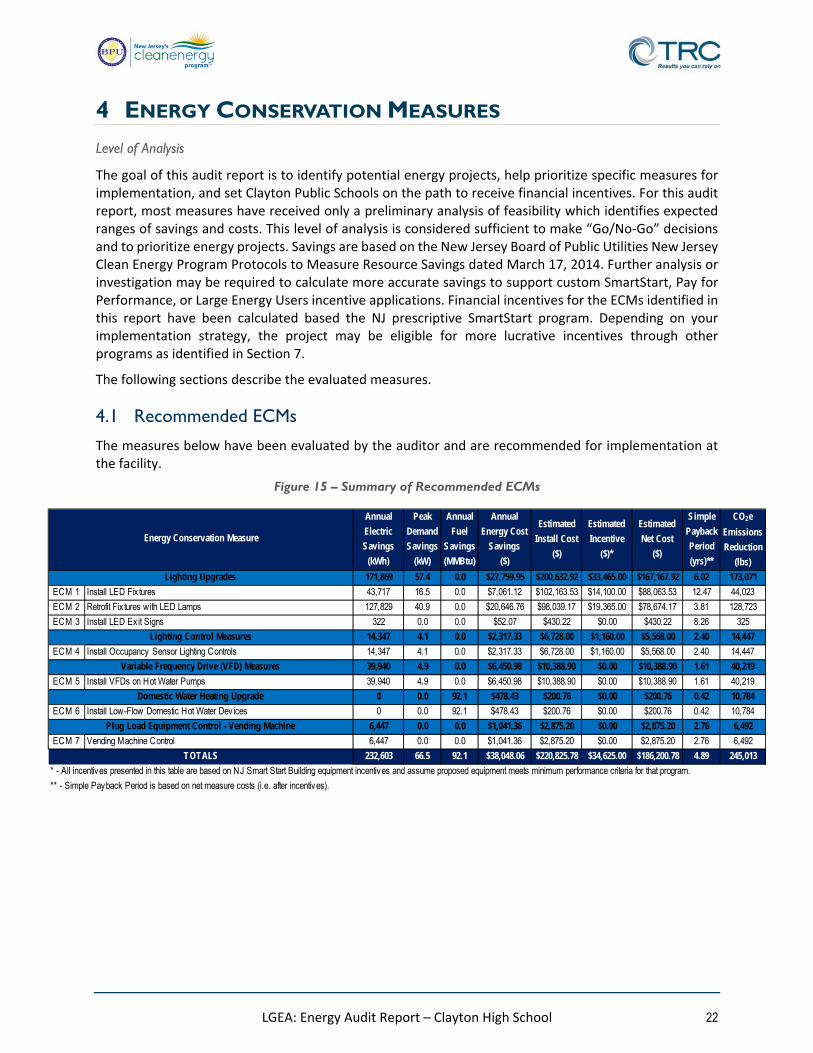
The goal of this audit report is to identify potential energy projects, help prioritize specific measures for implementation, and set Clayton Public Schools on the path to receive financial incentives. For this audit report, most measures have received only a preliminary analysis of feasibility which identifies expected ranges of savings and costs. This level of analysis is considered sufficient to make “Go/No‐Go” decisions and to prioritize energy projects. Savings are based on the New Jersey Board of Public Utilities New Jersey Clean Energy Program Protocols to Measure Resource Savings dated March 17, 2014. Further analysis or investigation may be required to calculate more accurate savings to support custom SmartStart, Pay for Performance, or Large Energy Users incentive applications. Financial incentives for the ECMs identified in this report have been calculated based the NJ prescriptive SmartStart program. Depending on your implementation strategy, the project may be eligible for more lucrative incentives through other programs as identified in Section 7.
The following sections describe the evaluated measures.
4.1 Recommended ECMs
The measures below have been evaluated by the auditor and are recommended for implementation at the facility.
Figure 15 – Summary of Recommended ECMs
Annual
Electric
Savings
(kWh)
Peak
Demand
Savings
(kW)
Annual
Fuel
Savings
(MMBtu)
Annual
Energy Cost
Savings
($)
Estimated
Install Cost
($)
Estimated
Incentive
($)*
Estimated
Net Cost
($)
Simple
Payback
Period
(yrs)**
CO2e
Emissions
Reduction
(lbs)
171,869 57.4 0.0 $27,759.95 $200,632.92 $33,465.00 $167,167.92 6.02 173,071
ECM 1 Install LED Fix tures 43,717 16.5 0.0 $7,061.12 $102,163.53 $14,100.00 $88,063.53 12.47 44,023
ECM 2 Retrofit Fix tures with LED Lamps 127,829 40.9 0.0 $20,646.76 $98,039.17 $19,365.00 $78,674.17 3.81 128,723
ECM 3 Install LED Exit Signs 322 0.0 0.0 $52.07 $430.22 $0.00 $430.22 8.26 325
14,347 4.1 0.0 $2,317.33 $6,728.00 $1,160.00 $5,568.00 2.40 14,447
ECM 4 Install Occupancy Sensor Lighting Controls 14,347 4.1 0.0 $2,317.33 $6,728.00 $1,160.00 $5,568.00 2.40 14,447
39,940 4.9 0.0 $6,450.98 $10,388.90 $0.00 $10,388.90 1.61 40,219
ECM 5 Install VFDs on Hot Water Pumps 39,940 4.9 0.0 $6,450.98 $10,388.90 $0.00 $10,388.90 1.61 40,219
0 0.0 92.1 $478.43 $200.76 $0.00 $200.76 0.42 10,784
ECM 6 Install Low-Flow Domestic Hot Water Dev ices 0 0.0 92.1 $478.43 $200.76 $0.00 $200.76 0.42 10,784
6,447 0.0 0.0 $1,041.36 $2,875.20 $0.00 $2,875.20 2.76 6,492
ECM 7 Vending Machine Control 6,447 0.0 0.0 $1,041.36 $2,875.20 $0.00 $2,875.20 2.76 6,492
232,603 66.5 92.1 $38,048.06 $220,825.78 $34,625.00 $186,200.78 4.89 245,013
* - All incentives presented in this table are based on NJ Smart Start Building equipment incentives and assume proposed equipment meets minimum performance criteria for that program.
** - Simple Payback Period is based on net measure costs (i.e. after incentives).
TOTALS
Domestic Water Heating Upgrade
Plug Load Equipment Control - Vending Machine
Energy Conservation Measure
Lighting Upgrades
Lighting Control Measures
Variable Frequency Drive (VFD) Measures
LGEA: Energy Audit Report – Clayton High School 23
4.1.1 Lighting Upgrades
Lighting Upgrades include several “submeasures” as outlined in Figure 16 below.
Figure 16 – Summary of Lighting Upgrade ECMs
ECM 1: Install LED Fixtures
Summary of Measure Economics
Measure Description
This measure evaluates replacing existing fixtures containing fluorescent (excluding T12), HID, and incandescent lamps with new high performance LED light fixtures. This measure saves energy by installing LED sources which use less power than other technologies with a comparable light output.
Maintenance savings are anticipated since LED sources have burn hours which are generally more than twice that of a fluorescent source and more than 10 times incandescent sources. Maintenance savings may be partially offset by the higher material costs associated with LED sources.
During planning and design for the installation of new fixtures, we recommend a holistic approach that considers both the technology of the lighting sources and how they are controlled.
ECM 2: Retrofit Fixtures with LED Lamps
Summary of Measure Economics
Annual
Electric
Savings
(kWh)
Peak
Demand
Savings
(kW)
Annual
Fuel
Savings
(MMBtu)
Annual
Energy Cost
Savings
($)
Estimated
Install Cost
($)
Estimated
Incentive
($)
Estimated
Net Cost
($)
Simple
Payback
Period
(yrs)
CO2e
Emissions
Reduction
(lbs)
171,869 57.4 0.0 $27,759.95 $200,632.92 $33,465.00 $167,167.92 6.02 173,071
ECM 1 Install LED Fix tures 43,717 16.5 0.0 $7,061.12 $102,163.53 $14,100.00 $88,063.53 12.47 44,023
ECM 2 Retrofit Fix tures with LED Lamps 127,829 40.9 0.0 $20,646.76 $98,039.17 $19,365.00 $78,674.17 3.81 128,723
ECM 3 Install LED Exit Signs 322 0.0 0.0 $52.07 $430.22 $0.00 $430.22 8.26 325
Energy Conservation Measure
Lighting Upgrades
Interior/
Exterior
Annual
Electric
Savings
(kWh)
Peak
Demand
Savings
(kW)
Annual
Fuel
Savings
(MMBtu)
Annual
Energy Cost
Savings
($)
Estimated
Install Cost
($)
Estimated
Incentive
($)
Estimated
Net Cost
($)
Simple
Payback
Period
(yrs)
CO2e
Emissions
Reduction
(lbs)
Interior 29,546 8.5 0.0 $4,772.18 $69,555.00 $6,000.00 $63,555.00 13.32 29,752
Exterior 14,171 8.1 0.0 $2,288.94 $32,608.54 $8,100.00 $24,508.54 10.71 14,271
Interior/
Exterior
Annual
Electric
Savings
(kWh)
Peak
Demand
Savings
(kW)
Annual
Fuel
Savings
(MMBtu)
Annual
Energy Cost
Savings
($)
Estimated
Install Cost
($)
Estimated
Incentive
($)
Estimated
Net Cost
($)
Simple
Payback
Period
(yrs)
CO2e
Emissions
Reduction
(lbs)
Interior 127,829 40.9 0.0 $20,646.76 $98,039.17 $19,365.00 $78,674.17 3.81 128,723
Exterior 0 0.0 0.0 $0.00 $0.00 $0.00 $0.00 0.00 0

LGEA: Energy Audit Report – Clayton High School 24
Measure Description
This measure evaluates replacing linear fluorescent lamps with LED tube lamps and replacing incandescent and halogen screw‐in/plug‐in based lamps with LED lamps. Many LED tube lamps are direct replacements for existing fluorescent lamps and can be installed although there is a fluorescent fixture ballast in place. Other tube lamps require that fluorescent fixture ballasts be removed or replaced with LED drivers. Screw‐in/plug‐in LED lamps can be used as a direct replacement for most other screw‐in/plug‐in lamps. This measure saves energy by installing LED sources which use less power than other technologies with a comparable light output.
Maintenance savings are anticipated since LED sources have burn hours which are more than twice that of a fluorescent source and more than 10 times incandescent sources. LED lamps that use the existing fluorescent fixture ballast will be constrained by the remaining hours of the ballast. Maintenance savings may be partially offset by the higher material costs associated with LED sources.
During retrofit planning and design, we recommend a holistic approach that considers both the technology of the lighting sources and how they are controlled.
ECM 3: Install LED Exit Signs
Summary of Measure Economics
Measure Description
This measure evaluates replacing incandescent lighting in exit signs with LEDs. LED sources require virtually no maintenance and LED exit signs have a life expectancy of at least 20 years. Many manufacturers can provide retrofit kits that meet fire and safety code requirements. Retrofit kits are less expensive and simpler to install than replacement signs, however, new fixtures would have a longer useful life and are therefore recommended.
A reduction in maintenance costs will be realized with the proposed retrofit because lamps will not have to be replaced as frequently.
Interior/
Exterior
Annual
Electric
Savings
(kWh)
Peak
Demand
Savings
(kW)
Annual
Fuel
Savings
(MMBtu)
Annual
Energy Cost
Savings
($)
Estimated
Install Cost
($)
Estimated
Incentive
($)
Estimated
Net Cost
($)
Simple
Payback
Period
(yrs)
CO2e
Emissions
Reduction
(lbs)
Interior 322 0.0 0.0 $52.07 $430.22 $0.00 $430.22 8.26 325
Exterior 0 0.0 0.0 $0.00 $0.00 $0.00 $0.00 0.00 0

LGEA: Energy Audit Report – Clayton High School 25
4.1.2 Lighting Control Measures
Lighting control measures include several “submeasures” as outlined in Figure 17 below.
Figure 17 – Summary of Lighting Control ECMs
ECM 4: Install Occupancy Sensor Lighting Controls
Summary of Measure Economics
Measure Description
This measure evaluates installing occupancy sensors to control light fixtures that are currently manually controlled in classrooms, restrooms, storage rooms, and offices. Sensors detect occupancy using ultrasonic and/or infrared wave technologies. Lighting systems are enabled when an occupant is detected. Fixtures are automatically turned off after an area has been vacant for a preset period. Occupants will also be able to manually turn off fixtures. Energy savings result from only operating lighting systems when they are required.
Occupancy sensors may be mounted on the wall at existing switch locations, mounted on the ceiling, or in remote locations. Ceiling‐mounted or remote‐mounted sensors require the use of low voltage switching relays or a wireless signal to the switch. In general, use wall switch replacement sensors for single occupant offices and other small rooms. Install ceiling‐mounted or remote mounted sensors in locations without local switching, in situations where the existing wall switches are not in the line‐of‐sight of the main work area, and in large spaces. We recommend a holistic design approach that considers both the technology of the lighting sources and how they are controlled.
Maintenance savings are anticipated due to reduced lamp operation, however, additional maintenance costs may be incurred because the occupancy sensors may require periodic adjustment; it is anticipated that the net effect on maintenance costs will be negligible.
Annual
Electric
Savings
(kWh)
Peak
Demand
Savings
(kW)
Annual
Fuel
Savings
(MMBtu)
Annual
Energy Cost
Savings
($)
Estimated
Install Cost
($)
Estimated
Incentive
($)
Estimated
Net Cost
($)
Simple
Payback
Period
(yrs)
CO2e
Emissions
Reduction
(lbs)
14,347 4.1 0.0 $2,317.33 $6,728.00 $1,160.00 $5,568.00 2.40 14,447
ECM 4 Install Occupancy Sensor Lighting Controls 14,347 4.1 0.0 $2,317.33 $6,728.00 $1,160.00 $5,568.00 2.40 14,447
Energy Conservation Measure
Lighting Control Measures
Annual
Electric
Savings
(kWh)
Peak
Demand
Savings
(kW)
Annual
Fuel
Savings
(MMBtu)
Annual
Energy Cost
Savings
($)
Estimated
Install Cost
($)
Estimated
Incentive
($)
Estimated
Net Cost
($)
Simple
Payback
Period
(yrs)
CO2e
Emissions
Reduction
(lbs)
14,347 4.1 0.0 $2,317.33 $6,728.00 $1,160.00 $5,568.00 2.40 14,447

LGEA: Energy Audit Report – Clayton High School 26
4.1.3 Variable Frequency Drive Measures
Variable frequency drive (VFD) measures include several “submeasures” as outlined in Figure 18 below.
Figure 18 – Summary of Variable Frequency Drive ECMs
ECM 5: Install VFDs on Hot Water Pumps
Summary of Measure Economics
Measure Description
This measure evaluates installing a variable frequency drive (VFD) to control a hot water pump. This measure requires that a majority of the hot water coils be served by 2‐way valves and that a differential pressure sensor is installed in the hot water loop. As the hot water valves close, the differential pressure increases. The VFD modulates pump speed to maintain a differential pressure setpoint. Energy savings result from reducing pump motor speed (and power) as hot water valves close. The magnitude of energy savings is based on the amount of time at reduced loads.
4.1.4 Domestic Water Heating Upgrade
Domestic water heating measures include several “submeasures” as outlined in Figure 19 below.
Figure 19 - Summary of Domestic Water Heating ECMs
Annual
Electric
Savings
(kWh)
Peak
Demand
Savings
(kW)
Annual
Fuel
Savings
(MMBtu)
Annual
Energy Cost
Savings
($)
Estimated
Install Cost
($)
Estimated
Incentive
($)
Estimated
Net Cost
($)
Simple
Payback
Period
(yrs)
CO2e
Emissions
Reduction
(lbs)
39,940 4.9 0.0 $6,450.98 $10,388.90 $0.00 $10,388.90 1.61 40,219
ECM 5 Install VFDs on Hot Water Pumps 39,940 4.9 0.0 $6,450.98 $10,388.90 $0.00 $10,388.90 1.61 40,219
Energy Conservation Measure
Variable Frequency Drive (VFD) Measures
Annual
Electric
Savings
(kWh)
Peak
Demand
Savings
(kW)
Annual
Fuel
Savings
(MMBtu)
Annual
Energy Cost
Savings
($)
Estimated
Install Cost
($)
Estimated
Incentive
($)
Estimated
Net Cost
($)
Simple
Payback
Period
(yrs)
CO2e
Emissions
Reduction
(lbs)
39,940 4.9 0.0 $6,450.98 $10,388.90 $0.00 $10,388.90 1.61 40,219
Annual
Electric
Savings
(kWh)
Peak
Demand
Savings
(kW)
Annual
Fuel
Savings
(MMBtu)
Annual
Energy Cost
Savings
($)
Estimated
Install Cost
($)
Estimated
Incentive
($)
Estimated
Net Cost
($)
Simple
Payback
Period
(yrs)
CO2e
Emissions
Reduction
(lbs)
0 0.0 92.1 $478.43 $200.76 $0.00 $200.76 0.42 10,784
ECM 6 Install Low-Flow Domestic Hot Water Devices 0 0.0 92.1 $478.43 $200.76 $0.00 $200.76 0.42 10,784
Domestic Water Heating Upgrade
Energy Conservation Measure

LGEA: Energy Audit Report – Clayton High School 27
ECM 6: Install Low-Flow DHW Devices
Summary of Measure Economics
Measure Description
This measure evaluates the savings from installing low flow domestic water devices to reduce overall water flow in general and hot water flow in particular. Low flow showerheads and faucet aerators reduce the water flow, relative to standard showerheads and aerators, from the fixture. Pre‐rinse spray valves—often used in commercial and institutional kitchens—are designed to remove food waste from dishes prior to dishwashing. Replacing standard pre‐rinse spray valves with low flow valves will reduce water use.
All of the low flow devices reduce the overall water flow from the fixture which generally reduces the amount of hot water used resulting in energy and water savings.
4.1.5 Plug Load Equipment Control - Vending Machine
ECM 7: Vending Machine Control
Summary of Measure Economics
Measure Description
Vending machines operate continuously, even during non‐business hours. It is recommended to install occupancy sensor based controls to reduce the energy use. These controls power down the machine when the surrounding area is vacant, then monitor the surrounding temperature and power up the cooling system at regular intervals to keep the product cool. Savings are a function of the activity level around the vending machine.
Annual
Electric
Savings
(kWh)
Peak
Demand
Savings
(kW)
Annual
Fuel
Savings
(MMBtu)
Annual
Energy Cost
Savings
($)
Estimated
Install Cost
($)
Estimated
Incentive
($)
Estimated
Net Cost
($)
Simple
Payback
Period
(yrs)
CO2e
Emissions
Reduction
(lbs)
0 0.0 92.1 $478.43 $200.76 $0.00 $200.76 0.42 10,784
Annual
Electric
Savings
(kWh)
Peak
Demand
Savings
(kW)
Annual
Fuel
Savings
(MMBtu)
Annual
Energy Cost
Savings
($)
Estimated
Install Cost
($)
Estimated
Incentive
($)
Estimated
Net Cost
($)
Simple
Payback
Period
(yrs)
CO2e
Emissions
Reduction
(lbs)
6,447 0.0 0.0 $1,041.36 $2,875.20 $0.00 $2,875.20 2.76 6,492

LGEA: Energy Audit Report – Clayton High School 28
5 ENERGY EFFICIENT PRACTICES In addition to the quantifiable savings estimated in Section 4, a facility’s energy performance can also be improved through application of low or no‐cost efficiency strategies. By employing certain behavioral and operational adjustments as well as performing routine maintenance on building systems, equipment lifetime can be extended; occupant comfort, health and safety can be improved; and annual energy, operation, and maintenance costs can be reduced. The recommendations below are provided as a framework for developing a whole building maintenance plan that is customized to your facility. Consult with qualified equipment specialists for details on proper maintenance and system operation.
Reduce Air Leakage
Air leakage, or infiltration, occurs when outside air enters a building uncontrollably through cracks and openings. Properly sealing such cracks and openings can significantly reduce heating and cooling costs, improve building durability, and create a healthier indoor environment. This includes caulking or installing weather stripping around leaky doors and windows allowing for better control of indoor air quality through controlled ventilation.
Close Doors and Windows
Ensure doors and windows are closed in conditioned spaces. Leaving doors and windows open leads to a significant increase in heat transfer between conditioned spaces and the outside air. Reducing a facility’s air changes per hour (ACH) can lead to increased occupant comfort as well as significant heating and cooling savings, especially when combined with proper HVAC controls and adequate ventilation.
Perform Proper Lighting Maintenance
In order to sustain optimal lighting levels, lighting fixtures should undergo routine maintenance. Light levels decrease over time due to lamp aging, lamp and ballast failure, and buildup of dirt and dust on lamps, fixtures and reflective surfaces. Together, these factors can reduce total illumination by 20 ‐ 60% or more, while operating fixtures continue drawing full power. To limit this reduction, lamps, reflectors and diffusers should be thoroughly cleaned of dirt, dust, oil, and smoke film buildup approximately every 6 – 12 months.
Ensure Lighting Controls Are Operating Properly
Lighting controls are very cost effective energy efficient devices, when installed and operating correctly. As part of a lighting maintenance schedule, lighting controls should be tested annually to ensure proper functioning. For occupancy sensors, this requires triggering the sensor and verifying that the sensor’s timer settings are correct. For daylight sensors, maintenance involves cleaning of sensor lenses and confirming setpoints and sensitivity are appropriately configured.
Perform Routine Motor Maintenance
Motors consist of many moving parts whose collective degradation can contribute to a significant loss of motor efficiency. In order to prevent damage to motor components, routine maintenance should be performed. This maintenance consists of cleaning surfaces and ventilation openings on motors to prevent overheating, lubricating moving parts to reduce friction, inspecting belts and pulleys for wear and to ensure they are at proper alignment and tension, and cleaning and lubricating bearings. Consult a licensed technician to assess these and other motor maintenance strategies.

LGEA: Energy Audit Report – Clayton High School 29
Ensure Economizers are Functioning Properly
Economizers, when properly configured, can be used to significantly reduce mechanical cooling. However, if the outdoor thermostat or enthalpy control is malfunctioning or the damper is stuck or improperly adjusted, benefits from the economizer may not be fully realized. As such, periodic inspection and maintenance is required to ensure proper operation. This maintenance should be scheduled with maintenance of the facility’s air conditioning system and should include proper setting of the outdoor thermostat/enthalpy control, inspection of control and damper operation, and lubrication of damper connections and adjustment of minimum damper position. A malfunctioning economizer can significantly increase the amount of heating and mechanical cooling required by introducing excess amounts of cold or hot outside air.
Assess Chillers & Request Tune-Ups
Chillers are responsible for a substantial portion of a commercial building’s overall energy usage. When components of a chiller are not optimized, this can quickly result in a noticeable increase in energy bills. Chiller diagnostics can produce a 5 to 10% cost avoidance potential from discovery and implementation of low/no cost optimization strategies.
Clean Evaporator/Condenser Coils on AC Systems
Dirty evaporators and condensers coils cause a restriction to air flow and restrict heat transfer. This results in increased evaporator and condenser fan load and a decrease in cooling system performance. Keeping the coils clean allows the fans and cooling system to operate more efficiently.
Clean and/or Replace HVAC Filters
Air filters work to reduce the amount of indoor air pollution and increase occupant comfort. Over time, filters become less and less effective as particulate buildup increases. In addition to health concerns related to clogged filters, filters that have reached saturation also restrict air flow through the facility’s air conditioning or heat pump system, increasing the load on the distribution fans and decreasing occupant comfort levels. Filters should be checked monthly and cleaned or replaced when appropriate.
Check for and Seal Duct Leakage
Duct leakage in commercial buildings typically accounts for 5 to 25% of the supply airflow. In the case of rooftop air handlers, duct leakage can occur to the outside of the building, significantly increasing cooling and heating costs. By sealing sources of leakage, cooling, heating, and ventilation energy use can be reduced significantly, depending on the severity of air leakage.
Perform Proper Boiler Maintenance
Many boiler problems develop slowly over time, so regular inspection and maintenance is essential to retain proper functionality and efficiency of the heating system. Fuel burning equipment should undergo yearly tune‐ups to ensure they are operating as safely and efficiently as possible from a combustion standpoint. A tune‐up should include a combustion analysis to analyze the exhaust from the boilers and to ensure the boiler is operating safely. Buildup of dirt, dust, or deposits on the internal surfaces of a boiler can greatly affect its heat transfer efficiency. These deposits can accumulate on the water side or fire side of the boiler. Boilers should be cleaned regularly according to the manufacturer’s instructions to remove this build up in order to sustain efficiency and equipment life.

LGEA: Energy Audit Report – Clayton High School 30
Perform Proper Water Heater Maintenance
At least once a year, drain a few gallons out of the water heater using the drain valve. If there is a lot of sediment or debris, then a full flush is recommended. Turn the temperature down and then completely drain the tank. Once a year check for leaks or heavy corrosion on the pipes and valves. For gas water heaters, check the draft hood and make sure it is placed properly, with a few inches of air space between the tank and where it connects to the vent. Look for corrosion or wear on the gas line and on the piping. If you notice black residue, soot or charred metal, this is a sign you may be having combustion issues and you should have the unit serviced by a professional. For electric water heaters, look for any signs of leaking such as rust streaks or residue around the upper and lower panels covering the electrical components on the tank. For water heaters over three to four years old have a technician inspect the sacrificial anode annually.
Plug Load Controls
There are a variety of ways to limit the energy use of plug loads including increasing occupant awareness, removing under‐utilized equipment, installing hardware controls, and using software controls. Some control steps to take are to enable the most aggressive power settings on existing devices or install load sensing or occupancy sensing (advanced) power strips. For additional information refer to “ “Plug Load Best Practices Guide” http://www.advancedbuildings.net/plug‐load‐best‐practices‐guide‐offices.
Water Conservation
Installing low flow faucets or faucet aerators, low flow showerheads, and kitchen sink pre‐rinse spray valves saves both energy and water. These devices save energy by reducing the overall amount of hot water used hence reducing the energy used to heat the water. The flow ratings for EPA WaterSense™ (http://www3.epa.gov/watersense/products) labeled devices are 1.5 gpm for bathroom faucets, 2.0 gpm for showerheads, and 1.28 gpm for pre‐rinse spray valves.
Installing dual flush or low flow toilets and low flow or waterless urinals are additional ways to reduce the sites water use, however, these devices do not provide energy savings at the site level. Any reduction in water use does however ultimately reduce grid level electricity use since a significant amount of electricity is used to deliver water from reservoirs to end users. The EPA WaterSense™ ratings for urinals is 0.5 gallons per flush (gpf) and toilets that use as little as 1.28 gpf (this is lower than the current 1.6 gpf federal standard).
Refer to Section 4.1.4 for low‐flow ECM recommendations.

LGEA: Energy Audit Report – Clayton High School 31
6 SELF-GENERATION MEASURES Self‐generation measures include both renewable (e.g., solar, wind) and non‐renewable (e.g. microturbines) on‐site technologies that generate power to meet all or a portion of the electric energy needs of a facility, often repurposing any waste heat where applicable. Also referred to as distributed generation, these systems contribute to Greenhouse Gas (GHG) emission reductions, demand reductions and reduced customer electricity purchases, resulting in the electric system reliability through improved transmission and distribution system utilization.
The State of New Jersey’s Energy Master Plan (EMP) encourages new distributed generation of all forms and specifically focuses on expanding use of combined heat and power (CHP) by reducing financial, regulatory and technical barriers and identifying opportunities for new entries. The EMP also outlines a goal of 70% of the State’s electrical needs to be met by renewable sources by 2050.
Preliminary screenings were performed to determine the potential that a generation project could provide a cost‐effective solution for your facility. Before making a decision to implement, a feasibility study should be conducted that would take a detailed look at existing energy profiles, siting, interconnection, and the costs associated with the generation project including interconnection costs, departing load charges, and any additional special facilities charges.
6.1 Photovoltaic
Sunlight can be converted into electricity using photovoltaics (PV) modules. Modules are racked together into an array that produces direct current (DC) electricity. The DC current is converted to alternating current (AC) through an inverter. The inverter is interconnected to the facility’s electrical distribution system. The amount of unobstructed area available determines how large of a solar array can be installed. The size of the array combined with the orientation, tilt, and shading elements determines the energy produced.
A preliminary screening based on the facility’s electric demand, size and location of free area, and shading elements shows that the facility has a Low potential for installing additional PV.
In order to be cost‐effective, a solar PV array generally needs a minimum of 4,000 square feet of flat or south‐facing rooftop, or other unshaded space, on which to place the PV panels. The facility has already used this roof top space for the existing solar.
Figure 20 - Photovoltaic Screening
50
20 18
0 00
102030405060708090
ElectricDemand
Free Area Shading Location Engagement Site Total
PV Screening Results
HIGH
MED
LOW

LGEA: Energy Audit Report – Clayton High School 32
Rebates are not available for solar projects, but owners of solar projects MUST register their projects in the SREC Registration Program prior to the start of construction in order to establish the project’s eligibility to earn SRECs. Registration of the intent to participate in New Jersey's solar marketplace provides market participants with information about the pipeline of anticipated new solar capacity and insight into future SREC pricing..
For more information on solar PV technology and commercial solar markets in New Jersey, or to find a qualified solar installer, who can provide a more detailed assessment of the specific costs and benefits of solar develop of the site, please visit the following links below:
‐ Basic Info on Solar PV in NJ: http://www.njcleanenergy.com/whysolar ‐ NJ Solar Market FAQs: http://www.njcleanenergy.com/renewable‐energy/program‐updates‐
and‐background‐information/solar‐transition/solar‐market‐faqs ‐ Approved Solar Installers in the NJ Market: http://www.njcleanenergy.com/commercial‐
industrial/programs/nj‐smartstart‐buildings/tools‐and‐resources/tradeally/approved_vendorsearch/?id=60&start=1
6.2 Combined Heat and Power
In non‐industrial settings, combined heat and power (CHP) is the on‐site generation of electricity and recovery of heat which is put to beneficial use. Common prime movers in CHP applications include reciprocating engines, microturbines, fuel cells, and (at large facilities) gas turbines. Electricity is typically interconnected to the sites local distribution system. Heat is recovered from the exhaust stream and the ancillary cooling system and interconnected to the existing hot water (or steam) distribution system.
CHP systems are typically used to produce a portion of the electricity needed by a facility, with the balance of electric needs satisfied by purchase from the grid. The heat is used to supplement (or supplant) existing boilers for the purpose of space heating and/or domestic hot water heating. Waste heat can also be routed through absorption chillers for the purpose of space cooling. The key criteria used for screening, however, is the amount of time the system operates at full load and the facility’s ability to use the recovered heat. Facilities with continuous use for large quantities of waste heat are the best candidates for CHP.
A preliminary screening based on heating and electrical demand, siting, and interconnection shows that the facility has a Low potential for installing a cost‐effective CHP system.
Low or infrequent thermal load, and lack of space near the existing thermal generation are the most significant factors contributing to the low potential for CHP at the site. In our opinion, the facility does not appear to meet the minimum requirements for a cost‐effective CHP installation.
For a list of qualified firms in NJ specializing in commercial CHP cost assessment and installation, go to: http://www.njcleanenergy.com/commercial‐industrial/programs/nj‐smartstart‐buildings/tools‐and‐
resources/tradeally/approved_vendorsearch/

LGEA: Energy Audit Report – Clayton High School 33
Figure 21 - Combined Heat and Power Screening
Refer to Section 6.2 for additional information in the Combined Heat & Power and Fuel Cell Program.
10
3322 15
0 00
20
40
60
80
100
120
140
Gas Service ThermalDemand
ElectricDemand
Location Engagement Site Total
CHP Screening Results
HIGH
MED
LOW
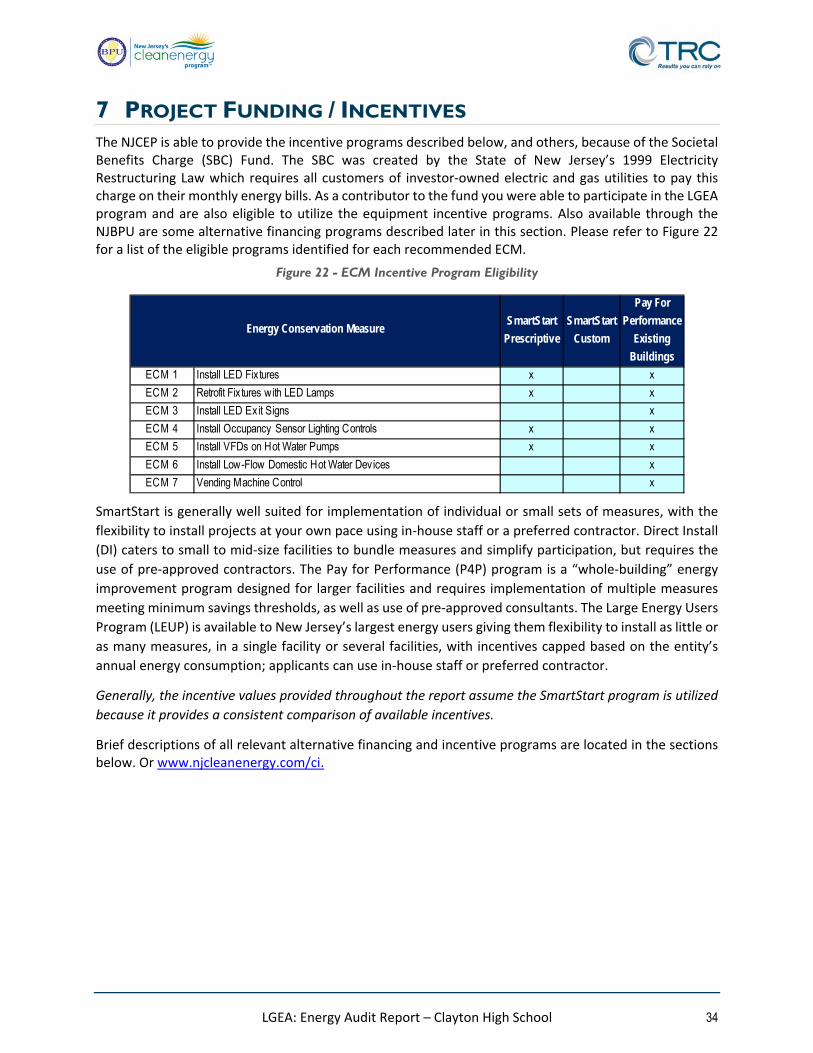
LGEA: Energy Audit Report – Clayton High School 34
7 PROJECT FUNDING / INCENTIVES The NJCEP is able to provide the incentive programs described below, and others, because of the Societal Benefits Charge (SBC) Fund. The SBC was created by the State of New Jersey’s 1999 Electricity Restructuring Law which requires all customers of investor‐owned electric and gas utilities to pay this charge on their monthly energy bills. As a contributor to the fund you were able to participate in the LGEA program and are also eligible to utilize the equipment incentive programs. Also available through the NJBPU are some alternative financing programs described later in this section. Please refer to Figure 22 for a list of the eligible programs identified for each recommended ECM.
Figure 22 - ECM Incentive Program Eligibility
SmartStart is generally well suited for implementation of individual or small sets of measures, with the
flexibility to install projects at your own pace using in‐house staff or a preferred contractor. Direct Install
(DI) caters to small to mid‐size facilities to bundle measures and simplify participation, but requires the
use of pre‐approved contractors. The Pay for Performance (P4P) program is a “whole‐building” energy
improvement program designed for larger facilities and requires implementation of multiple measures
meeting minimum savings thresholds, as well as use of pre‐approved consultants. The Large Energy Users
Program (LEUP) is available to New Jersey’s largest energy users giving them flexibility to install as little or
as many measures, in a single facility or several facilities, with incentives capped based on the entity’s
annual energy consumption; applicants can use in‐house staff or preferred contractor.
Generally, the incentive values provided throughout the report assume the SmartStart program is utilized
because it provides a consistent comparison of available incentives.
Brief descriptions of all relevant alternative financing and incentive programs are located in the sections below. Or www.njcleanenergy.com/ci.
SmartStart
Prescriptive
SmartStart
Custom
Pay For
Performance
Existing
Buildings
ECM 1 Install LED Fix tures x x
ECM 2 Retrofit Fix tures with LED Lamps x x
ECM 3 Install LED Exit Signs x
ECM 4 Install Occupancy Sensor Lighting Controls x x
ECM 5 Install VFDs on Hot Water Pumps x x
ECM 6 Install Low-Flow Domestic Hot Water Devices x
ECM 7 Vending Machine Control x
Energy Conservation Measure

LGEA: Energy Audit Report – Clayton High School 35
7.1 SmartStart
Overview
The SmartStart program is comprised of new construction and retrofit components that offer incentives for installing prescriptive and custom energy efficiency measures at your facility. Routinely the program adds, removes or modifies incentives for various energy efficiency equipment based on national/market trends, new technologies or changes in efficiency baselines.
Prescriptive Equipment Incentives Available:
Electric Chillers Electric Unitary HVAC Gas Cooling Gas Heating Gas Water Heating Ground Source Heat Pumps Lighting
Lighting Controls Refrigeration Doors Refrigeration Controls Refrigerator/Freezer Motors Food Service Equipment Variable Frequency Drives
All customer sizes and types may be served by this program. This program provides an effective mechanism for securing incentives for individual projects that may be completed at once or over several years.
Incentives
The prescriptive path provides fixed incentives for specific energy efficiency measures whereas the custom measure path provides incentives for unique or specialized technologies that are not addressed through prescriptive offerings.
Since your facility is an existing building, only the retrofit incentives have been applied in this report. Custom measure incentives are calculated at $0.16/kWh and $1.60/therm based on estimated annual savings, capped at the lesser of 50% of the total installed incremental project cost, or a buy down to a one year payback. Program incentives are capped at $500,000 per electric account and $500,000 per natural gas account, per fiscal year.
How to Participate
To participate in the SmartStart program, submit an application for the specific equipment to be installed. Many applications are designed as rebates, although others require application approval prior to installation. Applicants work with a contractor of their choosing and can also utilize internal personnel, which provides added flexibility to the program. Using internal personnel also helps improve the economics of the ECM by reducing the labor cost that is included in the tables in this report.
Detailed program descriptions, instructions for applying and applications can be found at: www.njcleanenergy.com/SSB.

LGEA: Energy Audit Report – Clayton High School 36
7.2 Pay for Performance - Existing Buildings
Overview
The Pay for Performance – Existing Buildings (P4P EB) program is designed for larger customers with a peak demand over 200 kW in the preceding 12 months. Under this program the minimum installed scope of work must include at least two unique measures resulting in at least 15% energy savings, where lighting cannot make up the majority of the savings. P4P is a good option for medium to large sized facilities looking to implement as many measures as possible under a single project in order to achieve deep energy savings. This program has an added benefit of evaluating a broad spectrum of measures that may not otherwise qualify under other programs. Many facilities pursuing ESIP also utilize the P4P program.
Incentives
Incentives are calculated based on estimated and achieved energy savings ranging from $0.18‐$0.22/kWh and $1.80‐$2.50/therm, capped at the lesser of 50% total project cost, or $1 million per electric account and $1 million per natural gas account, per fiscal year, not to exceed $2 million per project. An incentive of $0.10/square foot is also available to offset the cost of developing the Energy Reduction Plan (see below) contingent on the project moving forward with measure installation.
How to Participate
To participate in the P4B EB program you will need to contact one of the pre‐approved consultants and contractors (“Partners”). Under direct contract to you, and the Partner will help further evaluate the measures identified in this report through development of the Energy Reduction Plan (ERP). The Partner will assist you in implementing selected measures, and verify actual savings one year after the installation. At each of these three milestones your Partner will also facilitate securing program incentives.
Approval of the final scope of work is required by the program prior to installation completion. Although installation can be accomplished by a contractor of your choice (some P4P Partners are also contractors) or by internal personnel, the Partner must remain involved to ensure compliance with the program guidelines and requirements.
Detailed program descriptions, instructions for applying, applications and list of Partners can be found at: www.njcleanenergy.com/P4P.
LGEA: Energy Audit Report – Clayton High School 37
7.3 Energy Savings Improvement Program
The Energy Savings Improvement Program (ESIP) is an alternate method for New Jersey’s government agencies to finance the implementation of energy conservation measures. An ESIP is a type of “performance contract,” whereby school districts, counties, municipalities, housing authorities and other public and state entities enter in to contracts to help finance building energy upgrades. This is done in a manner that ensures that annual payments are lower than the savings projected from the ECMs, ensuring that ESIP projects are cash flow positive in year one, and every year thereafter. ESIP provides government agencies in New Jersey with a flexible tool to improve and reduce energy usage with minimal expenditure of new financial resources. NJCEP incentive programs can be leveraged to help further reduce the total project cost of eligible measures.
This LGEA report is the first step to participating in ESIP. Next, select an approach for implementing the desired ECMs:
(1) Use an Energy Services Company or “ESCO”; (2) Use independent engineers and other specialists, or your own qualified staff, to provide and
manage the requirements of the program through bonds or lease obligations; (3) Use a hybrid approach of the two options described above where the ESCO is utilized for some
services and independent engineers, or other specialists or qualified staff, are used to deliver other requirements of the program.
After adopting a resolution with a chosen implementation approach, the development of the Energy Savings Plan (ESP) can begin. The ESP demonstrates that the total project costs of the ECMs are offset by the energy savings over the financing term, not to exceed 15 years. The verified savings will then be used to pay for the financing.
The ESIP approach may not be appropriate for all energy conservation and energy efficiency improvements. Entities should carefully consider all alternatives to develop an approach that best meets their needs. A detailed program descriptions and application can be found at: www.njcleanenergy.com/ESIP
Please note that ESIP is a program delivered directly by the NJBPU and is not an NJCEP incentive program. As mentioned above, you may utilize the incentive programs to help further reduce costs when compiling the ESP. You should refer to the ESIP guidelines at the link above for further information and guidance on next steps.

LGEA: Energy Audit Report – Clayton High School 38
8 ENERGY PURCHASING AND PROCUREMENT STRATEGIES
8.1 Retail Electric Supply Options
In 1999, New Jersey State Legislature passed the Electric Discount & Energy Competition Act (EDECA) to restructure the electric power industry in New Jersey. This law deregulated the retail electric markets, allowing all consumers to shop for service from competitive electric suppliers. The intent was to create a more competitive market for electric power supply in New Jersey. As a result, utilities were allowed to charge Cost of Service and customers were given the ability to choose a third party (i.e. non‐utility) energy supplier.
Energy deregulation in New Jersey has increased energy buyers’ options by separating the function of electricity distribution from that of electricity supply. So, though you may choose a different company from which to buy your electric power, responsibility for your facility’s interconnection to the grid and repair to local power distribution will still reside with the traditional utility company serving your region.
If your facility is not purchasing electricity from a third party supplier, consider shopping for a reduced rate from third party electric suppliers. If your facility is purchasing electricity from a third party supplier, review and compare prices at the end of the current contract or every couple years.
A list of third party electric suppliers, who are licensed by the state to provide service in New Jersey, can be found online at: www.state.nj.us/bpu/commercial/shopping.html.
8.2 Retail Natural Gas Supply Options
The natural gas market in New Jersey has also been deregulated. Most customers that remain with the utility for natural gas service pay rates that are market‐based and that fluctuate on a monthly basis. The utility provides basic gas supply service (BGSS) to customers who choose not to buy from a third party supplier for natural gas commodity.
A customer’s decision about whether to buy natural gas from a retail supplier is typically dependent upon whether a customer seeks budget certainty and/or longer‐term rate stability. Customers can secure longer‐term fixed prices by signing up for service through a third party retail natural gas supplier. Many larger natural gas customers may seek the assistance of a professional consultant to assist in their procurement process.
If your facility is not purchasing natural gas from a third party supplier, consider shopping for a reduced rate from third party natural gas suppliers. If your facility is purchasing natural gas from a third party supplier, review and compare prices at the end of the current contract or every couple years.
A list of third party natural gas suppliers, who are licensed by the state to provide service in New Jersey, can be found online at: www.state.nj.us/bpu/commercial/shopping.html.
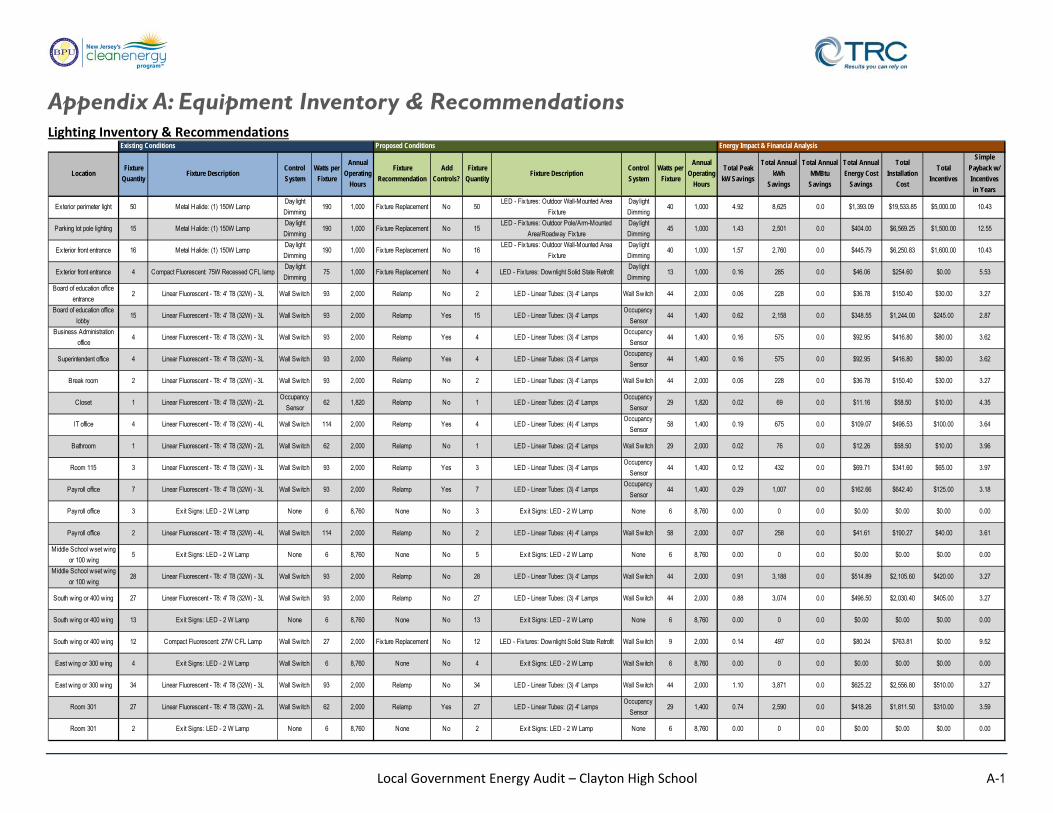
Local Government Energy Audit – Clayton High School A‐1
Appendix A: Equipment Inventory & Recommendations Lighting Inventory & Recommendations
LocationFixture
QuantityFixture Description
Control
System
Watts per
Fixture
Annual
Operating
Hours
Fixture
Recommendation
Add
Controls?
Fixture
QuantityFixture Description
Control
System
Watts per
Fixture
Annual
Operating
Hours
Total Peak
kW Savings
Total Annual
kWh
Savings
Total Annual
MMBtu
Savings
Total Annual
Energy Cost
Savings
Total
Installation
Cost
Total
Incentives
Simple
Payback w/
Incentives
in Years
Exterior perimeter light 50 Metal Halide: (1) 150W LampDay light
Dimming190 1,000 Fix ture Replacement No 50
LED - Fix tures: Outdoor Wall-Mounted Area
Fixture
Daylight
Dimming40 1,000 4.92 8,625 0.0 $1,393.09 $19,533.85 $5,000.00 10.43
Parking lot pole lighting 15 Metal Halide: (1) 150W LampDay light
Dimming190 1,000 Fix ture Replacement No 15
LED - Fix tures: Outdoor Pole/Arm-Mounted
Area/Roadway Fixture
Daylight
Dimming45 1,000 1.43 2,501 0.0 $404.00 $6,569.25 $1,500.00 12.55
Exterior front entrance 16 Metal Halide: (1) 150W LampDay light
Dimming190 1,000 Fix ture Replacement No 16
LED - Fix tures: Outdoor Wall-Mounted Area
Fixture
Daylight
Dimming40 1,000 1.57 2,760 0.0 $445.79 $6,250.83 $1,600.00 10.43
Exterior front entrance 4 Compact Fluorescent: 75W Recessed CFL lampDay light
Dimming75 1,000 Fix ture Replacement No 4 LED - Fix tures: Downlight Solid State Retrofit
Daylight
Dimming13 1,000 0.16 285 0.0 $46.06 $254.60 $0.00 5.53
Board of education office
entrance2 Linear Fluorescent - T8: 4' T8 (32W) - 3L Wall Switch 93 2,000 Relamp No 2 LED - Linear Tubes: (3) 4' Lamps Wall Switch 44 2,000 0.06 228 0.0 $36.78 $150.40 $30.00 3.27
Board of education office
lobby15 Linear Fluorescent - T8: 4' T8 (32W) - 3L Wall Switch 93 2,000 Relamp Yes 15 LED - Linear Tubes: (3) 4' Lamps
Occupancy
Sensor44 1,400 0.62 2,158 0.0 $348.55 $1,244.00 $245.00 2.87
Business Administration
office4 Linear Fluorescent - T8: 4' T8 (32W) - 3L Wall Switch 93 2,000 Relamp Yes 4 LED - Linear Tubes: (3) 4' Lamps
Occupancy
Sensor44 1,400 0.16 575 0.0 $92.95 $416.80 $80.00 3.62
Superintendent office 4 Linear Fluorescent - T8: 4' T8 (32W) - 3L Wall Switch 93 2,000 Relamp Yes 4 LED - Linear Tubes: (3) 4' LampsOccupancy
Sensor44 1,400 0.16 575 0.0 $92.95 $416.80 $80.00 3.62
Break room 2 Linear Fluorescent - T8: 4' T8 (32W) - 3L Wall Switch 93 2,000 Relamp No 2 LED - Linear Tubes: (3) 4' Lamps Wall Switch 44 2,000 0.06 228 0.0 $36.78 $150.40 $30.00 3.27
Closet 1 Linear Fluorescent - T8: 4' T8 (32W) - 2LOccupancy
Sensor62 1,820 Relamp No 1 LED - Linear Tubes: (2) 4' Lamps
Occupancy
Sensor29 1,820 0.02 69 0.0 $11.16 $58.50 $10.00 4.35
IT office 4 Linear Fluorescent - T8: 4' T8 (32W) - 4L Wall Switch 114 2,000 Relamp Yes 4 LED - Linear Tubes: (4) 4' LampsOccupancy
Sensor58 1,400 0.19 675 0.0 $109.07 $496.53 $100.00 3.64
Bathroom 1 Linear Fluorescent - T8: 4' T8 (32W) - 2L Wall Switch 62 2,000 Relamp No 1 LED - Linear Tubes: (2) 4' Lamps Wall Switch 29 2,000 0.02 76 0.0 $12.26 $58.50 $10.00 3.96
Room 115 3 Linear Fluorescent - T8: 4' T8 (32W) - 3L Wall Switch 93 2,000 Relamp Yes 3 LED - Linear Tubes: (3) 4' LampsOccupancy
Sensor44 1,400 0.12 432 0.0 $69.71 $341.60 $65.00 3.97
Payroll office 7 Linear Fluorescent - T8: 4' T8 (32W) - 3L Wall Switch 93 2,000 Relamp Yes 7 LED - Linear Tubes: (3) 4' LampsOccupancy
Sensor44 1,400 0.29 1,007 0.0 $162.66 $642.40 $125.00 3.18
Payroll office 3 Exit Signs: LED - 2 W Lamp None 6 8,760 None No 3 Exit Signs: LED - 2 W Lamp None 6 8,760 0.00 0 0.0 $0.00 $0.00 $0.00 0.00
Payroll office 2 Linear Fluorescent - T8: 4' T8 (32W) - 4L Wall Switch 114 2,000 Relamp No 2 LED - Linear Tubes: (4) 4' Lamps Wall Switch 58 2,000 0.07 258 0.0 $41.61 $190.27 $40.00 3.61
Middle School wset wing
or 100 wing5 Exit Signs: LED - 2 W Lamp None 6 8,760 None No 5 Exit Signs: LED - 2 W Lamp None 6 8,760 0.00 0 0.0 $0.00 $0.00 $0.00 0.00
Middle School wset wing
or 100 wing28 Linear Fluorescent - T8: 4' T8 (32W) - 3L Wall Switch 93 2,000 Relamp No 28 LED - Linear Tubes: (3) 4' Lamps Wall Switch 44 2,000 0.91 3,188 0.0 $514.89 $2,105.60 $420.00 3.27
South wing or 400 wing 27 Linear Fluorescent - T8: 4' T8 (32W) - 3L Wall Switch 93 2,000 Relamp No 27 LED - Linear Tubes: (3) 4' Lamps Wall Switch 44 2,000 0.88 3,074 0.0 $496.50 $2,030.40 $405.00 3.27
South wing or 400 wing 13 Exit Signs: LED - 2 W Lamp None 6 8,760 None No 13 Ex it Signs: LED - 2 W Lamp None 6 8,760 0.00 0 0.0 $0.00 $0.00 $0.00 0.00
South wing or 400 wing 12 Compact Fluorescent: 27W CFL Lamp Wall Switch 27 2,000 Fix ture Replacement No 12 LED - Fix tures: Downlight Solid State Retrofit Wall Switch 9 2,000 0.14 497 0.0 $80.24 $763.81 $0.00 9.52
East wing or 300 wing 4 Exit Signs: LED - 2 W Lamp Wall Switch 6 8,760 None No 4 Exit Signs: LED - 2 W Lamp Wall Switch 6 8,760 0.00 0 0.0 $0.00 $0.00 $0.00 0.00
East wing or 300 wing 34 Linear Fluorescent - T8: 4' T8 (32W) - 3L Wall Switch 93 2,000 Relamp No 34 LED - Linear Tubes: (3) 4' Lamps Wall Switch 44 2,000 1.10 3,871 0.0 $625.22 $2,556.80 $510.00 3.27
Room 301 27 Linear Fluorescent - T8: 4' T8 (32W) - 2L Wall Switch 62 2,000 Relamp Yes 27 LED - Linear Tubes: (2) 4' LampsOccupancy
Sensor29 1,400 0.74 2,590 0.0 $418.26 $1,811.50 $310.00 3.59
Room 301 2 Exit Signs: LED - 2 W Lamp None 6 8,760 None No 2 Exit Signs: LED - 2 W Lamp None 6 8,760 0.00 0 0.0 $0.00 $0.00 $0.00 0.00
Existing Conditions Proposed Conditions Energy Impact & Financial Analysis

Local Government Energy Audit – Clayton High School A‐2
LocationFixture
QuantityFixture Description
Control
System
Watts per
Fixture
Annual
Operating
Hours
Fixture
Recommendation
Add
Controls?
Fixture
QuantityFixture Description
Control
System
Watts per
Fixture
Annual
Operating
Hours
Total Peak
kW Savings
Total Annual
kWh
Savings
Total Annual
MMBtu
Savings
Total Annual
Energy Cost
Savings
Total
Installation
Cost
Total
Incentives
Simple
Payback w/
Incentives
in Years
Room 301A 2 Linear Fluorescent - T8: 4' T8 (32W) - 2L Wall Switch 62 2,000 Relamp Yes 2 LED - Linear Tubes: (2) 4' LampsOccupancy
Sensor29 1,400 0.05 192 0.0 $30.98 $233.00 $40.00 6.23
Room 301B 2 Linear Fluorescent - T8: 4' T8 (32W) - 2L Wall Switch 62 2,000 Relamp Yes 2 LED - Linear Tubes: (2) 4' LampsOccupancy
Sensor29 1,400 0.05 192 0.0 $30.98 $233.00 $40.00 6.23
Room 303 2 Exit Signs: LED - 2 W Lamp None 6 8,760 None No 2 Exit Signs: LED - 2 W Lamp None 6 8,760 0.00 0 0.0 $0.00 $0.00 $0.00 0.00
Room 303 15 Linear Fluorescent - T8: 4' T8 (32W) - 3L Wall Switch 93 2,000 Relamp Yes 15 LED - Linear Tubes: (3) 4' LampsOccupancy
Sensor44 1,400 0.62 2,158 0.0 $348.55 $1,244.00 $245.00 2.87
Room 302 27 Linear Fluorescent - T8: 4' T8 (32W) - 4L Wall Switch 114 2,000 Relamp Yes 27 LED - Linear Tubes: (4) 4' LampsOccupancy
Sensor58 1,400 1.30 4,558 0.0 $736.22 $2,800.60 $580.00 3.02
Room 307 10 Linear Fluorescent - T8: 4' T8 (32W) - 2L Wall Switch 62 2,000 Relamp Yes 10 LED - Linear Tubes: (2) 4' LampsOccupancy
Sensor29 1,400 0.27 959 0.0 $154.91 $701.00 $120.00 3.75
Office 6 Linear Fluorescent - T8: 4' T8 (32W) - 2L Wall Switch 62 2,000 Relamp Yes 6 LED - Linear Tubes: (2) 4' LampsOccupancy
Sensor29 1,400 0.16 575 0.0 $92.95 $467.00 $80.00 4.16
Room 306 12 Linear Fluorescent - T8: 4' T8 (32W) - 4L Wall Switch 114 2,000 Relamp Yes 12 LED - Linear Tubes: (4) 4' LampsOccupancy
Sensor58 1,400 0.58 2,026 0.0 $327.21 $1,257.60 $260.00 3.05
Bathroom 1 Linear Fluorescent - T8: 4' T8 (32W) - 2LOccupancy
Sensor62 1,500 Relamp No 1 LED - Linear Tubes: (2) 4' Lamps
Occupancy
Sensor29 1,500 0.02 57 0.0 $9.19 $58.50 $10.00 5.27
Electrical room 1 Linear Fluorescent - T8: 4' T8 (32W) - 2L Wall Switch 62 2,000 Relamp No 1 LED - Linear Tubes: (2) 4' Lamps Wall Switch 29 2,000 0.02 76 0.0 $12.26 $58.50 $10.00 3.96
Room 308 12 Linear Fluorescent - T8: 4' T8 (32W) - 3L Wall Switch 93 2,000 Relamp Yes 12 LED - Linear Tubes: (3) 4' LampsOccupancy
Sensor44 1,400 0.49 1,726 0.0 $278.84 $1,018.40 $200.00 2.94
Room 310 12 Linear Fluorescent - T8: 4' T8 (32W) - 3L Wall Switch 93 2,000 Relamp Yes 12 LED - Linear Tubes: (3) 4' LampsOccupancy
Sensor44 1,400 0.49 1,726 0.0 $278.84 $1,018.40 $200.00 2.94
Room 312 12 Linear Fluorescent - T8: 4' T8 (32W) - 4L Wall Switch 114 2,000 Relamp Yes 12 LED - Linear Tubes: (4) 4' LampsOccupancy
Sensor58 1,400 0.58 2,026 0.0 $327.21 $1,257.60 $260.00 3.05
Room 314 12 Linear Fluorescent - T8: 4' T8 (32W) - 4L Wall Switch 114 2,000 Relamp Yes 12 LED - Linear Tubes: (4) 4' LampsOccupancy
Sensor58 1,400 0.58 2,026 0.0 $327.21 $1,257.60 $260.00 3.05
Room 316 18 Linear Fluorescent - T8: 4' T8 (32W) - 3L Wall Switch 93 2,000 Relamp Yes 18 LED - Linear Tubes: (3) 4' LampsOccupancy
Sensor44 1,400 0.74 2,590 0.0 $418.26 $1,585.60 $310.00 3.05
Room 321 9 Linear Fluorescent - T8: 4' T8 (32W) - 4L Wall Switch 114 2,000 Relamp Yes 9 LED - Linear Tubes: (4) 4' LampsOccupancy
Sensor58 1,400 0.43 1,519 0.0 $245.41 $972.20 $200.00 3.15
Room 319 9 Linear Fluorescent - T8: 4' T8 (32W) - 4L Wall Switch 114 2,000 Relamp Yes 9 LED - Linear Tubes: (4) 4' LampsOccupancy
Sensor58 1,400 0.43 1,519 0.0 $245.41 $972.20 $200.00 3.15
Room 317 12 Linear Fluorescent - T8: 4' T8 (32W) - 3L Wall Switch 93 2,000 Relamp Yes 12 LED - Linear Tubes: (3) 4' LampsOccupancy
Sensor44 1,400 0.49 1,726 0.0 $278.84 $1,018.40 $200.00 2.94
Room 315 8 Linear Fluorescent - T8: 4' T8 (32W) - 3L Wall Switch 93 2,000 Relamp Yes 8 LED - Linear Tubes: (3) 4' LampsOccupancy
Sensor44 1,400 0.33 1,151 0.0 $185.89 $717.60 $140.00 3.11
Room 401 6 Linear Fluorescent - T8: 4' T8 (32W) - 3L Wall Switch 93 2,000 Relamp Yes 6 LED - Linear Tubes: (3) 4' LampsOccupancy
Sensor44 1,400 0.25 863 0.0 $139.42 $567.20 $110.00 3.28
Room 405 11 Linear Fluorescent - T8: 4' T8 (32W) - 3L Wall Switch 93 2,000 Relamp Yes 11 LED - Linear Tubes: (3) 4' LampsOccupancy
Sensor44 1,400 0.45 1,583 0.0 $255.60 $943.20 $185.00 2.97
Room 405 5 Linear Fluorescent - T8: 4' T8 (32W) - 2L Wall Switch 62 2,000 Relamp Yes 5 LED - Linear Tubes: (2) 4' LampsOccupancy
Sensor29 1,400 0.14 480 0.0 $77.46 $408.50 $70.00 4.37
Electrical Closet 1 Linear Fluorescent - T8: 4' T8 (32W) - 4L Wall Switch 114 2,000 Relamp No 1 LED - Linear Tubes: (4) 4' Lamps Wall Switch 58 2,000 0.04 129 0.0 $20.80 $95.13 $20.00 3.61
Room 411 5 Linear Fluorescent - T8: 4' T8 (32W) - 3L Wall Switch 93 2,000 Relamp Yes 5 LED - Linear Tubes: (3) 4' LampsOccupancy
Sensor44 1,400 0.21 719 0.0 $116.18 $492.00 $95.00 3.42
Room 409 11 Linear Fluorescent - T8: 4' T8 (32W) - 4L Wall Switch 114 2,000 Relamp Yes 11 LED - Linear Tubes: (4) 4' LampsOccupancy
Sensor58 1,400 0.53 1,857 0.0 $299.94 $1,162.47 $240.00 3.08
Existing Conditions Proposed Conditions Energy Impact & Financial Analysis
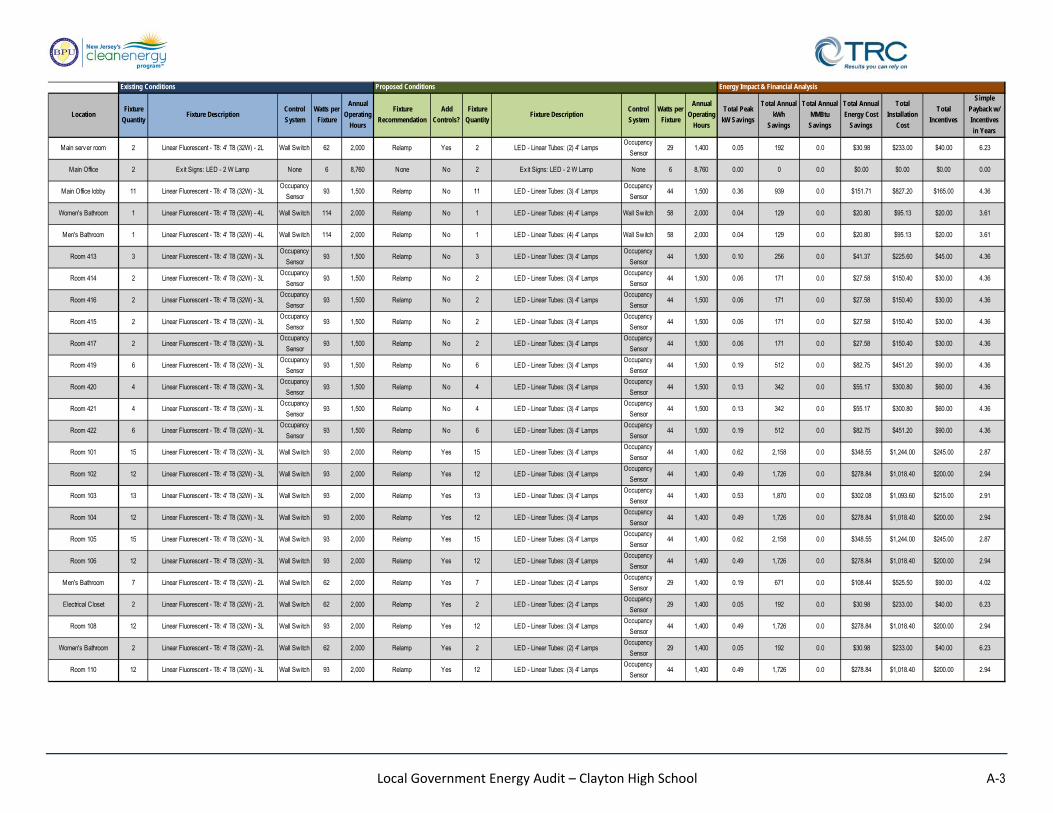
Local Government Energy Audit – Clayton High School A‐3
LocationFixture
QuantityFixture Description
Control
System
Watts per
Fixture
Annual
Operating
Hours
Fixture
Recommendation
Add
Controls?
Fixture
QuantityFixture Description
Control
System
Watts per
Fixture
Annual
Operating
Hours
Total Peak
kW Savings
Total Annual
kWh
Savings
Total Annual
MMBtu
Savings
Total Annual
Energy Cost
Savings
Total
Installation
Cost
Total
Incentives
Simple
Payback w/
Incentives
in Years
Main server room 2 Linear Fluorescent - T8: 4' T8 (32W) - 2L Wall Switch 62 2,000 Relamp Yes 2 LED - Linear Tubes: (2) 4' LampsOccupancy
Sensor29 1,400 0.05 192 0.0 $30.98 $233.00 $40.00 6.23
Main Office 2 Exit Signs: LED - 2 W Lamp None 6 8,760 None No 2 Exit Signs: LED - 2 W Lamp None 6 8,760 0.00 0 0.0 $0.00 $0.00 $0.00 0.00
Main Office lobby 11 Linear Fluorescent - T8: 4' T8 (32W) - 3LOccupancy
Sensor93 1,500 Relamp No 11 LED - Linear Tubes: (3) 4' Lamps
Occupancy
Sensor44 1,500 0.36 939 0.0 $151.71 $827.20 $165.00 4.36
Women's Bathroom 1 Linear Fluorescent - T8: 4' T8 (32W) - 4L Wall Switch 114 2,000 Relamp No 1 LED - Linear Tubes: (4) 4' Lamps Wall Switch 58 2,000 0.04 129 0.0 $20.80 $95.13 $20.00 3.61
Men's Bathroom 1 Linear Fluorescent - T8: 4' T8 (32W) - 4L Wall Switch 114 2,000 Relamp No 1 LED - Linear Tubes: (4) 4' Lamps Wall Switch 58 2,000 0.04 129 0.0 $20.80 $95.13 $20.00 3.61
Room 413 3 Linear Fluorescent - T8: 4' T8 (32W) - 3LOccupancy
Sensor93 1,500 Relamp No 3 LED - Linear Tubes: (3) 4' Lamps
Occupancy
Sensor44 1,500 0.10 256 0.0 $41.37 $225.60 $45.00 4.36
Room 414 2 Linear Fluorescent - T8: 4' T8 (32W) - 3LOccupancy
Sensor93 1,500 Relamp No 2 LED - Linear Tubes: (3) 4' Lamps
Occupancy
Sensor44 1,500 0.06 171 0.0 $27.58 $150.40 $30.00 4.36
Room 416 2 Linear Fluorescent - T8: 4' T8 (32W) - 3LOccupancy
Sensor93 1,500 Relamp No 2 LED - Linear Tubes: (3) 4' Lamps
Occupancy
Sensor44 1,500 0.06 171 0.0 $27.58 $150.40 $30.00 4.36
Room 415 2 Linear Fluorescent - T8: 4' T8 (32W) - 3LOccupancy
Sensor93 1,500 Relamp No 2 LED - Linear Tubes: (3) 4' Lamps
Occupancy
Sensor44 1,500 0.06 171 0.0 $27.58 $150.40 $30.00 4.36
Room 417 2 Linear Fluorescent - T8: 4' T8 (32W) - 3LOccupancy
Sensor93 1,500 Relamp No 2 LED - Linear Tubes: (3) 4' Lamps
Occupancy
Sensor44 1,500 0.06 171 0.0 $27.58 $150.40 $30.00 4.36
Room 419 6 Linear Fluorescent - T8: 4' T8 (32W) - 3LOccupancy
Sensor93 1,500 Relamp No 6 LED - Linear Tubes: (3) 4' Lamps
Occupancy
Sensor44 1,500 0.19 512 0.0 $82.75 $451.20 $90.00 4.36
Room 420 4 Linear Fluorescent - T8: 4' T8 (32W) - 3LOccupancy
Sensor93 1,500 Relamp No 4 LED - Linear Tubes: (3) 4' Lamps
Occupancy
Sensor44 1,500 0.13 342 0.0 $55.17 $300.80 $60.00 4.36
Room 421 4 Linear Fluorescent - T8: 4' T8 (32W) - 3LOccupancy
Sensor93 1,500 Relamp No 4 LED - Linear Tubes: (3) 4' Lamps
Occupancy
Sensor44 1,500 0.13 342 0.0 $55.17 $300.80 $60.00 4.36
Room 422 6 Linear Fluorescent - T8: 4' T8 (32W) - 3LOccupancy
Sensor93 1,500 Relamp No 6 LED - Linear Tubes: (3) 4' Lamps
Occupancy
Sensor44 1,500 0.19 512 0.0 $82.75 $451.20 $90.00 4.36
Room 101 15 Linear Fluorescent - T8: 4' T8 (32W) - 3L Wall Switch 93 2,000 Relamp Yes 15 LED - Linear Tubes: (3) 4' LampsOccupancy
Sensor44 1,400 0.62 2,158 0.0 $348.55 $1,244.00 $245.00 2.87
Room 102 12 Linear Fluorescent - T8: 4' T8 (32W) - 3L Wall Switch 93 2,000 Relamp Yes 12 LED - Linear Tubes: (3) 4' LampsOccupancy
Sensor44 1,400 0.49 1,726 0.0 $278.84 $1,018.40 $200.00 2.94
Room 103 13 Linear Fluorescent - T8: 4' T8 (32W) - 3L Wall Switch 93 2,000 Relamp Yes 13 LED - Linear Tubes: (3) 4' LampsOccupancy
Sensor44 1,400 0.53 1,870 0.0 $302.08 $1,093.60 $215.00 2.91
Room 104 12 Linear Fluorescent - T8: 4' T8 (32W) - 3L Wall Switch 93 2,000 Relamp Yes 12 LED - Linear Tubes: (3) 4' LampsOccupancy
Sensor44 1,400 0.49 1,726 0.0 $278.84 $1,018.40 $200.00 2.94
Room 105 15 Linear Fluorescent - T8: 4' T8 (32W) - 3L Wall Switch 93 2,000 Relamp Yes 15 LED - Linear Tubes: (3) 4' LampsOccupancy
Sensor44 1,400 0.62 2,158 0.0 $348.55 $1,244.00 $245.00 2.87
Room 106 12 Linear Fluorescent - T8: 4' T8 (32W) - 3L Wall Switch 93 2,000 Relamp Yes 12 LED - Linear Tubes: (3) 4' LampsOccupancy
Sensor44 1,400 0.49 1,726 0.0 $278.84 $1,018.40 $200.00 2.94
Men's Bathroom 7 Linear Fluorescent - T8: 4' T8 (32W) - 2L Wall Switch 62 2,000 Relamp Yes 7 LED - Linear Tubes: (2) 4' LampsOccupancy
Sensor29 1,400 0.19 671 0.0 $108.44 $525.50 $90.00 4.02
Electrical Closet 2 Linear Fluorescent - T8: 4' T8 (32W) - 2L Wall Switch 62 2,000 Relamp Yes 2 LED - Linear Tubes: (2) 4' LampsOccupancy
Sensor29 1,400 0.05 192 0.0 $30.98 $233.00 $40.00 6.23
Room 108 12 Linear Fluorescent - T8: 4' T8 (32W) - 3L Wall Switch 93 2,000 Relamp Yes 12 LED - Linear Tubes: (3) 4' LampsOccupancy
Sensor44 1,400 0.49 1,726 0.0 $278.84 $1,018.40 $200.00 2.94
Women's Bathroom 2 Linear Fluorescent - T8: 4' T8 (32W) - 2L Wall Switch 62 2,000 Relamp Yes 2 LED - Linear Tubes: (2) 4' LampsOccupancy
Sensor29 1,400 0.05 192 0.0 $30.98 $233.00 $40.00 6.23
Room 110 12 Linear Fluorescent - T8: 4' T8 (32W) - 3L Wall Switch 93 2,000 Relamp Yes 12 LED - Linear Tubes: (3) 4' LampsOccupancy
Sensor44 1,400 0.49 1,726 0.0 $278.84 $1,018.40 $200.00 2.94
Existing Conditions Proposed Conditions Energy Impact & Financial Analysis
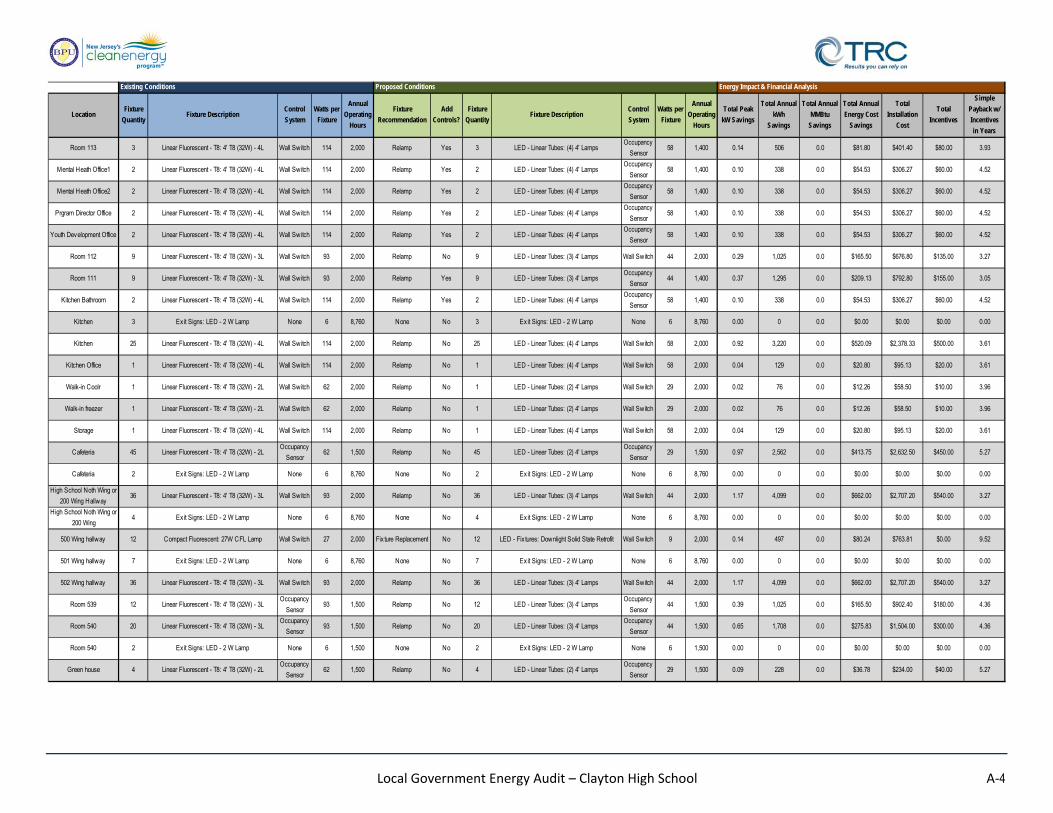
Local Government Energy Audit – Clayton High School A‐4
LocationFixture
QuantityFixture Description
Control
System
Watts per
Fixture
Annual
Operating
Hours
Fixture
Recommendation
Add
Controls?
Fixture
QuantityFixture Description
Control
System
Watts per
Fixture
Annual
Operating
Hours
Total Peak
kW Savings
Total Annual
kWh
Savings
Total Annual
MMBtu
Savings
Total Annual
Energy Cost
Savings
Total
Installation
Cost
Total
Incentives
Simple
Payback w/
Incentives
in Years
Room 113 3 Linear Fluorescent - T8: 4' T8 (32W) - 4L Wall Switch 114 2,000 Relamp Yes 3 LED - Linear Tubes: (4) 4' LampsOccupancy
Sensor58 1,400 0.14 506 0.0 $81.80 $401.40 $80.00 3.93
Mental Heath Office1 2 Linear Fluorescent - T8: 4' T8 (32W) - 4L Wall Switch 114 2,000 Relamp Yes 2 LED - Linear Tubes: (4) 4' LampsOccupancy
Sensor58 1,400 0.10 338 0.0 $54.53 $306.27 $60.00 4.52
Mental Heath Office2 2 Linear Fluorescent - T8: 4' T8 (32W) - 4L Wall Switch 114 2,000 Relamp Yes 2 LED - Linear Tubes: (4) 4' LampsOccupancy
Sensor58 1,400 0.10 338 0.0 $54.53 $306.27 $60.00 4.52
Prgram Director Office 2 Linear Fluorescent - T8: 4' T8 (32W) - 4L Wall Switch 114 2,000 Relamp Yes 2 LED - Linear Tubes: (4) 4' LampsOccupancy
Sensor58 1,400 0.10 338 0.0 $54.53 $306.27 $60.00 4.52
Youth Development Office 2 Linear Fluorescent - T8: 4' T8 (32W) - 4L Wall Switch 114 2,000 Relamp Yes 2 LED - Linear Tubes: (4) 4' LampsOccupancy
Sensor58 1,400 0.10 338 0.0 $54.53 $306.27 $60.00 4.52
Room 112 9 Linear Fluorescent - T8: 4' T8 (32W) - 3L Wall Switch 93 2,000 Relamp No 9 LED - Linear Tubes: (3) 4' Lamps Wall Switch 44 2,000 0.29 1,025 0.0 $165.50 $676.80 $135.00 3.27
Room 111 9 Linear Fluorescent - T8: 4' T8 (32W) - 3L Wall Switch 93 2,000 Relamp Yes 9 LED - Linear Tubes: (3) 4' LampsOccupancy
Sensor44 1,400 0.37 1,295 0.0 $209.13 $792.80 $155.00 3.05
Kitchen Bathroom 2 Linear Fluorescent - T8: 4' T8 (32W) - 4L Wall Switch 114 2,000 Relamp Yes 2 LED - Linear Tubes: (4) 4' LampsOccupancy
Sensor58 1,400 0.10 338 0.0 $54.53 $306.27 $60.00 4.52
Kitchen 3 Exit Signs: LED - 2 W Lamp None 6 8,760 None No 3 Exit Signs: LED - 2 W Lamp None 6 8,760 0.00 0 0.0 $0.00 $0.00 $0.00 0.00
Kitchen 25 Linear Fluorescent - T8: 4' T8 (32W) - 4L Wall Switch 114 2,000 Relamp No 25 LED - Linear Tubes: (4) 4' Lamps Wall Switch 58 2,000 0.92 3,220 0.0 $520.09 $2,378.33 $500.00 3.61
Kitchen Office 1 Linear Fluorescent - T8: 4' T8 (32W) - 4L Wall Switch 114 2,000 Relamp No 1 LED - Linear Tubes: (4) 4' Lamps Wall Switch 58 2,000 0.04 129 0.0 $20.80 $95.13 $20.00 3.61
Walk-in Coolr 1 Linear Fluorescent - T8: 4' T8 (32W) - 2L Wall Switch 62 2,000 Relamp No 1 LED - Linear Tubes: (2) 4' Lamps Wall Switch 29 2,000 0.02 76 0.0 $12.26 $58.50 $10.00 3.96
Walk-in freezer 1 Linear Fluorescent - T8: 4' T8 (32W) - 2L Wall Switch 62 2,000 Relamp No 1 LED - Linear Tubes: (2) 4' Lamps Wall Switch 29 2,000 0.02 76 0.0 $12.26 $58.50 $10.00 3.96
Storage 1 Linear Fluorescent - T8: 4' T8 (32W) - 4L Wall Switch 114 2,000 Relamp No 1 LED - Linear Tubes: (4) 4' Lamps Wall Switch 58 2,000 0.04 129 0.0 $20.80 $95.13 $20.00 3.61
Cafeteria 45 Linear Fluorescent - T8: 4' T8 (32W) - 2LOccupancy
Sensor62 1,500 Relamp No 45 LED - Linear Tubes: (2) 4' Lamps
Occupancy
Sensor29 1,500 0.97 2,562 0.0 $413.75 $2,632.50 $450.00 5.27
Cafeteria 2 Exit Signs: LED - 2 W Lamp None 6 8,760 None No 2 Exit Signs: LED - 2 W Lamp None 6 8,760 0.00 0 0.0 $0.00 $0.00 $0.00 0.00
High School Noth Wing or
200 Wing Hallway36 Linear Fluorescent - T8: 4' T8 (32W) - 3L Wall Switch 93 2,000 Relamp No 36 LED - Linear Tubes: (3) 4' Lamps Wall Switch 44 2,000 1.17 4,099 0.0 $662.00 $2,707.20 $540.00 3.27
High School Noth Wing or
200 Wing4 Exit Signs: LED - 2 W Lamp None 6 8,760 None No 4 Exit Signs: LED - 2 W Lamp None 6 8,760 0.00 0 0.0 $0.00 $0.00 $0.00 0.00
500 Wing hallway 12 Compact Fluorescent: 27W CFL Lamp Wall Switch 27 2,000 Fix ture Replacement No 12 LED - Fix tures: Downlight Solid State Retrofit Wall Switch 9 2,000 0.14 497 0.0 $80.24 $763.81 $0.00 9.52
501 Wing hallway 7 Exit Signs: LED - 2 W Lamp None 6 8,760 None No 7 Exit Signs: LED - 2 W Lamp None 6 8,760 0.00 0 0.0 $0.00 $0.00 $0.00 0.00
502 Wing hallway 36 Linear Fluorescent - T8: 4' T8 (32W) - 3L Wall Switch 93 2,000 Relamp No 36 LED - Linear Tubes: (3) 4' Lamps Wall Switch 44 2,000 1.17 4,099 0.0 $662.00 $2,707.20 $540.00 3.27
Room 539 12 Linear Fluorescent - T8: 4' T8 (32W) - 3LOccupancy
Sensor93 1,500 Relamp No 12 LED - Linear Tubes: (3) 4' Lamps
Occupancy
Sensor44 1,500 0.39 1,025 0.0 $165.50 $902.40 $180.00 4.36
Room 540 20 Linear Fluorescent - T8: 4' T8 (32W) - 3LOccupancy
Sensor93 1,500 Relamp No 20 LED - Linear Tubes: (3) 4' Lamps
Occupancy
Sensor44 1,500 0.65 1,708 0.0 $275.83 $1,504.00 $300.00 4.36
Room 540 2 Exit Signs: LED - 2 W Lamp None 6 1,500 None No 2 Exit Signs: LED - 2 W Lamp None 6 1,500 0.00 0 0.0 $0.00 $0.00 $0.00 0.00
Green house 4 Linear Fluorescent - T8: 4' T8 (32W) - 2LOccupancy
Sensor62 1,500 Relamp No 4 LED - Linear Tubes: (2) 4' Lamps
Occupancy
Sensor29 1,500 0.09 228 0.0 $36.78 $234.00 $40.00 5.27
Existing Conditions Proposed Conditions Energy Impact & Financial Analysis

Local Government Energy Audit – Clayton High School A‐5
LocationFixture
QuantityFixture Description
Control
System
Watts per
Fixture
Annual
Operating
Hours
Fixture
Recommendation
Add
Controls?
Fixture
QuantityFixture Description
Control
System
Watts per
Fixture
Annual
Operating
Hours
Total Peak
kW Savings
Total Annual
kWh
Savings
Total Annual
MMBtu
Savings
Total Annual
Energy Cost
Savings
Total
Installation
Cost
Total
Incentives
Simple
Payback w/
Incentives
in Years
Room 537 12 Linear Fluorescent - T8: 4' T8 (32W) - 3LOccupancy
Sensor93 1,500 Relamp No 12 LED - Linear Tubes: (3) 4' Lamps
Occupancy
Sensor44 1,500 0.39 1,025 0.0 $165.50 $902.40 $180.00 4.36
Room 538 5 Linear Fluorescent - T8: 4' T8 (32W) - 3LOccupancy
Sensor93 1,500 Relamp No 5 LED - Linear Tubes: (3) 4' Lamps
Occupancy
Sensor44 1,500 0.16 427 0.0 $68.96 $376.00 $75.00 4.36
Room 536 20 Linear Fluorescent - T8: 4' T8 (32W) - 3LOccupancy
Sensor93 1,500 Relamp No 20 LED - Linear Tubes: (3) 4' Lamps
Occupancy
Sensor44 1,500 0.65 1,708 0.0 $275.83 $1,504.00 $300.00 4.36
Room 535 12 Linear Fluorescent - T8: 4' T8 (32W) - 3LOccupancy
Sensor93 1,500 Relamp No 12 LED - Linear Tubes: (3) 4' Lamps
Occupancy
Sensor44 1,500 0.39 1,025 0.0 $165.50 $902.40 $180.00 4.36
Room 533 20 Linear Fluorescent - T8: 4' T8 (32W) - 3LOccupancy
Sensor93 1,500 Relamp No 20 LED - Linear Tubes: (3) 4' Lamps
Occupancy
Sensor44 1,500 0.65 1,708 0.0 $275.83 $1,504.00 $300.00 4.36
Room 533 2 Exit Signs: LED - 2 W Lamp None 6 8,760 None No 2 Exit Signs: LED - 2 W Lamp None 6 8,760 0.00 0 0.0 $0.00 $0.00 $0.00 0.00
Room 534 23 Linear Fluorescent - T8: 4' T8 (32W) - 3LOccupancy
Sensor93 1,500 Relamp No 23 LED - Linear Tubes: (3) 4' Lamps
Occupancy
Sensor44 1,500 0.75 1,964 0.0 $317.21 $1,729.60 $345.00 4.36
Room 534 2 Exit Signs: LED - 2 W Lamp None 6 8,760 None No 2 Exit Signs: LED - 2 W Lamp None 6 8,760 0.00 0 0.0 $0.00 $0.00 $0.00 0.00
Room 530 6 Linear Fluorescent - T8: 4' T8 (32W) - 2LOccupancy
Sensor62 1,500 Relamp No 6 LED - Linear Tubes: (2) 4' Lamps
Occupancy
Sensor29 1,500 0.13 342 0.0 $55.17 $351.00 $60.00 5.27
Room 530 1 Exit Signs: LED - 2 W Lamp None 6 8,760 None No 1 Exit Signs: LED - 2 W Lamp None 6 8,760 0.00 0 0.0 $0.00 $0.00 $0.00 0.00
Women's Staff Batroom 1 Linear Fluorescent - T8: 4' T8 (32W) - 3LOccupancy
Sensor93 1,500 Relamp No 1 LED - Linear Tubes: (3) 4' Lamps
Occupancy
Sensor44 1,500 0.03 85 0.0 $13.79 $75.20 $15.00 4.36
Men's Men's Batroom 1 Linear Fluorescent - T8: 4' T8 (32W) - 3LOccupancy
Sensor93 1,500 Relamp No 1 LED - Linear Tubes: (3) 4' Lamps
Occupancy
Sensor44 1,500 0.03 85 0.0 $13.79 $75.20 $15.00 4.36
Girls Bathroom 4 Linear Fluorescent - T8: 4' T8 (32W) - 3LOccupancy
Sensor93 1,500 Relamp No 4 LED - Linear Tubes: (3) 4' Lamps
Occupancy
Sensor44 1,500 0.13 342 0.0 $55.17 $300.80 $60.00 4.36
Room 526 12 Linear Fluorescent - T8: 4' T8 (32W) - 3LOccupancy
Sensor93 1,500 Relamp No 12 LED - Linear Tubes: (3) 4' Lamps
Occupancy
Sensor44 1,500 0.39 1,025 0.0 $165.50 $902.40 $180.00 4.36
Room 529 12 Linear Fluorescent - T8: 4' T8 (32W) - 3LOccupancy
Sensor93 1,500 Relamp No 12 LED - Linear Tubes: (3) 4' Lamps
Occupancy
Sensor44 1,500 0.39 1,025 0.0 $165.50 $902.40 $180.00 4.36
Room 524 12 Linear Fluorescent - T8: 4' T8 (32W) - 3LOccupancy
Sensor93 1,500 Relamp No 12 LED - Linear Tubes: (3) 4' Lamps
Occupancy
Sensor44 1,500 0.39 1,025 0.0 $165.50 $902.40 $180.00 4.36
Room 522 12 Linear Fluorescent - T8: 4' T8 (32W) - 3LOccupancy
Sensor93 1,500 Relamp No 12 LED - Linear Tubes: (3) 4' Lamps
Occupancy
Sensor44 1,500 0.39 1,025 0.0 $165.50 $902.40 $180.00 4.36
Room 521 12 Linear Fluorescent - T8: 4' T8 (32W) - 3LOccupancy
Sensor93 1,500 Relamp No 12 LED - Linear Tubes: (3) 4' Lamps
Occupancy
Sensor44 1,500 0.39 1,025 0.0 $165.50 $902.40 $180.00 4.36
Closet 1 Linear Fluorescent - T8: 4' T8 (32W) - 2LOccupancy
Sensor62 1,500 Relamp No 1 LED - Linear Tubes: (2) 4' Lamps
Occupancy
Sensor29 1,500 0.02 57 0.0 $9.19 $58.50 $10.00 5.27
Boys Bathroom 3 Linear Fluorescent - T8: 4' T8 (32W) - 3LOccupancy
Sensor93 1,500 Relamp No 3 LED - Linear Tubes: (3) 4' Lamps
Occupancy
Sensor44 1,500 0.10 256 0.0 $41.37 $225.60 $45.00 4.36
Storage 4 Linear Fluorescent - T8: 4' T8 (32W) - 2LOccupancy
Sensor62 1,500 Relamp No 4 LED - Linear Tubes: (2) 4' Lamps
Occupancy
Sensor29 1,500 0.09 228 0.0 $36.78 $234.00 $40.00 5.27
Room 516 (Lbrary) 65 Linear Fluorescent - T8: 4' T8 (32W) - 3LOccupancy
Sensor93 1,500 Relamp No 65 LED - Linear Tubes: (3) 4' Lamps
Occupancy
Sensor44 1,500 2.11 5,550 0.0 $896.46 $4,888.00 $975.00 4.36
Room 516 (Lbrary) 3 Exit Signs: LED - 2 W Lamp None 6 8,760 None No 3 Exit Signs: LED - 2 W Lamp None 6 8,760 0.00 0 0.0 $0.00 $0.00 $0.00 0.00
Room 516 (Lbrary) 12 Compact Fluorescent: 27W CFL LampOccupancy
Sensor27 1,500 Fix ture Replacement No 12 LED - Fix tures: Downlight Solid State Retrofit
Occupancy
Sensor9 1,500 0.14 373 0.0 $60.18 $763.81 $0.00 12.69
Room 517 4 Linear Fluorescent - T8: 4' T8 (32W) - 3LOccupancy
Sensor93 1,500 Relamp No 4 LED - Linear Tubes: (3) 4' Lamps
Occupancy
Sensor44 1,500 0.13 342 0.0 $55.17 $300.80 $60.00 4.36
Existing Conditions Proposed Conditions Energy Impact & Financial Analysis
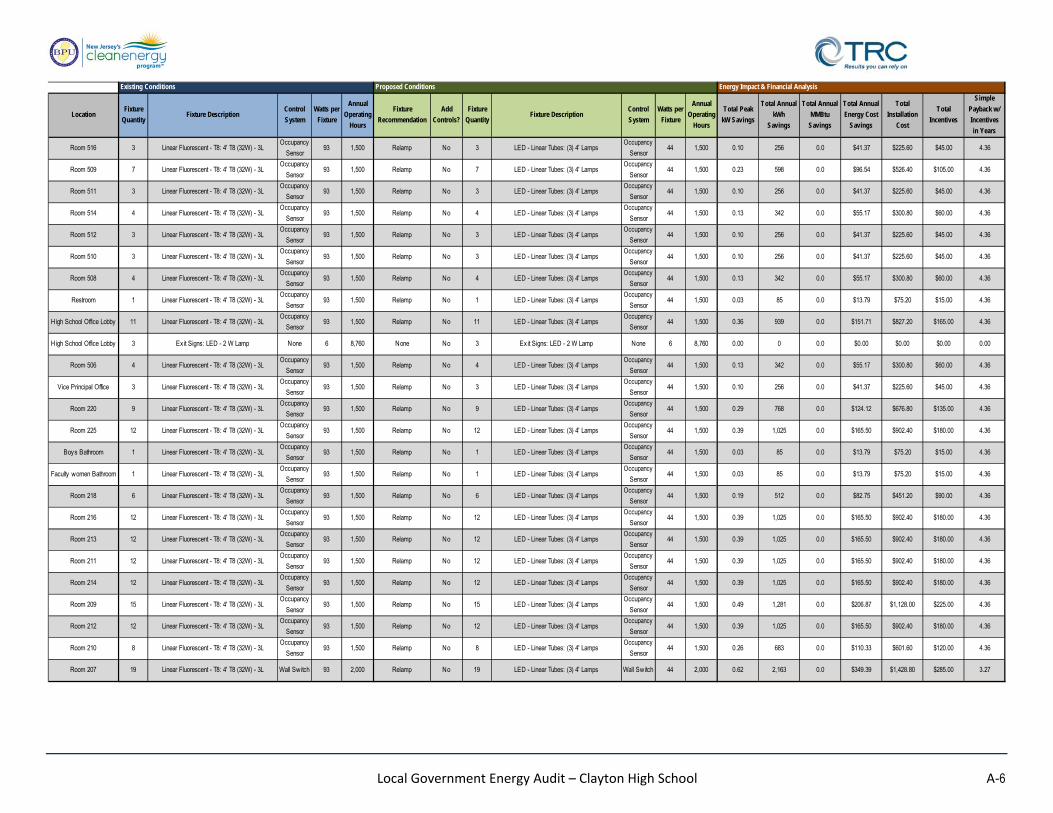
Local Government Energy Audit – Clayton High School A‐6
LocationFixture
QuantityFixture Description
Control
System
Watts per
Fixture
Annual
Operating
Hours
Fixture
Recommendation
Add
Controls?
Fixture
QuantityFixture Description
Control
System
Watts per
Fixture
Annual
Operating
Hours
Total Peak
kW Savings
Total Annual
kWh
Savings
Total Annual
MMBtu
Savings
Total Annual
Energy Cost
Savings
Total
Installation
Cost
Total
Incentives
Simple
Payback w/
Incentives
in Years
Room 516 3 Linear Fluorescent - T8: 4' T8 (32W) - 3LOccupancy
Sensor93 1,500 Relamp No 3 LED - Linear Tubes: (3) 4' Lamps
Occupancy
Sensor44 1,500 0.10 256 0.0 $41.37 $225.60 $45.00 4.36
Room 509 7 Linear Fluorescent - T8: 4' T8 (32W) - 3LOccupancy
Sensor93 1,500 Relamp No 7 LED - Linear Tubes: (3) 4' Lamps
Occupancy
Sensor44 1,500 0.23 598 0.0 $96.54 $526.40 $105.00 4.36
Room 511 3 Linear Fluorescent - T8: 4' T8 (32W) - 3LOccupancy
Sensor93 1,500 Relamp No 3 LED - Linear Tubes: (3) 4' Lamps
Occupancy
Sensor44 1,500 0.10 256 0.0 $41.37 $225.60 $45.00 4.36
Room 514 4 Linear Fluorescent - T8: 4' T8 (32W) - 3LOccupancy
Sensor93 1,500 Relamp No 4 LED - Linear Tubes: (3) 4' Lamps
Occupancy
Sensor44 1,500 0.13 342 0.0 $55.17 $300.80 $60.00 4.36
Room 512 3 Linear Fluorescent - T8: 4' T8 (32W) - 3LOccupancy
Sensor93 1,500 Relamp No 3 LED - Linear Tubes: (3) 4' Lamps
Occupancy
Sensor44 1,500 0.10 256 0.0 $41.37 $225.60 $45.00 4.36
Room 510 3 Linear Fluorescent - T8: 4' T8 (32W) - 3LOccupancy
Sensor93 1,500 Relamp No 3 LED - Linear Tubes: (3) 4' Lamps
Occupancy
Sensor44 1,500 0.10 256 0.0 $41.37 $225.60 $45.00 4.36
Room 508 4 Linear Fluorescent - T8: 4' T8 (32W) - 3LOccupancy
Sensor93 1,500 Relamp No 4 LED - Linear Tubes: (3) 4' Lamps
Occupancy
Sensor44 1,500 0.13 342 0.0 $55.17 $300.80 $60.00 4.36
Restroom 1 Linear Fluorescent - T8: 4' T8 (32W) - 3LOccupancy
Sensor93 1,500 Relamp No 1 LED - Linear Tubes: (3) 4' Lamps
Occupancy
Sensor44 1,500 0.03 85 0.0 $13.79 $75.20 $15.00 4.36
High School Office Lobby 11 Linear Fluorescent - T8: 4' T8 (32W) - 3LOccupancy
Sensor93 1,500 Relamp No 11 LED - Linear Tubes: (3) 4' Lamps
Occupancy
Sensor44 1,500 0.36 939 0.0 $151.71 $827.20 $165.00 4.36
High School Office Lobby 3 Exit Signs: LED - 2 W Lamp None 6 8,760 None No 3 Exit Signs: LED - 2 W Lamp None 6 8,760 0.00 0 0.0 $0.00 $0.00 $0.00 0.00
Room 506 4 Linear Fluorescent - T8: 4' T8 (32W) - 3LOccupancy
Sensor93 1,500 Relamp No 4 LED - Linear Tubes: (3) 4' Lamps
Occupancy
Sensor44 1,500 0.13 342 0.0 $55.17 $300.80 $60.00 4.36
Vice Principal Office 3 Linear Fluorescent - T8: 4' T8 (32W) - 3LOccupancy
Sensor93 1,500 Relamp No 3 LED - Linear Tubes: (3) 4' Lamps
Occupancy
Sensor44 1,500 0.10 256 0.0 $41.37 $225.60 $45.00 4.36
Room 220 9 Linear Fluorescent - T8: 4' T8 (32W) - 3LOccupancy
Sensor93 1,500 Relamp No 9 LED - Linear Tubes: (3) 4' Lamps
Occupancy
Sensor44 1,500 0.29 768 0.0 $124.12 $676.80 $135.00 4.36
Room 225 12 Linear Fluorescent - T8: 4' T8 (32W) - 3LOccupancy
Sensor93 1,500 Relamp No 12 LED - Linear Tubes: (3) 4' Lamps
Occupancy
Sensor44 1,500 0.39 1,025 0.0 $165.50 $902.40 $180.00 4.36
Boys Bathroom 1 Linear Fluorescent - T8: 4' T8 (32W) - 3LOccupancy
Sensor93 1,500 Relamp No 1 LED - Linear Tubes: (3) 4' Lamps
Occupancy
Sensor44 1,500 0.03 85 0.0 $13.79 $75.20 $15.00 4.36
Faculty women Bathroom 1 Linear Fluorescent - T8: 4' T8 (32W) - 3LOccupancy
Sensor93 1,500 Relamp No 1 LED - Linear Tubes: (3) 4' Lamps
Occupancy
Sensor44 1,500 0.03 85 0.0 $13.79 $75.20 $15.00 4.36
Room 218 6 Linear Fluorescent - T8: 4' T8 (32W) - 3LOccupancy
Sensor93 1,500 Relamp No 6 LED - Linear Tubes: (3) 4' Lamps
Occupancy
Sensor44 1,500 0.19 512 0.0 $82.75 $451.20 $90.00 4.36
Room 216 12 Linear Fluorescent - T8: 4' T8 (32W) - 3LOccupancy
Sensor93 1,500 Relamp No 12 LED - Linear Tubes: (3) 4' Lamps
Occupancy
Sensor44 1,500 0.39 1,025 0.0 $165.50 $902.40 $180.00 4.36
Room 213 12 Linear Fluorescent - T8: 4' T8 (32W) - 3LOccupancy
Sensor93 1,500 Relamp No 12 LED - Linear Tubes: (3) 4' Lamps
Occupancy
Sensor44 1,500 0.39 1,025 0.0 $165.50 $902.40 $180.00 4.36
Room 211 12 Linear Fluorescent - T8: 4' T8 (32W) - 3LOccupancy
Sensor93 1,500 Relamp No 12 LED - Linear Tubes: (3) 4' Lamps
Occupancy
Sensor44 1,500 0.39 1,025 0.0 $165.50 $902.40 $180.00 4.36
Room 214 12 Linear Fluorescent - T8: 4' T8 (32W) - 3LOccupancy
Sensor93 1,500 Relamp No 12 LED - Linear Tubes: (3) 4' Lamps
Occupancy
Sensor44 1,500 0.39 1,025 0.0 $165.50 $902.40 $180.00 4.36
Room 209 15 Linear Fluorescent - T8: 4' T8 (32W) - 3LOccupancy
Sensor93 1,500 Relamp No 15 LED - Linear Tubes: (3) 4' Lamps
Occupancy
Sensor44 1,500 0.49 1,281 0.0 $206.87 $1,128.00 $225.00 4.36
Room 212 12 Linear Fluorescent - T8: 4' T8 (32W) - 3LOccupancy
Sensor93 1,500 Relamp No 12 LED - Linear Tubes: (3) 4' Lamps
Occupancy
Sensor44 1,500 0.39 1,025 0.0 $165.50 $902.40 $180.00 4.36
Room 210 8 Linear Fluorescent - T8: 4' T8 (32W) - 3LOccupancy
Sensor93 1,500 Relamp No 8 LED - Linear Tubes: (3) 4' Lamps
Occupancy
Sensor44 1,500 0.26 683 0.0 $110.33 $601.60 $120.00 4.36
Room 207 19 Linear Fluorescent - T8: 4' T8 (32W) - 3L Wall Switch 93 2,000 Relamp No 19 LED - Linear Tubes: (3) 4' Lamps Wall Switch 44 2,000 0.62 2,163 0.0 $349.39 $1,428.80 $285.00 3.27
Existing Conditions Proposed Conditions Energy Impact & Financial Analysis

Local Government Energy Audit – Clayton High School A‐7
LocationFixture
QuantityFixture Description
Control
System
Watts per
Fixture
Annual
Operating
Hours
Fixture
Recommendation
Add
Controls?
Fixture
QuantityFixture Description
Control
System
Watts per
Fixture
Annual
Operating
Hours
Total Peak
kW Savings
Total Annual
kWh
Savings
Total Annual
MMBtu
Savings
Total Annual
Energy Cost
Savings
Total
Installation
Cost
Total
Incentives
Simple
Payback w/
Incentives
in Years
Men Bathroom 3 Linear Fluorescent - T8: 4' T8 (32W) - 3LOccupancy
Sensor93 1,500 Relamp No 3 LED - Linear Tubes: (3) 4' Lamps
Occupancy
Sensor44 1,500 0.10 256 0.0 $41.37 $225.60 $45.00 4.36
Women Bathroom 4 Linear Fluorescent - T8: 4' T8 (32W) - 3LOccupancy
Sensor93 1,500 Relamp No 4 LED - Linear Tubes: (3) 4' Lamps
Occupancy
Sensor44 1,500 0.13 342 0.0 $55.17 $300.80 $60.00 4.36
Custodian Closet 2 Linear Fluorescent - T8: 4' T8 (32W) - 2LOccupancy
Sensor62 1,500 Relamp No 2 LED - Linear Tubes: (2) 4' Lamps
Occupancy
Sensor29 1,500 0.04 114 0.0 $18.39 $117.00 $20.00 5.27
Room 208 12 Linear Fluorescent - T8: 4' T8 (32W) - 3LOccupancy
Sensor93 1,500 Relamp No 12 LED - Linear Tubes: (3) 4' Lamps
Occupancy
Sensor44 1,500 0.39 1,025 0.0 $165.50 $902.40 $180.00 4.36
Room 206 12 Linear Fluorescent - T8: 4' T8 (32W) - 3LOccupancy
Sensor93 1,500 Relamp No 12 LED - Linear Tubes: (3) 4' Lamps
Occupancy
Sensor44 1,500 0.39 1,025 0.0 $165.50 $902.40 $180.00 4.36
Room 204 10 Linear Fluorescent - T8: 4' T8 (32W) - 3LOccupancy
Sensor93 1,500 Relamp No 10 LED - Linear Tubes: (3) 4' Lamps
Occupancy
Sensor44 1,500 0.32 854 0.0 $137.92 $752.00 $150.00 4.36
Room 202 3 Linear Fluorescent - T8: 4' T8 (32W) - 3LOccupancy
Sensor93 1,500 Relamp No 3 LED - Linear Tubes: (3) 4' Lamps
Occupancy
Sensor44 1,500 0.10 256 0.0 $41.37 $225.60 $45.00 4.36
Storage Room 6 Linear Fluorescent - T8: 4' T8 (32W) - 2L Wall Switch 62 2,000 Relamp Yes 6 LED - Linear Tubes: (2) 4' LampsOccupancy
Sensor29 1,400 0.16 575 0.0 $92.95 $467.00 $80.00 4.16
Electrical Closet 1 Linear Fluorescent - T8: 4' T8 (32W) - 2L Wall Switch 62 2,000 Relamp Yes 1 LED - Linear Tubes: (2) 4' LampsOccupancy
Sensor29 1,400 0.03 96 0.0 $15.49 $174.50 $30.00 9.33
Girls Locker Room 24 Linear Fluorescent - T8: 4' T8 (32W) - 2L Wall Switch 62 2,000 Relamp Yes 24 LED - Linear Tubes: (2) 4' LampsOccupancy
Sensor29 1,400 0.66 2,302 0.0 $371.79 $1,520.00 $260.00 3.39
Girls Locker Room 2 Exit Signs: LED - 2 W Lamp None 6 8,760 None No 2 Exit Signs: LED - 2 W Lamp None 6 8,760 0.00 0 0.0 $0.00 $0.00 $0.00 0.00
Office 2 Linear Fluorescent - T8: 4' T8 (32W) - 3L Wall Switch 93 2,000 Relamp Yes 2 LED - Linear Tubes: (3) 4' LampsOccupancy
Sensor44 1,400 0.08 288 0.0 $46.47 $266.40 $50.00 4.66
Bathroom 1 Linear Fluorescent - T8: 4' T8 (32W) - 2L Wall Switch 62 2,000 Relamp Yes 1 LED - Linear Tubes: (2) 4' LampsOccupancy
Sensor29 1,400 0.03 96 0.0 $15.49 $174.50 $30.00 9.33
Storage 1 Linear Fluorescent - T8: 4' T8 (32W) - 2L Wall Switch 62 2,000 Relamp No 1 LED - Linear Tubes: (2) 4' Lamps Wall Switch 29 2,000 0.02 76 0.0 $12.26 $58.50 $10.00 3.96
Locker Room Lobby 2 Linear Fluorescent - T8: 4' T8 (32W) - 3L Wall Switch 93 2,000 Relamp No 2 LED - Linear Tubes: (3) 4' Lamps Wall Switch 44 2,000 0.06 228 0.0 $36.78 $150.40 $30.00 3.27
Main Gymnasium 18 Metal Halide: (1) 400W Lamp Wall Switch 458 2,000 Fix ture Replacement No 18 LED - Fix tures: High-Bay Wall Switch 146 2,000 3.68 12,917 0.0 $2,086.30 $31,656.42 $2,700.00 13.88
Main Gymnasium 5 Exit Signs: LED - 2 W Lamp Wall Switch 6 2,000 None No 5 Exit Signs: LED - 2 W Lamp Wall Switch 6 2,000 0.00 0 0.0 $0.00 $0.00 $0.00 0.00
Auxilary Gym Lobby 4 Metal Halide: (1) 250W Lamp Wall Switch 295 2,000 Fix ture Replacement No 4 LED - Fixtures: Low-Bay Wall Switch 40 2,000 0.67 2,346 0.0 $378.92 $3,950.72 $600.00 8.84
Auxilary Gym Lobby 8 Linear Fluorescent - T8: 4' T8 (32W) - 1L Wall Switch 32 2,000 Relamp No 8 LED - Linear Tubes: (1) 4' Lamp Wall Switch 15 2,000 0.09 322 0.0 $52.01 $287.20 $40.00 4.75
Auxilary Gym Lobby 4 Ex it Signs: Incandescent None 14 8,760 LED Retrofit No 4 LED Exit Signs: 2 W Lamp None 6 8,760 0.02 322 0.0 $52.07 $430.22 $0.00 8.26
Room 221 2 Exit Signs: LED - 2 W Lamp None 6 8,760 None No 2 Exit Signs: LED - 2 W Lamp None 6 8,760 0.00 0 0.0 $0.00 $0.00 $0.00 0.00
Room 221 9 Linear Fluorescent - T8: 4' T8 (32W) - 2L Wall Switch 62 2,000 Relamp Yes 9 LED - Linear Tubes: (2) 4' LampsOccupancy
Sensor29 1,400 0.25 863 0.0 $139.42 $642.50 $110.00 3.82
Room 215 (Auxilary
Gymnasium)18 Metal Halide: (1) 400W Lamp Wall Switch 458 2,000 Fix ture Replacement No 18 LED - Fix tures: High-Bay Wall Switch 146 2,000 3.68 12,917 0.0 $2,086.30 $31,656.42 $2,700.00 13.88
Room 215 (Auxilary
Gymnasium)2 Exit Signs: LED - 2 W Lamp None 6 8,760 None No 2 Exit Signs: LED - 2 W Lamp None 6 8,760 0.00 0 0.0 $0.00 $0.00 $0.00 0.00
Room 227 ( Weigh Room) 14 Linear Fluorescent - T8: 4' T8 (32W) - 4L Wall Switch 114 2,000 Relamp No 14 LED - Linear Tubes: (4) 4' Lamps Wall Switch 58 2,000 0.51 1,803 0.0 $291.25 $1,331.87 $280.00 3.61
Existing Conditions Proposed Conditions Energy Impact & Financial Analysis
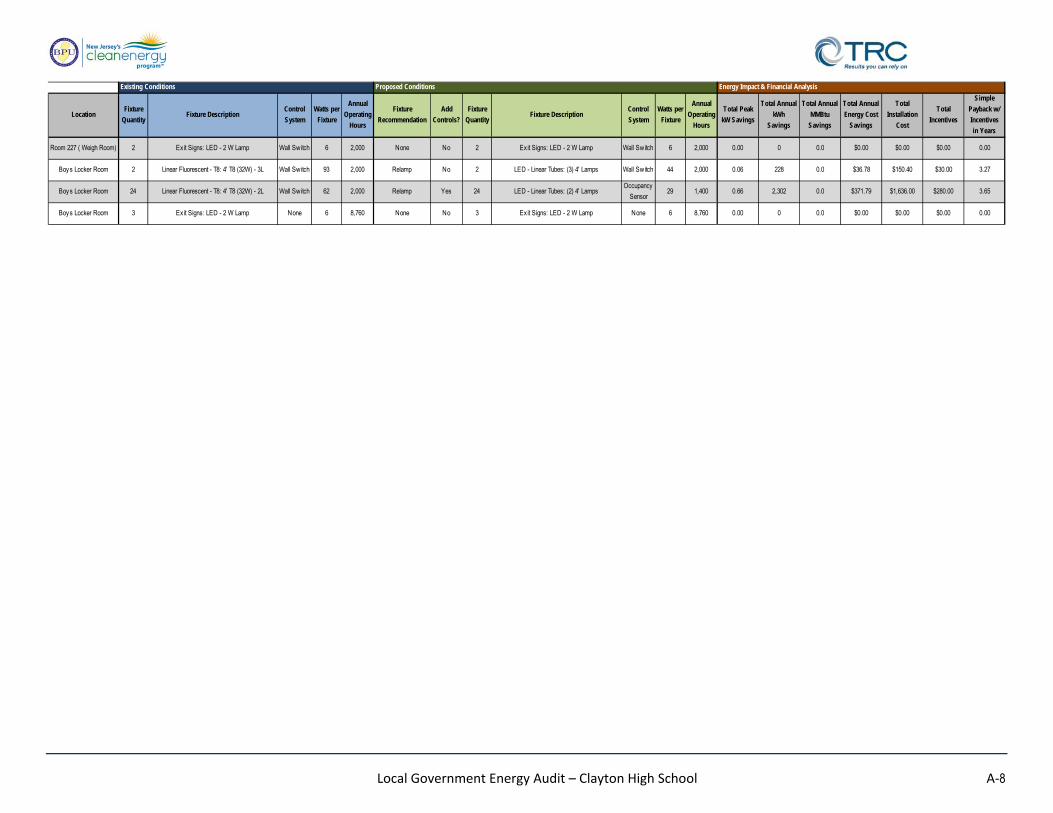
Local Government Energy Audit – Clayton High School A‐8
LocationFixture
QuantityFixture Description
Control
System
Watts per
Fixture
Annual
Operating
Hours
Fixture
Recommendation
Add
Controls?
Fixture
QuantityFixture Description
Control
System
Watts per
Fixture
Annual
Operating
Hours
Total Peak
kW Savings
Total Annual
kWh
Savings
Total Annual
MMBtu
Savings
Total Annual
Energy Cost
Savings
Total
Installation
Cost
Total
Incentives
Simple
Payback w/
Incentives
in Years
Room 227 ( Weigh Room) 2 Exit Signs: LED - 2 W Lamp Wall Switch 6 2,000 None No 2 Exit Signs: LED - 2 W Lamp Wall Switch 6 2,000 0.00 0 0.0 $0.00 $0.00 $0.00 0.00
Boys Locker Room 2 Linear Fluorescent - T8: 4' T8 (32W) - 3L Wall Switch 93 2,000 Relamp No 2 LED - Linear Tubes: (3) 4' Lamps Wall Switch 44 2,000 0.06 228 0.0 $36.78 $150.40 $30.00 3.27
Boys Locker Room 24 Linear Fluorescent - T8: 4' T8 (32W) - 2L Wall Switch 62 2,000 Relamp Yes 24 LED - Linear Tubes: (2) 4' LampsOccupancy
Sensor29 1,400 0.66 2,302 0.0 $371.79 $1,636.00 $280.00 3.65
Boys Locker Room 3 Exit Signs: LED - 2 W Lamp None 6 8,760 None No 3 Exit Signs: LED - 2 W Lamp None 6 8,760 0.00 0 0.0 $0.00 $0.00 $0.00 0.00
Existing Conditions Proposed Conditions Energy Impact & Financial Analysis
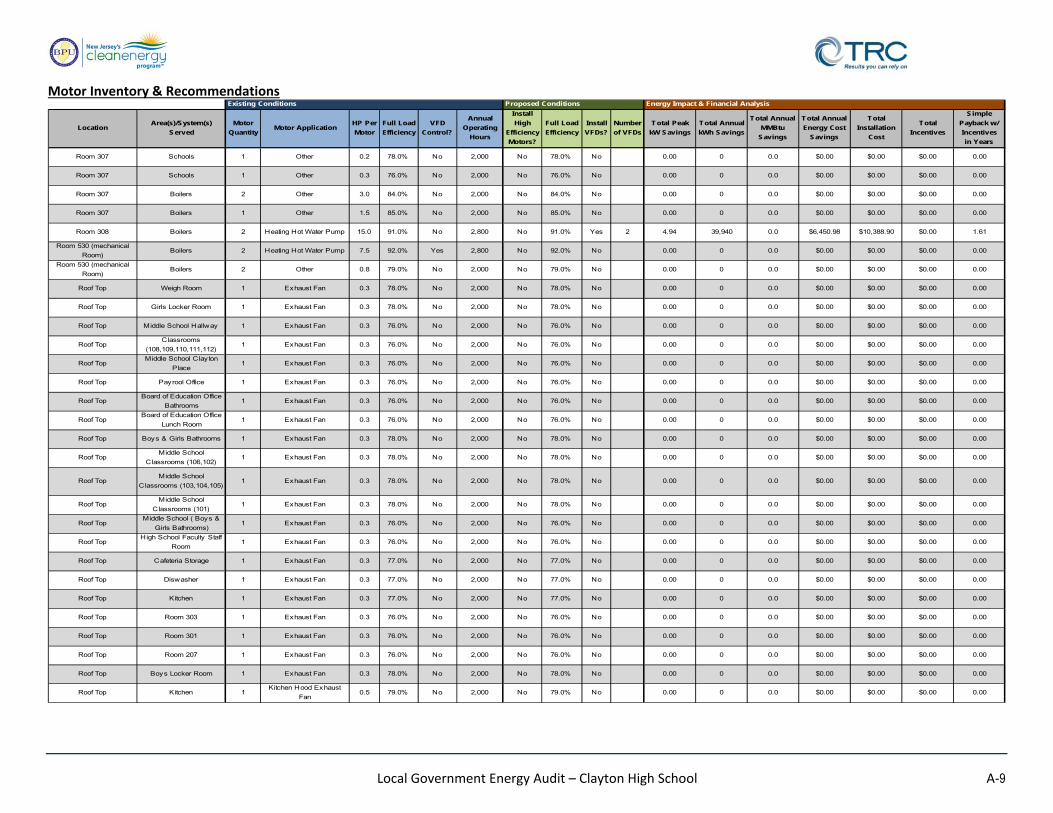
Local Government Energy Audit – Clayton High School A‐9
Motor Inventory & Recommendations
LocationArea(s)/System(s)
Served
Motor
QuantityMotor Application
HP Per
Motor
Full Load
Efficiency
VFD
Control?
Annual
Operating
Hours
Install
High
Efficiency
Motors?
Full Load
Efficiency
Install
VFDs?
Number
of VFDs
Total Peak
kW Savings
Total Annual
kWh Savings
Total Annual
MMBtu
Savings
Total Annual
Energy Cost
Savings
Total
Installation
Cost
Total
Incentives
Simple
Payback w/
Incentives
in Years
Room 307 Schools 1 Other 0.2 78.0% No 2,000 No 78.0% No 0.00 0 0.0 $0.00 $0.00 $0.00 0.00
Room 307 Schools 1 Other 0.3 76.0% No 2,000 No 76.0% No 0.00 0 0.0 $0.00 $0.00 $0.00 0.00
Room 307 Boilers 2 Other 3.0 84.0% No 2,000 No 84.0% No 0.00 0 0.0 $0.00 $0.00 $0.00 0.00
Room 307 Boilers 1 Other 1.5 85.0% No 2,000 No 85.0% No 0.00 0 0.0 $0.00 $0.00 $0.00 0.00
Room 308 Boilers 2 Heating Hot Water Pump 15.0 91.0% No 2,800 No 91.0% Yes 2 4.94 39,940 0.0 $6,450.98 $10,388.90 $0.00 1.61
Room 530 (mechanical
Room)Boilers 2 Heating Hot Water Pump 7.5 92.0% Yes 2,800 No 92.0% No 0.00 0 0.0 $0.00 $0.00 $0.00 0.00
Room 530 (mechanical
Room)Boilers 2 Other 0.8 79.0% No 2,000 No 79.0% No 0.00 0 0.0 $0.00 $0.00 $0.00 0.00
Roof Top Weigh Room 1 Exhaust Fan 0.3 78.0% No 2,000 No 78.0% No 0.00 0 0.0 $0.00 $0.00 $0.00 0.00
Roof Top Girls Locker Room 1 Exhaust Fan 0.3 78.0% No 2,000 No 78.0% No 0.00 0 0.0 $0.00 $0.00 $0.00 0.00
Roof Top Middle School Hallway 1 Exhaust Fan 0.3 76.0% No 2,000 No 76.0% No 0.00 0 0.0 $0.00 $0.00 $0.00 0.00
Roof TopClassrooms
(108,109,110,111,112)1 Exhaust Fan 0.3 76.0% No 2,000 No 76.0% No 0.00 0 0.0 $0.00 $0.00 $0.00 0.00
Roof TopMiddle School Clayton
Place1 Exhaust Fan 0.3 76.0% No 2,000 No 76.0% No 0.00 0 0.0 $0.00 $0.00 $0.00 0.00
Roof Top Payrool Office 1 Exhaust Fan 0.3 76.0% No 2,000 No 76.0% No 0.00 0 0.0 $0.00 $0.00 $0.00 0.00
Roof TopBoard of Education Office
Bathrooms1 Exhaust Fan 0.3 76.0% No 2,000 No 76.0% No 0.00 0 0.0 $0.00 $0.00 $0.00 0.00
Roof TopBoard of Education Office
Lunch Room1 Exhaust Fan 0.3 76.0% No 2,000 No 76.0% No 0.00 0 0.0 $0.00 $0.00 $0.00 0.00
Roof Top Boys & Girls Bathrooms 1 Exhaust Fan 0.3 78.0% No 2,000 No 78.0% No 0.00 0 0.0 $0.00 $0.00 $0.00 0.00
Roof TopMiddle School
Classrooms (106,102)1 Exhaust Fan 0.3 78.0% No 2,000 No 78.0% No 0.00 0 0.0 $0.00 $0.00 $0.00 0.00
Roof TopMiddle School
Classrooms (103,104,105)1 Exhaust Fan 0.3 78.0% No 2,000 No 78.0% No 0.00 0 0.0 $0.00 $0.00 $0.00 0.00
Roof TopMiddle School
Classrooms (101)1 Exhaust Fan 0.3 78.0% No 2,000 No 78.0% No 0.00 0 0.0 $0.00 $0.00 $0.00 0.00
Roof TopMiddle School ( Boys &
Girls Bathrooms)1 Exhaust Fan 0.3 76.0% No 2,000 No 76.0% No 0.00 0 0.0 $0.00 $0.00 $0.00 0.00
Roof TopHigh School Faculty Staff
Room1 Exhaust Fan 0.3 76.0% No 2,000 No 76.0% No 0.00 0 0.0 $0.00 $0.00 $0.00 0.00
Roof Top Cafeteria Storage 1 Exhaust Fan 0.3 77.0% No 2,000 No 77.0% No 0.00 0 0.0 $0.00 $0.00 $0.00 0.00
Roof Top Diswasher 1 Exhaust Fan 0.3 77.0% No 2,000 No 77.0% No 0.00 0 0.0 $0.00 $0.00 $0.00 0.00
Roof Top Kitchen 1 Exhaust Fan 0.3 77.0% No 2,000 No 77.0% No 0.00 0 0.0 $0.00 $0.00 $0.00 0.00
Roof Top Room 303 1 Exhaust Fan 0.3 76.0% No 2,000 No 76.0% No 0.00 0 0.0 $0.00 $0.00 $0.00 0.00
Roof Top Room 301 1 Exhaust Fan 0.3 76.0% No 2,000 No 76.0% No 0.00 0 0.0 $0.00 $0.00 $0.00 0.00
Roof Top Room 207 1 Exhaust Fan 0.3 76.0% No 2,000 No 76.0% No 0.00 0 0.0 $0.00 $0.00 $0.00 0.00
Roof Top Boys Locker Room 1 Exhaust Fan 0.3 78.0% No 2,000 No 78.0% No 0.00 0 0.0 $0.00 $0.00 $0.00 0.00
Roof Top Kitchen 1Kitchen Hood Exhaust
Fan0.5 79.0% No 2,000 No 79.0% No 0.00 0 0.0 $0.00 $0.00 $0.00 0.00
Existing Conditions Proposed Conditions Energy Impact & Financial Analysis

Local Government Energy Audit – Clayton High School A‐10
Electric HVAC Inventory & Recommendations
LocationArea(s)/System(s)
Served
System
QuantitySystem Type
Cooling
Capacity
per Unit
(Tons)
Heating
Capacity
per Unit
(kBtu/hr)
Install
High
Efficiency
System?
System
QuantitySystem Type
Cooling
Capacity
per Unit
(Tons)
Heating
Capacity
per Unit
(kBtu/hr)
Cooling
Mode
Efficiency
(SEER/EER)
Heating
Mode
Efficiency
(COP)
Install Dual
Enthalpy
Economizer?
Total Peak
kW Savings
Total Annual
kWh Savings
Total Annual
MMBtu
Savings
Total Annual
Energy Cost
Savings
Total
Installation
Cost
Total
Incentives
Simple
Payback w/
Incentives
in Years
Roof Top Rooms( 208,206,204,202) 2 Split-System AC 10.00 No No 0.00 0 0.0 $0.00 $0.00 $0.00 0.00
Roof Top Main gymnasium 2 Packaged AC 25.00 No No 0.00 0 0.0 $0.00 $0.00 $0.00 0.00
Roof Top Auxilary gymnasium 2 Packaged AC 10.00 No No 0.00 0 0.0 $0.00 $0.00 $0.00 0.00
Roof TopAuxilary gymnasium
locker room1 Packaged AC 10.00 No No 0.00 0 0.0 $0.00 $0.00 $0.00 0.00
Roof TopAuxilary gymnasium
lobby1 Packaged AC 20.00 No No 0.00 0 0.0 $0.00 $0.00 $0.00 0.00
Roof Top Weight room 1 Packaged AC 5.00 No No 0.00 0 0.0 $0.00 $0.00 $0.00 0.00
Roof Top Payrool & Billing office 1 Packaged AC 3.00 No No 0.00 0 0.0 $0.00 $0.00 $0.00 0.00
Roof TopBoard of education office
lobby1 Packaged AC 3.00 No No 0.00 0 0.0 $0.00 $0.00 $0.00 0.00
Roof Top Room 103 1Split-System Air-Source
HP2.00 24.00 No No 0.00 0 0.0 $0.00 $0.00 $0.00 0.00
Roof Top School 1 Split-System AC 2.00 No No 0.00 0 0.0 $0.00 $0.00 $0.00 0.00
Roof Top Room 101 1 Packaged AC 3.00 No No 0.00 0 0.0 $0.00 $0.00 $0.00 0.00
Roof Top Room 316 1 Packaged AC 3.00 No No 0.00 0 0.0 $0.00 $0.00 $0.00 0.00
Roof Top Room 301 2 Split-System AC 2.00 No No 0.00 0 0.0 $0.00 $0.00 $0.00 0.00
Roof Top Kitchen 1 Packaged AC 5.00 No No 0.00 0 0.0 $0.00 $0.00 $0.00 0.00
Roof Top Kitchen 1 Split-System AC 3.00 No No 0.00 0 0.0 $0.00 $0.00 $0.00 0.00
Roof Top Room 306 1 Split-System AC 2.50 No No 0.00 0 0.0 $0.00 $0.00 $0.00 0.00
Roof Top Room 301 1 Packaged AC 3.00 No No 0.00 0 0.0 $0.00 $0.00 $0.00 0.00
Roof Top Room 207 1 Packaged AC 3.00 No No 0.00 0 0.0 $0.00 $0.00 $0.00 0.00
Roof Top High school 500 wing 2 Packaged AC 3.00 No No 0.00 0 0.0 $0.00 $0.00 $0.00 0.00
Main Server Room Main Server Room 1 Split-System AC 1.50 No No 0.00 0 0.0 $0.00 $0.00 $0.00 0.00
Roof Top Cafeteria 1 Packaged AC 25.00 No No 0.00 0 0.0 $0.00 $0.00 $0.00 0.00
Roof Top Offices 1 Packaged AC 20.00 No No 0.00 0 0.0 $0.00 $0.00 $0.00 0.00
Roof Top Kitchen 1 Packaged AC 7.50 No No 0.00 0 0.0 $0.00 $0.00 $0.00 0.00
Existing Conditions Proposed Conditions Energy Impact & Financial Analysis

Local Government Energy Audit – Clayton High School A‐11
Fuel Heating Inventory & Recommendations
DHW Inventory & Recommendations
Low‐Flow Device Recommendations
LocationArea(s)/System(s)
Served
System
QuantitySystem Type
Output
Capacity
per Unit
(MBh)
Install
High
Efficiency
System?
System
QuantitySystem Type
Output
Capacity
per Unit
(MBh)
Heating
Efficiency
Heating
Efficiency
Units
Total Peak
kW Savings
Total Annual
kWh Savings
Total Annual
MMBtu
Savings
Total Annual
Energy Cost
Savings
Total
Installation
Cost
Total
Incentives
Simple
Payback w/
Incentives
in Years
Room 307 Schools 2Non-Condensing Hot
Water Boiler4,090.00 No 0.00 0 0.0 $0.00 $0.00 $0.00 0.00
Room 530 (Mechanical
Room)Schools 2
Condensing Hot Water
Boiler975.00 No 0.00 0 0.0 $0.00 $0.00 $0.00 0.00
Existing Conditions Proposed Conditions Energy Impact & Financial Analysis
LocationArea(s)/System(s)
Served
System
QuantitySystem Type Replace?
System
QuantitySystem Type Fuel Type
System
Efficiency
Efficiency
Units
Total Peak
kW Savings
Total Annual
kWh Savings
Total Annual
MMBtu
Savings
Total Annual
Energy Cost
Savings
Total
Installation
Cost
Total
Incentives
Simple
Payback w/
Incentives
in Years
Board of education break
roomBreak room 1
Storage Tank Water
Heater (≤ 50 Gal)No 0.00 0 0.0 $0.00 $0.00 $0.00 0.00
board of education
bathroomBathroom 1
Storage Tank Water
Heater (≤ 50 Gal)No 0.00 0 0.0 $0.00 $0.00 $0.00 0.00
Room 307 Schools 3Storage Tank Water
Heater (> 50 Gal)No 0.00 0 0.0 $0.00 $0.00 $0.00 0.00
Room 530 (Mechanical
room)Part of High school 1
Storage Tank Water
Heater (≤ 50 Gal)No 0.00 0 0.0 $0.00 $0.00 $0.00 0.00
Proposed Conditions Energy Impact & Financial AnalysisExisting Conditions
LocationDevice
QuantityDevice Type
Existing
Flow
Rate
(gpm)
Proposed
Flow
Rate
(gpm)
Total Peak
kW Savings
Total Annual
kWh Savings
Total Annual
MMBtu
Savings
Total Annual
Energy Cost
Savings
Total
Installation
Cost
Total
Incentives
Simple
Payback w/
Incentives
in Years
Schools Bathrooms 22 Faucet Aerator (Lavatory) 2.50 1.00 0.00 0 80.4 $417.68 $157.74 $0.00 0.38
Kitchen 6 Faucet Aerator (Kitchen) 3.00 2.20 0.00 0 11.7 $60.75 $43.02 $0.00 0.71
Recommedation Inputs Energy Impact & Financial Analysis

Local Government Energy Audit – Clayton High School A‐12
Reach‐In Cooler/Freezer Inventory & Recommendations
Walk‐In Cooler/Freezer Inventory & Recommendations
Commercial Refrigerator/Freezer Inventory & Recommendations
Location
Cooler/
Freezer
Quantity
Case
Type/Temperature
Install EC
Evaporator
Fan Motors?
Install
Electric
Defrost
Control?
Install
Energy
Efficient
Doors?
Install Door
Heater
Control?
Install
Aluminum
Night
Covers?
Total Peak
kW Savings
Total Annual
kWh Savings
Total Annual
MMBtu
Savings
Total Annual
Energy Cost
Savings
Total
Installation
Cost
Total
Incentives
Simple
Payback w/
Incentives
in Years
Kitchen 2 Cooler (35F to 55F) No No No No No 0.00 0 0.0 $0.00 $0.00 $0.00 0.00
Kitchen 1 Cooler (35F to 55F) No No No No No 0.00 0 0.0 $0.00 $0.00 $0.00 0.00
Existing Conditions Proposed Conditions Energy Impact & Financial Analysis
Location
Cooler/
Freezer
Quantity
Case
Type/Temperature
Install EC
Evaporator
Fan Motors?
Install Electric
Defrost
Control?
Install
Evaporator
Fan Control?
Total Peak
kW Savings
Total Annual
kWh Savings
Total Annual
MMBtu
Savings
Total Annual
Energy Cost
Savings
Total
Installation
Cost
Total
Incentives
Simple
Payback w/
Incentives
in Years
Kitchen 1 Cooler (35F to 55F) No No No 0.00 0 0.0 $0.00 $0.00 $0.00 0.00
Kitchen 1Medium Temp Freezer
(0F to 30F)No No No 0.00 0 0.0 $0.00 $0.00 $0.00 0.00
Energy Impact & Financial AnalysisExisting Conditions Proposed Conditions
Location QuantityRefrigerator/ Freezer
Type
ENERGY
STAR
Qualified?
Total Peak
kW Savings
Total Annual
kWh Savings
Total Annual
MMBtu
Savings
Total Annual
Energy Cost
Savings
Total
Installation
Cost
Total
Incentives
Simple
Payback w/
Incentives
in Years
Kitchen 3 Refrigerator Chest Yes 0.00 0 0.0 $0.00 $0.00 $0.00 0.00
Kitchen 2 Refrigerator Chest Yes 0.00 0 0.0 $0.00 $0.00 $0.00 0.00
Schools 12Stand-Up Refrigerator,
Solid Door (16 - 30 cu. ft.)Yes 0.00 0 0.0 $0.00 $0.00 $0.00 0.00
Existing Conditions Proposed ConditEnergy Impact & Financial Analysis
Install ENERGY
STAR
Equipment?
No
No
No

Local Government Energy Audit – Clayton High School A‐13
Commercial Ice Maker Inventory & Recommendations
Novelty Cooler Inventory & Recommendations
Location Quantity Ice Maker Type
ENERGY
STAR
Qualified?
Total Peak
kW Savings
Total Annual
kWh Savings
Total Annual
MMBtu
Savings
Total Annual
Energy Cost
Savings
Total
Installation
Cost
Total
Incentives
Simple
Payback w/
Incentives
in Years
Kitchen 1Ice Making Head (≥450
lbs/day), BatchYes 0.00 0 0.0 $0.00 $0.00 $0.00 0.00
Install ENERGY
STAR
Equipment?
Existing Conditions Proposed Condit
No
Energy Impact & Financial Analysis
Energy Impact & Financial Analysis
Location Quantity Cooler DescriptionTotal Peak
kW Savings
Total Annual
kWh Savings
Total Annual
MMBtu
Savings
Total Annual
Energy Cost
Savings
Total
Installation
Cost
Total
Incentives
Simple
Payback w/
Incentives
in Years
Schools 12 Small refrigerator 0.00 0 0.0 $0.00 $0.00 $0.00 0.00
Existing Conditions Proposed Conditions
Install Automatic Shutoff
Control?
No
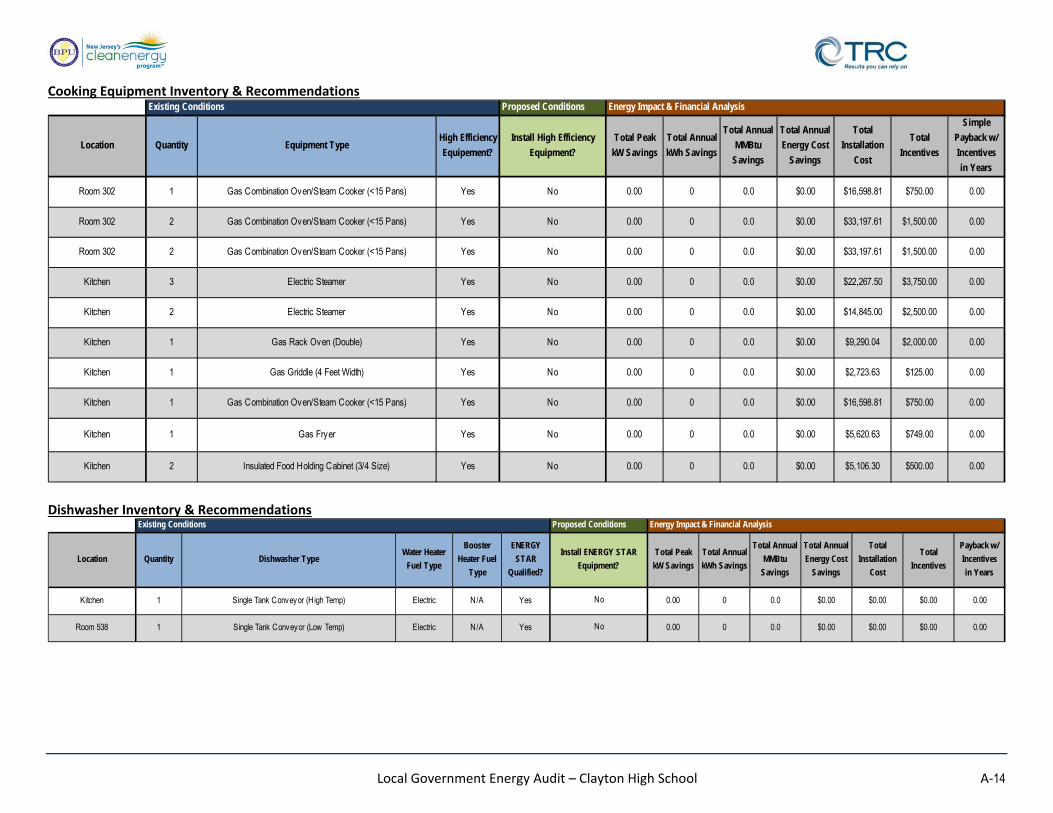
Local Government Energy Audit – Clayton High School A‐14
Cooking Equipment Inventory & Recommendations
Dishwasher Inventory & Recommendations
Existing Conditions Proposed Conditions
Location Quantity Equipment TypeHigh Efficiency
Equipement?
Install High Efficiency
Equipment?
Total Peak
kW Savings
Total Annual
kWh Savings
Total Annual
MMBtu
Savings
Total Annual
Energy Cost
Savings
Total
Installation
Cost
Total
Incentives
Simple
Payback w/
Incentives
in Years
Room 302 1 Gas Combination Oven/Steam Cooker (<15 Pans) Yes No 0.00 0 0.0 $0.00 $16,598.81 $750.00 0.00
Room 302 2 Gas Combination Oven/Steam Cooker (<15 Pans) Yes No 0.00 0 0.0 $0.00 $33,197.61 $1,500.00 0.00
Room 302 2 Gas Combination Oven/Steam Cooker (<15 Pans) Yes No 0.00 0 0.0 $0.00 $33,197.61 $1,500.00 0.00
Kitchen 3 Electric Steamer Yes No 0.00 0 0.0 $0.00 $22,267.50 $3,750.00 0.00
Kitchen 2 Electric Steamer Yes No 0.00 0 0.0 $0.00 $14,845.00 $2,500.00 0.00
Kitchen 1 Gas Rack Oven (Double) Yes No 0.00 0 0.0 $0.00 $9,290.04 $2,000.00 0.00
Kitchen 1 Gas Griddle (4 Feet Width) Yes No 0.00 0 0.0 $0.00 $2,723.63 $125.00 0.00
Kitchen 1 Gas Combination Oven/Steam Cooker (<15 Pans) Yes No 0.00 0 0.0 $0.00 $16,598.81 $750.00 0.00
Kitchen 1 Gas Fryer Yes No 0.00 0 0.0 $0.00 $5,620.63 $749.00 0.00
Kitchen 2 Insulated Food Holding Cabinet (3/4 Size) Yes No 0.00 0 0.0 $0.00 $5,106.30 $500.00 0.00
Energy Impact & Financial Analysis
Energy Impact & Financial Analysis
Location Quantity Dishwasher TypeWater Heater
Fuel Type
Booster
Heater Fuel
Type
ENERGY
STAR
Qualified?
Total Peak
kW Savings
Total Annual
kWh Savings
Total Annual
MMBtu
Savings
Total Annual
Energy Cost
Savings
Total
Installation
Cost
Total
Incentives
Payback w/
Incentives
in Years
Kitchen 1 Single Tank Conveyor (High Temp) Electric N/A Yes 0.00 0 0.0 $0.00 $0.00 $0.00 0.00
Room 538 1 Single Tank Conveyor (Low Temp) Electric N/A Yes 0.00 0 0.0 $0.00 $0.00 $0.00 0.00
No
Existing Conditions Proposed Conditions
Install ENERGY STAR
Equipment?
No
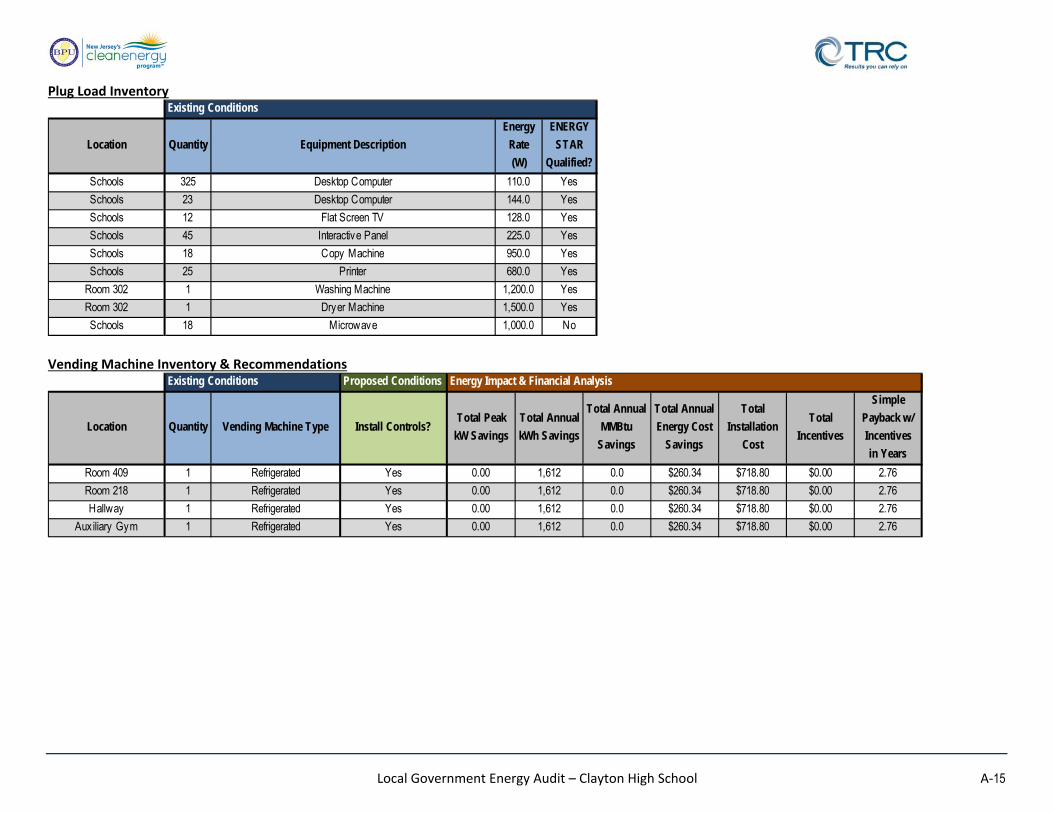
Local Government Energy Audit – Clayton High School A‐15
Plug Load Inventory
Vending Machine Inventory & Recommendations
Location Quantity Equipment Description
Energy
Rate
(W)
ENERGY
STAR
Qualified?
Schools 325 Desktop Computer 110.0 Yes
Schools 23 Desktop Computer 144.0 Yes
Schools 12 Flat Screen TV 128.0 Yes
Schools 45 Interactive Panel 225.0 Yes
Schools 18 Copy Machine 950.0 Yes
Schools 25 Printer 680.0 Yes
Room 302 1 Washing Machine 1,200.0 Yes
Room 302 1 Dryer Machine 1,500.0 Yes
Schools 18 Microwave 1,000.0 No
Existing Conditions
Proposed Conditions
Location Quantity Vending Machine Type Install Controls?Total Peak
kW Savings
Total Annual
kWh Savings
Total Annual
MMBtu
Savings
Total Annual
Energy Cost
Savings
Total
Installation
Cost
Total
Incentives
Simple
Payback w/
Incentives
in Years
Room 409 1 Refrigerated Yes 0.00 1,612 0.0 $260.34 $718.80 $0.00 2.76
Room 218 1 Refrigerated Yes 0.00 1,612 0.0 $260.34 $718.80 $0.00 2.76
Hallway 1 Refrigerated Yes 0.00 1,612 0.0 $260.34 $718.80 $0.00 2.76
Auxiliary Gym 1 Refrigerated Yes 0.00 1,612 0.0 $260.34 $718.80 $0.00 2.76
Existing Conditions Energy Impact & Financial Analysis

Local Government Energy Audit – Clayton High School B‐1
Appendix B: ENERGY STAR® Statement of Energy Performance