level ii scour analysis for bridge 31 (albath00380031… · level ii scour analysis for bridge 31...
TRANSCRIPT

-4
LEVEL II SCOUR ANALYSIS FORBRIDGE 31 (ALBATH00380031) onTOWN HIGHWAY 38, crossing theBLACK RIVER,ALBANY, VERMONT
U.S. Geological SurveyOpen-File Report 96-196
Prepared in cooperation with
VERMONT AGENCY OF TRANSPORTATION
and
FEDERAL HIGHWAY ADMINISTRATION
-3
LEVEL II SCOUR ANALYSIS FORBRIDGE 31 (ALBATH00380031) onTOWN HIGHWAY 38, crossing theBLACK RIVER,
ALBANY, VERMONT
By Erick M. Boehmler
U.S. Geological SurveyOpen-File Report 96-196
Prepared in cooperation with
VERMONT AGENCY OF TRANSPORTATION
and
FEDERAL HIGHWAY ADMINISTRATION
Pembroke, New Hampshire
1996

U.S. DEPARTMENT OF THE INTERIOR
BRUCE BABBITT, Secretary
U.S. GEOLOGICAL SURVEYGordon P. Eaton, Director
For additional information Copies of this report may bewrite to: purchased from:
District Chief U.S. Geological SurveyU.S. Geological Survey Earth Science Information Center361 Commerce Way Open-File Reports SectionPembroke, NH 03275-3718 Box 25286, MS 517
Federal CenterDenver, CO 80225
-1
CONTENTSIntroduction........................................................................................................................................................ 1
Level II summary ............................................................................................................................................... 7Description of Bridge ................................................................................................................................... 7Description of the Geomorphic Setting........................................................................................................ 8Description of the Channel........................................................................................................................... 8Hydrology..................................................................................................................................................... 9 Calculated Discharges .......................................................................................................................... 9Description of the Water-Surface Profile Model (WSPRO) Analysis ......................................................... 10 Cross-Sections Used in WSPRO Analysis............................................................................................ 10 Data and Assumptions Used in WSPRO Model ................................................................................... 11Bridge Hydraulics Summary........................................................................................................................ 12Scour Analysis Summary ............................................................................................................................. 13 Special Conditions or Assumptions Made in Scour Analysis............................................................... 13 Scour Results......................................................................................................................................... 14Rock Riprap Sizing ...................................................................................................................................... 14
References .......................................................................................................................................................... 18
Appendixes:
A. WSPRO input file.................................................................................................................................... 19
B. WSPRO output file .................................................................................................................................. 21
C. Bed-material particle-size distribution .................................................................................................... 28
D. Historical data form................................................................................................................................. 30
E. Level I data form...................................................................................................................................... 36
F. Scour computations.................................................................................................................................. 46
FIGURES
1. Map showing location of study area on USGS 1:24,000 scale map ............................................................. 3 2. Map showing location of study area on Vermont Agency of Transportation town
highway map ................................................................................................................................... 4 3. Structure ALBATH00380031 viewed from upstream (October 5, 1994) .................................................... 5 4. Downstream channel viewed from structure ALBATH00380031 (October 5, 1994).................................. 5 5. Upstream channel viewed from structure ALBATH00380031 (October 5, 1994)....................................... 6 6. Structure ALBATH00380031 viewed from downstream (October 5, 1994). ............................................. 6 7. Water-surface profiles for the 100- and 500-year discharges at structure
ALBATH00380031 on Town Highway 38, crossing the Black River, Albany, Vermont. ............................................................................................................................ 15
8. Scour elevations for the 100- and 500-year discharges at structure ALBATH00380031 on Town Highway 38, crossing the Black River, Albany, Vermont. ............................................................................................................................ 16
TABLES
1. Remaining footing/pile depth at abutments for the 100-year discharge at structureALBATH00380031 on Town Highway 38, crossing the Black River,Albany, Vermont................................................................................................................................. 17
2. Remaining footing/pile depth at abutments for the 500-year discharge at structure ALBATH00380031 on Town Highway 38, crossing the Black River, Albany, Vermont................................................................................................................................ 17
iii

0iv
CONVERSION FACTORS, ABBREVIATIONS, AND VERTICAL DATUM
Multiply By To obtain
Length
inch (in.) 25.4 millimeter (mm) foot (ft) 0.3048 meter (m) mile (mi) 1.609 kilometer (km)
Slope
foot per mile (ft/mi) 0.1894 meter per kilometer (m/km)Area
square mile (mi2) 2.590 square kilometer (km2) Volume
cubic foot (ft3) 0.02832 cubic meter (m3)Velocity and Flow
foot per second (ft/s) 0.3048 meter per second (m/s)cubic foot per second (ft3/s) 0.02832 cubic meter per second (m3/s)cubic foot per second per 0.01093 cubic meter per square mile second per square [(ft3/s)/mi2] kilometer [(m3/s)/km2]
OTHER ABBREVIATIONS
BF bank full LWW left wingwallcfs cubic feet per second MC main channelD50 median diameter of bed material RAB right abutmentDS downstream RABUT face of right abutmentelev. elevation RB right bankf/p flood plain ROB right overbankft2 square feet RWW right wingwallft/ft feet per foot TH town highwayJCT junction UB under bridgeLAB left abutment US upstreamLABUT face of left abutment USGS United States Geological SurveyLB left bank VTAOT Vermont Agency of TransportationLOB left overbank WSPRO water-surface profile model
In this report, the words “right” and “left” refer to directions that would be reported by an observer facing downstream.
Sea level: In this report, “sea level” refers to the National Geodetic Vertical Datum of 1929-- a geodetic datum derived from a general adjustment of the first-order level nets of the United States and Canada, formerly called Sea Level Datum of 1929.
In the appendices, the above abbreviations may be combined. For example, USLB would represent upstream left bank.
LEVEL II SCOUR ANALYSIS FOR BRIDGE 31 (ALBATH00380031) ON TOWN HIGHWAY 38,
CROSSING THE BLACK RIVER, ALBANY, VERMONT
By Erick M. Boehmler
INTRODUCTION
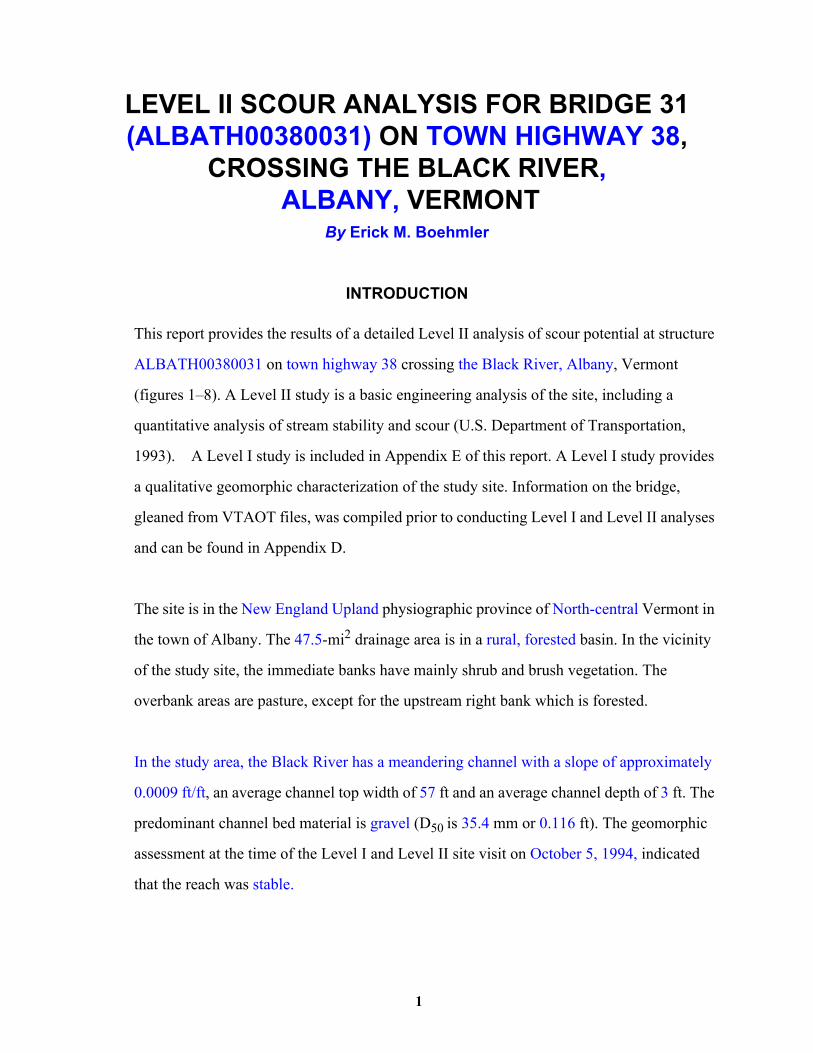
This report provides the results of a detailed Level II analysis of scour potential at structure
ALBATH00380031 on town highway 38 crossing the Black River, Albany, Vermont
(figures 1–8). A Level II study is a basic engineering analysis of the site, including a
quantitative analysis of stream stability and scour (U.S. Department of Transportation,
1993). A Level I study is included in Appendix E of this report. A Level I study provides
a qualitative geomorphic characterization of the study site. Information on the bridge,
gleaned from VTAOT files, was compiled prior to conducting Level I and Level II analyses
and can be found in Appendix D.
The site is in the New England Upland physiographic province of North-central Vermont in
the town of Albany. The 47.5-mi2 drainage area is in a rural, forested basin. In the vicinity
of the study site, the immediate banks have mainly shrub and brush vegetation. The
overbank areas are pasture, except for the upstream right bank which is forested.
In the study area, the Black River has a meandering channel with a slope of approximately
0.0009 ft/ft, an average channel top width of 57 ft and an average channel depth of 3 ft. The
predominant channel bed material is gravel (D50 is 35.4 mm or 0.116 ft). The geomorphic
assessment at the time of the Level I and Level II site visit on October 5, 1994, indicated
that the reach was stable.
1

The town highway 38 crossing of the Black River is a 50-ft-long, one-lane bridge consisting
of one 47-foot span concrete T-beam type superstructure (Vermont Agency of
Transportation, written commun., August 3, 1994). The bridge is supported by vertical
abutments with wingwalls. The left abutment is constructed of concrete while the right is
mortared, granite stone blocks. The channel is skewed approximately 30 degrees to the
opening while the opening-skew-to-roadway is 10 degrees.
A scour hole, 1.5 ft deeper than the mean thalweg depth, was observed during the level I
assessment along the left side of the channel under the bridge. The only scour protection
measure at the site was type-3 stone fill (less than 48 inches diameter) along the left bank
under the bridge. Additional details describing conditions at the site are included in the
Level II Summary and Appendices D
and E.
Scour depths and rock rip-rap sizes were computed using the general guidelines described
in Hydraulic Engineering Circular 18 (Richardson and others, 1993). Scour depths were
calculated assuming an infinite depth of erosive material and a homogeneous particle-size
distribution. The scour analysis results are presented in tables 1 and 2 and a graph of the
scour depths is presented in figure 8.
2
3
Figure 1. Location of study area on USGS 1:24,000 scale map.
Plymouth, VT. Quadrangle, 1:24,000, 1966
Photoinspected 1983
NORTH

4
Figure 2. Location of study area on Vermont Agency of Transportation town highway map.

Figure 3. Structure ALBATH00380031 viewed from upstream (October 5, 1994).
Figure 4. Downstream channel viewed from structure ALBATH00380031 (October 5, 1994).
5

Figure 5. Upstream channel viewed from structure ALBATH00380031 (October 5, 1994).
Figure 6. Structure ALBATH00380031 viewed from downstream (October 5, 1994).
6

LEVEL II SUMMARY
Structure Number Stream
County
Bridge length
Alignment of bri
Abutment type
Stone fill on abut
Is bridge skewed
Debris accumul
Level I
Potential fo
ALBATH00380031
7
Road
Description of Bridge
ft Bridge width
ght)
Embankme
ment?
to flood flow according t rvey?
ation on bridge at time of Level I or Level
D Percent blocked
r debris
Black River
District
Orleans TH 38nt type
Angle
II site visit:
Percent blocked
09
50
14.3 47 ft Max span length ftLeft, Straight; Right, Curve
dge to road (on curve or straiVertical
Sloping
No
10/05/94
Date of inspectionType-3, along the left bank under the bridge also protects the left
Description of stone fillabutment.Left abutment is concrete with no wingwalls, the right
Brief description of piers/abutments abutment and its wingwalls are mortared, granite stone blocks.
Y
30o Level I suY
Is bridge located on a bend in channel? If so, describe (mild, moderate, severe) There is a mild channel bend in the upstream reach.
ate of inspection 10/05/94
of channel horizontally 0
of channel vertically
0
10/05/94
-- --Moderate. While there is significant tree coverage on the right bank
Level IIupstream, the banks upstream are more stable than downstream.
The large pile of stone fill on the left abutment significantly constricts the channel and may be
Describe any features near or at the bridge that may affect flow (include observation date).inducing the channel scour evident under the bridge noted on 10/05/94.

Description of the Geomorphic Setting
General topography
Geomorphic conditio
Date of insp
DS left:
DS right:
US left:
US right:
Average top width
Predominant bed ma
Vegetative c
DS left:
DS right:
US left:
US right:
The channel is located within a 600 foot-wide, flat to slightly irregular
flood plain with moderately sloping valley walls on both sides.
wnstream (DS), upstream (US)
ns at bridge site: do10/05/94
ectionModerately sloping channel bank to a gently sloping, irregular flood plain.
Gently sloping bank to gently sloping, irregular flood plain.
Gently sloping bank to gently sloping, irregular flood plain.
Gently sloping bank to narrow, gently sloping flood plain.
Description of the Channel
teri
57
Average depthal Bank material
8
2.5
ftGravel
ftSilt and Clay
meandering but stable
Stream type (straight, meandering, braided, swampy, channelized) with semi-alluvial to alluvial channel boundaries and a wide flood plain.
10/05/94
over on channel banks near bridge: Date of inspection Shrubs and brush
Shrubs and brush
Grass
Forest with shrubs and brush undergrowth.
Y
? If not, describe location and type of instability and -
Do banks appear stabledate of observation.
The assessment of 10/
Describe any obstructions in channel and date of observation. 05/94 noted flow through the bridge is significantly influenced by the pile of stone fill on the left
abutment.

Hydrology
Drainage area i2
Percentage of dra
Is drainage a
Is there a USGS
Is there a lake/
Q
m47.5
inage area in physiographic provinces: (approximate)
Percent o rea
Physiographic province New England Uplandgage on the stream of interest
USGS gage description
USGS gage number
Gage drainage area mi2
Calculated Discharges
100 ft3/s
9
f drainage a100
Rural
rea considered rural or urban? Describe any significantNone.
urbanization:
Yes
?Black River at Coventry, VT
04296000
122No
pond that will significantly affect hydrology/hydraulics?-
If so, describe
2600
3530Q500 ft3/sThe 100- and 500-year discharges are based on a
Method used to determine discharges drainage area relationship [(47.5/122.)exp 0.5] with the gaged area above Coventry, VT. The
exponent in the drainage relationship was computed based on gaged records and VTAOT
database values of the Q100 at bridge 23 in Craftsbury. The drainage area used above bridge
number 23 is 30.9 square miles.
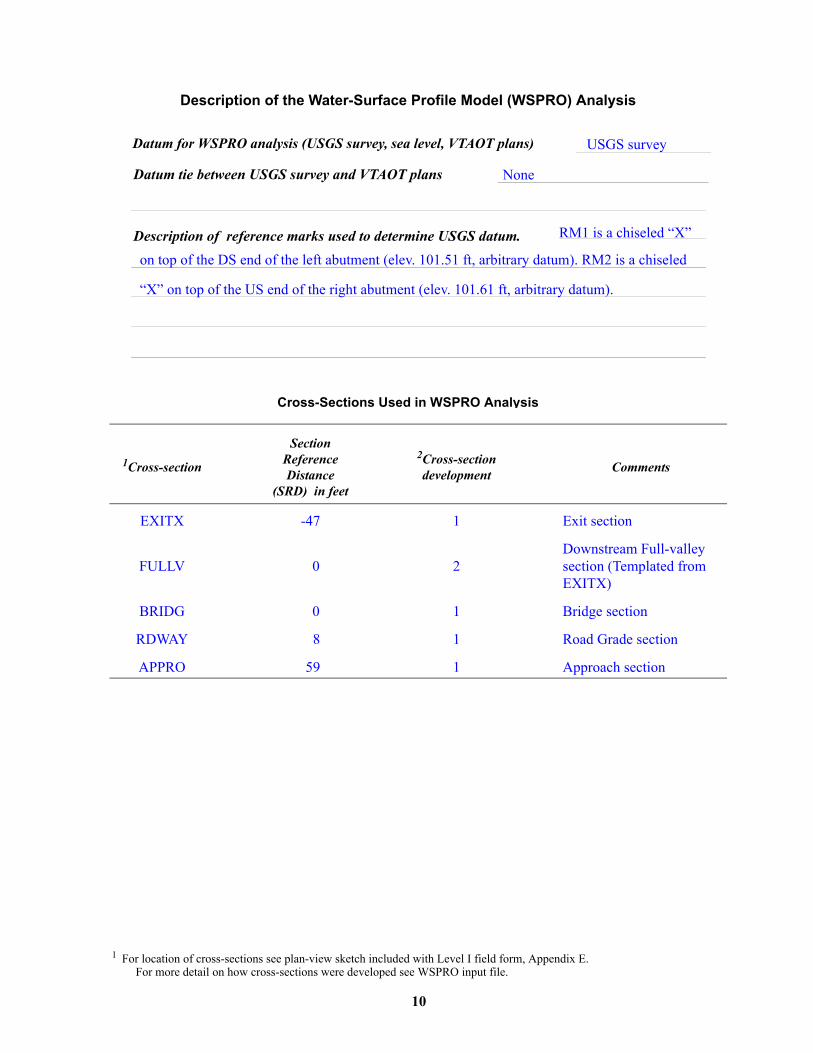
Description of the Water-Surface Profile Model (WSPRO) Analysis
Datum for WSPRO analysis (USGS survey, sea level, VTAOT plans)
Datum tie between USGS survey and VTAOT plans
Cross-Sections Used in WSPRO Analysis
1 For location of cross-sections see plan-view sketch included with Level I field form, Appendix For more detail on how cross-sections were developed see WSPRO input file.
10
1Cross-section
Section Reference Distance
(SRD) in feet
2Cross-section development
EXITX -47 1 Ex
FULLV 0 2DoseEX
BRIDG 0 1 Br
RDWAY 8 1 Ro
APPRO 59 1 Ap
USGS survey
None
RM1 is a chiseled “X”
Description of reference marks used to determine USGS datum.on top of the DS end of the left abutment (elev. 101.51 ft, arbitrary datum). RM2 is a chiseled
“X” on top of the US end of the right abutment (elev. 101.61 ft, arbitrary datum).
E.
Comments
it section
wnstream Full-valley ction (Templated from ITX)
idge section
ad Grade section
proach section
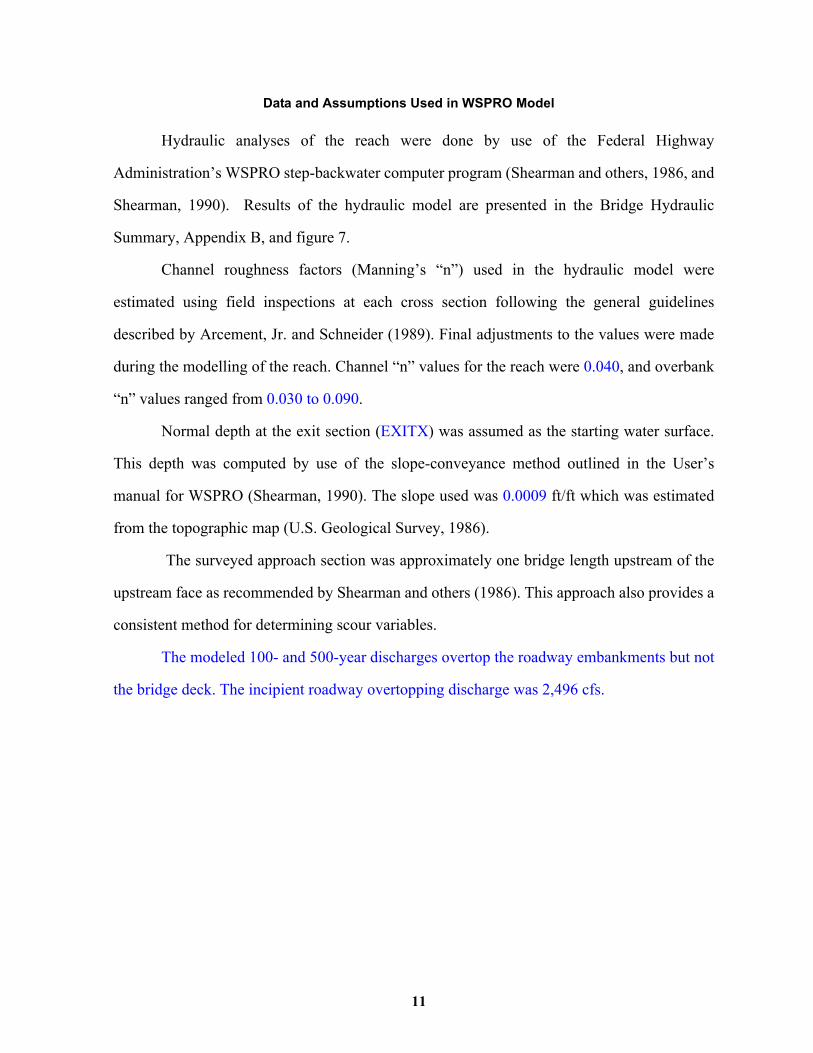
Data and Assumptions Used in WSPRO Model
11
Hydraulic analyses of the reach were done by use of the Federal Highway
Administration’s WSPRO step-backwater computer program (Shearman and others, 1986, and
Shearman, 1990). Results of the hydraulic model are presented in the Bridge Hydraulic
Summary, Appendix B, and figure 7.
Channel roughness factors (Manning’s “n”) used in the hydraulic model were
estimated using field inspections at each cross section following the general guidelines
described by Arcement, Jr. and Schneider (1989). Final adjustments to the values were made
during the modelling of the reach. Channel “n” values for the reach were 0.040, and overbank
“n” values ranged from 0.030 to 0.090.
Normal depth at the exit section (EXITX) was assumed as the starting water surface.
This depth was computed by use of the slope-conveyance method outlined in the User’s
manual for WSPRO (Shearman, 1990). The slope used was 0.0009 ft/ft which was estimated
from the topographic map (U.S. Geological Survey, 1986).
The surveyed approach section was approximately one bridge length upstream of the
upstream face as recommended by Shearman and others (1986). This approach also provides a
consistent method for determining scour variables.
The modeled 100- and 500-year discharges overtop the roadway embankments but not
the bridge deck. The incipient roadway overtopping discharge was 2,496 cfs.

Bridge Hydraulics Summary
Average bridge embankment eleva ftAverage low steel elevation
100-year discharge Water-surface elevati
Road overtopping? _
Area of flow in bridge openAverage velocity in bridge oMaximum WSPRO tube vel Water-surface elevation at AWater-surface elevation at AAmount of backwater cause
500-year discharge Water-surface elevatio
Road overtopping? __
Area of flow in bridge openAverage velocity in bridge oMaximum WSPRO tube vel Water-surface elevation at AWater-surface elevation at AAmount of backwater cause
Incipient overtopping dischWater-surface elevation in b
Area of flow in bridge openAverage velocity in bridge oMaximum WSPRO tube vel Water-surface elevation at AWater-surface elevation at AAmount of backwater cause
101.6
ft
tion99.2
ft3/s
2,60012
ening
ing pening ocity at bridge
pproach section wipproach section wd by bridge
ft3/s ening
ing pening ocity at bridge pproach section wipproach section
d by bridge
arge ridge opening
ing pening ocity at bridge pproach section wipproach sectio
d by bridge
ft99.2
r road ____
on in bridge op
_______ DY
2
th bridge ge
r road __2
th bridge e
3
th bridge dge
____ ft3/s218
ischarge oveft356
6.7
ft/s ft/s8.0/s
ft100.1
ft98.2
ithout brid ft1.93,530
ft99.2
n in bridge op______ DY
______ ft3/s633 ischarge ovef356
t ft8.2 /sft/s9.8
ft100.7
ft98.9
without bridg ft1.8f2,496
t /s ft97.5f287
t2f8.7
t/s ft10.8ft99.2
ft98.1
n without bri ft1.1
Scour Analysis Summary
Special Conditions or Assumptions Made in Scour Analysis
13
Scour depths were computed using the general guidelines described in Hydraulic
Engineering Circular 18 (Richardson and others, 1993). Scour depths were calculated
assuming an infinite depth of erosive material and a homogeneous particle-size distribution.
The results of the scour analysis are presented in tables 1 and 2 and a graph of the scour
depths is presented in figure 8.
The 100-year and 500-year discharges resulted in unsubmerged orifice flow.
Contraction scour at bridges with orifice flow is best estimated by use of the Chang pressure-
flow scour equation (oral communication, J. Sterling Jones, October 4, 1996). Therefore,
contraction scour for these two discharges was computed by use of the Chang equation
(Richardson and others, 1995, p. 145-146). Contraction scour was computed by use of the
clear-water contraction scour equation (Richardson and others, 1993, p. 35, equation 18) for
the incipient road-overflow discharge. For contraction scour computations, the average
depth in the contracted section (AREA/TOPWIDTH) is subtracted from the depth of flow
computed by the scour equation (Y2) to determine the actual amount of scour. In this case,
the incipient road-overflow model resulted in the worst case contraction scour with a scour
depth of 0.6 ft. However, it was not the worst case total scour.
Abutment scour for the right abutment at all modelled discharges was computed by
use of the Froehlich equation (Richardson and others, 1993, p. 49, equation 24). The
Froehlich equation gives “excessively conservative estimates of scour depths” (Richardson
and others, 1993, p. 48). Variables for the Froehlich equation include the Froude number of
the flow approaching the embankments, the length of the embankment blocking flow, and
the depth of flow approaching the embankment less any roadway overtopping.
Scour at the left abutment for all modeled discharges was computed by use of the
HIRE equation (Richardson and others, 1993, p. 50, equation 25) because the HIRE equation
is recommended when the length to depth ratio of the embankment blocking flow exceeds
25. The variables used by the HIRE abutment-scour equation are defined the same as those
defined for the Froehlich abutment-scour equation.

Scour Results
Incipient overtopping
Contraction scour: 100-yr discharge 500-yr discharge discharge
(Scour depths in feet)
Main channel
Live-bed scour
Clear-water scour
Depth to armoring
Left overbank
Right overbank
Local scour:
Abutment scour
Left abutment
Right abutment
Pier scour
Pier 1
Pier 2
Pier 3
Abutments:
Left abutment
Right abutment
Piers:
Pier 1
Pier 2
______--
14
______
______
______
Rock Riprap Sizin
100-yr discharge
_
______
______--
______
______
______
g
500-yr discharg
et)
______
______
______--
______ 0.0
______ 0.5
______0.6
0.5
2.1 4.2 ______--
______--
______--
______--
______--
______--
______11.7
12.4o
e
12.1
______ 8.7
______ 9.0 ______9.8______
--
-- --______--
______-- ______--______--
______-- ______--______
Incipient vertopping
discharge
0.9
(D50 in fe1.3
2.0______ 0.9
1.3______2.0
______ --
______ --
______--
--
-- -- _____--
______--
______--
______
15
Figure 7. Water-surface profiles for the 100- and 500-yr discharges at structure ALBATH00380031 on town highway 38, crossing the Black River, Albany, Vermont.
EL
EV
AT
ION
AB
OV
E A
RB
ITR
AR
Y D
AT
UM
, IN
FE
ET
CHANNEL DISTANCE FROM DOWNSTREAM TO UPSTREAM, IN FEET
-50 70-50 -40 -30 -20 -10 0 10 20 30 40 50 6085
105
85
86
87
88
89
90
91
92
93
94
95
96
97
98
99
100
101
102
103
104
MINIMUM BED ELEVATION
500-YR WATER SURFACE PROFILE
100-YR WATER SURFACE PROFILEBRIDGE DECK
BRIDGE SECTION (BRIDG) APPROACH SECTION (APPRO)EXIT SECTION (EXITX)

16
Figure 8. Scour elevations for the 100-yr and 500-yr discharges at structure ALBATH00380031 on town highway 38, crossing the Black River, Albany, Vermont.
440 5 10 15 20 25 30 35 4080
103
80
82
84
86
88
90
92
94
96
98
100
102
ELE
VA
TIO
N A
BO
VE
AR
BIT
RA
RY
DA
TU
M, I
N F
EE
T
STATIONING FROM LEFT TO RIGHT ALONG BRIDGE SECTION, IN FEET
100-YR SCOUR DEPTHS
500-YR SCOUR DEPTHS
UNKNOWNFOUNDATION
LOW STEEL
UNKNOWNFOUNDATION
ANG
LE O
F R
EPO
SE E
XAG
GE
RAT
ED
100-YEAR WATER SURFACE
500-YEAR WATER SURFACE
HIGH STEEL
17
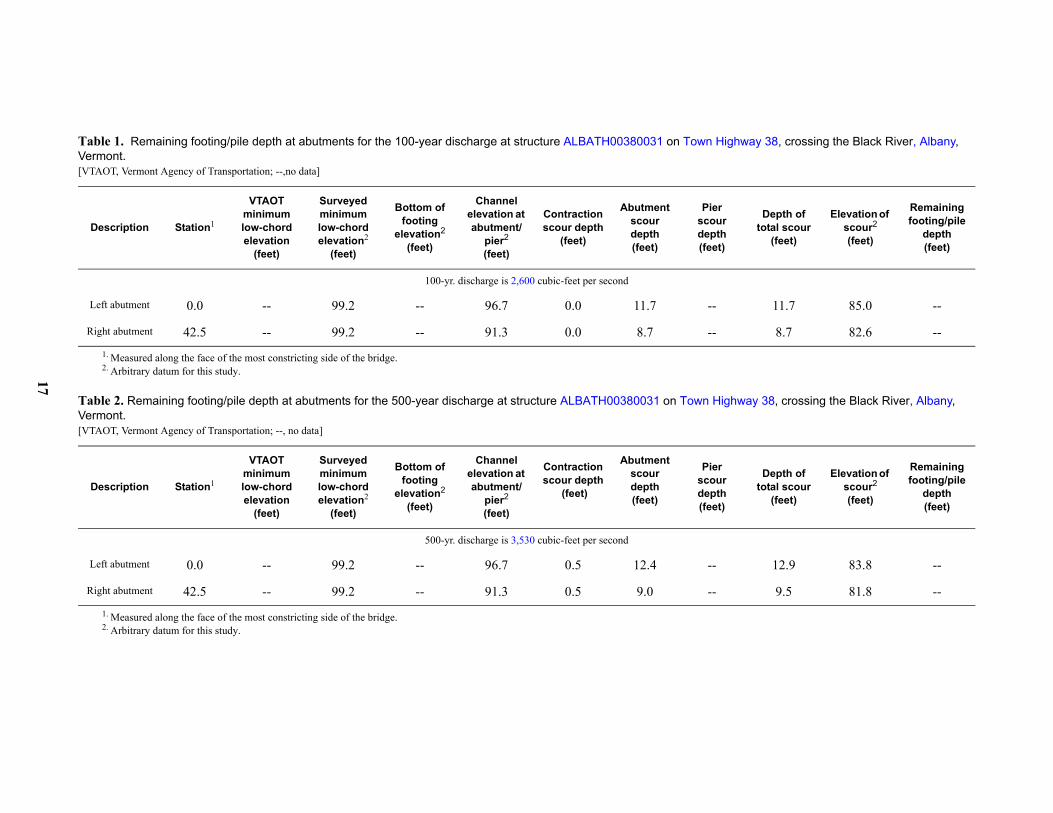
Table 1. Remaining footing/pile depth at abutments for the 100-year discharge at structure ALBATH00380031 on Town Highway 38, crossing the Black River, Albany, Vermont.[VTAOT, Vermont Agency of Transportation; --,no data]
Description Station1
1. Measured along the face of the most constricting side of the bridge.
VTAOT minimum low-chord elevation
(feet)
Surveyed minimum low-chord elevation2
(feet)
2. Arbitrary datum for this study.
Bottom of footing
elevation2
(feet)
Channel elevation at abutment/
pier2
(feet)
Contraction scour depth
(feet)
Abutment scour depth (feet)
Pier scour depth (feet)
Depth of total scour
(feet)
Elevation of scour2
(feet)
Remaining footing/pile
depth(feet)
100-yr. discharge is 2,600 cubic-feet per second
Left abutment 0.0 -- 99.2 -- 96.7 0.0 11.7 -- 11.7 85.0 --
Right abutment 42.5 -- 99.2 -- 91.3 0.0 8.7 -- 8.7 82.6 --
Table 2. Remaining footing/pile depth at abutments for the 500-year discharge at structure ALBATH00380031 on Town Highway 38, crossing the Black River, Albany, Vermont.[VTAOT, Vermont Agency of Transportation; --, no data]
Description Station1
1. Measured along the face of the most constricting side of the bridge.
VTAOT minimum low-chord elevation
(feet)
Surveyed minimum low-chord elevation2
(feet)
2. Arbitrary datum for this study.
Bottom of footing
elevation2
(feet)
Channel elevation at abutment/
pier2
(feet)
Contraction scour depth
(feet)
Abutment scour depth (feet)
Pier scour depth (feet)
Depth of total scour
(feet)
Elevation of scour2
(feet)
Remaining footing/pile
depth(feet)
500-yr. discharge is 3,530 cubic-feet per second
Left abutment 0.0 -- 99.2 -- 96.7 0.5 12.4 -- 12.9 83.8 --
Right abutment 42.5 -- 99.2 -- 91.3 0.5 9.0 -- 9.5 81.8 --
18
SELECTED REFERENCES
Arcement, G.J., Jr., and Schneider, V.R., 1989, Guide for selecting Manning’s roughness coefficients for natural channels and flood plains: U.S. Geological Survey Water-Supply Paper 2339, 38 p.
Barnes, H.H., Jr., 1967, Roughness characteristics of natural channels: U.S. Geological Survey Water-Supply Paper 1849, 213 p.
Brown, S.A. and Clyde, E.S., 1989, Design of riprap revetment: Federal Highway Administration Hydraulic Engineering Circular No. 11, Publication FHWA-IP-89-016, 156 p.
Davidian, J., 1984, Computation of Water-Surface Profiles in Open Channels, TWRI Chapter A15, Book 3, 48 p.
Froehlich, D.C., 1989, Local scour at bridge abutments in Ports, M.A., ed., Hydraulic Engineering--Proceedings of the 1989 National Conference on Hydraulic Engineering: New York, American Society of Civil Engineers, p. 13-18.
Hayes, D.C.,1993, Site selection and collection of bridge-scour data in Delaware, Maryland, and Virginia: U.S. Geological Survey Water-Resources Investigation Report 93-4017, 23 p.
Interagency Advisory Committee on Water Data, 1982, Guidelines for determining flood flow frequency: U.S. Geological Survey, Bulletin 17B of the Hydrology Subcommittee, 190 p.
Laursen, E.M., 1960, Scour at bridge crossings: Journal of the Hydraulics Division, American Society of Civil Engineers, v. 86, no. HY2, p. 39-53.
Richardson, E.V. and Davis, S.R., 1995, Evaluating scour at bridges: Federal Highway Administration Hydraulic Engineering Circular No. 18, Publication FHWA-IP-90-017, 204 p.
Richardson, E.V., Harrison, L.J., Richardson, J.R., and Davis, S.R., 1993, Evaluating scour at bridges: Federal Highway Administration Hydraulic Engineering Circular No. 18, Publication FHWA-IP-90-017, 131 p.
Richardson, E.V., Simons, D.B., and Julien, P.Y., 1990, Highways in the river environment: Federal Highway Administration Publication FHWA-HI-90-016.
Ritter, D.F., 1984, Process Geomorphology: W.C. Brown Co., Debuque, Iowa, 603 p.
Shearman, J.O., 1990, User’s manual for WSPRO--a computer model for water surface profile computations: Federal Highway Administration Publication FHWA-IP-89-027, 187 p.
Shearman, J.O., Kirby, W.H., Schneider, V.R., and Flippo, H.N., 1986, Bridge waterways analysis model; research report: Federal Highway Administration Publication FHWA-RD-86-108, 112 p.
U.S. Department of Transportation, 1993, Stream stability and scour at highway bridges, Participant Workbook: Federal Highway Administration Publication FHWA HI-91-011.
U.S. Geological Survey, 1986, Albany, Vermont 7.5 Minute Series quadrangle map: U.S. Geological Survey Topographic Maps, Aerial Photographs, 1980; Field Checked, 1982; Scale 1:24,000; Contour Interval, 6 meters.
19
APPENDIX A:
WSPRO INPUT FILE

20
T1 U.S. Geological Survey WSPRO Input File alba031.wsp T2 Hydraulic analysis for structure ALBATH00380031 Date: 25-JAN-96 T3 Town Highway 38 Bridge Crossing the Black River, Albany, VT EMBQ 2600.0, 3530.0, 2496.0SK 0.0009, 0.0009, 0.0009*J3 6 29 30 552 553 551 5 16 17 13 3 * 15 14 23 21 11 12 4 7 3*XS EXITX -47GR -298.0, 114.85 -269.8, 100.43 -146.0, 97.69 -67.8, 95.98GR -16.9, 95.74 -3.4, 94.96 0.0, 92.28 10.8, 91.55GR 17.1, 90.33 25.1, 89.93 37.0, 90.11 53.5, 91.52GR 60.6, 93.67 80.5, 95.21 158.7, 97.52 293.1, 99.15*N 0.035 0.040 0.035SA -3.4 60.6** The exit channel points only were lowered by 1.34 feet due to * channel scouring at the bridge section.XS FULLV 0GR -298.0, 114.85 -269.8, 100.43 -146.0, 97.69 -67.8, 95.98GR -16.9, 95.74 -3.4, 94.96 0.0, 90.94 10.8, 90.20GR 17.1, 88.98 25.1, 88.58 37.0, 88.76 53.5, 90.18GR 60.6, 92.32 80.5, 95.21 158.7, 97.52 293.1, 99.15** SRD LSEL XSSKEWBR BRIDG 0 99.2 10.0GR 0.0, 99.24 0.1, 96.72 3.1, 95.89 9.2, 91.42GR 15.1, 88.87 20.6, 88.62 27.1, 88.81 36.0, 89.80GR 41.0, 91.32 41.5, 91.55 42.3, 91.65 42.5, 99.16GR 0.0, 99.24** BRTYPE BRWDTH WWANGL WWWIDCD 1 22.6 * * 19.5 8.2N 0.040*** SRD EMBWID IPAVEXR RDWAY 8 14.3 2GR -336.0, 112.19 -255.2, 102.06 -164.9, 99.51 -80.9, 99.19GR -42.2, 100.08 0.0, 101.49 24.5, 101.71 48.9, 101.45GR 78.0, 101.09 111.4, 100.35 139.5, 100.25 209.2, 102.30*AS APPRO 59GR -384.3, 109.71 -367.6, 101.41 -208.5, 98.58 -141.2, 96.16GR 0.0, 94.71 15.5, 91.56 17.5, 91.01 25.1, 90.63GR 30.6, 90.25 36.2, 90.29 48.9, 91.41 50.3, 93.17GR 88.0, 99.50 135.9, 100.64 212.0, 102.45*N 0.030 0.040 0.090SA 0.0 50.3*HP 1 BRIDG 99.24 1 99.24HP 2 BRIDG 99.24 * * 2395HP 2 RDWAY 99.99 * * 218HP 1 APPRO 100.10 1 100.10HP 2 APPRO 100.10 * * 2600*HP 1 BRIDG 99.24 1 99.24HP 2 BRIDG 99.24 * * 2937HP 2 RDWAY 100.49 * * 633HP 1 APPRO 100.68 1 100.68HP 2 APPRO 100.68 * * 3530*HP 1 BRIDG 97.49 1 97.49HP 2 BRIDG 97.49 * * 2496HP 1 APPRO 99.21 1 99.21HP 2 APPRO 99.21 * * 2496EXER
WSPRO INPUT FILE

21
APPENDIX B:
WSPRO OUTPUT FILE

WSPRO OUTPUT FILE
WSPRO FEDERAL HIGHWAY ADMINISTRATION - U. S. GEOLOGICAL SURVEY V042094 MODEL FOR WATER-SURFACE PROFILE COMPUTATIONS
*** RUN DATE & TIME: 02-14-96 10:58 T1 U.S. Geological Survey WSPRO Input File alba031.wsp T2 Hydraulic analysis for structure ALBATH00380031 Date: 25-JAN-96 T3 Town Highway 38 Bridge Crossing the Black River, Albany, VT EMB
CROSS-SECTION PROPERTIES: ISEQ = 3; SECID = BRIDG; SRD = 0. WSEL SA# AREA K TOPW WETP ALPH LEW REW QCR 1 356 31799 0 96 0 99.24 356 31799 0 96 1.00 0 43 0
VELOCITY DISTRIBUTION: ISEQ = 3; SECID = BRIDG; SRD = 0. WSEL LEW REW AREA K Q VEL 99.24 0.0 42.5 356.1 31799. 2395. 6.73 X STA. 0.0 7.8 10.7 12.9 14.8 16.4 A(I) 31.6 22.1 19.2 17.5 16.5 V(I) 3.79 5.41 6.25 6.84 7.28
X STA. 16.4 17.9 19.4 20.9 22.4 23.8 A(I) 15.7 15.6 15.2 15.0 14.9 V(I) 7.64 7.68 7.89 7.99 8.02
X STA. 23.8 25.3 26.7 28.2 29.7 31.3 A(I) 15.0 14.9 15.0 15.3 15.6 V(I) 7.99 8.02 7.99 7.85 7.70
X STA. 31.3 33.0 34.7 36.6 38.8 42.5 A(I) 15.9 16.5 17.0 19.4 28.4 V(I) 7.55 7.25 7.03 6.18 4.21
VELOCITY DISTRIBUTION: ISEQ = 4; SECID = RDWAY; SRD = 8. WSEL LEW REW AREA K Q VEL 99.99 -181.9 -46.1 71.8 1996. 218. 3.04 X STA. -181.9 -161.6 -153.6 -146.6 -140.1 -134.0 A(I) 5.7 4.1 3.8 3.6 3.6 V(I) 1.92 2.67 2.91 2.99 3.04
X STA. -134.0 -128.5 -123.1 -118.2 -113.4 -108.8 A(I) 3.3 3.4 3.2 3.2 3.1 V(I) 3.26 3.22 3.42 3.38 3.50
X STA. -108.8 -104.4 -100.2 -96.1 -92.1 -88.1 A(I) 3.1 3.1 3.0 3.0 3.0 V(I) 3.54 3.57 3.65 3.58 3.59
X STA. -88.1 -84.1 -80.1 -75.4 -68.7 -46.1 A(I) 3.1 3.2 3.4 4.0 5.8 V(I) 3.53 3.40 3.19 2.71 1.87
CROSS-SECTION PROPERTIES: ISEQ = 5; SECID = APPRO; SRD = 59. WSEL SA# AREA K TOPW WETP ALPH LEW REW QCR 1 907 95527 294 294 9046 2 433 66518 50 52 7202 3 150 4383 63 63 1308 100.10 1490 166428 407 409 1.27 -293 113 14357
VELOCITY DISTRIBUTION: ISEQ = 5; SECID = APPRO; SRD = 59. WSEL LEW REW AREA K Q VEL 100.10 -294.0 113.2 1489.6 166428. 2600. 1.75 X STA. -294.0 -168.2 -139.1 -118.0 -99.8 -82.9 A(I) 155.4 101.4 85.8 78.0 75.4 V(I) 0.84 1.28 1.51 1.67 1.72
X STA. -82.9 -67.8 -53.7 -40.3 -28.0 -16.4 A(I) 69.5 67.0 65.8 62.1 59.8 V(I) 1.87 1.94 1.97 2.09 2.17
X STA. -16.4 -5.1 6.2 14.3 20.4 25.8 A(I) 59.6 64.6 61.0 53.7 51.0 V(I) 2.18 2.01 2.13 2.42 2.55
X STA. 25.8 30.8 35.9 41.1 46.9 113.2 A(I) 48.3 50.2 49.6 53.0 178.2 V(I) 2.69 2.59 2.62 2.45 0.73
22

WSPRO OUTPUT FILE (continued)
CROSS-SECTION PROPERTIES: ISEQ = 3; SECID = BRIDG; SRD = 0. WSEL SA# AREA K TOPW WETP ALPH LEW REW QCR 1 356 31799 0 96 0 99.24 356 31799 0 96 1.00 0 43 0
VELOCITY DISTRIBUTION: ISEQ = 3; SECID = BRIDG; SRD = 0. WSEL LEW REW AREA K Q VEL 99.24 0.0 42.5 356.1 31799. 2937. 8.25 X STA. 0.0 7.8 10.7 12.9 14.8 16.4 A(I) 31.6 22.1 19.2 17.5 16.5 V(I) 4.65 6.63 7.67 8.39 8.93
X STA. 16.4 17.9 19.4 20.9 22.4 23.8 A(I) 15.7 15.6 15.2 15.0 14.9 V(I) 9.37 9.42 9.68 9.80 9.84
X STA. 23.8 25.3 26.7 28.2 29.7 31.3 A(I) 15.0 14.9 15.0 15.3 15.6 V(I) 9.80 9.84 9.79 9.62 9.44
X STA. 31.3 33.0 34.7 36.6 38.8 42.5 A(I) 15.9 16.5 17.0 19.4 28.4 V(I) 9.26 8.89 8.63 7.58 5.17
VELOCITY DISTRIBUTION: ISEQ = 4; SECID = RDWAY; SRD = 8. WSEL LEW REW AREA K Q VEL 100.49 -199.6 147.7 155.1 5859. 633. 4.08 X STA. -199.6 -169.5 -160.7 -153.0 -145.9 -139.4 A(I) 12.8 8.4 7.8 7.3 7.0 V(I) 2.48 3.78 4.06 4.33 4.51
X STA. -139.4 -133.0 -127.0 -121.2 -115.5 -110.1 A(I) 7.0 6.7 6.6 6.5 6.4 V(I) 4.53 4.75 4.80 4.86 4.92
X STA. -110.1 -104.7 -99.6 -94.4 -89.3 -84.3 A(I) 6.4 6.3 6.4 6.4 6.4 V(I) 4.94 5.02 4.98 4.93 4.92
X STA. -84.3 -79.2 -73.3 -65.9 -55.2 147.7 A(I) 6.5 7.0 7.7 8.9 16.6 V(I) 4.85 4.51 4.10 3.55 1.91
CROSS-SECTION PROPERTIES: ISEQ = 5; SECID = APPRO; SRD = 59. WSEL SA# AREA K TOPW WETP ALPH LEW REW QCR 1 1087 120399 327 327 11259 2 462 74160 50 52 7942 3 193 5404 87 88 1629 100.68 1742 199963 464 466 1.29 -326 138 16878
VELOCITY DISTRIBUTION: ISEQ = 5; SECID = APPRO; SRD = 59. WSEL LEW REW AREA K Q VEL 100.68 -326.6 137.6 1742.3 199963. 3530. 2.03 X STA. -326.6 -184.3 -150.9 -129.0 -109.5 -92.3 A(I) 185.3 119.1 98.4 92.2 84.9 V(I) 0.95 1.48 1.79 1.91 2.08
X STA. -92.3 -76.6 -62.0 -48.3 -35.3 -23.1 A(I) 80.0 77.0 73.9 72.0 69.3 V(I) 2.21 2.29 2.39 2.45 2.55
X STA. -23.1 -11.5 -0.5 10.5 17.8 23.7 A(I) 67.4 64.6 76.9 65.3 57.5 V(I) 2.62 2.73 2.29 2.70 3.07
X STA. 23.7 29.4 34.9 40.6 46.6 137.6 A(I) 58.3 56.6 58.6 58.3 226.6 V(I) 3.03 3.12 3.01 3.03 0.78
23

WSPRO OUTPUT FILE (continued)
CROSS-SECTION PROPERTIES: ISEQ = 3; SECID = BRIDG; SRD = 0. WSEL SA# AREA K TOPW WETP ALPH LEW REW QCR 1 287 33918 42 51 4264 97.49 287 33918 42 51 1.00 0 42 4264
VELOCITY DISTRIBUTION: ISEQ = 3; SECID = BRIDG; SRD = 0. WSEL LEW REW AREA K Q VEL 97.49 0.1 42.5 286.7 33918. 2496. 8.71 X STA. 0.1 9.3 11.9 14.0 15.6 17.1 A(I) 27.2 17.3 15.3 13.7 12.8 V(I) 4.59 7.20 8.17 9.14 9.73
X STA. 17.1 18.5 19.9 21.3 22.6 24.0 A(I) 12.5 12.1 11.8 11.6 11.5 V(I) 10.02 10.32 10.61 10.77 10.81
X STA. 24.0 25.3 26.7 28.1 29.5 31.0 A(I) 11.6 11.6 12.0 11.9 12.2 V(I) 10.73 10.78 10.37 10.45 10.27
X STA. 31.0 32.6 34.2 36.1 38.3 42.5 A(I) 12.7 13.3 14.2 16.2 25.3 V(I) 9.84 9.41 8.81 7.70 4.93
CROSS-SECTION PROPERTIES: ISEQ = 5; SECID = APPRO; SRD = 59. WSEL SA# AREA K TOPW WETP ALPH LEW REW QCR 1 668 64936 244 244 6273 2 388 55449 50 52 6113 3 109 3723 36 36 1071 99.21 1165 124107 330 332 1.24 -243 86 11136
VELOCITY DISTRIBUTION: ISEQ = 5; SECID = APPRO; SRD = 59. WSEL LEW REW AREA K Q VEL 99.21 -243.9 86.3 1164.6 124107. 2496. 2.14 X STA. -243.9 -146.8 -122.5 -102.7 -85.2 -68.9 A(I) 118.3 75.6 66.0 62.1 60.4 V(I) 1.05 1.65 1.89 2.01 2.07
X STA. -68.9 -54.4 -40.9 -28.0 -16.1 -5.0 A(I) 56.0 54.2 53.5 50.7 48.9 V(I) 2.23 2.30 2.33 2.46 2.55
X STA. -5.0 6.4 13.9 19.4 24.2 28.9 A(I) 55.1 49.4 43.8 40.3 40.2 V(I) 2.26 2.53 2.85 3.09 3.11
X STA. 28.9 33.2 37.7 42.3 47.4 86.3 A(I) 38.6 40.1 39.6 41.7 130.0 V(I) 3.23 3.11 3.15 2.99 0.96 EX
+++ BEGINNING PROFILE CALCULATIONS -- 3
XSID:CODE SRDL LEW AREA VHD HF EGL CRWS Q WSEL SRD FLEN REW K ALPH HO ERR FR# VEL
EXITX:XS ****** -163 919 0.19 ***** 98.28 94.95 2600 98.09 -46 ****** 206 86633 1.50 ***** ******* 0.39 2.83
FULLV:FV 47 -166 1043 0.15 0.03 98.31 ******* 2600 98.16 0 47 212 109698 1.56 0.00 0.00 0.33 2.49 <<<<<THE ABOVE RESULTS REFLECT “NORMAL” (UNCONSTRICTED) FLOW>>>>>
APPRO:AS 59 -197 858 0.18 0.04 98.37 ******* 2600 98.19 59 59 80 84134 1.26 0.01 0.00 0.34 3.03 <<<<<THE ABOVE RESULTS REFLECT “NORMAL” (UNCONSTRICTED) FLOW>>>>>
===215 FLOW CLASS 1 SOLUTION INDICATES POSSIBLE ROAD OVERFLOW. WS1,WSSD,WS3,RGMIN = 99.39 0.00 97.57 99.19
===260 ATTEMPTING FLOW CLASS 4 SOLUTION.
===220 FLOW CLASS 1 (4) SOLUTION INDICATES POSSIBLE PRESSURE FLOW. WS3,WSIU,WS1,LSEL = 97.58 99.31 99.38 99.20
===245 ATTEMPTING FLOW CLASS 2 (5) SOLUTION.
24

WSPRO OUTPUT FILE (continued)
<<<<<RESULTS REFLECTING THE CONSTRICTED FLOW FOLLOW>>>>>
XSID:CODE SRDL LEW AREA VHD HF EGL CRWS Q WSEL SRD FLEN REW K ALPH HO ERR FR# VEL
BRIDG:BR 47 0 356 0.70 ***** 99.94 95.03 2395 99.24 0 ****** 43 31799 1.00 ***** ******* 0.41 6.73
TYPE PPCD FLOW C P/A LSEL BLEN XLAB XRAB 1. **** 5. 0.371 0.000 99.20 ****** ****** ******
XSID:CODE SRD FLEN HF VHD EGL ERR Q WSEL RDWAY:RG 8. 45. 0.01 0.06 100.15 0.01 218. 99.99
Q WLEN LEW REW DMAX DAVG VMAX VAVG HAVG CAVG LT: 218. 136. -182. -46. 0.8 0.5 3.5 3.0 0.7 2.8 RT: 0. 24. 118. 142. 0.1 0.0 2.0 9.3 0.3 2.6
XSID:CODE SRDL LEW AREA VHD HF EGL CRWS Q WSEL SRD FLEN REW K ALPH HO ERR FR# VEL
APPRO:AS 36 -293 1491 0.06 0.05 100.16 96.38 2600 100.10 59 46 113 166599 1.27 0.13 0.01 0.18 1.74 M(G) M(K) KQ XLKQ XRKQ OTEL ****** ****** ******** ****** ****** ********
<<<<<END OF BRIDGE COMPUTATIONS>>>>>
FIRST USER DEFINED TABLE.
XSID:CODE SRD LEW REW Q K AREA VEL WSEL EXITX:XS -47. -164. 206. 2600. 86633. 919. 2.83 98.09 FULLV:FV 0. -167. 212. 2600. 109698. 1043. 2.49 98.16 BRIDG:BR 0. 0. 43. 2395. 31799. 356. 6.73 99.24 RDWAY:RG 8.******* 218. 218.********* 0. 2.00 99.99 APPRO:AS 59. -294. 113. 2600. 166599. 1491. 1.74 100.10
XSID:CODE XLKQ XRKQ KQ APPRO:AS ***********************
SECOND USER DEFINED TABLE.
XSID:CODE CRWS FR# YMIN YMAX HF HO VHD EGL WSEL EXITX:XS 94.95 0.39 89.93 114.85************ 0.19 98.28 98.09 FULLV:FV ******** 0.33 88.58 114.85 0.03 0.00 0.15 98.31 98.16 BRIDG:BR 95.03 0.41 88.62 99.24************ 0.70 99.94 99.24 RDWAY:RG **************** 99.19 112.19 0.01****** 0.06 100.15 99.99 APPRO:AS 96.38 0.18 90.25 109.71 0.05 0.13 0.06 100.16 100.10
XSID:CODE SRDL LEW AREA VHD HF EGL CRWS Q WSEL SRD FLEN REW K ALPH HO ERR FR# VEL
EXITX:XS ****** -197 1228 0.20 ***** 99.03 96.33 3530 98.83 -46 ****** 267 117621 1.52 ***** ******* 0.38 2.87
FULLV:FV 47 -199 1356 0.17 0.03 99.06 ******* 3530 98.90 0 47 272 142525 1.60 0.00 0.00 0.34 2.60 <<<<<THE ABOVE RESULTS REFLECT “NORMAL” (UNCONSTRICTED) FLOW>>>>>
APPRO:AS 59 -227 1071 0.21 0.05 99.13 ******* 3530 98.92 59 59 85 112050 1.24 0.02 0.00 0.35 3.30 <<<<<THE ABOVE RESULTS REFLECT “NORMAL” (UNCONSTRICTED) FLOW>>>>>
===215 FLOW CLASS 1 SOLUTION INDICATES POSSIBLE ROAD OVERFLOW. WS1,WSSD,WS3,RGMIN = 100.87 0.00 98.11 99.19
===260 ATTEMPTING FLOW CLASS 4 SOLUTION.
===220 FLOW CLASS 1 (4) SOLUTION INDICATES POSSIBLE PRESSURE FLOW. WS3,WSIU,WS1,LSEL = 98.56 100.45 100.52 99.20
===245 ATTEMPTING FLOW CLASS 2 (5) SOLUTION.
<<<<<RESULTS REFLECTING THE CONSTRICTED FLOW FOLLOW>>>>>
25

WSPRO OUTPUT FILE (continued)
XSID:CODE SRDL LEW AREA VHD HF EGL CRWS Q WSEL SRD FLEN REW K ALPH HO ERR FR# VEL
BRIDG:BR 47 0 356 1.06 ***** 100.30 95.80 2937 99.24 0 ****** 43 31799 1.00 ***** ******* 0.50 8.25
TYPE PPCD FLOW C P/A LSEL BLEN XLAB XRAB 1. **** 5. 0.432 0.000 99.20 ****** ****** ******
XSID:CODE SRD FLEN HF VHD EGL ERR Q WSEL RDWAY:RG 8. 45. 0.01 0.08 100.75 0.01 633. 100.49
Q WLEN LEW REW DMAX DAVG VMAX VAVG HAVG CAVG LT: 603. 169. -199. -30. 1.3 0.9 4.7 4.1 1.1 3.0 RT: 30. 42. 105. 148. 0.2 0.2 2.6 4.6 0.4 2.7
XSID:CODE SRDL LEW AREA VHD HF EGL CRWS Q WSEL SRD FLEN REW K ALPH HO ERR FR# VEL
APPRO:AS 36 -325 1741 0.08 0.08 100.76 96.84 3530 100.68 59 48 137 199836 1.29 0.12 0.01 0.21 2.03
M(G) M(K) KQ XLKQ XRKQ OTEL ****** ****** ******** ****** ****** ********
<<<<<END OF BRIDGE COMPUTATIONS>>>>>
FIRST USER DEFINED TABLE.
XSID:CODE SRD LEW REW Q K AREA VEL WSEL EXITX:XS -47. -198. 267. 3530. 117621. 1228. 2.87 98.83 FULLV:FV 0. -200. 272. 3530. 142525. 1356. 2.60 98.90 BRIDG:BR 0. 0. 43. 2937. 31799. 356. 8.25 99.24 RDWAY:RG 8.******* 603. 633.****************** 2.00 100.49 APPRO:AS 59. -326. 137. 3530. 199836. 1741. 2.03 100.68
XSID:CODE XLKQ XRKQ KQ APPRO:AS ***********************
SECOND USER DEFINED TABLE.
XSID:CODE CRWS FR# YMIN YMAX HF HO VHD EGL WSEL EXITX:XS 96.33 0.38 89.93 114.85************ 0.20 99.03 98.83 FULLV:FV ******** 0.34 88.58 114.85 0.03 0.00 0.17 99.06 98.90 BRIDG:BR 95.80 0.50 88.62 99.24************ 1.06 100.30 99.24 RDWAY:RG **************** 99.19 112.19 0.01****** 0.08 100.75 100.49 APPRO:AS 96.84 0.21 90.25 109.71 0.08 0.12 0.08 100.76 100.68
XSID:CODE SRDL LEW AREA VHD HF EGL CRWS Q WSEL SRD FLEN REW K ALPH HO ERR FR# VEL
EXITX:XS ****** -159 883 0.19 ***** 98.18 94.83 2496 97.99 -46 ****** 198 83120 1.50 ***** ******* 0.39 2.83
FULLV:FV 47 -162 1006 0.15 0.03 98.21 ******* 2496 98.06 0 47 203 105942 1.55 0.00 0.00 0.33 2.48 <<<<<THE ABOVE RESULTS REFLECT “NORMAL” (UNCONSTRICTED) FLOW>>>>>
APPRO:AS 59 -194 830 0.18 0.04 98.27 ******* 2496 98.09 59 59 80 80527 1.27 0.01 0.00 0.34 3.01 <<<<<THE ABOVE RESULTS REFLECT “NORMAL” (UNCONSTRICTED) FLOW>>>>>
===215 FLOW CLASS 1 SOLUTION INDICATES POSSIBLE ROAD OVERFLOW. WS1,WSSD,WS3,RGMIN = 99.21 0.00 97.49 99.19
===260 ATTEMPTING FLOW CLASS 4 SOLUTION.
<<<<<RESULTS REFLECTING THE CONSTRICTED FLOW FOLLOW>>>>>
XSID:CODE SRDL LEW AREA VHD HF EGL CRWS Q WSEL SRD FLEN REW K ALPH HO ERR FR# VEL
BRIDG:BR 47 0 287 1.62 0.10 99.11 95.18 2496 97.49 0 47 42 33896 1.37 0.83 0.00 0.69 8.71
26

WSPRO OUTPUT FILE (continued)
TYPE PPCD FLOW C P/A LSEL BLEN XLAB XRAB 1. **** 4. 0.853 ****** 99.20 ****** ****** ******
XSID:CODE SRD FLEN HF VHD EGL ERR Q WSEL RDWAY:RG 8. <<<<<EMBANKMENT IS NOT OVERTOPPED>>>>>
XSID:CODE SRDL LEW AREA VHD HF EGL CRWS Q WSEL SRD FLEN REW K ALPH HO ERR FR# VEL
APPRO:AS 36 -243 1165 0.09 0.07 99.30 96.32 2496 99.21 59 46 86 124123 1.24 0.12 0.00 0.22 2.14
M(G) M(K) KQ XLKQ XRKQ OTEL 0.845 0.703 36849. -13. 30. ********
<<<<<END OF BRIDGE COMPUTATIONS>>>>>
FIRST USER DEFINED TABLE.
XSID:CODE SRD LEW REW Q K AREA VEL WSEL EXITX:XS -47. -160. 198. 2496. 83120. 883. 2.83 97.99 FULLV:FV 0. -163. 203. 2496. 105942. 1006. 2.48 98.06 BRIDG:BR 0. 0. 42. 2496. 33896. 287. 8.71 97.49 RDWAY:RG 8.************** 0. 0. 0. 2.00******** APPRO:AS 59. -244. 86. 2496. 124123. 1165. 2.14 99.21
XSID:CODE XLKQ XRKQ KQ APPRO:AS -13. 30. 36849.
SECOND USER DEFINED TABLE.
XSID:CODE CRWS FR# YMIN YMAX HF HO VHD EGL WSEL EXITX:XS 94.83 0.39 89.93 114.85************ 0.19 98.18 97.99 FULLV:FV ******** 0.33 88.58 114.85 0.03 0.00 0.15 98.21 98.06 BRIDG:BR 95.18 0.69 88.62 99.24 0.10 0.83 1.62 99.11 97.49 RDWAY:RG **************** 99.19 112.19 0.02****** 0.09 99.28******** APPRO:AS 96.32 0.22 90.25 109.71 0.07 0.12 0.09 99.30 99.21 ER
1 NORMAL END OF WSPRO EXECUTION.
27

28
APPENDIX C:
BED-MATERIAL PARTICAL-SIZE DISTRIBUTION

29
Appendix C. Bed material particle-size distributions for three pebble count transects at the approach cross-section for
structure ALBATH00380031, in Albany, Vermont.
0
100
0
10
20
30
40
50
60
70
80
90
CU
M.%
FIN
ER
1 10,0002 5 10 20 50 100 200 500 1,000 2,000 5,000
SIZE (MM)

30
APPENDIX D:
HISTORICAL DATA FORM