level ii scour analysis for bridge 38 (bethth00070038… · -4 level ii scour analysis for bridge...
TRANSCRIPT
-4
LEVEL II SCOUR ANALYSIS FORBRIDGE 38 (BETHTH00070038) onTOWN HIGHWAY 7, crossingGILEAD BROOK,BETHEL, VERMONT
U.S. Geological SurveyOpen-File Report 96-189
Prepared in cooperation with
VERMONT AGENCY OF TRANSPORTATION
and
FEDERAL HIGHWAY ADMINISTRATION

-3
LEVEL II SCOUR ANALYSIS FORBRIDGE 38 (BETHTH00070038) onTOWN HIGHWAY 7, crossingGILEAD BROOK,
BETHEL, VERMONT
By MICHAEL A. IVANOFF and DONALD L. SONG
U.S. Geological SurveyOpen-File Report 96-189
Prepared in cooperation with
VERMONT AGENCY OF TRANSPORTATION
and
FEDERAL HIGHWAY ADMINISTRATION
Pembroke, New Hampshire
1996

U.S. DEPARTMENT OF THE INTERIOR
BRUCE BABBITT, Secretary
U.S. GEOLOGICAL SURVEYGordon P. Eaton, Director
For additional information Copies of this report may bewrite to: purchased from:
District Chief U.S. Geological SurveyU.S. Geological Survey Earth Science Information Center361 Commerce Way Open-File Reports SectionPembroke, NH 03275-3718 Box 25286, MS 517
Federal CenterDenver, CO 80225

-1
CONTENTSIntroduction........................................................................................................................................................ 1
Level II summary ............................................................................................................................................... 7Description of Bridge ................................................................................................................................... 7Description of the Geomorphic Setting........................................................................................................ 8Description of the Channel........................................................................................................................... 8Hydrology..................................................................................................................................................... 9 Calculated Discharges .......................................................................................................................... 9Description of the Water-Surface Profile Model (WSPRO) Analysis ......................................................... 10 Cross-Sections Used in WSPRO Analysis............................................................................................ 10 Data and Assumptions Used in WSPRO Model ................................................................................... 11Bridge Hydraulics Summary........................................................................................................................ 12Scour Analysis Summary ............................................................................................................................. 13 Special Conditions or Assumptions Made in Scour Analysis............................................................... 13 Scour Results......................................................................................................................................... 14Rock Riprap Sizing ...................................................................................................................................... 14
References .......................................................................................................................................................... 18
Appendixes:
A. WSPRO input file.................................................................................................................................... 19
B. WSPRO output file .................................................................................................................................. 22
C. Bed-material particle-size distribution .................................................................................................... 29
D. Historical data form................................................................................................................................. 30
E. Level I data form...................................................................................................................................... 36
F. Scour computations.................................................................................................................................. 46
FIGURES
1. Map showing location of study area on USGS 1:24,000 scale map ............................................................. 3 2. Map showing location of study area on Vermont Agency of Transportation town
highway map ................................................................................................................................... 4 3. Structure BETHTH00070038 viewed from upstream (October 18, 1994)................................................... 5 4. Downstream channel viewed from structure BETHTH00070038 (October 18, 1994). ............................... 5 5. Upstream channel viewed from structure BETHTH00070038 (October 18, 1994). .................................... 6 6. Structure BETHTH00070038 viewed from downstream (October 18, 1994)............................................. 6 7. Water-surface profiles for the 100- and 500-year discharges at structure
BETHTH00070038 on Town Highway 7, crossing Gilead Brook, Bethel, Vermont. ............................................................................................................................. 15
8. Scour elevations for the 100- and 500-year discharges at structure BETHTH00070038 on Town Highway 7, crossing Gilead Brook, Bethel, Vermont. ............................................................................................................................. 16
TABLES
1. Remaining footing/pile depth at abutments for the 100-year discharge at structureBETHTH00070038 on Town Highway 7, crossing Gilead Brook,Bethel, Vermont .................................................................................................................................. 17
2. Remaining footing/pile depth at abutments for the 500-year discharge at structure BETHTH00070038 on Town Highway 7, crossing Gilead Brook, Bethel, Vermont ................................................................................................................................. 17
iii

0iv
CONVERSION FACTORS, ABBREVIATIONS, AND VERTICAL DATUM
Multiply By To obtain
Length
inch (in.) 25.4 millimeter (mm) foot (ft) 0.3048 meter (m) mile (mi) 1.609 kilometer (km)
Slope
foot per mile (ft/mi) 0.1894 meter per kilometer (m/km)Area
square mile (mi2) 2.590 square kilometer (km2) Volume
cubic foot (ft3) 0.02832 cubic meter (m3)Velocity and Flow
foot per second (ft/s) 0.3048 meter per second (m/s)cubic foot per second (ft3/s) 0.02832 cubic meter per second (m3/s)cubic foot per second per 0.01093 cubic meter per square mile second per square [(ft3/s)/mi2] kilometer [(m3/s)/km2]
OTHER ABBREVIATIONS
BF bank full LWW left wingwallcfs cubic feet per second MC main channelD50 median diameter of bed material RAB right abutmentDS downstream RABUT face of right abutmentelev. elevation RB right bankf/p flood plain ROB right overbankft2 square feet RWW right wingwallft/ft feet per foot TH town highwayJCT junction UB under bridgeLAB left abutment US upstreamLABUT face of left abutment USGS United States Geological SurveyLB left bank VTAOT Vermont Agency of TransportationLOB left overbank WSPRO water-surface profile model
In this report, the words “right” and “left” refer to directions that would be reported by an observer facing downstream.
Sea level: In this report, “sea level” refers to the National Geodetic Vertical Datum of 1929-- a geodetic datum derived from a general adjustment of the first-order level nets of the United States and Canada, formerly called Sea Level Datum of 1929.
In the appendices, the above abbreviations may be combined. For example, USLB would represent upstream left bank.

LEVEL II SCOUR ANALYSIS FOR BRIDGE 38 (BETHTH00070038) ON TOWN HIGHWAY 7,
CROSSING GILEAD BROOK, BETHEL, VERMONTBy Michael A. Ivanoff and Donald L. Song
INTRODUCTION
This report provides the results of a detailed Level II analysis of scour potential at structure
BETHTH00070038 on town highway 7 crossing Gilead Brook, Bethel, Vermont (figures
1–8). A Level II study is a basic engineering analysis of the site, including a quantitative
analysis of stream stability and scour (U.S. Department of Transportation, 1993). A Level
I study is included in Appendix E of this report. A Level I study provides a qualitative
geomorphic characterization of the study site. Information on the bridge available from
VTAOT files was compiled prior to conducting Level I and Level II analyses and can be
found in Appendix D.
The site is in the Green Mountain physiographic province of central Vermont in the town of
Bethel. The 8.83-mi2 drainage area is predominantly rural and forested. In the vicinity of
the study site, the banks have dense woody vegetation coverage.
In the study area, Gilead Brook is an incised, straight channel with a slope of approximately
0.028 ft/ft, an average channel top width of 46 ft and an average channel depth of 3 ft. The
predominant channel bed material is gravel (D50 is 43.9 mm or 0.144 ft). The geomorphic
assessment at the time of the Level I and Level II site visit on October 18, 1994, indicated
that the reach was stable.
1

The town highway 7 crossing of Gilead Brook is a 40-ft-long, two-lane bridge consisting of
one 38-foot span concrete deck (Vermont Agency of Transportation, written commun.,
August 24, 1994). The bridge is supported by vertical, concrete abutments with wingwalls.
The channel is skewed approximately 55 degrees to the opening while the opening-skew-to-
roadway is 25 degrees.
The scour protection measure at the site included type-2 stone fill (less than 36 inches
diameter) at the US and DS left and right wingwalls, US left and right banks, and US and
DS side of the left and right road embankments. Additional details describing conditions at
the site are included in the Level II Summary and Appendices D and E.
Scour depths and rock rip-rap sizes were computed using the general guidelines described
in Hydraulic Engineering Circular 18 (Richardson and others, 1993). Scour depths were
calculated assuming an infinite depth of erosive material and a homogeneous particle-size
distribution. The scour analysis results are presented in tables 1 and 2 and a graph of the
scour depths is presented in figure 8.
2

3
Figure 1. Location of study area on USGS 1:24,000 scale map.
Randolph, VT. Quadrangle, 1:24,000, 1981
NORTH

4
Figure 2. Location of study area on Vermont Agency of Transportation town highway map.

Figure 3. Structure BETHTH00070038 viewed from upstream (October 18, 1994).
Figure 4. Downstream channel viewed from structure BETHTH00070038 (October 18, 1994).
5

Figure 5. Upstream channel viewed from structure BETHTH00070038 (October 18, 1994).
Figure 6. Structure BETHTH00070038 viewed from downstream (October 18, 1994).
6

LEVEL II SUMMARY
Structure Number Stream
County
Bridge length
Alignment of bri
Abutment type
Stone fill on abut
Is bridge skewed
Debris accumul
Level I
Potential fo
BETHTH00070038
7
Road
Description of Bridge
ft Bridge width
ght)
Embankme
ment?
to flood flow according t rvey?
ation on bridge at time of Level I or Level
D Percent blocked
r debris
Gilead Brook
District
Windsor TH007nt type
Angle
II site visit:
Percent blocked
04
40
38 25.3 ft Max span length ftStraight
dge to road (on curve or straiVertical
N/A
No
10/18/94
Date of inspectionType-2, around US and DS left and right wingwalls, US left and right
Description of stone fillbanks, and the US and DS side of the left and right road embankments.Concrete abutments and wingwalls.
Brief description of piers/abutments
Y
55o Level I suY
Is bridge located on a bend in channel? If so, describe (mild, moderate, severe) There is a moderate channel bend into the upstream bridge face impacting the left abutment.
10/18/94
ate of inspection 0
of channel horizontally 0
of channel vertically
10/18/
94
-- --Moderate.
Level IINone
Describe any features near or at the bridge that may affect flow (include observation date).
Description of the Geomorphic Setting
General topography
Geomorphic conditio
Date of insp
DS left:
DS right:
US left:
US right:
Average top width
Predominant bed ma
Vegetative c
DS left:
DS right:
US left:
US right:
The channel has a flat to slightly irregular flood plain with steep valley
walls on both sides.
wnstream (DS), upstream (US)
ns at bridge site: do10/18/94
ectionModerate channel bank slope to a narrow terrace
Steep channel bank
Steep channel bank
Moderate channel bank slope to a narrow terrace
Description of the Channel
teri
45.5
Average depthal Bank mater
8
3.1
ftGravel
ftCobbles
ial Straight and stable
Stream type (straight, meandering, braided, swampy, channelized) with semi-alluvial channel boundaries and a narrow flood plain.
10/18/95
over on channel banks near bridge: Date of inspection Brush
Trees
Shrubs and brush
Brush with gravel road on terrace.
Y
? If not, describe location and type of instability and
Do banks appear stabledate of observation.
Site assessment of 10/
Describe any obstructions in channel and date of observation. 18/94 noted a cobble bar through the bridge opening

Hydrology
Drainage area i2
Percentage of dra
Is drainage a
Is there a USGS
Is there a lak
Q
m8.83
inage area in physiographic provinces: (approximate)
Percent o rea
Physiographic province Green Mountaingage on the stream of interest
USGS gage description
USGS gage number
Gage drainage area mi2
Calculated Discharges
100 ft3/s
9
f drainage a100
Rural
rea considered rural or urban? Describe any significant
urbanization:
No
?No
e/pond that will significantly affect hydrology/hydraulics?-
If so, describe
2,000
2,650Q500 ft3/sThe 100- year discharge was taken from the VTAOT
Method used to determine discharges database (VTAOT, written communication, 1995). The 500-year discharge was graphically
extrapolated from flood frequency values found in the VTAOT database for this site.

Description of the Water-Surface Profile Model (WSPRO) Analysis
Datum for WSPRO analysis (USGS survey, sea level, VTAOT plans)
Datum tie between USGS survey and VTAOT plans
Cross-Sections Used in WSPRO Analysis
1 For location of cross-sections see plan-view plot included with Level I field form, Appendix E. For more detail on how cross-sections were developed see WSPRO input file.
10
1Cross-section
Section Reference Distance
(SRD) in feet
2Cross-section development
EXITX -50 1 Ex
FULLV 0 2DoseEX
BRIDG 0 1 Br
RDWAY 16 1 Ro
APPRO 65 2MtioAT
ATEMP 93 1 Avepla
USGS survey
Subtract 56.55 ft. from USGS
survey to obtain VTAOT plans’ datum.
RM1 is a State of
Description of reference marks used to determine USGS datum.Vermont brass tablet on the US end of the right abutment (elev. 999.57 ft, arbitrary survey
datum). RM2 is a chiseled square on top of the DS end of the left abutment (elev. 997.62 ft,
arbitrary survey datum).
Comments
it section
wnstream Full-valley ction (Templated from ITX)
idge section
ad Grade section
odelled Approach sec-n (Templated from EMP)
pproach section as sur-yed (Used as a tem-te)
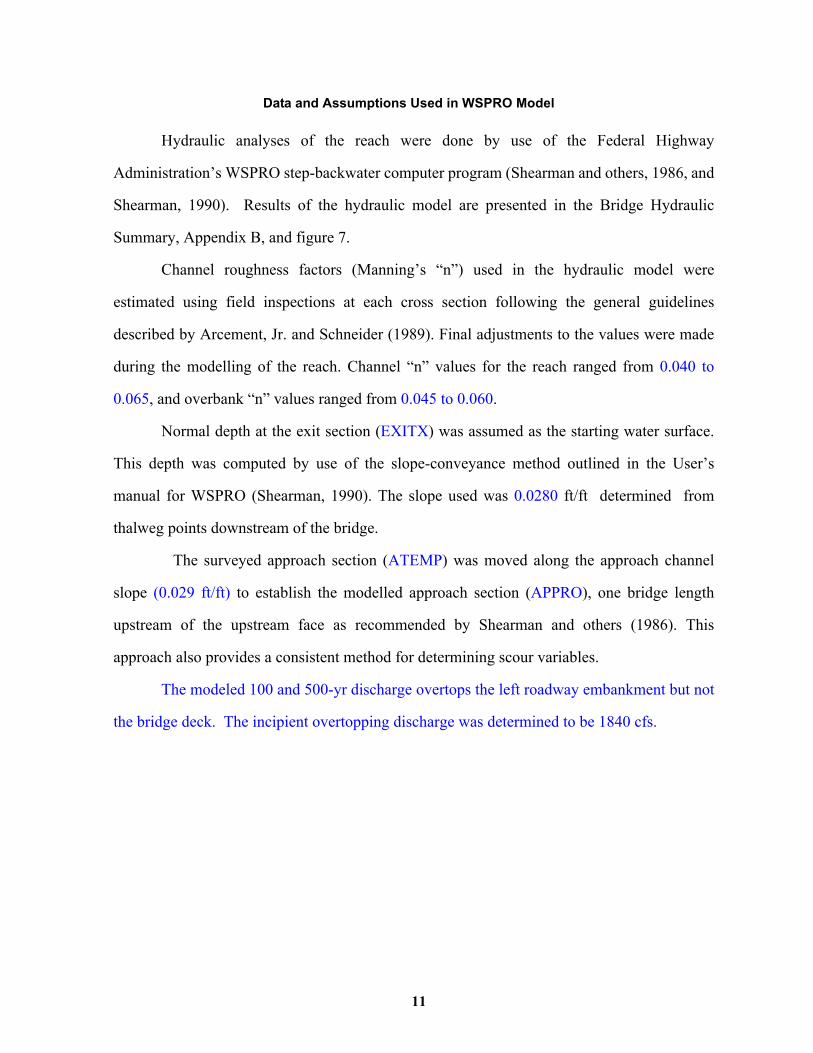
Data and Assumptions Used in WSPRO Model
11
Hydraulic analyses of the reach were done by use of the Federal Highway
Administration’s WSPRO step-backwater computer program (Shearman and others, 1986, and
Shearman, 1990). Results of the hydraulic model are presented in the Bridge Hydraulic
Summary, Appendix B, and figure 7.
Channel roughness factors (Manning’s “n”) used in the hydraulic model were
estimated using field inspections at each cross section following the general guidelines
described by Arcement, Jr. and Schneider (1989). Final adjustments to the values were made
during the modelling of the reach. Channel “n” values for the reach ranged from 0.040 to
0.065, and overbank “n” values ranged from 0.045 to 0.060.
Normal depth at the exit section (EXITX) was assumed as the starting water surface.
This depth was computed by use of the slope-conveyance method outlined in the User’s
manual for WSPRO (Shearman, 1990). The slope used was 0.0280 ft/ft determined from
thalweg points downstream of the bridge.
The surveyed approach section (ATEMP) was moved along the approach channel
slope (0.029 ft/ft) to establish the modelled approach section (APPRO), one bridge length
upstream of the upstream face as recommended by Shearman and others (1986). This
approach also provides a consistent method for determining scour variables.
The modeled 100 and 500-yr discharge overtops the left roadway embankment but not
the bridge deck. The incipient overtopping discharge was determined to be 1840 cfs.
Bridge Hydraulics Summary
Average bridge embankment eleva ftAverage low steel elevation
100-year discharge Water-surface elevati
Road overtopping? _
Area of flow in bridge openAverage velocity in bridge oMaximum WSPRO tube vel Water-surface elevation at AWater-surface elevation at AAmount of backwater cause
500-year discharge Water-surface elevatio
Road overtopping? __
Area of flow in bridge openAverage velocity in bridge oMaximum WSPRO tube vel Water-surface elevation at AWater-surface elevation at AAmount of backwater cause
Incipient overtopping dischWater-surface elevation in b
Area of flow in bridge openAverage velocity in bridge oMaximum WSPRO tube vel Water-surface elevation at AWater-surface elevation at AAmount of backwater cause
998.6
ft
tion996.2
ft3/s
2,00012
ening
ing pening ocity at bridge
pproach section wipproach section wd by bridge
ft3/s ening
ing pening ocity at bridge pproach section wipproach section
d by bridge
arge ridge opening
ing pening ocity at bridge pproach section wipproach sectio
d by bridge
ft996.2
r road ____
on in bridge op
_______ DY
2
th bridge ge
r road __2
th bridge e
3
th bridge dge
____ ft3/s447
ischarge oveft242
6.5
ft/s ft/s8.6/s
ft997.0
ft994.6
ithout brid ft2.42,650
ft996.2
n in bridge op______ DY
______ ft3/s787 ischarge ovef242
t ft7.7 /sft/s10.1
ft997.4
ft995.3
without bridg ft2.1f1,840
t /s ft993.4f152
t2f12.1
t/s ft15.0ft996.0
ft994.4
n without bri ft1.6
Scour Analysis Summary
Special Conditions or Assumptions Made in Scour Analysis
13
Scour depths were computed using the general guidelines described in Hydraulic
Engineering Circular 18 (Richardson and others, 1993). Scour depths were calculated
assuming an infinite depth of erosive material and a homogeneous particle-size distribution.
The results of the scour analysis are presented in tables 1 and 2 and a graph of the scour
depths is presented in figure 8.
Contraction scour was computed by use of the clear-water contraction scour equation
(Richardson and others, 1993, p. 35, equation 18) for the incipient road-overflow discharge.
Contraction scour was computed by use of the Chang pressure-flow scour equation
(Richardson and others, 1995, p. 145-146) for the 100-year and 500-year discharges. For the
100-year and 500-year modelled discharges, there was orifice flow at the bridge.
Contraction scour at bridges with orifice flow is best estimated by use of the Chang pressure-
flow scour equation (oral communication, J.Sterling Jones, October 4, 1996). The results of
Laursen’s clear-water contraction scour equation (Richardson and others, 1993, p. 35,
equation 18) were also computed for the 100-year and 500-year discharges and can be found
in appendix F. For contraction scour computations, the average depth in the contracted
section (AREA/TOPWIDTH) is subtracted from the depth of flow computed by the scour
equation (Y2) to determine the actual amount of scour.
Abutment scour was computed by use of the Froehlich equation (Richardson and
others, 1993, p. 49, equation 24). The Froehlich equation gives “excessively conservative
estimates of scour depths” (Richardson and others, 1993, p. 48). Variables for the Froehlich
equation include the Froude number of the flow approaching the embankments, the length
of the embankment blocking flow, and the depth of flow approaching the embankment less
any roadway overtopping.

Scour Results
Incipient overtopping
Contraction scour: 100-yr discharge 500-yr discharge discharge
(Scour depths in feet)
Main channel
Live-bed scour
Clear-water scour
Depth to armoring
Left overbank
Right overbank
Local scour:
Abutment scour
Left abutment
Right abutment
Pier scour
Pier 1
Pier 2
Pier 3
Abutments:
Left abutment
Right abutment
Piers:
Pier 1
Pier 2
______--
14
______
______
______
Rock Riprap Sizin
100-yr discharge
_
______
______--
______
______
______
g
500-yr discharg
et)
______
______
______--
______ 0 0
______ 2.0
______0.4
1.3
34.7 ______--
______--
______--
______--
______--
______11.1
______12.5
7.6o
e
6.1
______ 7.2
______ 6.0 ______--______
--
-- --______--
______-- ______--______--
______-- ______0.9______
Incipient vertopping
discharge
1.2
(D50 in fe1.9
0.9______ 1.2
1.9______--
______ --
______ --
______--
--
-- -- _____--
______--
____________

15
Figure 7. Water-surface profiles for the 100- and 500-yr discharges at structure BETHTH00070038 on town highway 7, crossing Gilead Brook, Bethel, Vermont.
-60 70-60 -50 -40 -30 -20 -10 0 10 20 30 40 50 60984
1,001
984
985
986
987
988
989
990
991
992
993
994
995
996
997
998
999
1,000
BRIDGE DECK 500-YR WATER SURFACE PROFILE
100-YR WATER SURFACE PROFILE
APPROACH SECTION (APPRO)
MINIMUM BED ELEVATION
EXIT SECTION (EXITX) BRIDGE SECTION (BRIDG)
CHANNEL DISTANCE FROM DOWNSTREAM TO UPSTREAM, IN FEET
EL
EV
AT
ION
AB
OV
E A
RB
ITR
AR
Y D
AT
UM
, IN
FE
ET

16
Figure 8. Scour elevations for the 100-yr and 500-yr discharges at structure BETHTH00070038 on town highway 7, crossing Gilead Brook, Bethel, Vermont.
2 4 6 8 10 12 14 16 18 20 22 24 26 28 30 32 34 36
1,000
ANG
LE O
F R
EPO
SE E
XAG
GER
ATED
100-YEAR WATER SURFACE
500-YEAR WATER SURFACE
100-YR SCOUR DEPTHS
500-YR SCOUR DEPTHS
LOW STEEL
HIGH STEELE
LEV
AT
ION
AB
OV
E A
RB
ITR
AR
Y D
AT
UM
, IN
FE
ET
STATIONING FROM LEFT TO RIGHT ALONG BRIDGE FACE SECTION, IN FEET
0972972
974
976
978
980
982
984
986
988
990
992
994
996
998
17
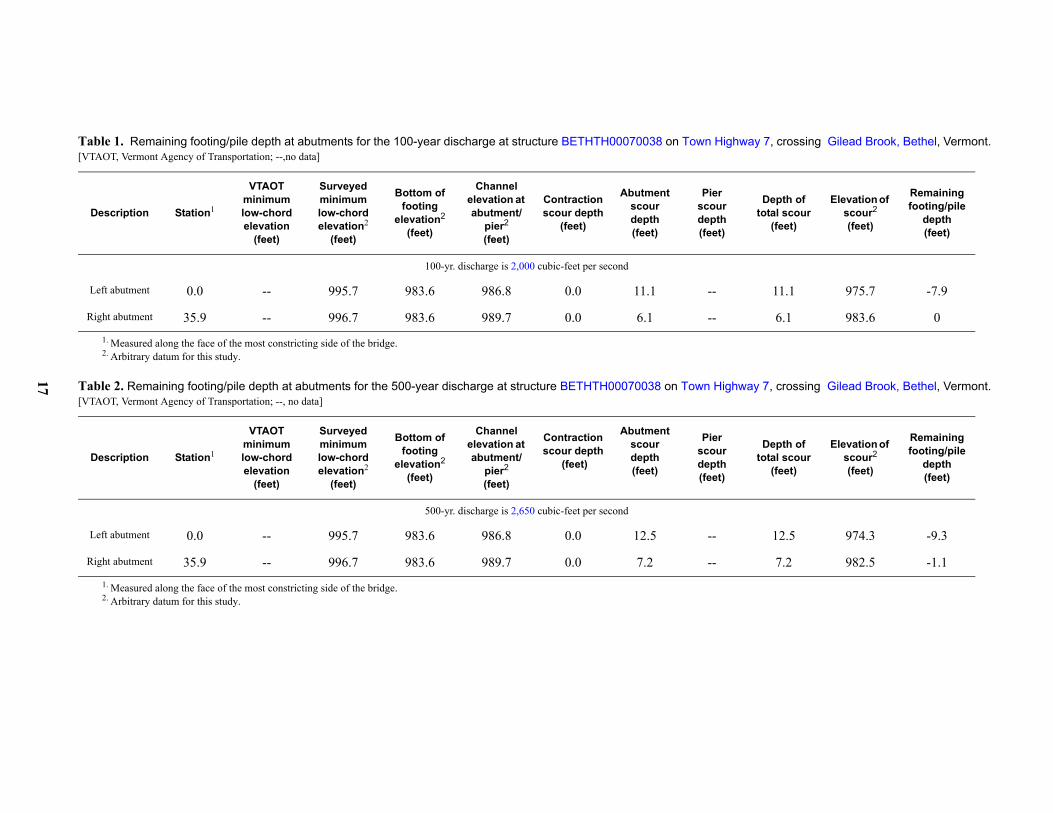
Table 1. Remaining footing/pile depth at abutments for the 100-year discharge at structure BETHTH00070038 on Town Highway 7, crossing Gilead Brook, Bethel, Vermont.[VTAOT, Vermont Agency of Transportation; --,no data]
Description Station1
1. Measured along the face of the most constricting side of the bridge.
VTAOT minimum low-chord elevation
(feet)
Surveyed minimum low-chord elevation2
(feet)
2. Arbitrary datum for this study.
Bottom of footing
elevation2
(feet)
Channel elevation at abutment/
pier2
(feet)
Contraction scour depth
(feet)
Abutment scour depth (feet)
Pier scour depth (feet)
Depth of total scour
(feet)
Elevation of scour2
(feet)
Remaining footing/pile
depth(feet)
100-yr. discharge is 2,000 cubic-feet per second
Left abutment 0.0 -- 995.7 983.6 986.8 0.0 11.1 -- 11.1 975.7 -7.9
Right abutment 35.9 -- 996.7 983.6 989.7 0.0 6.1 -- 6.1 983.6 0
Table 2. Remaining footing/pile depth at abutments for the 500-year discharge at structure BETHTH00070038 on Town Highway 7, crossing Gilead Brook, Bethel, Vermont.[VTAOT, Vermont Agency of Transportation; --, no data]
Description Station1
1. Measured along the face of the most constricting side of the bridge.
VTAOT minimum low-chord elevation
(feet)
Surveyed minimum low-chord elevation2
(feet)
2. Arbitrary datum for this study.
Bottom of footing
elevation2
(feet)
Channel elevation at abutment/
pier2
(feet)
Contraction scour depth
(feet)
Abutment scour depth (feet)
Pier scour depth (feet)
Depth of total scour
(feet)
Elevation of scour2
(feet)
Remaining footing/pile
depth(feet)
500-yr. discharge is 2,650 cubic-feet per second
Left abutment 0.0 -- 995.7 983.6 986.8 0.0 12.5 -- 12.5 974.3 -9.3
Right abutment 35.9 -- 996.7 983.6 989.7 0.0 7.2 -- 7.2 982.5 -1.1

18
SELECTED REFERENCES
Arcement, G.J., Jr., and Schneider, V.R., 1989, Guide for selecting Manning’s roughness coefficients for natural channels and flood plains: U.S. Geological Survey Water-Supply Paper 2339, 38 p.
Barnes, H.H., Jr., 1967, Roughness characteristics of natural channels: U.S. Geological Survey Water-Supply Paper 1849, 213 p.
Brown, S.A. and Clyde, E.S., 1989, Design of riprap revetment: Federal Highway Administration Hydraulic Engineering Circular No. 11, Publication FHWA-IP-89-016, 156 p.
Federal Highway Administration, 1983, Runoff estimates for small watersheds and development of sound design: Federal Highway Administration Report FHWA-RD-77-158
Froehlich, D.C., 1989, Local scour at bridge abutments in Ports, M.A., ed., Hydraulic Engineering--Proceedings of the 1989 National Conference on Hydraulic Engineering: New York, American Society of Civil Engineers, p. 13-18.
Hayes, D.C.,1993, Site selection and collection of bridge-scour data in Delaware, Maryland, and Virginia: U.S. Geological Survey Water-Resources Investigation Report 93-4017, 23 p.
Interagency Advisory Committee on Water Data, 1982, Guidelines for determining flood flow frequency: U.S. Geological Survey, Bulletin 17B of the Hydrology Subcommittee, 190 p.
Johnson, C.G. and Tasker, G.D.,1974, Progress report on flood magnitude and frequency of Vermont streams: U.S. Geological Survey Open-File Report 74-130, 37 p.
Laursen, E.M., 1960, Scour at bridge crossings: Journal of the Hydraulics Division, American Society of Civil Engineers, v. 86, no. HY2, p. 39-53.
Potter, W. D., 1957a, Peak rates of runoff in the Adirondack, White Mountains, and Maine woods area, Bureau of Public Roads
Potter, W. D., 1957b, Peak rates of runoff in the New England Hill and Lowland area, Bureau of Public Roads
Richardson, E.V., and Davis, S.R., 1995, Evaluating scour at bridges: Federal Highway Administration Hydraulic Engineering Circular No. 18, Publication FHWA-IP-90-017, 204 p.
Richardson, E.V., Harrison, L.J., Richardson, J.R., and Davis, S.R., 1993, Evaluating scour at bridges: Federal Highway Administration Hydraulic Engineering Circular No. 18, Publication FHWA-IP-90-017, 131 p.
Richardson, E.V., Simons, D.B., and Julien, P.Y., 1990, Highways in the river environment: Federal Highway Administration Publication FHWA-HI-90-016.
Ritter, D.F., 1984, Process Geomorphology: W.C. Brown Co., Debuque, Iowa, 603 p.
Shearman, J.O., 1990, User’s manual for WSPRO--a computer model for water surface profile computations: Federal Highway Administration Publication FHWA-IP-89-027, 187 p.
Shearman, J.O., Kirby, W.H., Schneider, V.R., and Flippo, H.N., 1986, Bridge waterways analysis model; research report: Federal Highway Administration Publication FHWA-RD-86-108, 112 p.
Talbot, A.N., 1887, The determination of water-way for bridges and culverts.
U.S. Department of Transportation, 1993, Stream stability and scour at highway bridges, Participant Workbook: Federal Highway Administration Publication FHWA HI-91-011.
U.S. Geological Survey, 1981, Randolph, Vermont 7.5 Minute Series quadrangle map: U.S. Geological Survey Topographic Maps, Scale 1:24,000.

19
APPENDIX A:
WSPRO INPUT FILE

20
T1 U.S. Geological Survey WSPRO Input File beth038.wsp
T2 Hydraulic analysis for structure BETHTH00070038 Date: 30-JAN-96
T3 Hydraulic analysis for Bethel bridge 38 over Gilead Brook by MAI
Q 2000.0, 2650.0 1840.0
SK 0.0280, 0.0280 0.0280
*
J3 6 29 30 552 553 551 5 16 17 13 3 * 15 14 23 21 11 12 4 7 3
*
XS EXITX -50
GR -38.8, 994.88 -21.4, 995.63 -9.6, 995.18 -5.1, 991.95
GR -0.5, 989.65 0.0, 987.60 11.6, 986.89 18.3, 987.02
GR 22.9, 987.63 31.5, 988.77 38.8, 988.33 48.7, 990.95
GR 57.4, 991.77 62.0, 997.97 65.9,1000.37 86.1,1014.77
*
N 0.045 0.065 0.060
SA -5.1 57.4
*
XS FULLV 0 * * * 0.0127
*
* SRD LSEL XSSKEW
BR BRIDG 0 996.2 23.0
GR 0.0, 995.73 0.0, 988.21 0.1, 986.80 0.4, 986.76
GR 4.6, 987.06 8.1, 987.70 11.6, 988.25 14.4, 988.81
GR 20.6, 989.60 35.8, 989.68 35.9, 996.72 0.0, 995.73
*
* BRTYPE BRWDTH WWANGL WWWID
CD 1 41.7 * * 44.3 9.7
N 0.040
*
*
* SRD EMBWID IPAVE
XR RDWAY 16 26.0 2
GR -165.2, 998.04 -112.9, 995.64 -93.2, 995.56 -63.0, 996.23
GR -19.4, 997.87 0.0, 998.11 36.4, 999.02 61.0, 999.54
GR 80.4, 999.87 130.7, 999.73 187.4, 999.39 229.0, 999.72
GR 270.4,1000.98 320.4,1002.86
*
* EXPECTED SRD = 62 AT ONE BR. LENGTH BUT COMPUTED SRD = 93
*
XT ATEMP 93
GR -29.3,1013.48 -5.5, 994.76 -1.4, 993.19 0.0, 990.48
GR 2.7, 989.84 2.9, 989.66 5.1, 989.05 8.4, 989.44
GR 13.2, 989.19 17.6, 989.19 22.4, 988.79 26.4, 989.53
GR 26.8, 989.73 27.7, 989.99 31.3, 992.86 32.8, 995.41
GR 50.2, 997.23 56.4, 999.65 65.3, 999.95
*
AS APPRO 65
GT -0.81
N 0.065 0.055
SA 28.4
*
HP 1 BRIDG 996.20 1 996.20
HP 2 BRIDG 996.20 * * 1576
HP 2 RDWAY 997.04 * * 445
HP 1 APPRO 997.04 1 997.04
HP 2 APPRO 997.04 * * 2000
*
HP 1 BRIDG 996.20 1 996.20
HP 2 BRIDG 996.20 * * 1855
HP 2 RDWAY 997.36 * * 787
HP 1 APPRO 997.36 1 997.36
HP 2 APPRO 997.36 * * 2650
WSPRO INPUT FILE

21
APPENDIX B:
WSPRO OUTPUT FILE

WSPRO OUTPUT FILE
U.S. Geological Survey WSPRO Input File beth038.wsp Hydraulic analysis for structure BETHTH00070038 Date: 30-JAN-96 Hydraulic analysis for Bethel bridge 38 over Gilead Brook by MAI *** RUN DATE & TIME: 02-06-96 11:55 CROSS-SECTION PROPERTIES: ISEQ = 3; SECID = BRIDG; SRD = 0.
WSEL SA# AREA K TOPW WETP ALPH LEW REW QCR 1 242 21867 17 64 5138 996.20 242 21867 17 64 1.00 0 36 5138
VELOCITY DISTRIBUTION: ISEQ = 3; SECID = BRIDG; SRD = 0.
WSEL LEW REW AREA K Q VEL 996.20 0.0 35.9 242.3 21867. 1576. 6.50
X STA. 0.0 2.7 4.5 6.1 7.8 9.4 A(I) 22.2 14.3 13.4 12.5 12.4 V(I) 3.55 5.50 5.90 6.31 6.36
X STA. 9.4 11.1 12.8 14.7 16.7 18.3 A(I) 12.2 12.6 12.8 13.3 10.0 V(I) 6.45 6.24 6.17 5.94 7.85
X STA. 18.3 19.8 21.3 22.8 24.3 25.9 A(I) 9.5 9.2 9.3 9.2 9.4 V(I) 8.31 8.52 8.47 8.55 8.39
X STA. 25.9 27.5 29.1 30.8 32.7 35.9 A(I) 9.6 9.7 10.3 11.6 18.8 V(I) 8.22 8.12 7.62 6.81 4.20
VELOCITY DISTRIBUTION: ISEQ = 4; SECID = RDWAY; SRD = 16.
WSEL LEW REW AREA K Q VEL 997.04 -143.4 -41.5 93.0 2897. 445. 4.78
X STA. -143.4 -124.7 -119.4 -115.4 -112.3 -109.4 A(I) 8.1 5.2 4.7 4.2 4.0 V(I) 2.76 4.27 4.72 5.26 5.52
X STA. -109.4 -106.7 -104.1 -101.5 -98.9 -96.4 A(I) 3.8 3.8 3.7 3.8 3.7 V(I) 5.80 5.83 5.98 5.92 6.06
X STA. -96.4 -93.8 -91.2 -88.5 -85.6 -82.3 A(I) 3.8 3.8 3.8 4.0 4.2 V(I) 5.87 5.90 5.86 5.61 5.28
X STA. -82.3 -78.6 -74.4 -69.3 -62.7 -41.5 A(I) 4.4 4.7 5.1 5.8 8.5 V(I) 5.05 4.76 4.36 3.86 2.62
CROSS-SECTION PROPERTIES: ISEQ = 5; SECID = APPRO; SRD = 65. WSEL SA# AREA K TOPW WETP ALPH LEW REW QCR 1 272 21850 38 41 4139 2 51 2138 23 26 421 997.04 323 23988 61 67 1.09 -8 52 4021 VELOCITY DISTRIBUTION: ISEQ = 5; SECID = APPRO; SRD = 65. WSEL LEW REW AREA K Q VEL 997.04 -9.4 51.8 322.5 23988. 2000. 6.20 X STA. -9.4 0.1 2.6 4.6 6.4 8.1 A(I) 31.4 19.2 16.7 15.6 14.5 V(I) 3.19 5.22 5.98 6.41 6.89
X STA. 8.1 9.8 11.4 13.0 14.5 16.1 A(I) 14.2 14.0 13.7 13.2 13.2 V(I) 7.05 7.13 7.28 7.59 7.59
X STA. 16.1 17.6 19.0 20.5 21.9 23.2 A(I) 13.0 12.7 12.8 12.6 12.4 V(I) 7.69 7.89 7.84 7.94 8.08
X STA. 23.2 24.7 26.2 28.0 31.0 51.8 A(I) 12.7 12.8 14.2 19.5 34.2 V(I) 7.87 7.83 7.04 5.12 2.92
22

WSPRO OUTPUT FILE (continued)
CROSS-SECTION PROPERTIES: ISEQ = 3; SECID = BRIDG; SRD = 0.
WSEL SA# AREA K TOPW WETP ALPH LEW REW QCR 1 242 21867 17 64 5138 996.20 242 21867 17 64 1.00 0 36 5138
VELOCITY DISTRIBUTION: ISEQ = 3; SECID = BRIDG; SRD = 0.
WSEL LEW REW AREA K Q VEL 996.20 0.0 35.9 242.3 21867. 1855. 7.66
X STA. 0.0 2.7 4.5 6.1 7.8 9.4 A(I) 22.2 14.3 13.4 12.5 12.4 V(I) 4.17 6.47 6.95 7.42 7.49
X STA. 9.4 11.1 12.8 14.7 16.7 18.3 A(I) 12.2 12.6 12.8 13.3 10.0 V(I) 7.60 7.34 7.26 6.99 9.23
X STA. 18.3 19.8 21.3 22.8 24.3 25.9 A(I) 9.5 9.2 9.3 9.2 9.4 V(I) 9.78 10.03 9.97 10.06 9.88
X STA. 25.9 27.5 29.1 30.8 32.7 35.9 A(I) 9.6 9.7 10.3 11.6 18.8 V(I) 9.68 9.56 8.97 8.02 4.94
VELOCITY DISTRIBUTION: ISEQ = 4; SECID = RDWAY; SRD = 16.
WSEL LEW REW AREA K Q VEL 997.36 -150.4 -33.0 128.1 4494. 784. 6.12
X STA. -150.4 -128.2 -121.9 -117.4 -113.7 -110.5 A(I) 11.3 7.4 6.3 5.9 5.5 V(I) 3.47 5.33 6.20 6.60 7.09
X STA. -110.5 -107.4 -104.4 -101.5 -98.7 -95.8 A(I) 5.3 5.2 5.1 5.1 5.1 V(I) 7.43 7.48 7.68 7.72 7.67
X STA. -95.8 -93.0 -90.0 -86.9 -83.5 -79.8 A(I) 5.1 5.2 5.3 5.4 5.8 V(I) 7.69 7.59 7.39 7.21 6.77
X STA. -79.8 -75.6 -71.0 -65.4 -58.0 -33.0 A(I) 6.1 6.3 7.0 7.9 11.8 V(I) 6.44 6.20 5.64 4.94 3.32
CROSS-SECTION PROPERTIES: ISEQ = 5; SECID = APPRO; SRD = 65.
WSEL SA# AREA K TOPW WETP ALPH LEW REW QCR 1 284 23310 38 42 4396 2 58 2642 24 27 511 997.36 342 25952 62 69 1.09 -9 53 4360
VELOCITY DISTRIBUTION: ISEQ = 5; SECID = APPRO; SRD = 65.
WSEL LEW REW AREA K Q VEL 997.36 -9.8 52.6 342.3 25952. 2650. 7.74
X STA. -9.8 -0.1 2.5 4.6 6.4 8.1 A(I) 32.9 20.3 18.1 16.4 15.3 V(I) 4.02 6.54 7.31 8.06 8.66
X STA. 8.1 9.8 11.5 13.1 14.7 16.2 A(I) 15.0 15.0 14.1 14.2 13.8 V(I) 8.86 8.83 9.41 9.33 9.62
X STA. 16.2 17.7 19.2 20.7 22.1 23.5 A(I) 13.8 13.5 13.6 13.1 13.3 V(I) 9.61 9.83 9.77 10.12 9.94
X STA. 23.5 25.0 26.6 28.5 32.4 52.6 A(I) 13.4 13.9 15.2 22.9 34.5 V(I) 9.90 9.55 8.70 5.78 3.84
23

WSPRO OUTPUT FILE (continued)
CROSS-SECTION PROPERTIES: ISEQ = 3; SECID = BRIDG; SRD = 0.
WSEL SA# AREA K TOPW WETP ALPH LEW REW QCR 1 152 13055 33 43 1849 993.35 152 13055 33 43 1.00 0 36 1849
VELOCITY DISTRIBUTION: ISEQ = 3; SECID = BRIDG; SRD = 0.
WSEL LEW REW AREA K Q VEL 993.35 0.0 35.9 151.9 13055. 1840. 12.12
X STA. 0.0 2.3 3.6 4.8 5.9 7.0 A(I) 13.5 7.7 7.0 6.5 6.1 V(I) 6.81 11.89 13.22 14.09 15.04
X STA. 7.0 8.2 9.4 10.7 12.0 13.4 A(I) 6.2 6.2 6.2 6.3 6.4 V(I) 14.80 14.72 14.95 14.59 14.44
X STA. 13.4 15.0 16.8 18.6 20.7 22.9 A(I) 6.8 6.8 7.0 7.3 7.6 V(I) 13.61 13.47 13.06 12.53 12.07
X STA. 22.9 25.1 27.3 29.7 32.2 35.9 A(I) 7.5 7.8 8.0 8.5 12.4 V(I) 12.30 11.78 11.48 10.87 7.44
CROSS-SECTION PROPERTIES: ISEQ = 5; SECID = APPRO; SRD = 65.
WSEL SA# AREA K TOPW WETP ALPH LEW REW QCR 1 232 17195 36 40 3311 2 27 922 17 20 195 995.95 259 18117 54 59 1.08 -7 46 3101
VELOCITY DISTRIBUTION: ISEQ = 5; SECID = APPRO; SRD = 65.
WSEL LEW REW AREA K Q VEL 995.95 -8.0 45.7 258.8 18117. 1840. 7.11
X STA. -8.0 0.7 3.0 4.9 6.5 8.2 A(I) 25.1 15.8 13.9 12.5 12.2 V(I) 3.66 5.83 6.62 7.34 7.52
X STA. 8.2 9.8 11.3 12.8 14.2 15.7 A(I) 11.6 11.3 11.3 10.9 10.9 V(I) 7.91 8.11 8.11 8.43 8.43
X STA. 15.7 17.1 18.5 19.8 21.2 22.5 A(I) 10.6 10.6 10.5 10.4 10.3 V(I) 8.70 8.68 8.76 8.87 8.95
X STA. 22.5 23.8 25.2 26.7 28.5 45.7 A(I) 10.1 10.7 11.0 12.1 26.9 V(I) 9.07 8.61 8.38 7.61 3.42
24

WSPRO OUTPUT FILE (continued)
XSID:CODE SRDL LEW AREA VHD HF EGL CRWS Q WSEL SRD FLEN REW K ALPH HO ERR FR# VEL
EXITX:XS ****** -5 227 1.21 ***** 993.57 991.89 2000 992.36 -49 ****** 58 11948 1.00 ***** ******* 0.82 8.81
FULLV:FV 50 -6 277 0.82 1.01 994.58 ******* 2000 993.77 0 50 58 16505 1.01 0.00 0.00 0.62 7.22 <<<<<THE ABOVE RESULTS REFLECT “NORMAL” (UNCONSTRICTED) FLOW>>>>>
===125 FR# EXCEEDS FNTEST AT SECID “APPRO”: TRIALS CONTINUED. FNTEST,FR#,WSEL,CRWS = 0.80 0.81 994.59 993.88
===110 WSEL NOT FOUND AT SECID “APPRO”: REDUCED DELTAY. WSLIM1,WSLIM2,DELTAY = 993.27 1012.67 0.50
===115 WSEL NOT FOUND AT SECID “APPRO”: USED WSMIN = CRWS. WSLIM1,WSLIM2,CRWS = 993.27 1012.67 993.88
APPRO:AS 65 -5 196 1.66 1.25 996.25 993.88 2000 994.59 65 65 33 12617 1.02 0.42 0.00 0.81 10.21 <<<<<THE ABOVE RESULTS REFLECT “NORMAL” (UNCONSTRICTED) FLOW>>>>>
===215 FLOW CLASS 1 SOLUTION INDICATES POSSIBLE ROAD OVERFLOW. WS1,WSSD,WS3,RGMIN = 996.32 0.00 993.60 995.56
===260 ATTEMPTING FLOW CLASS 4 SOLUTION.
===240 NO DISCHARGE BALANCE IN 15 ITERATIONS. WS,QBO,QRD = 998.93 0. 2000.
===280 REJECTED FLOW CLASS 4 SOLUTION.
===245 ATTEMPTING FLOW CLASS 2 (5) SOLUTION.
<<<<<RESULTS REFLECTING THE CONSTRICTED FLOW FOLLOW>>>>>
XSID:CODE SRDL LEW AREA VHD HF EGL CRWS Q WSEL SRD FLEN REW K ALPH HO ERR FR# VEL
BRIDG:BR 50 0 242 0.66 ***** 996.86 992.90 1576 996.20 0 ****** 36 21867 1.00 ***** ******* 0.44 6.51
TYPE PPCD FLOW C P/A LSEL BLEN XLAB XRAB 1. **** 5. 0.373 0.000 996.20 ****** ****** ******
XSID:CODE SRD FLEN HF VHD EGL ERR Q WSEL RDWAY:RG 16. 39. 0.27 0.65 997.42 0.01 447. 997.04
Q WLEN LEW REW DMAX DAVG VMAX VAVG HAVG CAVG LT: 447. 102. -143. -42. 1.5 0.9 5.1 4.8 1.3 3.0 RT: 0. 130. 14. 220. 1.2 0.3 4.7 11.4 1.1 2.9
XSID:CODE SRDL LEW AREA VHD HF EGL CRWS Q WSEL SRD FLEN REW K ALPH HO ERR FR# VEL
APPRO:AS 23 -8 322 0.65 0.14 997.69 993.88 2000 997.04 65 23 52 23966 1.09 0.00 0.01 0.50 6.21
FIRST USER DEFINED TABLE.
XSID:CODE SRD LEW REW Q K AREA VEL WSEL EXITX:XS -50. -6. 58. 2000. 11948. 227. 8.81 992.36 FULLV:FV 0. -7. 58. 2000. 16505. 277. 7.22 993.77 BRIDG:BR 0. 0. 36. 1576. 21867. 242. 6.51 996.20 RDWAY:RG 16.******* 447. 447.********* 0. 2.00 997.04 APPRO:AS 65. -9. 52. 2000. 23966. 322. 6.21 997.04
SECOND USER DEFINED TABLE.
XSID:CODE CRWS FR# YMIN YMAX HF HO VHD EGL WSEL EXITX:XS 991.89 0.82 986.89 1014.77************ 1.21 993.57 992.36 FULLV:FV ******** 0.62 987.53 1015.41 1.01 0.00 0.82 994.58 993.77 BRIDG:BR 992.90 0.44 986.76 996.72************ 0.66 996.86 996.20 RDWAY:RG **************** 995.56 1002.86 0.27****** 0.65 997.42 997.04 APPRO:AS 993.88 0.50 987.98 1012.67 0.14 0.00 0.65 997.69 997.04
25

WSPRO OUTPUT FILE (continued)
XSID:CODE SRDL LEW AREA VHD HF EGL CRWS Q WSEL SRD FLEN REW K ALPH HO ERR FR# VEL
EXITX:XS ****** -6 270 1.51 ***** 994.53 992.56 2650 993.02 -49 ****** 58 15833 1.01 ***** ******* 0.85 9.82
FULLV:FV 50 -7 327 1.04 1.03 995.56 ******* 2650 994.52 0 50 59 21570 1.01 0.00 0.00 0.65 8.11 <<<<<THE ABOVE RESULTS REFLECT “NORMAL” (UNCONSTRICTED) FLOW>>>>>
===125 FR# EXCEEDS FNTEST AT SECID “APPRO”: TRIALS CONTINUED. FNTEST,FR#,WSEL,CRWS = 0.80 0.97 995.30 994.62
===110 WSEL NOT FOUND AT SECID “APPRO”: REDUCED DELTAY. WSLIM1,WSLIM2,DELTAY = 994.02 1012.67 0.50
===115 WSEL NOT FOUND AT SECID “APPRO”: USED WSMIN = CRWS. WSLIM1,WSLIM2,CRWS = 994.02 1012.67 994.62
APPRO:AS 65 -6 226 2.26 1.39 997.56 994.62 2650 995.30 65 65 39 15252 1.06 0.61 0.00 0.97 11.72 <<<<<THE ABOVE RESULTS REFLECT “NORMAL” (UNCONSTRICTED) FLOW>>>>>
===215 FLOW CLASS 1 SOLUTION INDICATES POSSIBLE ROAD OVERFLOW. WS1,WSSD,WS3,RGMIN = 997.80 0.00 994.59 995.56
===260 ATTEMPTING FLOW CLASS 4 SOLUTION.
===240 NO DISCHARGE BALANCE IN 15 ITERATIONS. WS,QBO,QRD = 999.27 0. 2650.
===280 REJECTED FLOW CLASS 4 SOLUTION.
===245 ATTEMPTING FLOW CLASS 2 (5) SOLUTION.
<<<<<RESULTS REFLECTING THE CONSTRICTED FLOW FOLLOW>>>>>
XSID:CODE SRDL LEW AREA VHD HF EGL CRWS Q WSEL SRD FLEN REW K ALPH HO ERR FR# VEL
BRIDG:BR 50 0 242 0.91 ***** 997.11 993.37 1858 996.20 0 ****** 36 21867 1.00 ***** ******* 0.52 7.67
TYPE PPCD FLOW C P/A LSEL BLEN XLAB XRAB 1. **** 5. 0.414 0.000 996.20 ****** ****** ******
XSID:CODE SRD FLEN HF VHD EGL ERR Q WSEL RDWAY:RG 16. 39. 0.41 1.01 997.97 0.00 787. 997.36
Q WLEN LEW REW DMAX DAVG VMAX VAVG HAVG CAVG LT: 787. 117. -150. -33. 1.8 1.1 5.9 6.2 1.7 3.0 RT: 0. 164. 15. 230. 1.3 0.3 4.7 11.3 1.2 2.9
XSID:CODE SRDL LEW AREA VHD HF EGL CRWS Q WSEL SRD FLEN REW K ALPH HO ERR FR# VEL
APPRO:AS 23 -9 342 1.01 0.21 998.37 994.62 2650 997.36 65 24 53 25940 1.09 0.00 0.00 0.61 7.74
FIRST USER DEFINED TABLE.
XSID:CODE SRD LEW REW Q K AREA VEL WSEL EXITX:XS -50. -7. 58. 2650. 15833. 270. 9.82 993.02 FULLV:FV 0. -8. 59. 2650. 21570. 327. 8.11 994.52 BRIDG:BR 0. 0. 36. 1858. 21867. 242. 7.67 996.20 RDWAY:RG 16.******* 787. 787.********* 0. 2.00 997.36 APPRO:AS 65. -10. 53. 2650. 25940. 342. 7.74 997.36
SECOND USER DEFINED TABLE.
XSID:CODE CRWS FR# YMIN YMAX HF HO VHD EGL WSEL EXITX:XS 992.56 0.85 986.89 1014.77************ 1.51 994.53 993.02 FULLV:FV ******** 0.65 987.53 1015.41 1.03 0.00 1.04 995.56 994.52 BRIDG:BR 993.37 0.52 986.76 996.72************ 0.91 997.11 996.20 RDWAY:RG **************** 995.56 1002.86 0.41****** 1.01 997.97 997.36 APPRO:AS 994.62 0.61 987.98 1012.67 0.21 0.00 1.01 998.37 997.36
26

WSPRO OUTPUT FILE (continued)
XSID:CODE SRDL LEW AREA VHD HF EGL CRWS Q WSEL SRD FLEN REW K ALPH HO ERR FR# VEL
EXITX:XS ****** -4 216 1.13 ***** 993.31 991.70 1840 992.18 -49 ****** 58 10992 1.00 ***** ******* 0.81 8.52
FULLV:FV 50 -5 264 0.76 1.01 994.33 ******* 1840 993.57 0 50 58 15259 1.01 0.00 0.00 0.61 6.98 <<<<<THE ABOVE RESULTS REFLECT “NORMAL” (UNCONSTRICTED) FLOW>>>>>
APPRO:AS 65 -5 188 1.52 1.21 995.92 ******* 1840 994.40 65 65 33 11901 1.02 0.38 0.00 0.79 9.77 <<<<<THE ABOVE RESULTS REFLECT “NORMAL” (UNCONSTRICTED) FLOW>>>>>
===215 FLOW CLASS 1 SOLUTION INDICATES POSSIBLE ROAD OVERFLOW. WS1,WSSD,WS3,RGMIN = 995.95 0.00 993.35 995.56
===260 ATTEMPTING FLOW CLASS 4 SOLUTION.
===240 NO DISCHARGE BALANCE IN 15 ITERATIONS. WS,QBO,QRD = 998.84 0. 1840.
===280 REJECTED FLOW CLASS 4 SOLUTION.
===245 ATTEMPTING FLOW CLASS 2 (5) SOLUTION.
===250 INSUFFICIENT HEAD FOR PRESSURE FLOW. YU/Z,WSIU,WS = 1.09 996.81 996.94
===270 REJECTED FLOW CLASS 2 (5) SOLUTION.
<<<<<RESULTS REFLECTING THE CONSTRICTED FLOW FOLLOW>>>>>
XSID:CODE SRDL LEW AREA VHD HF EGL CRWS Q WSEL SRD FLEN REW K ALPH HO ERR FR# VEL
BRIDG:BR 50 0 152 2.29 1.18 995.63 986.96 1840 993.35 0 50 36 13040 1.00 0.20 0.00 1.00 12.12
TYPE PPCD FLOW C P/A LSEL BLEN XLAB XRAB 1. **** 1. 1.000 ****** 996.20 ****** ****** ******
XSID:CODE SRD FLEN HF VHD EGL ERR Q WSEL RDWAY:RG 16. <<<<<EMBANKMENT IS NOT OVERTOPPED>>>>>
XSID:CODE SRDL LEW AREA VHD HF EGL CRWS Q WSEL SRD FLEN REW K ALPH HO ERR FR# VEL
APPRO:AS 23 -7 259 0.85 0.34 996.80 993.61 1840 995.95 65 24 46 18118 1.08 0.83 0.00 0.59 7.11
M(G) M(K) KQ XLKQ XRKQ OTEL 0.075 0.003 18044. 2. 38. 995.55
FIRST USER DEFINED TABLE.
XSID:CODE SRD LEW REW Q K AREA VEL WSEL EXITX:XS -50. -5. 58. 1840. 10992. 216. 8.52 992.18 FULLV:FV 0. -6. 58. 1840. 15259. 264. 6.98 993.57 BRIDG:BR 0. 0. 36. 1840. 13040. 152. 12.12 993.35 RDWAY:RG 16.************** 0.********* 0. 2.00******** APPRO:AS 65. -8. 46. 1840. 18118. 259. 7.11 995.95
XSID:CODE XLKQ XRKQ KQ APPRO:AS 2. 38. 18044.
SECOND USER DEFINED TABLE.
XSID:CODE CRWS FR# YMIN YMAX HF HO VHD EGL WSEL EXITX:XS 991.70 0.81 986.89 1014.77************ 1.13 993.31 992.18 FULLV:FV ******** 0.61 987.53 1015.41 1.01 0.00 0.76 994.33 993.57 BRIDG:BR 986.96 1.00 986.76 996.72 1.18 0.20 2.29 995.63 993.35 RDWAY:RG **************** 995.56 1002.86************ 0.57 997.27******** APPRO:AS 993.61 0.59 987.98 1012.67 0.34 0.83 0.85 996.80 995.95
27

28
APPENDIX C:
BED-MATERIAL PARTICAL-SIZE DISTRIBUTION

29
App
endi
x C
. Bed
mat
eria
l par
ticl
e-si
ze d
istr
ibut
ions
for
thre
e pe
bble
cou
nt tr
anse
cts
at th
e ap
proa
ch c
ross
-sec
tion
for
stru
ctur
e B
ET
HT
H00
0700
38, i
n B
ethe
l, V
erm
ont.
SIZ
E (
MM
)
CUMULATIVE PERCENT FINER
0
100 0102030405060708090
110
,000
25
1020
5010
020
050
01,
000
2,00
05,
000

30
APPENDIX D:
HISTORICAL DATA FORM