local scour around bridge abutments … · local scour around bridge abutments under ice covered...
TRANSCRIPT
LOCAL SCOUR AROUND BRIDGE ABUTMENTS UNDER ICE COVERED
CONDITIONS
By
Peng Wu
Bsc, Hefei University of Technology, China, 2007
Msc, Hefei University of Technology, China, 2010
DISSERTATION SUBMITTED IN PARTIAL FULFILLMENT OF
THE REQUIREMENTS FOR THE DEGREE OF
DOCTOR OF PHILOSOPHY
IN
NATURAL RESOURCES AND ENVIRONMENTAL STUDIES
UNIVERSITY OF NORTHERN BRITISH COLUMBIA
October 10, 2014
© PENG WU, 2014

i
ABSTRACT
Local scour refers to the sediment transport around hydraulic structures by flowing water.
Excessive scour around the abutment can potentially cause damage to the bridge, which may also
result in catastrophic consequences. Abutment scour refers to the local scour generated by the
flow passing around bridge abutments. One of the challenging problems for hydraulic engineers
is the prediction of maximum scour depth around abutments and pier foundations so that proper
provisions can be made in the design and construction to mitigate the consequences.
Despite significant research efforts to improve the understanding of scour related problems,
abutment scour is still among the more complex and challenging problems. Over the past few
decades, local scour around bridge abutments has received wide attention, and many researchers
have contributed various studies on the topic. The current state knowledge on local scour still has
insufficiently understood aspects, for example, ice accumulation has never been addressed in the
abutment scour research. The impacts of ice cover has never been conducted. To fill this gap, the
present research is conducted.
The ice cover can change the channel morphology and flow field. It is well known that river ice
affects the vertical and lateral distribution of flow in a channel. Additionally, because river ice
affects the flow conditions, it potentially influence sediment transport. Hence, the scour around
abutments is affected.
In the present research, a series of large flume experiments are conducted. By adding different
simulated ice covers in the flume, ice-covered flow can be generated. By comparing the scour
profiles and maximum scour depth around two commonly used abutments in three non-uniform
sediments, the ice cover impacts have been investigated. A significant increase can be noticed by
adding ice cover. With the increase in ice cover roughness, the maximum scour depth increase
correspondingly. Meanwhile, semi-circular abutment can generate a relatively small scour hole.
Furthermore, the role of densimetric Froude number, armor layer sediment size, Manning’s
roughness coefficient are all analyzed in the research. Several empirical equations are developed
from present research for the estimation of maximum scour depth around abutments.

ii
TABLE OF CONTENTS
ABSTRACT ................................................................................................................................................... i
TABLE OF CONTENTS .............................................................................................................................. ii
CO-AUTHORSHIP ..................................................................................................................................... iv
List of Tables ................................................................................................................................................ v
List of Figures .............................................................................................................................................. vi
ACKNOWLEDGEMENT ........................................................................................................................... ix
1 GENERAL INTRODUCTION .................................................................................................................. 1
1.1 Literature review ................................................................................................................................. 3
1.1.1 Local Scour characteristics around bridge abutments in open channels ...................................... 3
1.1.2 Ice Covered issues on local scour ................................................................................................ 8
1.2 Research objectives ........................................................................................................................... 12
1.2.1 Objective One ............................................................................................................................ 12
1.2.2 Objective Two ............................................................................................................................ 12
1.2.3 Objective Three .......................................................................................................................... 13
1.3 Research innovations ........................................................................................................................ 14
1.4 Outline of dissertation ....................................................................................................................... 14
2 METHODOLOGY .................................................................................................................................. 20
2.1 Theoretical analysis .......................................................................................................................... 20
2.2 Experimental study ........................................................................................................................... 22
2.2.1 Study site .................................................................................................................................... 22
2.2.2 Experimental design and construction ....................................................................................... 22
2.2.3 Measurement apparatus.............................................................................................................. 25
2.2.4 Experimental procedures ............................................................................................................ 27
3 RESULTS AND DISCUSSION .............................................................................................................. 29
3.1 Impacts of ice cover on local scour around semi-circular bridge abutment ...................................... 30
3.1.1 Methodology .............................................................................................................................. 31
3.1.2 Results and discussion ............................................................................................................... 33
3.1.3 Conclusion ................................................................................................................................. 46
3.2 Local scour around bridge abutments under ice covered condition: comparing of square abutment
and semi-circular abutment ..................................................................................................................... 49

iii
3.2.1 Experimental setup ..................................................................................................................... 50
3.2.2 Results and discussion ............................................................................................................... 56
3.2.3 Conclusions ................................................................................................................................ 63
3.3 Scour morphology around bridge abutments with non-uniform sediment under ice cover .............. 67
3.3.1 Methodology .............................................................................................................................. 69
3.3.2 Results and discussion ............................................................................................................... 73
3.3.3 Conclusions ................................................................................................................................ 79
3.4 Armor layer analysis of local scour around bridge abutments under ice cover ................................ 82
3.4.1 Methodology .............................................................................................................................. 84
3.4.2 Results and discussion ............................................................................................................... 88
3.4.3 Conclusions .............................................................................................................................. 100
3.5 ADV measurements of flow field along a round abutment under ice covers ................................. 103
3.5.1 Methodology ............................................................................................................................ 104
3.5.2 Results and Discussion............................................................................................................. 107
3.5.3 Conclusion ............................................................................................................................... 116
3.6 The incipient motion of bed material and shear stress analysis around bridge abutments under ice-
cover ...................................................................................................................................................... 119
3.6.1 Experimental setup and measurement ...................................................................................... 120
3.6.2 Results and discussion ............................................................................................................. 122
3.6.3 Conclusions .............................................................................................................................. 129
4 GENERAL CONCLUSION .................................................................................................................. 133
5 APPENDIX ............................................................................................................................................ 135

iv
CO-AUTHORSHIP
For all chapters in this thesis, I was the primary investigator, leading: the design of studies,
collection of data and analysis of data. I wrote the manuscripts and was responsible for
incorporating comments and feedback on into final versions of the thesis. However, despite the
use of first-person singular in writing the thesis, I would like to acknowledge that this work was
not conducted in isolation. Faye Hirshfiled is my PhD colleague who assisted in all aspects of
field work. To acknowledge her contribution, she is included in all publications that stem from
my work. Chen Pangpang and Dr. Jun Wang contributed some comments and figures on the
manuscripts, so they were included in some publications respectively. Finally, my supervisor, Dr.
Jueyi Sui, contributed to experimental design, data analysis of the present research. And he is
included in author ship on all resulting publications.
Publications and authorships stemming from this thesis (published or submitted)
Wu P, Hirshfield F, Sui J, Wang J, 2014. Impacts of ice cover on local scour around semi-
circular bridge abutment, Journal of Hydrodynamics, 2014, 26(1):840-847. (Chapter 3.1)
Wu P, Hirshfield F, Sui J, Chen P, 2014. Local scour around bridge abutments under ice covered
condition- an experimental study, IJSR-D-13-00042, International Journal of Sediment Research,
accepted for publication. (Chapter 3.2)
Wu P, Hirshfield F, Sui J, 2013. Scour morphology around bridge abutment with non-uniform
sediments under ice cover, proceedings for the 35th IAHR World Congress, Chengdu, China,
September, 2013. (Chapter 3.3)
Wu P, Hirshfield F, Sui J, 2014. Armor layer analysis of local scour around bridge abutments
under ice cover, River Research and Applications, accepted for publication, published online in
Wiley Online Library, DOI: 10.1002/rra.2771. (Chapter 3.4)
Wu P, Hirshfield F, Sui J, 2013. ADV measurements of flow field along a round abutment under
ice covers, accepted for publication at the proceedings for 17th Workshop on River Ice,
Edmonton, Canada, July 21-24, 2013. (Chapter 3.5)
Wu P, Hirshfield F, Sui J, 2014. The incipient motion of bed material and shear stress analysis
around bridge abutments under ice-cover, Canadian Journal of Civil Engineering, cjce-2013-
0552, published on line 2014-09-09. (Chapter 3.6)

v
List of Tables
Table 3.1- 1 Experimental running condition summary ............................................................... 34
Table 3.2- 1 Summary of running conditions ............................................................................... 54
Table 3.3- 1 Experimental data of small scale flume experiments ............................................... 70
Table 3.3- 2 Experimental data of small scale flume experiments ............................................... 72
Table 3.4- 1 Test condition and non-uniform sediment composition of each experiment ........... 87
Table 3.5- 1 The maximum scour depth under different conditions........................................... 105
Table 5- 1 Experimental data collected at non-uniform sand (D50 = 0.58 mm) ......................... 135
Table 5- 2 Experimental data collected at non-uniform sand (D50 = 0.50 mm) ......................... 136
Table 5- 3 Experimental data collected at non-uniform sand (D50 = 0.47 mm) ......................... 137
Table 5- 4 Scour contours at D50 = 0.58 mm .............................................................................. 138
Table 5- 5 Scour contours at D50 = 0.50 mm .............................................................................. 144
Table 5- 6 Scour contours at D50 = 0.47 mm .............................................................................. 150

vi
List of Figures
Figure 1- 1 A typical local scour around a bridge abutment ........................................................... 1
Figure 1- 2 Flow and local scour around a bridge abutment .......................................................... 3
Figure 1- 3 Time evolution of clear-water scour and live-bed scour .............................................. 5
Figure 1- 4 Comparison of velocity and suspended sediment concentration distributions between
......................................................................................................................................................... 9
Figure 1- 5 The velocity distribution of open water, floating smooth and floating rough cover .. 11
Figure 1- 6 Bridge abutment (BA) types used in experiments ..................................................... 13
Figure 2- 1 Schematic of force on particle on a sloping bed under ice cover ............................... 21
Figure 2- 2 The modification plan for the flume at QRRC ........................................................... 24
Figure 2- 3 The modification of flume at QRRC .......................................................................... 25
Figure 2- 4 The dimension of ADV (left) and the sensor head of a ADV (right) ........................ 26
Figure 2- 5 Releated parameters and Experimental procedure (BA: bridge abutment) ............... 28
Figure 3.1- 1 Dimensions of abutment, ice cover and rough ice cover used in the experiment ... 32
Figure 3.1- 2 Measuring points along the semi-circular abutment ............................................... 33
Figure 3.1- 3 The local scour around the abutment and the measurement of the scour ............... 34
Figure 3.1- 4 The scour profiles around the abutment under different cover conditions
(D50=0.50mm) ............................................................................................................................... 36
Figure 3.1- 5 (a) Cross-section along the semi-circular abutment (D50=0.50mm); (b) Cross-
section along the semi-circular abutment under smooth and rough cover (D50=0.50mm) ........... 39
Figure 3.1- 6 Variation of scour volume around bridge abutment ............................................... 40
Figure 3.1- 7 (a) Variation of maximum scour depth with the Froude number under different
sediment composition (b) The comparison of maximum scour depth in open channel and ice
covered condition (D50=0.50mm) ................................................................................................. 42
Figure 3.1- 8 Dependence of maximum scour depth on related variables .................................... 43
Figure 3.1- 9 Dependence of maximum scour depth on related variables under ice cover .......... 45
Figure 3.2- 1 (a) The plan and vertical view of the modified flume; (b) The coordinate system
and abutments dimensions ............................................................................................................ 52
Figure 3.2- 2 (a) Inside view of the flume; (b) Rough ice cover used in the research .................. 53
Figure 3.2- 3 Typical local scour profiles around the square abutment and semicircular abutment
....................................................................................................................................................... 57
Figure 3.2- 4 The variation of maximum scour depth with abutment model ............................... 58
Figure 3.2- 5 The variation of D50 with scour depth under different conditions .......................... 60
Figure 3.2- 6 The variation of maximum scour depth with different sediments and abutments .. 61
Figure 3.2- 7 The variation of maximum scour depth with different covered conditions ............ 63
Figure 3.3- 1 A comparison of flow profiles with (a) and without (b) ice cover .......................... 68
Figure 3.3- 2 The experimental setup of the small scale flume (left) and large scale flume (right)
....................................................................................................................................................... 69
Figure 3.3- 3 (a) The local scour around the bridge abutment in the small-scale flume and ....... 74
Figure 3.3- 4 The scour contour in the large scale flume ............................................................. 76

vii
Figure 3.3- 5 The sediment samples L1 (left) and L2 (right) ....................................................... 76
Figure 3.3- 6 The cross section of the local scour along the abutment (left) and samples collected
(right) ............................................................................................................................................ 77
Figure 3.3- 7 The sand analysis of samples .................................................................................. 77
Figure 3.3- 8 The variation of scour depth with densimetric Froude number in small-scale flume
....................................................................................................................................................... 78
Figure 3.3- 9 The variation of scour depth under smooth ice cover in large scale flume ............. 79
Figure 3.4- 1 The layout of the experimental large scale flume ................................................... 85
Figure 3.4- 2 Dimensions and measuring points of abutments ..................................................... 85
Figure 3.4- 3 Experimental flume set up and rough ice cover (up); Armor layer around the square
abutment corner (bottom) ............................................................................................................. 86
Figure 3.4- 4 Typical local scour contour around square abutment (left) and semi-circular
abutment (right) ............................................................................................................................ 89
Figure 3.4- 5 Distribution curves for the non-uniform sediment .................................................. 91
Figure 3.4- 6 Samples of armor layer, fine sediment ridge and related distribution curves ......... 92
Figure 3.4- 7 Variation of maximum scour depth with Fo at square abutment (left) and semi-
circular abutment (right) ............................................................................................................... 94
Figure 3.4- 8 Variation of maximum scour depth with related variable around square abutment 94
Figure 3.4- 9 Variation of maximum scour depth with related variable around semi-circular
abutment ........................................................................................................................................ 95
Figure 3.4- 10 Dependence of maximum scour depth on related variables around square
abutment ........................................................................................................................................ 95
Figure 3.4- 11 Dependence of maximum scour depth on related variables around the semi-
circular abutment .......................................................................................................................... 96
Figure 3.4- 12 The impact of ice cover roughness on the maximum scour depth ........................ 98
Figure 3.4- 13 Regression relationship under ice cover of related variables around square
abutment ........................................................................................................................................ 99
Figure 3.4- 14 Regression relationship under ice cover of related variables around semi-circular
abutment ........................................................................................................................................ 99
Figure 3.5- 1 Experimental setup ................................................................................................ 104
Figure 3.5- 2 Abutment dimension and coordinate system. ....................................................... 107
Figure 3.5- 3 Contours of scour hole under open channel, smooth cover, and rough cover ...... 109
Figure 3.5- 4 The scour profile along the round abutment under different conditions ............... 111
Figure 3.5- 5 The velocity distribution along the abutment under different conditions: open
channel (Left), smooth cover (Middle), rough cover (right) ...................................................... 116
Figure 3.6- 1 Sketch of experimental setup and abutment dimension ........................................ 121
Figure 3.6- 2 Incipient motion in the scour hole under ice cover ............................................... 122
Figure 3.6- 3 Incipient motion of different sediments with the maximum scour depth ............. 125
Figure 3.6- 4 The variation of shear Reynolds number with dimensionless shear stress ........... 127

viii
Figure 3.6- 5 The maximum scour depth variation with dimensionless shear stress around square
abutment ...................................................................................................................................... 128
Figure 3.6- 6 The maximum scour depth variation with dimensionless shear stress under ice
cover and open channel (square abutment) ................................................................................. 128
Figure 3.6- 7 The maximum scour depth variation with dimensionless shear stress under smooth
ice cover and rough ice cover (semi-circular abutment) ............................................................. 129

ix
ACKNOWLEDGEMENT
I would like to express my first thanks to my supervisor, Dr. Jueyi Sui, who has been, and still is
helpful and supportive through my entire PhD. His advice on experimental design, writing and
data analysis is always helpful. Discussions about my research, but also on the academic research
in general, has been really inspiring. I had a great time working with Dr. Sui and lots of ideas for
my future research are based on the conservations between us.
During my three years PhD at University of Northern British Columbia, I spent a lot time in the
field and received great help from my colleagues and friends. I would like to thank Faye
Hirshfield for being my most reliable and helpful colleague and friend, who spend almost two
entire field seasons with me from 2011 to 2012, even when it was pouring rain or one meter
snow. Anja Forster has been the best field assistant for flume construction in 2011. The work
cannot be finished without her help.
I would like to thank my committee members Dr. Jianbing Li, Dr. Liang Chen, Dr. Youmin Tang,
Dr. Junjie Gu for their time and support through the last few years. They brought a lot to my
thesis, especially by widening my view beyond my research area.
I would also express my thanks to Dr. Ellen Petticrew, Dr. Phil Owens, Dr. Neil Hanlon, Dr. Phil
Burton, Dr. Joselito Arocena as my course supervisors in my first year of PhD. Integrating my
own research within a wide spectrum of knowledge, and sharing it with people from different
fields make me becoming more interested in environmental issues.
I would also like to thank the Institutions that supported my research. The University of Northern
British Columbia is really welcoming and supportive of foreign students. The Research Project
Awards funding helped a lot during my hard time. The Dr. Max Blouw Quesnel River Research
Center, which is the base of my research, has the best manager and staff. Richard Holmes and
Samuel Albers provided great help as managers of the research center. Lazlo Enyedy and
Howard helped me a lot to finish the flume construction and experiments. I had the best life and
work experience in Likely. Friends and people in Likely are greatly acknowledged.
More on the personal side of my life, I would like to say a big thank you to my parents. Also
special thanks to Mr. and Mrs. Hirshfield. They always showed support and interest in my work
even if it was hard to follow. Being overseas and far from home, I made myself at home in Price
George. I want to thank all the cool and wonderful friend I met there and who make my 3-year
experience in Prince George so pleasant. My PhD friends, Alex Koiter, Steffi LaZerte, Adrian
James, Dominic Reiffarth, Lisha Berzins, Yueting Shao et al. have been the best classmates ever.
I would extend my thanks to Heidi, Leah, Ben, Dr. Youqin Wang, Guangji Hu, Lin Bai, Bo
Huang for their friendship, encouragement and belief.

1
1 GENERAL INTRODUCTION
Scour is a natural phenomenon caused by erosion on alluvial or gravel beds by a flowing stream.
Local scour refers to the scour caused by an obstruction in the channel (Chang, 2002). Local
scour around bridge foundation elements is one of the most common reasons for bridge collapse
and has caused huge economic loss around the world (Figure 1-1). For example, in 1987, 17
bridges were destroyed by scour during a flood in New York and New England. During the
flooding in Georgia in 1994 over 500 bridges were damaged due to the scour (Richardson and
Davis, 2001). According to a nation-wide study conducted by the US Federal Highway
Administration, 75% of 383 bridge failures in 1973 involved abutment damage and 25%
involved pier damage (Chang, 1973). In 1978, another extensive study indicated that problems
caused by local scour at bridge abutments were equal to that at bridge piers (Brice and Blodgett,
1978). Bridge scour has been identified as the most common cause of highway bridge failures
and it accounts for about 60% of all bridge collapse in the United States (Deng and Cai, 2009). A
study by Kandasamy and Melville (1998) showed that 6 of 10 bridge failures which occurred in
New Zealand during Cyclone Bola were related to abutment scour. In China, local scour
damaged 49 railway bridges in 1994, resulting in an interruption of railway traffic for 2319 hours
(Zhu and Liu, 2012).
Figure 1- 1 A typical local scour around a bridge abutment

2
It is noted that local scour around bridge foundations has negative impacts on the performance
and stability of bridges. In the past few decades, local scour around bridge abutments in open
channels has received wide attention, and many scholars have conducted numerous studies on
this topic (e.g. Laursen and Toch, 1956; Froehlich, 1989; Melville, 1997; Coleman et al, 2003;
Dey 2005a, 2005b). To estimate the maximum scour depth, many relationships and formulae
have been developed which can be grouped into four categories: regime approach, dimensional
analysis, analytical or semi-analytical approach, and probabilistic approach (Zhang, et al, 2008).
In Canada, ice cover can stay up to six months in some northern areas. The formation of ice
cover involves complex interactions between hydrodynamic, mechanical, and thermal process
(Shen, 2010). Ice cover can result in many problems, such as ice jamming, flooding, restricting
the generation of hydro-power, block river navigation and affect the ecosystem balance. (Hicks,
2009). However, to my present knowledge, there is still very little research on the local scour
under ice cover.
Field observations indicate that ice cover significantly affects velocity distribution and sediment
transport processes in rivers. An imposed ice cover can lead to an increased composite resistance
and almost double the wetted perimeter. Understanding river ice process and ice effects on
hydraulic structures is important for the design and operation of hydraulic projects. To examine
the influence of ice cover on local scour around bridge abutments, the present research is
conducted. In the present research, ice cover plays an important variable for the estimation of
scour depth around abutments. Compared to an open channel, ice cover changes the hydraulics
by adding an extra boundary. Due to the limitations of laboratory study and lack of field data, the
flow field in the scour hole is still not clear. The main objectives in this research are to
investigate, the local scour development, equilibrium depth estimation, bed evolution, velocity
distribution, sediment transport rate and numerical model verification under various ice cover
conditions.

3
1.1 Literature review
1.1.1 Local Scour characteristics around bridge abutments in open channels
The scour occurring around bridge abutments can be grouped into three categories: general scour,
constriction scour, and local scour. General scour is the removal of sediment from the bottom of
a river channel by the flow of the river. While constriction scour is the removal of sediment from
the bottom and sides of the river channel, due to the higher velocity caused by hydraulic
structures such as a bridge. Local scour is caused by an acceleration of flow in the vicinity of
structures, which may happen around bridge piers, abutments, or other objects that obstruct the
flow in different ways (Chang, 2002). Local scour is a dynamic feedback process between
turbulent flow and erodible boundaries. The vortex systems and the down flow have high
turbulence which is the main cause of local scour. Compared to general scour and constriction
scour, local scour can cause serious damage to bridges. So in the following passage, the process
of local scour around bridge abutments will be the main interest.
Figure 1- 2 Flow and local scour around a bridge abutment
The flow field around a bridge abutment in natural open rivers is very complex. Moreover, the
complexity increases with the development of a scour hole which leads to separation of flow into
three vortex flow systems around the abutment. Figure 1-2 shows a schematic diagram of the
flow field and scour hole around an abutment. Kwan and Melville (1994) suggested that the
scour hole is mainly dominated by a large primary vortex and associated down flow. The
primary vortex extends to the downstream of the abutment and loses its identity after some

4
distance. Near the water surface a vertical pressure gradient is developed due to the stagnation of
the approaching flow. At the corner of abutment downstream, the flow accelerates and leads to
the development of concentrated vortices, referred to as wake vortices. Wake vortices are
created due to the separation of flow upstream and downstream of the abutment corners (Zhang,
2005). Under open channel condition, the flow patterns and maximum down-flow are relatively
unaffected by changes in approach flow depth (Kwan and Melville, 1994). Under ice covered
conditions, flow fields around the bridge abutments will be significantly changed. This
hypothesis will be verified by the experimental study.
Based on whether there is sediment transported by the approaching flow, local scour can be
classified into two categories: clear-water scour and live-bed scour (Chabert and Engeldinger,
1956). Clear-water scour takes place in the absence of sediment transport by approaching flow
into the scour hole. Live-bed scour occurs when the scour hole is continuously fed with sediment
from upstream. The time variation of the clear-water scour and live-bed scour is shown
schematically in Figure 1-3. Chabert and Engeldinger (1956) observed that the equilibrium clear-
water scour depth is 10% greater than live bed scour depth.
The clear-water scour and live-bed scour are determined by the critical velocity (VC). The clear-
water scour can occur when V Vc <⁄ 1, while the live-bed scour will happen if V Vc >⁄ 1, in
which V is average flow velocity and VC is the critical flow velocity for sediments. There are
many formulae used to decide the value of VC. In this thesis, the equation from Laursen (1963)
will be used for non-uniform sediments,
VC = Kuy11/6
D501/3
(1-1)
in which, 1y is average flow depth in the main channel or overbank area at the approach section;
50D is bed material particle size in a mixture in which 50% percent are smaller; uK equals to
6.19 (S.I. Units).

5
Figure 1- 3 Time evolution of clear-water scour and live-bed scour
(After Chabert and Engeldinger, 1956)
Studies on the local scour around bridge elements in open channels has been widely done in the
past few decades and are still of continuous interest for scholars. These studies can be grouped
into two categories (Zhang, 2005). One is the prediction of scour depth by using empirical or
semi-empirical formulae based on field data or experimental data. The other is numerical
simulation. There are basically three types of scour depth estimation formulae from the literature
(Lim, 1997): a. the regime approach, which relates the scour depth to the increased discharge or
flow at the abutment; b. the dimensional analysis, where relevant dimensionless parameters
describing the scour are correlated (most of the past formulas are obtained from this way); c.
analytical or semi-empirical approach, which are based sediment transport relationships between
approach flow and shear stress around the abutment. A large amount of scour formulae are
available in the published literature. However, most of these formulae were derived from limited
variables related to the scour development (Barbhuiya and Dey, 2004):
(a) Variables related to the approaching flow (flow depth, mean velocity, roughness, etc);
(b) Variables related to bed sediment (grain size distribution, density, cohesiveness, etc);
(c) Variables related to the flow (water density, dynamic viscosity, gravitational acceleration);
(d) Variables related to the abutment and channel (abutment size and shape, channel width).

6
From the 1950s to 1980s, different forms of empirical formulae were presented from earlier
studies (e.g. Laursen and Toch, 1956; Laursen, 1963; Shen et al, 1969; Raudkivi and Ettema,
1983). From the 1990s to 2000s was the prosperous development period for scour research,
during which many experimental studies were conducted and many formulae were derived.
Some of the representative studies include Melville, 1997; Lim and Cheng, 1998; Ettema et al,
1998; Kuhnle et al, 2002; Coleman et al, 2003. A comprehensive review of the investigations on
local scour formulae can be found in Melville (1997) and Barbhuiya and Dey (2004). Johnson
(1995) compared 7 commonly used and cited formulae with a large set of field data for both
clear-water scour and live-bed scour. The results of this study pointed out the necessity for
further data collection and experimental research.
For Hydraulic Engineering applications, the concept of equilibrium scour depth in bridge
hydraulics is essential for scour prediction. Three of the commonly used formulae for predicting
scour depth at abutments for open channels (Laursen, 1963; Melville 1992 and Lim, 1997) are
briefly reviewed in the following passage.
1. The Laursen’s relationship (Laursen, 1963) was based on scour in a long contraction. For
abutments that do not extend over the overbank region into the river channel, Laursen gave the
following equation:
7 / 6
2.75 1 1s sd dL
y y r y
(1-2)
In which,
L: the length of abutment
r: the ratio of scour at the abutment to scour in a long contraction.
y: the approach flow depth.
With r =12 and using the binomial approximation, the equation can be simplified to:
0.5
1.93sd yL (1-3)
2. As defined by Melville and Coleman (2000), the functional relationship between scour depth
and other dependent parameters is:
sd = f [flow, bed sediment, bridge geometry, time]
By using dimensional analysis method, Melville (1995, 1997) studied the development of local
scour at bridge abutments and developed an equation to estimate the maximum scour depth

7
under clear water conditions. By plotting many published data of local scour depth sd at bridge
abutment sites and using his own experimental data collected at the University of Auckland,
Melville (1997) proposed the following scour prediction equation:
2sl d s G
dK K K K K K
L , 1
L
y
* *2s
l d s G
dK K K K K K
Ly , 1 25
L
y (1-4)
10sl d s G
dK K K K K K
y , 25
L
y
In which,
sd : equilibrium local scour depth;
L : abutment length; y : approach flow depth;
lK : scour depth of flow intensity; dK : sediment size; K : sediment gradation;
sK : abutment shape (with values 1 for the vertical wall abutment, 0.75 for 45° wing wall
abutment, and 0.5 for 1:1 sloping spill-through abutments);
K : abutment orientation;
GK : channel geometry;
*
sK ,*K : adjusted values of sK and K ;
sK , K and lK are all defined through experimental data in Melville’s study.
For a vertical wall abutment, under the condition of 1 / 25L y , the formula can be written as
0.5
2sd yL , which is close to Laursen’s equation.
3. Based on the continuity equation, scour geometry, and a generalized form of the power law
formula for flow resistance in an alluvial channel, Lim (1997) proposed an equation for
estimation of the maximum equilibrium scour depth. For vertical wall abutments, the scour depth
can be simplified to:
ds = 1.8(yL)0.5, which is in close agreement with the formulae derived by Melville (1997) and
Laursen (1963).
8
Currently, even the open channel scour depth estimation is not a standard design because of a
lack of reliable data (Hoffmans and Venhij, 1997). According to Melville (1997), “existing
design methods…are adequate for prediction of scour depth at abutments sited in channels that
can be approximated by a rectangular shape”. For the scour in natural rivers, the formulae
mentioned here involve strong empiricism and introduce many uncertainties.
1.1.2 Ice Covered issues on local scour
In northern Canada, many rivers become ice covered in winter. The presence of ice cover causes
changes in the properties of the flow such as: velocity profile, bed shear stress distribution,
mixing properties, and sediment transport (Lau and Krishnappan, 1985). The riverbed evolution
process will be significantly changed compared to that observed in open channels (Sui et al.,
2010b). To my knowledge, the literature on the scour under ice cover is still limited
(Krishnappan, 1984; Lau and Krishnappan, 1985; Tsai and Ettema, 1994; Beltaos, 1998; Ettema
et al, 2000; Wang et al, 2008; Sui et al. 2010b). In the following passage, a brief literature review
will be provided on the velocity distribution and sediment transport under ice cover.
Lau and Krishnappan (1981) used the k-ε model to calculate the velocity distribution by using
different boundary roughness. Lau and Krishnappan (1985) proposed a method to calculate
sediment transport by using k-ε model in covered flows. Under ice covered flows, they found
that the reduction in the bed shear stress had very significant effects on the sediment transport.
From a series of experiments, it was found that the top ice cover can cause an increase in depth,
decrease in average velocity and diffusivity distributions (Figure 1-4). However, the bed shear
stress and the eddy viscosity are both smaller than that corresponding free-surface flow values
(Krishnappan, 1984).
Ettema et al. (2000) reviewed methods of estimating of sediment transport in ice covered
channels and proposed a method to estimate the sediment transport rate by using the parameters
acquired from open channels. Wang et al. (2008) conducted an experimental study on the
incipient motion of sediment under ice cover and discussed the role of flow velocity and critical
shear Reynolds number in this process. Sui et al. (2010b) compared the velocity profile under
different flow and boundary conditions. He found that lower critical dimensionless shear stress
for incipient motion was needed if the sediment size is smaller. Moreover, the velocity profile

9
under ice cover is completely different compared to the velocity profile in open channels. The
flow in the upper layer is primarily affected by ice cover resistance, whereas the lower portion of
the flow is influenced by the channel bed resistance (Sui et al, 2010b).
Figure 1- 4 Comparison of velocity and suspended sediment concentration distributions between
covered flow and free surface flow (S: sediment transport rate; V: velocity profile. Adapted from
Lau et al, 1985)
As mentioned in section 1.1, the local scour can be separated to clear-water scour and live-bed
scour. Since it is difficult to measure and track sediments transported from approaching flow, in
this research, the clear water scour will be the focus.
In natural rivers, when the flow condition satisfies or exceeds the criteria for incipient motion,
sediment particles will start to move. Depending on the size of the bed-material particles and
flow conditions, if the motion of the particle is rolling, sliding or sometimes jumping along the
bed, it is called bed load transport. If the motion of the particle is supported by the upward
components of turbulent currents and remained in suspension for a distance, it is called
suspended load transport. Total load is the sum of bed load and suspended load. In most natural
10
rivers, sediments are mainly transported as suspended load, while the bed load transport rate is
about 5-25% of that in suspension (Yang, 2003). In this research, both bed load and suspended
load transport rates will be considered.
According to Bagnold (1966), the motion of the bed load particles is assumed to be dominated
by gravitational forces, while the effect of turbulence on the overall trajectory of bed load is
supposed to be of minor importance. Based on this assumption, van Rijn (1984a) presented a
method which enables the computation of the bed load transport rate (qb) as the product of the
saltation height (jumping height, δb ), the particle velocity (ub) and bed load concentration (cb):
qb = ubδbcb (1-5)
For suspended load, van Rijn (1984b) computed it as the depth integration of the local
concentration and flow velocity. The particle fall velocity and sediment diffusion coefficient
were studied in detail as the main controlling hydraulic parameters. The proposed relationships
for the suspended load transport were also verified by using a large amount of flume data.
However, for sediment transport under ice cover, the quality and quantity of data are still limited.
Ettema and Daly (2004) reviewed the impacts of river ice on sediment transport. Dimensional
analysis of variables associated with flow was used. Sediment transport under ice cover was
described in terms of key non-dimensional parameters characterizing the dynamics of flow and
sediment interaction. The ice cover can influence water drag on the bed, redistribute flow to
generate turbulence, and reduce the rate of flow energy expended along the bed.
Currently, there are two main methods to estimate flow resistance under ice cover in alluvial
channels. The first one is to assume that the bed resistance coefficients do not change with ice
cover, for example, Manning, Chezy, or Darcy-Weisbach coefficients. The second one is the
flow resistance behavior of the bed can be determined by an ice cover flow as a composite of two
non-interacting flow layers, with the lower layer of flow affecting the bed topography. Lau and
Krishnappan (1985) simulated the sediment transport under ice cover by assuming that the lower
layer in a covered flow can be treated as a free surface flow. The top ice cover causes an increase
in depth and decrease in average velocity and diffusivity distributions.
The shear stress is also used to characterize the channel scour, which is directly used to quantify
resistance to motion. Hains (2004) used the shear stress analysis in experiments with smooth
cover and rough ice cover. The results showed that increased shear stresses on the bed will
increase bed erosion and scour depth. Hains and Zabilansky (2005) conducted a series of

11
experiments to establish the sensitivity of various parameters affecting sediment transport
processes under ice cover. In their research, approaching flow velocities were selected primarily
on clear water scour under both smooth and rough simulated ice covers. Open channel, floating
cover and fixed cover experiments were presented. By revising the scour model of Melville and
Coleman (2000), two extra parameters were included in the equation: kcover and Lc. The
Melville’s equation was then modified as:
sd = f [flow, bed sediment, abutment geometry, time, cover (kcover, Lc)]
In which,
Lc= the length of ice cover. kcover= the ice cover factor (roughness, wetted perimeter)
For a floating smooth cover, the velocity profile is gradual, with the maximum velocity
approximately at mid-depth. For a floating rough cover, the maximum velocity is also mid-depth
but is greater in value than the smooth ice profile (Figure 1-5).
Figure 1- 5 The velocity distribution of open water, floating smooth and floating rough cover
(After Hains and Zabilansky, 2005)
There are also experiments on the local scour under ice cover by using different laboratorial
flumes (Ettema, 2000; Wang et al. 2008; Sui et al. 2010b). While most of these studies focus on
the velocity distribution, the sediment transport under ice cover is not quantitatively analyzed,
which restricts further study of the local scour under ice cover. Only two studies on the

12
experimental study of local scour around bridge foundations under ice cover can be found
(Ackermann et al. 2002; Munteanu and Frenette, 2010). For a better understanding of this
phenomenon, more experiments need to be conducted for collecting data and also for the
calibration of numerical models in the future.
1.2 Research objectives
Compared to the research of local scour in open channels, the local scour study under covered
conditions is very limited. Only a few papers can be found in the literature. For numerical
simulation, there is still very limited mathematical model available that can be used in the
present research. My study aims at contributing to the understanding of local scour under ice
cover and modeling of flow and sediment movement around bridge abutments. The main
objectives of this study are listed as follows.
1.2.1 Objective One
The impact of velocity, flow depth and sediment composition
From previous studies, the velocity distribution under ice cover is different to that in open
channels. The effect of approaching velocity is incorporated in the scour predicting formulae in
the form of flow Froude number or shear velocity (Froehlich, 1989; Kandasamy, 1989). For the
bridge abutment scour, Melville (1992) suggested flow depth has different impacts on short
abutments (l/h≥1) and long abutments (l/h≥25). Characteristics of sediment composition are
commonly used in scour depth formulae. Derived from the particle size distribution curves,
median sediment diameter d50 and geometric standard deviation σg (σg=(d84/d16)0.5) are the two
most widely used sediment parameters in the study of local scour. Dey and Barbhuiya (2004)
indicated that for non-uniform sediments, due to the formation of armor-layers in the scour hole,
the scour depth is reduced significantly in open channels. Under ice cover, the impacts of
different approaching velocity, flow depth and sediment composition on scour hole development
are still not clear.
In the experimental study, by changing different approaching velocities, flow depths and
sediment compositions, the real-time and maximum scour depth will be measured under ice
cover.
1.2.2 Objective Two
13
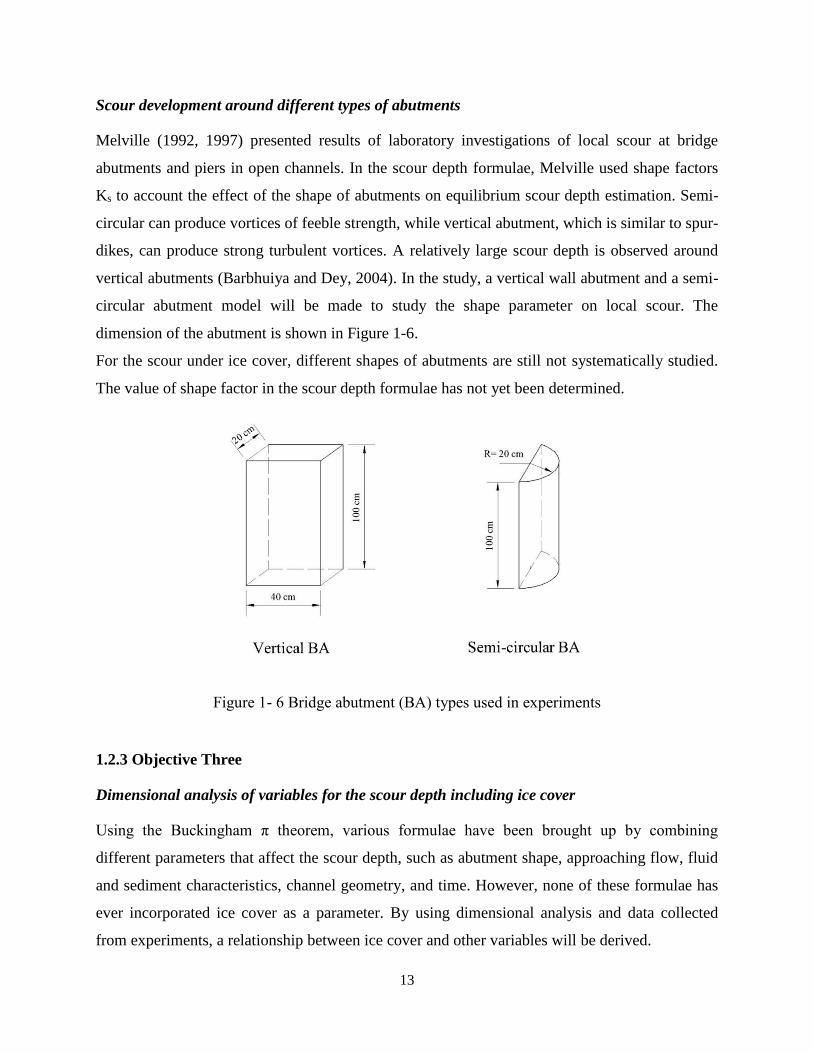
Scour development around different types of abutments
Melville (1992, 1997) presented results of laboratory investigations of local scour at bridge
abutments and piers in open channels. In the scour depth formulae, Melville used shape factors
Ks to account the effect of the shape of abutments on equilibrium scour depth estimation. Semi-
circular can produce vortices of feeble strength, while vertical abutment, which is similar to spur-
dikes, can produce strong turbulent vortices. A relatively large scour depth is observed around
vertical abutments (Barbhuiya and Dey, 2004). In the study, a vertical wall abutment and a semi-
circular abutment model will be made to study the shape parameter on local scour. The
dimension of the abutment is shown in Figure 1-6.
For the scour under ice cover, different shapes of abutments are still not systematically studied.
The value of shape factor in the scour depth formulae has not yet been determined.
Figure 1- 6 Bridge abutment (BA) types used in experiments
1.2.3 Objective Three
Dimensional analysis of variables for the scour depth including ice cover
Using the Buckingham π theorem, various formulae have been brought up by combining
different parameters that affect the scour depth, such as abutment shape, approaching flow, fluid
and sediment characteristics, channel geometry, and time. However, none of these formulae has
ever incorporated ice cover as a parameter. By using dimensional analysis and data collected
from experiments, a relationship between ice cover and other variables will be derived.

14
1.3 Research innovations
The experimental and numerical research are focused on the local scour around bridge abutment
under ice cover conditions. The study has the following innovations:
1. The whole process of local scour around bridge abutment under ice covered conditions will
be simulated by a series of large scale flume experiments;
2. The local scour process under different flow conditions, namely, open channel, smooth,
rough will be compared;
3. Through Dimensional Analysis, empirical formula to estimate the scour depth under ice
covers will be derived.
1.4 Outline of dissertation
The dissertation focuses on the analysis of data from experimental study. Chapter 2 is the
methodology and experimental set up. Chapter 3 is the data analysis and discussion, which is
separated into several parts. Each section discuss one aspect of ice cover impacts on local scour
around bridge abutment. Chapter 3.1 is the analysis of ice cover impacts around the semi-circular
abutment. Chapter 3.2 compares both square and semi-circular abutment under ice cover and
open channel conditions. In this section, the shape factor of abutment is introduced. By
comparing a small scale flume experiments, Chapter 3.3 is introduced to show the impacts of ice
cover and non-uniform sediment. The large scale flume experiments shows interestingly
different comparing to that from small scale flume experiments. Chapter 3.4 focuses on the
analysis of armor layer analysis around abutments. Since the sediments used in the present
research are non-uniform, a clear armor layer is noticed around abutments. By including armor
layer sediment size, the maximum scour depth is discussed. Empirical equations are also
developed. Chapter 3.5 is used to show the analysis of ADV measurements from the experiments.
Finally, Chapter 3.6 shows the theory analysis of incipient motion under ice cover. The
dimensionless shear stress is calculated and compared.
References

15
1. Acharya A, (2011). Experimental study and numerical simulation of flow and sediment
transport around a series of spur dikes, PhD Dissertation. The University of Arizona, pp: 36.
2. Ackermann N L, Shen H T, Olsson P, (2002). Local scour around circular piers under ice
covers. Proceeding of the 16th IAHR Internnational Symposium on Ice, Internnational
Association of Hydraulic Engineering Research, Dunedin, New Zealand.
3. Ali K H M, Karim O A, Connor B A, (1997). Flow patterns around bridge piers and
offshore structures. ASCE, Water Resources Engineering Conference, 208-213.
4. Bagnold R A, (1966). An approach to the sediment transport problem from general
physics. Physiographic and Hydraulic Studies of rivers, Geological survey professional paper,
422-1, Washington.
5. Barbhuiya A K, Dey S, (2004). Local scour at abutments: a review. Proceedings of the
Indian Academy of Sciences, Sadhana, October 29, 449-476.
6. Beltaos S, (1998). Logitudianl dispersion in ice covered rivers. Journal of Cold Regions
Engineering, ASCE, 12(4): 184-201.
7. Biron P M, Robson C, Lapointe M F, Gaskin S J, (2004). Comparing different methods
of bed shear stress estimates in simple and complex flow fields. Earth Surface Processes and
Landforms, 29:1403-1415.
8. Brice J C, Blodgett J C, (1978). Countermeasures for hydraulic problems at Bridges. Vol.
1 and 2, FHWA/RD-78-162&163, Federal Highway Administration, US Department of
Transportation, Washington D C, US.
9. Chang F F M, (1973). A statistical summary of the cause and cost of bridge failures.
Office of Research, Federal Highway Administration, Washington D C, US.
10. Chang H H, Reprint edition (2002). Fluvial process in river engineering. Krieger Publish
Company, Malabar, Florida, 80-103.
11. Charbert J, Engeldinger P, (1956). Etude des affouillementsautour des piles de points.
Series A, Laboratory National d’Hydraulique. Chatou, France (in French).
12. Chiew Y M, (1995). Mechanics of riprap failure at bridge piers. Journal of Hydraulic
Engineering, ASCE, 121 (9): 635-643.
13. Coleman S E, Lauchlan C S, Melville B W, (2003). Clear water scour development at
bridge abutments, Journal of Hydraulic Research, 41(5): 521–531.

16
14. Deng L, Cai C S, (2009). Bridge scour: prediction, modeling, monitoring, and
countermeasures-Review. Practice Periodical on Structural Design and Construction, 15(2):125-
134.
15. Dey S, Barbhuiya A K, (2004). Clear water scour at abutments in thinly armored beds.
Journal of Hydraulic Engineering, ASCE, 130:622-634.
16. Dey S, Bose S K, Sastry G L N, (1995). Clear water scour at circular piers: a model.
Journal of Hydraulic Engineering, 121(12):869-876.
17. Dey S, Barbhuiya A K, (2005a). Time variation of scour at abutments, Journal of
Hydraulic Engineering, ASCE, 131 (1): 11-23.
18. Dey, S, (2005b). Reynolds stress and bed shear in non-uniform-unsteady open channel
flow, Journal of Hydraulic Engineering, ASCE, 131 (7): 610-614.
19. Dou X, (1980). The stochastic theory and the general law of all flow regions for turbulent
open channel flows. Proc., 1st Int. Symp. on River Sedimentation, Beijing.
20. Duan J G, He L, Fu X, Wang G, (2009). Mean flow and turbulence around an
experimental spur dike. Advances in Water Resources. 32: 1717-1725.
21. Ettema R, Braileanu F and Muste M, (2000). Method for estimating sediment transport in
ice-covered channels. Journal of Cold Regions Engineering, ASCE, 14(3): 130-144.
22. Ettema R, Daly S F, (2004). Sediment transport under ice. Cold regions research and
engineering laboratory. ERDC/CRREL TR-04-20.
23. Ettema R, Mostafa E A, Melville B W, Yassin A A, (1998). Local scour at skewed piers.
Journal of Hydraulic Engineering, ASCE, 124 (7): 756-759.
24. Froehlich D C, (1989). Local scour at bridge abutments. Proc. Natl. Conf. Hydraulic
Engineering, ASCE, pp 13-18.
25. Grimaldi C, Gaudio R, Calomino F, Cardoso A H, (2009). Control of scour at bridge
piers by a downstream bed sill, Journal of Hydraulic Engineering, ASCE, 135(1): 13-21.
26. Hains D B, (2004). An experimental study of ice effects on scour at bridge piers. PhD
Dissertation, Lehigh University, Bethlehem, PA.
27. Hains D B, Zabilansky L, (2005). The effects of river ice on scour and sediment transport,
CGU HS sommittee on river ice process and the environment, 13th workshop on the hydraulic of
ice covered rivers, Hanover, NH, September 15-16.

17
28. Hicks F, (2009). An overview of river ice problems: CRIPE 07 guest editorial Cold
regions Science and Technology, 55: 175-185.
29. Hoffmans GJCM, VerheijH J, (1997). Scour Manual, A.A.Balkema, Rotterdam.
30. Johnson P A, (1995). Comparison of pier scour equations using filed data. Journal of
Hydraulic Engineering, ASCE, 121 (8): 626-629.
31. Kandasamy J K, (1989). Abutment scour, Report No 458. School of Engineering,
University of Auckland, New Zealand.
32. Kandasamy J K, Melville B W, (1998). Maximum local scour depth at bridge piers and
abutments. J Hydraul. Res. 36:183-197.
33. Krishnappan B G, (1984). Laboratory verification of turbulent flow model, Journal of
Hydraulic Engineering, 110(4): 500-513.
34. Kuhnle R A, Alonso C V, Shields F D, (1999). Geometry of scour hole associated with
90° spur dike. Journal of Hydraulic Engineering, ASCE, 125(9): 972-978.
35. Kuhnle R A, Alonso C V, Shields FD, (2002). Local scour associated with angled spur
dikes, Journal of Hydraulic Engineering, 128(12):1087-1093.
36. Kuhnle R A, Jia Y, Alonso C V, (2008). Measured and simulated flow near a submerged
spur dike. Journal of Hydraulic Engineering, ASCE, 1348(7): 916–924.
37. Kwan R T F, Melville, B W, (1994). Local scour and flow measurements at bridge
abutments, Journal of Hydraulic Research, 32(5): 661-673.
38. Lau Y L, (1982. Velocity distributions under floating cover. Can. J. Civ. Eng., 9, 76-83.
39. Lau Y L, Krishnappan B G, (1981). Ice cover effects on stream flows and mixing,
Journal of the Hydraulic Division, 107(HY10): 1225-1242.
40. Lau Y L, Krishnappan B G, (1985). Sediment transport under ice cover. Journal of
Hydraulic Engineering, ASCE, 111(6): 934-950.
41. Laursen E M, (1963). Analysis of relief bridge scour. J. Hydr. Div., ASCE, 89(3): 93-118.
42. Laursen E M, Toch A, (1956. Scour around bridge piers and abutments. Iowa Highway
Research Board Bulletin, No 4.
43. Lim S Y, (1997). Equilibrium clear-water scour around an abutment, Journal of
Hydraulic Engineering, 123(3): 237-243.
44. Lim S Y, Cheng N S, (1998). Prediction of live bed scour at bridge abutments. Journal of
Hydraulic Engineering, ASCE, 124 (6): 635-638.

18
45. Lee S O, Sturm T, (2008). Scaling issues for laboratory modeling of bridge pier scour.
Proceeding of 4th International Conference on Scour and Erosion, Tokyo, Japan, 111-115.
46. Melville B W, (1975). Local scour at bridge sites. Rep. NO. 117. Department of Civil
Engineering, School of Engineering, University of Auckland, Auckland, New Zealand.
47. Melville B W, (1992). Local scour at bridge abutments, Journal of Hydraulic Engineering,
118(4): 615-631.
48. Melville B W, (1995). Bridge abutment scour in compound channels, Journal of
Hydraulic Engineering, 121(12): 863-868.
49. Melville B W, (1997). Pier and Abutment scour: integrated approach, Journal of
Hydraulic Engineering, 123(2): 125-136.
50. Melville B W, Chiew Y M, (1999). Time scale for local scour at bridge piers, Journal of
Hydraulic Engineering, 125(1): 59-65.
51. Melville B W, Coleman S E, (2000). Bridge Scour. Water Resources Publications, LLC.
Highlands Ranch, Colorado, US.
52. MolinasA, and Wu B, (2001). Transport of sediment in large sand bed rivers, J. of
Hydraulic Res.,Vol 39, 135-146.
53. Morales R, Ettema R, Barkdoll B, (2008). Large scale flume tests of riprap-apron
performance at a bridge abutment on a floodplain. Journa of Hydraulic Engineering, ASCE,
134(6): 800-809.
54. Munteanu A, Frenette R. (2010). Scouring around a cylindrical bridge pier under ice
covered flow condition-experimental analysis. R.V. Anderson Associates Ltd,
55. http://www.rvanderson.com/resource/2010_papers/Scouring%20Around%20Bridge%20P
iers%20under%20Ice-cover%20Conditions.pdf
56. Raudkivi A J, Ettema R, (1983). Clear water scour at cylindrical piers. Journal of
Hydraulic Engineering, ASCE, 109 (3): 338-350.
57. Richardson E V, Davis S R, (2001). Evaluating scour at bridges. HEC18 FHWA NHI-
001, Federal Highway Administration, US Department of Transportation, Washington, DC.
58. Shen H T, (2010). Mathematical modeling of river ice processes. Cold Regions Science
and Technology, 62:3-13.
59. Shen H W, Schenider V R, Karaki S S, (1969). Local scour around bridge piers. Journal
of Hydraulic Division, ASCE, 95 (6): 1919-1940.

19
60. Sheppard D M, Odeh M, Glasser T, (2004). Large scale clear-water local pier scour
experiments. Journal of Hydraulic Engineering, ASCE, 130(10): 957-963.
61. Sui J, Afzalimehr H, Sammani A K, Maherani M, (2010a). Clear-water scour around
semi-elliptical abutments with armed beds. International Journal of Sediment Research, 25(3):
233-245.
62. Sui J, Faruque M, Balachandar R, (2008). Influence of channel width and tailwater depth
on local scour caused by square jets, Journal of Hydro-environment Research, Vol. 2, pp. 39-45.
63. Sui J, Wang J, He Y, Krol F, (2010b). Velocity profiles and incipient motion of frazil
particles under ice cover. International Journal of Sediment Research, 25(1): 39-51.
64. Tsai W F, Ettema R, (1994). Ice cover influence on transverse bed slopes in a curved
alluvial channel, Journal of Hydraulic Research, 32(4): 561-581.
65. van Rijn L C, (1984a). Sediment transport, part 1: Bed load transport. Journal of
Hydraulic Engineering, 110(10):1431-1456.
66. van Rijn L C, (1984b). Sediment transport, part 2: suspended load transport. Journal of
Hydraulic Engineering, 110(11):1613-1641.
67. Wang, J, Sui J, Karney B, (2008). Incipient motion of non-cohesive sediment under ice
cover – an experimental study. Journal of Hydrodynamics, Vol. 20, No. 1, 117-124.
68. Yang C T, (2003). Sediment Transport, Theory and Practice. KRIEGER PUBLISHING
COMPANY, Malabar, Florida, pp: 90-140.
69. Zhang H, (2005). Study of flow and bed evolution in channels with spur dykes. PhD
Dissertation, Ujigawa Hydraulics Laboratory, Kyoto University, Japan.
70. Zhang H, Nakagawa H, (2008). Scour around spur dikes: recent advances and future
researches. Annuals of Disas. Prev. Res. Inst., Kyoto Univ., No. 51B: 633-652.
71. Zhao M, Cheng L, Zang Z, (2009). Experimental and numerical investigation of local
scour around a submerged vertical circular cylinder in steady currents. Coastal Engineering, 57:
709-721.
72. Zedel L, Hay A E, (2002). A three component bistatic coherent Doppler velocity profiler:
error sensitivity and system accuracy. IEEE, Journal of Oceanic Engineering, 27(3): 717-725.

20
2 METHODOLOGY
The influence of ice cover on local scour is a complex interaction among the ice cover, fluid flow,
sediment, bridge abutment, bed geometry and channel geometry. An ice cover approximately
doubles the wetted perimeter of the river, which increases the flow resistance. In the present
research, two main approaches will be used: experimental method and analytical study.
Experimental study will provide original data of the equilibrium scour depth and profile, which
can be used for developing the empirical formulae of scour depth under ice cover. The incipient
motion is measured and monitored under ice cover. By conducting physical experiments,
dimensional analysis can be employed to determine the effect of ice cover on local scour.
2.1 Theoretical analysis
To predict the location and geometry of local scour in the vicinity of hydraulic structures such as
a bridge abutment and spur dike, theoretical analysis of the bed shear stress and turbulence
properties is necessary.
In open channels, the measured velocity profiles can be used to calculate the following turbulent
flow characteristics: mean velocities in three directions, Reynolds stresses and bed shear stress.
Bed shear stresses can be calculated by using four methods (Acharya, 2011). In the present study,
the turbulent kinetic energy (TKE) method will be used (Biron et al., 2004), which is as follows:
τ = C1[0.5ρ(u′2 + v′2 + w′2)] (2-1)
Here, ρ is the water density, C1=0.19 is a proportionality constant, u’, v’ and w’ are flow velocity
fluctuations in the longitudinal, transverse and vertical directions, respectively.
For the local scour in open channel, a flow resistance calculation leads directly to the estimation
of the shear velocity associated with bed surface drag. To estimate the sediment transport rate
under ice cover, it is first necessary to estimate flow resistance (or a relationship between flow
depth and mean velocity of the flow), and then the flow drag on the bed. To determine the shear
velocity for the incipient motion of sediments, the velocity profile under ice cover has to be
measured.
Ice cover alters mean flow distribution and flow turbulence characteristics. The flow velocity
profile under ice cover can be categorized into an upper portion and lower portion. Divided by

21
the locus of the point of the maximum velocity, the upper portion of flow is mainly affected by
the ice cover and the lower portion of flow is mainly affected by the river bed (Sui et al, 2010b).
The forces acting on a sediment particle under ice cover include hydrodynamic drag, the
hydrodynamic lift and the submerged weight, as shown in Figure 2-1. The drag force FD is in the
direction of flow and the lift force FL is normal to the flow. The drag force FD is associated with
the bed shear stress, while the lift force FL is also associated with FD.
Figure 2- 1 Schematic of force on particle on a sloping bed under ice cover
The shear velocity of approaching flow will be calculated by using the log-law. The critical bed
shear velocity can be determined by using the classical Shields Diagram. If the flow velocity
profiles are available, the bed shear velocity u*C can be calculated by fitting a least squares
regression to flow velocity and distance measurements from near the bed to 20% of the depth
using the following equation (Kuhnle et al. 1999; 2002):
u∗C =du̅
5.75d(log h) (2-2)
in which u̅ is time mean velocity at a distance of h.
The shear Reynolds number will be used here to study the incipient motion of sediment particles.
Re∗ =
u∗CD50
υ (2-3)

22
in which u*C is the bed shear velocity, D50 is the median grain size of sediments and υ is the
kinetic viscosity of water.
The dimensionless shear stress will be calculated by using the following equation: τ∗ =ρu∗C
2
gΔρD50 ,
where Δρ is the difference in mass density between sediment and water, g is the gravity.
In this research, the velocity profile will be measured in the scour hole under simulated ice cover.
Once the velocity profile is acquired, the flow resistance and the bed load sediment transport rate
can be estimated. Thereby, the suspended sediment transport rate could be calculated based on
the bed load transport rate.
2.2 Experimental study
2.2.1 Study site
The experimental research has been conducted at Dr. Max Blouw Quesnel River Research
Center (QRRC), Likely, BC. The QRRC is a University of Northern British Columbia (UNBC)
based research facility. There are six outdoor flow-through spawning channels in the research
center. Each channel has dimensions of 80 meters long, 2 meters wide and 1.3 meters deep. To
conduct the experimental research, one channel was modified as an engineering flume during the
summer of 2011.
2.2.2 Experimental design and construction
In reviewing the literature on experimental local scour research, only a few studies were
conducted in large flumes (Sheppard et al., 2004; Morales et al., 2008). The experimental
research, were conducted in a 2m wide flume, and can be treated as a large scale local scour
experiment. To my knowledge, this is the first large scale experimental research on the local
scour under ice over. A more detailed introduction of the flume will be discussed below.
In 2011, the flume was re-constructed to set up for experimental research. Prior to the
modification, the flume had an upstream section and downstream section, which had a length of
39.5m and 38.2m, respectively. The upstream 39.5m has been modified as a holding tank for the
purpose of keeping a constant discharge during the experiments. The experimental zone is
located in the downstream 38.2m section of the flume. Figure 2-2 shows the modification plan of
the flume at the QRRC.

23
Firstly, to directly observe and record the scour process, two 4m sections of concrete flume wall
were replaced with plexiglass. Since the flume has a width of 2 m, it would be too much to cover
all the flume bed with sand, so two sand boxes were made by elevating the flume bottom by 30
cm. The sand boxes are 0.3 m deep, 2 m wide and 5.6m and 5.8m long respectively. Other parts
of the flume bottom were covered by treated waterproof plywood. Different composition of
sands (d50) were put in the sand box to study the effect of sediment composition on local scour.
To create different velocities, three input valves were connected together which can adjust the
amount of water into the flume. It was measured that this method can produce at least six
velocities for the scour simulation. Because of the cold weather and heavy snow in Likely, a roof
was also constructed to cover the experimental zone away from leaves, snow and wind. The
modification of the flume was finished in November, 2011. Figure 2-3 shows the modification
process of the flume at QRRC.

24
Fig
ure 2
- 2 Th
e mod
ification
plan
for th
e flum
e at QR
RC

25
Figure 2- 3 The modification of flume at QRRC
2.2.3 Measurement apparatus

26
Recently, experimental studies of the local scour have been carried out in laboratory flumes
using Laser visualization techniques, Particle Image Velocimetry (PIV), and Acoustic Doppler
Velocimeter (ADV) to determine the flow field around bridge abutments, piers and spur dikes.
Three dimensional measurements of instantaneous velocity can be used to determine the
turbulent properties and the bed shear stress.
In this research, to measure the flow field in the scour hole around the bridge abutment under ice
cover, the preferred instrument is a SonTek 10MHz Acoustic Doppler Velocimeter (ADV),
which is known for its accuracy, portability, reliability and ease of operation. After the
introduction of ADVs in 1990s, they have been widely used to measure the three dimensional
flow field in turbulent flows (Zhang et al. 2005; Duan et al. 2009). ADV can measure
instantaneous velocities in three dimensions at a given spatial point that can be used to compute
the mean velocity, Reynolds stresses, shear stresses, turbulent kinetic energy and other
parameters. An ADV consists of a down-looking 3D probe which can be installed to measure
instantaneous 3D velocity around the bridge abutment scour hole under ice cover (Figure 2-4).
The ADV will be directly connected to a computer to record the transmitted signal.
Figure 2- 4 The dimension of ADV (left) and the sensor head of a ADV (right)
By using ADV, Dey and Barbhuiya (2005) studied the turbulent flow field and scour hole around
a short abutment. They found that the maximum bed shear stresses were about 3.2 times that of
the incoming flow. Kuhnle et al. (2008) suggested the maximum bed shear stresses to be 3 times

27
that of the incoming flow around a spur dike. These two studies showed similar amplification
factor of the bed shear stresses in open channels. ADV was used in this study to decide the
amplification factor of bed shear stresses under covered conditions.
Another option for measuring approaching velocity is SonTek IQ, which can be used to measure
the 2D velocity in the flume. The SonTek IQ is a monostatic Doppler current meter designed for
water level, velocity and flow measurement in the field. With an accuracy of 1% of measured
velocity, SonTek IQ can be used in the flume to measure the approaching velocity.
2.2.4 Experimental procedures
An equilibrium scour depth can theoretically be defined as the condition when the dimension of
scour hole does not change with time. Various creteria have been proposed in the literature in
order to identify the equilibrium state (Grimaldi, et al., 2009). In this study, the creteria from
Melville and Cheiw (1999) will be used. Namely, the approximate equilibrium state is reached
when the variation of scour depth is less than 5% of the width of bridge abutments or piers. To
be more practical and relevant to practical engineering, non-uniform sand were used in this study.
For non-uniform sediments, an armor-layer should develop on top of the scour hole during
exepriments. The equilibrium creteria from Melville and Chiew (1999) needs further discussion
in this study.
To ensure the repeatabliity of experiments and isolate other uncertanities, procedures were
strictly followed during experiments. However, since the flume is a flow-through type, some of
the parameters, such as water temperature, viscosity can not be controlled. The experimental
procedures are as follows.
1. The bridge abutment model will be put in the middle of Experimental Zone 1 and fixed to the
bottom of the flume. All bridge abutment models here are built by plexiglass to create a clear
view from inside of the abutment model. Then non-uniform sediments type 1 will be put in the
sand box and be leveled with a scraper blade to the same elevation of the false floor. Since the
sediment needs to be re-used, a sediment trap was installed to collect sediment during and after
experiments.
2. Before each test, the flume is filled with water slowly and after the required water depth is
reached, Styrofoam is put on top of the water as a simulated ice cover. Afther the depth is

28
reached, then the experiment is started. In the experimental research, all the abutment models are
non-submerged.
3. In the first 2 hours, the scour depth is measured and scour profile is pictured every 10 min.
After that, the scour depth and profile is measured every 30 min. A constant discharge can be
attained by adjusting the pump in the pump house. The tailgate at the end of flume can be
changed to get a certain approaching flow depth. After 24 hours, the scour depth is measured as
the final depth.
4. When the equilibrium scour depth is reached, the flow is slowly brought to stop and the water
in the flume is drained by gravity. For a better observation of scour hole development, a camera
is put inside of the bridge abutment model to record the scour process.
5. The local scour around bridge abutment in open channels is studied. Smooth cover and rough
cover are created after open channel test. Around abutment models, velocity is measured by a
Acoustice Doppler Velocimeter (ADV) for the real time velocity measurement.
6. After the test for bridge abutment mode, the other abutment model is used to study the
shapefactor on local scour under ice cover. Another two different non-uniform sands are used to
study the impacts of sediment composition on local scour under ice cover. The procedure of tests
is simplified in Figure 2-5.
Figure 2- 5 Releated parameters and Experimental procedure (BA: bridge abutment)
sand & BA
change depth
change cover
change BA type
change d50

29
3 RESULTS AND DISCUSSION

30
3.1 Impacts of ice cover on local scour around semi-circular bridge abutment
The protrusion of a bridge abutment into the main channel creates disturbance and obstruction to
the sediment transport state in the alluvial channel. The flow accelerates and separates at the
upstream face of the abutment which creates a down-flow vortex. The direct result is local scour
around bridge abutment. The vortex system and down-flow, along with the turbulence, are the
main cause of local scour. Essentially, the local scour phenomenon is a dynamic feedback
process between the turbulent flow and bed sediment (Zhang et al. 2009).
Bridge scour has been identified as the most common cause of highway bridge failures and it
accounts for about 60% of all bridge collapses in the United States (Deng and Cai, 2009).
According to Kandasamy and Melville (1998), 6 of 10 bridge failures which occurred in New
Zealand during Cyclone Bola were related to abutment scour.
Investigations of bridge failure due to local scour around bridge abutments have been an
important topic for hydraulic engineers for many years. In 2011, the National Cooperative
Highway Research Program (NCHRP) conducted two reports on the local scour around bridge
foundations (NCHRP 175 and 181, 2011). As reviewed in the report, several commonly used
equations were compared to estimate scour depth around bridge foundations. However, none of
these equations are applicable for the local scour estimation under ice cover.
In the northern region of Canada, rivers can be covered by ice during the winter. Ice cover is a
threat to the safety of a bridge and can cause serious problems around local ecosystems. Ice
cover presents a different set of geomorphological conditions when compared to that of open
flow (Hicks, 2009). The characteristics of flow under ice cover impact the bed-load sediment
transport, traverse and vertical mixing and mean flow velocity (Andre and Thang, 2012).
However, to date, there is still very limited research on the local scour around bridge
infrastructures under ice cover (Ackermann, et al. 2002; Ettema and Daly, 2004; Hains, 2004;
Wang et al. 2008; Munteanu and Frenette, 2010; Sui et al. 2009; Sui et al. 2010). Additionally,
most of the previous studies were conducted in small scale laboratory flumes (0.5m~1.6m wide).
None of these studies were conducted in a large scale flume, which can better simulate the scour
phenomenon around abutments. In the present study, one large scale flume (2m wide, 40m long)
was used to study the local scour around a semi-circular abutment. To fill this gap, the present
chapter was used to investigate the scour pattern and maximum scour depth around a semi-
circular abutment under ice cover.
31
3.1.1 Methodology
Experimental setup
A large flume at the Quesnel River Research Centre, Likely, BC was used. The flume had
dimensions of 40m long, 2m wide, 1.3m deep. The slope of the flume bottom was 0.2%. A
holding tank with a volume of 90m3 was located in the upstream portion to keep a constant
discharge in the experimental zone. At the end of the holding tank, water overflowed from a
rectangular weir to the flume. Figure 3.1-1a shows the semi-circular abutment dimension in the
flume.
Two sand boxes were created in the flume, with a distance of 10.2m from each other. To make
sure the sand box was deep enough for the local scour development, the sand boxes were both
dug to a 30cm depth while other parts of the flume were covered by water treated plywood. The
velocity range in sand box #1 was 0.16~0.26m/s, while in sand box #2, the range was
0.14~0.21m/s. The semi-circular abutment model was made from plexiglass. Three non-uniform
sediments were used with D50s of 0.58mm, 0.50mm, 0.47mm respectively. In the present study,
since ice cover was the main focus, two types of ice cover were created, namely smooth cover
and rough cover. Both types of ice cover were attached in the experimental zone as a fixed ice
cover on top of the water surface (Figure 3.1-1b). The smooth ice cover was the original
styrofoam panels while the rough ice cover was made by attaching small Styrofoam cubes to the
bottom of the smooth cover (Figure 3.1-1c). The cubic pieces had a dimension of 2.5cm × 2.5cm
× 2.5cm. The spacing distance between adjacent cubic pieces is 3.5cm.
(a)

32
(b) (c)
Figure 3.1- 1 Dimensions of abutment, ice cover and rough ice cover used in the experiment
Experiment procedure
The following steps were strictly followed in the experimental study.
(1) Before each experiment, the abutment model was leveled and fixed in the sand box to make
sure the abutment was vertical to the flume bottom. On the outside surface of the abutment,
different measuring lines have been drawn for the purpose of comparing the scour profile at
different locations. In all, 13 measuring lines (P ~ Q) were made along the semi-circular
abutment (Figure 3.1-2).
(2) At the beginning of each experiment, the flume was slowly filled to avoid initial scouring.
After the water depth was reached, the required velocity was applied in the flume.
(3) In front of each sand box, a SonTek IQ was installed to measure the approaching flow
velocity and water depth during the experiment. A 10 Hz SonTek ADV was used to measure the
velocity in front of the abutment. An adjustable tailgate was installed at the end of flume to

33
change the water depth. Table 3.1-1 summarizes the experimental conditions for each flume
experiment.
(4) After 24 hours, the flume was drained slowly. The scour depth was measured manually along
the outside lines of the semi-circular abutment. In all, 27 experiments have been carried out.
Some of the data can be found in Table 3.1-1.
Figure 3.1- 2 Measuring points along the semi-circular abutment
3.1.2 Results and discussion
Local Scour pattern
At the end of each experiment, the local scour was manually measured (Figure 3.1-3). The
distance from the abutment outside surface to the boundary of scour hole was measured. The
sediment deposition ridges around the abutment can be seen from Figure 3.1-3. The contour of
the local scour hole was mapped in the local coordinate system by Surfer 10, Golden Software.
Based upon the contour mapping, both the volume of the scour hole and the scour area were
calculated (Table 3.1-1).

34
Figure 3.1- 3 The local scour around the abutment and the measurement of the scour
Due to the narrowing effect created by the abutment, we noticed stronger flow turbulence in the
experimental zone. When the velocity in the channel was increased, sediment in the toe areas of
the abutment was eroded most quickly.
Table 3.1- 1 Experimental running condition summary
D50 (mm) Cover
condition Depth (m)
V
(m/s)
Scour volume
(cm3)
Scour area
(cm2)
0.58
open 0.19 0.23 1433.09 1009.79
open 0.07 0.26 570.46 782.08
smooth 0.07 0.23 273.33 466.68
smooth 0.19 0.20 696.74 907.55
smooth 0.07 0.20 165.88 494.57
rough 0.07 0.20 238.63 540.96
rough 0.19 0.20 459.50 376.34
rough 0.07 0.22 1127.69 715.74
0.47
open 0.19 0.23 19095.9 3335.68
open 0.07 0.26 16847.2 3401.70
smooth 0.07 0.23 6520.80 1895.73
smooth 0.19 0.20 5856.95 1758.72
smooth 0.07 0.20 187.58 213.61
Flow direction

35
rough 0.07 0.20 565.81 469.97
rough 0.19 0.20 13986.9 3020.83
rough 0.07 0.22 3224.38 1150.13
0.50
open 0.19 0.23 4140.53 1902.96
open 0.07 0.26 6295.62 2751.83
smooth 0.07 0.23 5146.66 2170.39
smooth 0.19 0.20 5644.58 2600.00
smooth 0.07 0.20 617.76 765.52
rough 0.07 0.20 481.45 507.46
rough 0.19 0.20 2190.03 881.93
rough 0.07 0.22 10006.2 3367.77
Three different non-uniform sediments were used here. During the scouring process, relatively
fine particles moved first and sediment in the scour hole was gradually coarsened. An armor
layer formed on the surface of the scour hole which prevented the scour hole from scouring
further. After 24h, the armor layer covered the whole area around the bridge abutment. After
each experiment, sediment samples were collected at different locations around the abutment.
We noticed that at the location from G to I, a secondary scour hole was also developed around
the abutment.
The scour hole pattern and geometry around the semi-circular abutment exhibits features similar
to those found by Zhang et al. Due to the existence of a primary vortex and wake vortex
downstream of the abutment, as well as their interaction, the geometry of the scour area in the
upstream is significantly different from that in the downstream. The primary vortex is
responsible for the scour hole development, which is analogous to the well-known horseshoe
vortex in front of bridge piers (Melville, 1992). At the upstream of the abutment, an obvious
scour hole formed while a fine sediment deposition ridge can be seen in the downstream.

36
Figure 3.1- 4 The scour profiles around the abutment under different cover conditions
(D50=0.50mm)
Figure 3.1-4 shows the contour map plotted under different flow cover conditions with the
sediment D50=0.50mm. It can be noted that the maximum scour depth around the semi-circular
abutment is located at the upstream surface of the abutment. Additionally, with a decrease in
sediment size, maximum scour depth increases correspondingly. Our experiments confirm with
the conclusion drawn by Ettema (Ettema et al. 2010) that the reductions in the scour depth for
large sediment were due to large particles impeding the erosion process inside of the scour hole

37
and dissipating some of the flow energy in the erosion area. This is particularly correct for the
non-uniform sediment erosion around bridge abutment. Moreover, for the same bed sediment
under the same flow condition, ice cover results in a larger maximum scour depth.
Figure 3.1-4 also indicates that the scour pattern in the vicinity of the abutment under ice covers
were similar to that in open channels. Under a rough ice cover, due to the effect of the ice cover,
the scour depth was increased.
Scour profiles along the abutment
To date, no research has been undertaken for plotting scour profiles along the abutment under ice
cover. Hence, scour profiles along the abutment border (From P to Q, refer to Figure 3.1-2) were
plotted to show the elevations changing along the semi-circular abutment. Figure 3.1-5a shows
the variation in scour depth with different bed sediments under the same flow conditions. Figure
3.1-5b is the cross section of local scour under different conditions. The following points are
noted from the figures:
(a) For all the cross sections, it can be found that the maximum scour depth is located close to E,
60º from the flume wall. This is believed to be caused by the primary vortex, which originates at
the upstream of the abutment (Dey and Barbhuiya, 2005). The primary vortex is forced by the
velocity to drift towards the side of the semi-circular abutment. From Dey’s research (2005) on
clear water scour, they mentioned that the velocity and scour depth become maximum at 90º to
the flume wall. However, from the experimental data, the maximum scour depth happened not at
90º but rather at 60º from the flume wall. This may be due to the non-uniform sediment used in
the present research. The locations of maximum scour depth with or without ice cover were all
around 60º from the flume wall. A greater number of experiments in ice covered channels will
improve the estimation of maximum scour location around the semi-circular abutment.
(b) Moreover, the authors noted that there was a sudden increase in the bed elevation from G to
H, which corresponds to the second scour hole noted from the contour diagram. In the literature
the second scour hole has been given little attention because of its relatively shallow scour depth
compared to the primary scour hole. However, it may explain the migration of the primary
vortex flow along the abutment to the downstream, which may explain the downstream wake
vortex. Although the reason for the sudden increase in elevation was not clear, one can still note

38
from Figure 3.1-5 that the upstream surface has a steeper slope (from P to F). The local slope of
the scour hole in the downstream (from F to K) is smaller than that in the upstream.
Unfortunately, there is no clear trend showing the changes of upstream slope corresponding to
the change in bed sediments D50. It is also noted the same results were found by Zhang et
al.(2009) on the local scour around the spur dikes in open channels.
(c) The ice cover had a strong impact on the scour depth around the abutment. As shown in
Figure 3.1-5b, under rough ice covered conditions, the maximum scour depth increased
significantly compared to that in open channel and smooth ice cover. From our understanding,
the turbulence caused by rough ice cover moves the maximum velocity closer to the bed
compared to that by smooth ice cover, which can be attributed to the deeper scour in the vicinity
of the abutment. However, as expected, there were some inaccuracies of the cross section plot
due to the limitation of the measurement and profile.

39
(a)
(b)
Figure 3.1- 5 (a) Cross-section along the semi-circular abutment (D50=0.50mm); (b) Cross-section
along the semi-circular abutment under smooth and rough cover (D50=0.50mm)
Scour volume and scour area
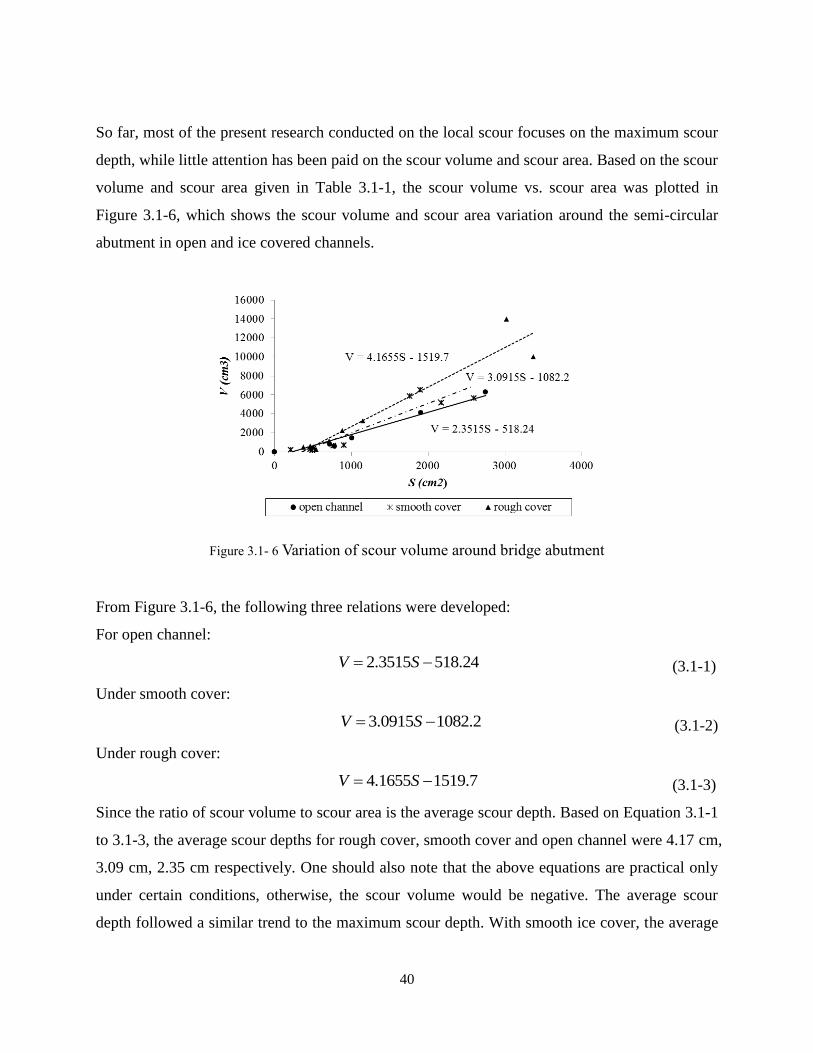
40
So far, most of the present research conducted on the local scour focuses on the maximum scour
depth, while little attention has been paid on the scour volume and scour area. Based on the scour
volume and scour area given in Table 3.1-1, the scour volume vs. scour area was plotted in
Figure 3.1-6, which shows the scour volume and scour area variation around the semi-circular
abutment in open and ice covered channels.
Figure 3.1- 6 Variation of scour volume around bridge abutment
From Figure 3.1-6, the following three relations were developed:
For open channel:
24.5183515.2 SV (3.1-1)
Under smooth cover:
2.10820915.3 SV (3.1-2)
Under rough cover:
7.15191655.4 SV (3.1-3)
Since the ratio of scour volume to scour area is the average scour depth. Based on Equation 3.1-1
to 3.1-3, the average scour depths for rough cover, smooth cover and open channel were 4.17 cm,
3.09 cm, 2.35 cm respectively. One should also note that the above equations are practical only
under certain conditions, otherwise, the scour volume would be negative. The average scour
depth followed a similar trend to the maximum scour depth. With smooth ice cover, the average
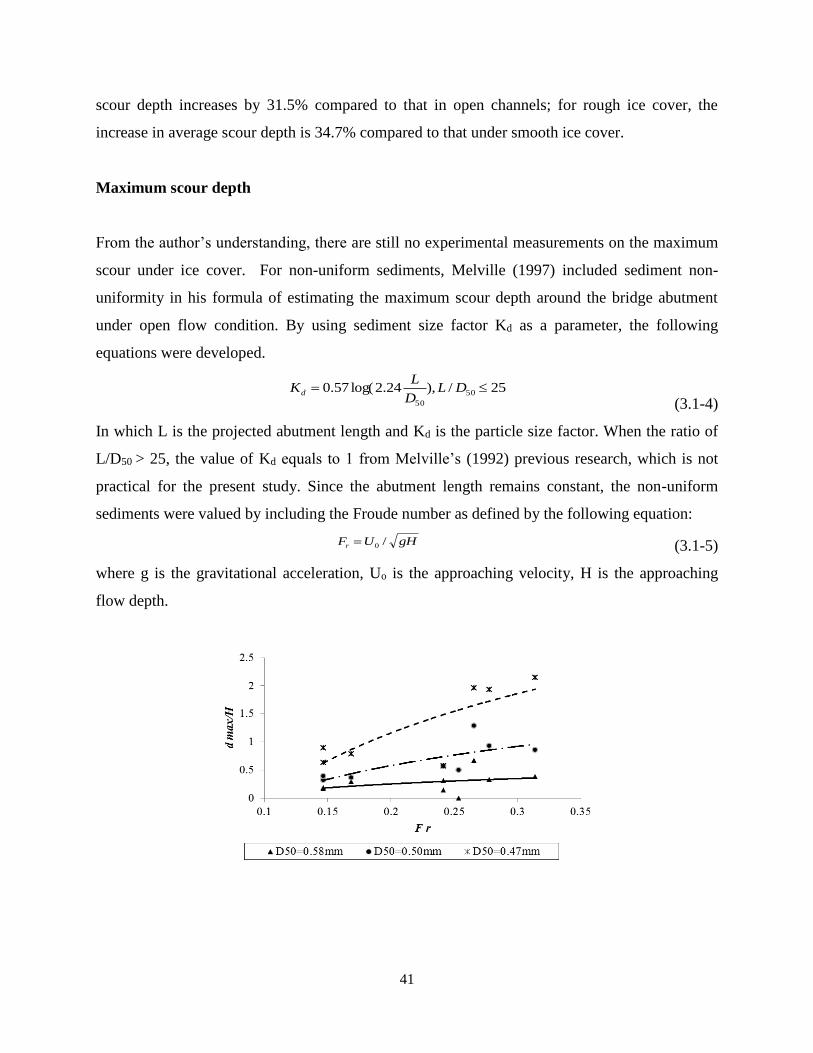
41
scour depth increases by 31.5% compared to that in open channels; for rough ice cover, the
increase in average scour depth is 34.7% compared to that under smooth ice cover.
Maximum scour depth
From the author’s understanding, there are still no experimental measurements on the maximum
scour under ice cover. For non-uniform sediments, Melville (1997) included sediment non-
uniformity in his formula of estimating the maximum scour depth around the bridge abutment
under open flow condition. By using sediment size factor Kd as a parameter, the following
equations were developed.
25/),24.2log(57.0 50
50
DLD
LKd
(3.1-4)
In which L is the projected abutment length and Kd is the particle size factor. When the ratio of
L/D50 > 25, the value of Kd equals to 1 from Melville’s (1992) previous research, which is not
practical for the present study. Since the abutment length remains constant, the non-uniform
sediments were valued by including the Froude number as defined by the following equation:
gHUFr /0 (3.1-5)
where g is the gravitational acceleration, Uo is the approaching velocity, H is the approaching
flow depth.
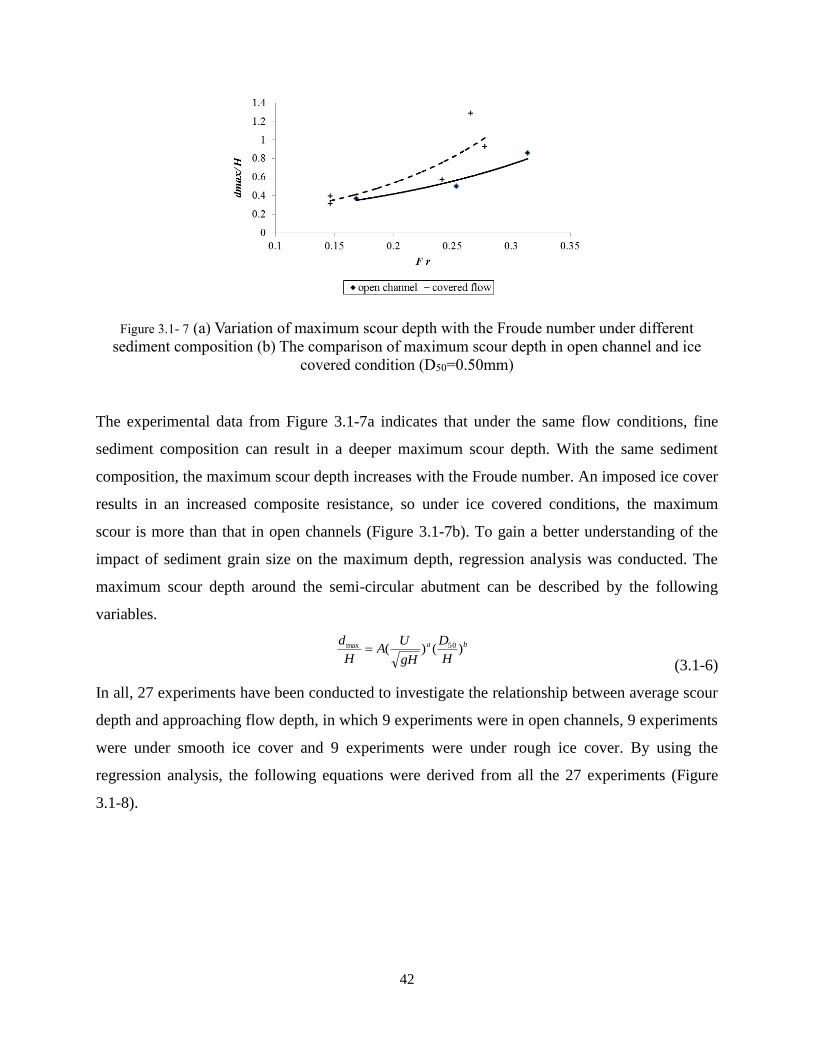
42
Figure 3.1- 7 (a) Variation of maximum scour depth with the Froude number under different
sediment composition (b) The comparison of maximum scour depth in open channel and ice
covered condition (D50=0.50mm)
The experimental data from Figure 3.1-7a indicates that under the same flow conditions, fine
sediment composition can result in a deeper maximum scour depth. With the same sediment
composition, the maximum scour depth increases with the Froude number. An imposed ice cover
results in an increased composite resistance, so under ice covered conditions, the maximum
scour is more than that in open channels (Figure 3.1-7b). To gain a better understanding of the
impact of sediment grain size on the maximum depth, regression analysis was conducted. The
maximum scour depth around the semi-circular abutment can be described by the following
variables.
ba
H
D
gH
UA
H
d)()( 50max
(3.1-6)
In all, 27 experiments have been conducted to investigate the relationship between average scour
depth and approaching flow depth, in which 9 experiments were in open channels, 9 experiments
were under smooth ice cover and 9 experiments were under rough ice cover. By using the
regression analysis, the following equations were derived from all the 27 experiments (Figure
3.1-8).

43
Figure 3.1- 8 Dependence of maximum scour depth on related variables
For open channel:
2734.0)()(102.4 4.2501.53max
H
D
gH
U
H
d
(3.1-7)
For smooth cover:
4433.0)()(102.8 4.2501.53max
H
D
gH
U
H
d
(3.1-8)
For rough cover:
6490.0)()(100.13 4.2501.53max
H
D
gH
U
H
d
(3.1-9)
As reported by Sui et al. (2010), with an increase in velocity and particle size, the maximum
scour depth will increase. In the present research, regarding the local scour around the semi-
circular abutment, the rough ice cover causes the largest average scour depth compared to those
under both smooth ice cover and open channel. Hence, we compared the maximum scour depth
under different flow conditions and with different composition of bed sediments. It is interesting
to note that the geometric characteristics of the local scour depend mainly on the approaching
flow velocity, bed sediment grain size as well as the cover condition.
From Figure 3.1-8 and Equation 3.1-7 to 3.1-9, the impact of sediment distribution is studied. To
study the impact of ice cover roughness on the local scour development around the semi-circular
abutment, the following dimensional variables under covered flow were considered:

44
c
b
iba
n
n
H
D
gH
UA
H
d)()()( 50max
(3.1-10)
where ni is the ice cover roughness and nb is the channel bed roughness. According to the
Hydraulic Design Handbook (1999), in an un-vegetated alluvial channel, the total roughness nb
consists of two parts. One is grain roughness (n’) which is resulting from the size of the particle
and the other is skin roughness (n’’) because of the existence of the bed forms. The total
roughness can be expressed as:
,,, nnn (3.1-11)
However, there is no reliable method of estimating n’’, so in the present research, the grain
roughness was used as the channel bed roughness in the analysis. For mixtures of bed material
with significant portions of coarse-grain sizes, the following equation from Hager (1999) was
used.
6/1
50
, 039.0 Dn (3.1-12)
Ice cover presence alters the mean flow distribution and flow turbulence characteristics. For
smooth ice cover, because the styrofoam panel has a relatively smooth concrete-like surface, by
referring the Mays (1999), the value of 0.013 was adapted. The roughness of the ice cover was
changed by attaching small cubes with dimensions of 2.5cm×2.5cm×2.5cm with a distance
3.5cm from each other. By using the results of discharge measurements through the ice and
supporting field data related to the observed characteristics of the underside of the ice cover,
Carey (1966) calculated Manning roughness coefficient was between 0.01~0.0281. From his
calculation, a constant roughness of 0.0251 was used for the winter period. Li (2012) reviewed
several methods to calculate the Manning’s coefficient for ice cover, the following equation can
be used depending on the size of the small cubes.
6/1039.0 si kn (3.1-13)
In which ks is the average roughness height of the ice underside. So in the present research, the
roughness coefficient was calculated as 0.021, which is also in the range of Carey’s calculation.
By using the regression analysis, the following empirical equation was developed:
0511.0)()()(100.3 07.185.45056.95max
b
i
n
n
H
D
gH
U
H
d
(3.1-14)

45
Figure 3.1- 9 Dependence of maximum scour depth on related variables under ice cover
The correlation between maximum scour depth and above three variables is worth mentioning
because as indicated in Figure 3.1-9 the regression relationship is strong. Meanwhile, it is also
confirmed that the hypothesis for calculation of the ice cover roughness is correct. One can also
note that, under the condition of same flow and bed material, the maximum scour depth under
rough ice cover is deeper than that under smooth ice cover. However, under the same flow and
cover condition, since the index for D50 is negative (-4.85), with the decreasing in sediment grain
size, the maximum scour depth will increase. With the same bed material and covered condition,
the approaching velocity has a positive impact on the maximum scour depth.
To apply this empirical equation in the hydraulic engineering field, the authors assume that
during the winter the ice cover can be treated as smooth. While in early spring, with the ice
breaking up and ice jamming processes, the ice cover can be treated as rough therefore
increasing the flow velocities and increasing the local scour around bridge foundations. In this
case, the sediment transport increases and the safety of bridge infrastructures will be threatened.
One can note from Equation 3.1-14 that, in the same river, with the increase in ice cover
roughness, the maximum scour depth increases. During the ice break up period in spring time,
due to the accumulation of small ice chunks under side, local bridge scour should be monitored.
Compared to the research of armor layer development in the paper from Sui et al. (2010), the
approaching water depth had a stronger impact on the maximum scour depth compared to

46
approaching velocity in open channels. However, for ice covered flow, the authors found that
approaching velocity has a stronger impact compared to that of the approaching water depth.
One drawback regarding the proposed empirical equation is that roughness of only two ice
covers were tested.
3.1.3 Conclusion
Experiments have been conducted in a large scale flume to study the impact of ice cover
roughness and non-uniform sediment on the local scour around semi-circular abutments. The
location of the maximum scour depth along the abutment is 60º from the flume wall. We noticed
that the downstream slope in the scour hole is smaller compared to that in the upstream. In this
research, the Froude number was also used to investigate the impacts of non-uniform sediment
composition on local scour. The scour volume and scour area were calculated and compared to
open channel, smooth and rough cover conditions. Under ice cover, the average scour depth was
always greater compared to that in open channels. The average scour depth under rough ice
cover was 35% greater than that under smooth ice cover. By using dimensional analysis, an
empirical equation of the maximum scour depth was developed. The equation indicated that with
an increase in sediment grain size, the maximum scour depth decreased correspondingly. In
conclusion, ice cover roughness plays an important role for the maximum scour depth
development.
References
1. Ackermann N L, Shen H T, Olsson P, Local scour around circular piers under ice covers
[C]. Proceeding of the 16th IAHR International Symposium on Ice, International Association of
Hydraulic Engineering Research, Dunedin, 2002, New Zealand.
2. Andre R, Thang T, Mean and turbulent flow fields in a simulated ice-cover channel with
a gravel bed: some laboratory observations [J]. Earth Surface Processes and Landforms,
2012,Vol. 37, pp: 951-956.
47
3. Carey K, Observed configuration and computed roughness of the underside of river ice St
Croix river Wisconsin [J], Geological Survey Professional Paper, 1966, Vol. 550, Part 2, pp.
B192-B198.
4. Deng L, Cai C S, Bridge scour: prediction, modeling, monitoring, and countermeasures-
Review [J]. Practice Periodical on Structural Design and Construction, 2009, 15(2):125-134.
5. Dey S, Barbhuiya A K, Turbulent flow field in a scour hole at a semicircular abutment [J],
Canadian Journal of Civil Engineering, 2005, Vol. 32, pp. 213-232.
6. Ettema R, Daly S, Sediment transport under ice. ERDC/CRREL TR-04-20. Cold regions
research and Engineering Laboratory, 2004, US Army Corps of Engineers.
7. Ettema R, Natako T, Muste M, Estimation of scour depth at bridge abutments, NCHRP
24-20, 2010, The University of Iowa, USA.
8. Hager W H, Wastewater Hydraulics [M]. Berlin: Springer-Verlag, 1999.
9. Hains D B, An experimental study of ice effects on scour at bridge piers [C]. PhD
Dissertation, 2004, Lehigh University, Bethlehem, PA.
10. Hicks F, An overview of river ice problems [C] CRIPE 07 guest editorial Cold regions
Science and Technology, 2009, 55: pp. 175-185.
11. Kandasamy J K, Melville B W, Maximum local scour depth at bridge piers and
abutments [J]. J Hydraul. Res. 1998, 36:183-197.
12. Li S S, Estimates of the Manning’s coefficient for ice covered rivers [J], Water
Management, Proceedings of the Institution of Civil Engineers, 2012, Vol. 165, Issue WM9, pp.
495-505.
13. Mays L W, Hydraulic Design Handbook [M], MaGraw-Hill, 1999, pp. 3.12.
14. Melville B W, Local Scour at bridge abutments [J]. Journal of Hydraulic Engineering,
ASCE, 1992, Vol.118 (4), pp. 615-631.
15. Melville B W, Pier and Abutment scour: integrated approach [J], Journal of Hydraulic
Engineering, 1997. ASCE, Vol 123(2): 125-136.
16. Munteanu A, Frenette R, Scouring around a cylindrical bridge pier under ice covered
flow condition-experimental analysis, R V Anderson Associates Limited and Oxand report, 2010.
17. NCHRP Web-only Document 175, Evaluation of Bridge- Scour Research: Pier scour
processes and predictions. 2011, NCHRP Project 24-27(01).

48
18. NCHRP Web-only Document 181, Evaluation of Bridge-Scour Research: Abutment and
Contraction Scour Processes and Prediction. 2011, NCHRP Project 24-27(02).
19. Sui J, Faruque M A A, Balanchandar R, Local scour caused by submerged square jets
under model ice cover [J]. Journal of Hydraulic Engineering, ASCE, 2009, Vol 135 (4), pp. 316-
319.
20. Sui J, Wang J, He Y, Krol F, Velocity profile and incipient motion of frazil particles
under ice cover [J]. International Journal of Sediment Research, 2010, Vol 25(1), pp. 39-51.
21. Sui J, Afzalimehr H, Samani A K, Maherani M, Clear-water scour around semi-elliptical
abutments with armored beds [J]. International Journal of Sediment Research, 2010, Vol. 25, No.
3, pp. 233-244.
22. Wang J, Sui J, Karney B, Incipient motion of non-cohesive sediment under ice cover – an
experimental study [J]. Journal of Hydrodynamics, 2008, Vol 20(1), pp. 177-124.
23. Zhang H, Nakagawa H, Kawaike K, Baba Y, Experimental and simulation of turbulent
flow in local scour around a spur dike [J]. International Journal of Sediment Research, 2009, Vol.
24, No. 3, pp. 33-45.
49
3.2 Local scour around bridge abutments under ice covered condition: comparing of
square abutment and semi-circular abutment
Local scour is the engineering term used to describe sediment removal around hydraulic
structures by running water. It may result in bridge failures as it can undermine piers and
abutments that support bridges. The Federal Highway Administration has estimated that over 60%
of bridge collapses in the US was from local scour. Luigia et al. (2012) indicated that
approximately 50 to 60 bridges fail on average each year in the US. A worldwide survey also
indicated that, the main cause of bridge collapse is natural hazards, among which flooding and
scour is responsible for around 60% of the failures (Imhof, 2004).
An important consideration in bridge abutment design is to estimate the maximum scour to make
sure the bridge foundation can be built deep enough to avoid the possibility of undermining. In
the past few decades, local scour around bridge abutments and piers in open channels has
received wide attention and many scholars have conducted various studies on this topic (Laursen
and Toch, 1956; Froehlich, 1989; Melville, 1997; Coleman et. al., 2003; Dey 2005; etc.). To
estimate the maximum scour depth, several formulae have been developed. As reviewed by
NCHRP in 2011, five major dimensionless parameter groups are classified for the scour depth
estimation formulae.
The first group is Flow and Sediment, which indicates flow interaction with sediment and can be
used to classify clear-water or live-bed scour. The second group is Abutment and Sediment scale,
which is related to the degree of model scaling. The third group is Abutment and Flow geometry,
which will measure abutment dimensions relative to the scale of flow field. The fourth group is
Abutment Flow distribution, which is the discharge per unit width in the approach and contracted
sections. The fifth group is Scour and Geotechnical Failure, which is the scour that leads to the
slope instability which is difficult to model in the laboratory.
The five groups listed above include almost all the variables in the local scour estimation
formulae around bridge abutments. However, in the northern areas, ice cover is an issue because
it can stay as long as 5 months on some rivers. Ice cover can result in many problems such as ice
jamming, flooding, restricting the generation of hydro-power, block river navigation and affect
the ecosystem balance (Hicks, 2009). Moreover, ice cover can also significantly change the flow
field and change the flow properties around bridge foundations, such as velocity profile, bed
shear stress distribution, mixing properties, and sediment transport (Lau and Krishnappan, 1985).

50
Ettema et al. (2000) developed a method to estimate the sediment transport in ice covered
channels. Sui et al. (2000) derived interrelationships of suspended sediment concentrations and
riverbed deformation under ice cover in Hequ Reach of Yellow River. Some other researches on
the sediment transport and scour under ice including: Ettema and Daly, (2004); Hains and
Zabilansky, (2004); Wang et al. (2008). However, to date there is limited research on the local
scour around bridge structures under ice cover (Ackermann et al., 2002; Hains, 2004; Sui et al.,
2009; Sui et al., 2010a; Sui et al., 2010b). To fill this gap, a series of experiments were
conducted to find the parameter that can describe the ice cover impact on the scour depth.
3.2.1 Experimental setup
Based on the previous review of local scour around bridge abutments, flume experiments were
designed to evaluate the impacts of ice cover on scour depth. The following three hypotheses
were tested in this research.
Hypothesis 1: Shape factor of abutments
Bridge abutments are designed in different sizes and shapes. The shape factor is important in
abutment local scour estimation. According to Melville (1992), the effect of shape can be
expressed using a shape factor Ks. In open channels, the shape factor for square abutment is 1.0
and for semi-circular one is 0.75. The shape factor was examined under ice covered conditions.
Hypothesis 2: Non-uniform sediment
Most of the existing work on local scour focuses on uniform sediments in small laboratory
flumes with very few studies that look at non-uniform sediments. However, a more practical
problem for engineers is that natural riverbeds are normally non-uniform. Three non-uniform
different sediments were used in this study to see the scour contour and sediment deposition. The
maximum scour depths from different non-uniform sediments were also compared.
Hypothesis 3: Ice cover roughness impact
Since the roughness of the ice cover impacts the velocity distribution in the water regime. In this
research, two different types of ice cover were created, namely smooth cover and rough cover.
The maximum scour depths under different covers were compared.
Experimental design

51
Experiments were carried out in an outdoor flume in 2012. The flume is 40m long, 2m wide and
1.3m deep. The slope of the concrete bottom is 0.2%. Figure 3.2-1(a) shows the flume geometry
and design. Two abutment models were made from Plexiglass to permit observation of the scour
process during experiments. The dimensions of the abutment can be found in Figure 3.2-1(b).
A holding tank with a volume of 90m3 was created upstream of the flume. Two valves to adjust
flow rate were connected to the holding tank. The flow depth can be adjusted by the tailgate at
the end of the holding tank. Two sand boxes were created to simulate riverbed, with a distance
10.2m from each other. Each sand box can have 30cm depth of sediment (Figure 3.2-2). The
velocity range in Sand box 1 is from 0.16 to 0.26m/s, while the velocity range in Sand box 2 is
between 0.14 and 0.21m/s.
(a)

52
(b)
Figure 3.2- 1 (a) The plan and vertical view of the modified flume; (b) The coordinate system and
abutments dimensions
Ice cover was simulated by using styrofoam which was fixed around the abutment model to
simulate fixed ice cover. To investigate the impacts of ice cover roughness on the maximum
scour depth of the scour hole, two types of ice cover were made. Smooth cover was the original
Styrofoam. The rough cover was modified by attaching small cubic pieces of Styrofoam to the
underside of smooth ice cover. All cubic pieces had the following dimensions: 2.5cm × 2.5cm ×
2.5cm. The spacing distance between adjacent cubic pieces is 3.5cm (Figure 3.2-2).
Experiment procedure
Before each experiment, the abutment was installed vertically in the sand box against flume wall.
Then the sand box was leveled to maintain the same elevation with false flume floor. At the
beginning of each experiment, the flume was slowly filled with water by adjusting the valve in
the holding tank. After the required water depth was reached, the valves were fully opened to

53
start the experiment. The running time for each experiment is at least 24h, which was enough for
the maximum scour depth development in large scale flumes from the author’s observation.
In front of each sand box, a SonTek IQ was installed to measure the mean approaching velocity
and flow depth. A 10 MHz SonTek Acoustic Doppler Velocimeter (ADV) was applied to
measure the instantaneous velocity in the scour hole around the abutment at different locations
and elevations. After all the velocity measurement was completed, the flume was drained
completely and the scour hole was measured. In this section, Surfer 10 was used for contour
plotting, which can also provide 3D plotting of the scour profile.
(a) (b)
Figure 3.2- 2 (a) Inside view of the flume; (b) Rough ice cover used in the research
One of the main objectives of this research was to compare the maximum scour depth around
abutment under different flowing conditions. Herein, the flow depth and approaching velocity
are the main available variables. To change the water depth, the adjustable tailgate can be used.
Under the same water depth, by adjusting the valve in the holding tank, different approaching
velocities can also be acquired. Three different sediments were used to simulate the real local
scour in the flume. The D50s are 0.58mm, 0.50mm, 0.47mm respectively. The geometric standard
deviations (σg) were all larger than 1.4, which can be categorized as non-uniform sediment. In all,
36 experiments were carried out under ice cover and 18 experiments under open flow condition
were also conducted. Table 3.2-1 summarizes the experimental conditions for each experiment.

54
Table 3.2- 1 Summary of running conditions
Abutment
type
Cover
condition
D50
(mm)
Running
time (h)
Flume
width
(m)
Water
depth
(m)
Approaching
velocity
(m/s)
square open 0.58 24 2 0.07 0.26
square open 0.58 24 2 0.07 0.21
square open 0.58 24 2 0.19 0.21
semicircular open 0.58 24 2 0.07 0.21
semicircular open 0.58 24 2 0.19 0.23
semicircular open 0.58 24 2 0.07 0.26
semicircular smooth 0.58 24 2 0.07 0.23
semicircular smooth 0.58 24 2 0.19 0.20
semicircular smooth 0.58 24 2 0.07 0.20
square smooth 0.58 24 2 0.07 0.20
square smooth 0.58 24 2 0.19 0.16
square smooth 0.58 24 2 0.07 0.23
square rough 0.58 24 2 0.07 0.22
square rough 0.58 24 2 0.07 0.20
square rough 0.58 24 2 0.19 0.14
semicircular rough 0.58 24 2 0.07 0.20
semicircular rough 0.58 24 2 0.19 0.20
semicircular rough 0.58 24 2 0.07 0.22
square open 0.47 24 2 0.07 0.26
square open 0.47 24 2 0.07 0.21
square open 0.47 24 2 0.19 0.21
semicircular open 0.47 24 2 0.07 0.21
semicircular open 0.47 24 2 0.19 0.23
semicircular open 0.47 24 2 0.07 0.26
semicircular smooth 0.47 24 2 0.07 0.23

55
semicircular smooth 0.47 24 2 0.19 0.20
semicircular smooth 0.47 24 2 0.07 0.20
square smooth 0.47 24 2 0.07 0.20
square smooth 0.47 24 2 0.19 0.16
square smooth 0.47 24 2 0.07 0.23
square rough 0.47 24 2 0.07 0.22
square rough 0.47 24 2 0.07 0.20
square rough 0.47 24 2 0.19 0.14
semicircular rough 0.47 24 2 0.07 0.20
semicircular rough 0.47 24 2 0.19 0.20
semicircular rough 0.47 24 2 0.07 0.22
square open 0.50 24 2 0.07 0.26
square open 0.50 24 2 0.07 0.21
square open 0.50 24 2 0.19 0.21
semicircular open 0.50 24 2 0.07 0.21
semicircular open 0.50 24 2 0.19 0.23
semicircular open 0.50 24 2 0.07 0.26
semicircular smooth 0.50 24 2 0.07 0.23
semicircular smooth 0.50 24 2 0.19 0.20
semicircular smooth 0.50 24 2 0.07 0.20
square smooth 0.50 24 2 0.07 0.20
square smooth 0.50 24 2 0.19 0.16
square smooth 0.50 24 2 0.07 0.23
square rough 0.50 24 2 0.07 0.22
square rough 0.50 24 2 0.07 0.20
square rough 0.50 24 2 0.19 0.14
semicircular rough 0.50 24 2 0.07 0.20
semicircular rough 0.50 24 2 0.19 0.20
semicircular rough 0.50 24 2 0.07 0.22

56
3.2.2 Results and discussion
During the scouring process, a primary vortex was observed in the upstream surface of the
square abutment associated with a down flow inside the scour hole in vertical directions. This
vortex is formed inside of the scour hole due to the negative stagnation pressure gradient of
approaching flow, which explained the location of the maximum scour depth around square
abutment. While for the semi-circular abutment, the vertical component of the downward flow is
similar to the horseshoe vortex around bridge piers. Values of local flow velocity and bed shear
stress increase around the side of the abutment. As reported by Melville (1997), for circular
bridge piers, the increases in bed shear velocity that cause the scour occurs at the side of the pier.
A similar scouring location was found around the semi-circular abutment in the present research.
The maximum scour depth is located around 45 degrees from the flume wall in our cases.
(a)
(b)

57
(c)
Figure 3.2- 3 Typical local scour profiles around the square abutment and semicircular abutment
The local scour was mapped and contoured by Surfer 10, Golden Software as shown in Figure
3.2-3. Typical scour patterns around square and semi-circular abutments under different covered
conditions were mapped. Figure 3.2-3(a) shows the contours in open channels, Figure 3.2-3(b)
and Figure 3.2-3(c) shows the contours under smooth and rough ice cover, respectively.
It can be observed that for both types of abutments, the maximum scour depth occurs in the
upstream side facing the approaching flow. Around square abutment, there is another relatively
smaller scour hole in the corner that faces downstream. For semi-circular abutment, the
maximum scour depth is located at the corner which is 45~60 degrees facing upstream. The
locations of the maximum scour depth are independent on the covered condition. While for the
dimensions of the scour hole, ice cover has an obvious impact. In open channels, around the
square abutment, the scour hole has a smaller slope compared to the scour holes under ice
covered condition. It is also interesting to note that around semi-circular abutment, the area of
scour hole under the cover is larger than that from open channels. With the increase in ice cover
roughness, the scouring area increases correspondingly. Around the square abutment, the scour
hole keeps a similar pattern with or without ice cover. While for semi-circular abutment, the
scour hole under ice cover is larger than that from smooth cover and open channel. Figure 3.2-
3(c) also shows a larger deep-scouring area around semi-circular abutment under a rough ice
cover.

58
An analysis on the densimetric Froude number was completed in order to investigate the impact
of abutment shape on maximum scour depth. To do this, the densimetric Froude number (Fo) was
calculated by using the following,
50)/(/ DgUF oo (3.2-1)
In which, g is the gravitational acceleration, Uo is the approaching velocity, ρ is the mass density
of water while the Δρ is mass difference between sediment and water. D50 is the median grain
size of sediments.
Figure 3.2- 4 The variation of maximum scour depth with abutment model
Overall, 54 maximum scour depth were plotted in Figure 3.2-4, in which 27 were from a square
abutment and 27 from a semi-circular abutment. Figure 3.2-4 shows the difference in maximum
scour depth between the two types of abutments under different flow conditions. From Melville’s
previous research (Melville, 1992), the shape factor for square abutment in open channels is 1.0,
while for the abutment with a semi-circular head the value is 0.75. Our data indicate that under
covered conditions, the shape factor for semi-circular abutment is smaller than that in open
channels. With an increase in ice cover roughness, the value of shape factor decreases.
For square abutment, the following relationship is found between the dimensionless scour depth
dmax/h and densimetric Froude number Fo:
4296.29937.20141.1 2max oo FF
h
d
(3.2-2)

59
For semi-circular abutment, the relation is:
1331.11305.02864.0 2max oo FFh
d
(3.2-3)
The two equations can also be written as:
)(1
maxoFf
h
d
(3.2-4)
)(2
maxoFf
h
d
(3.2-5)
Here, the range of Fo is 1.3 ~3.0, meanwhile f1(1.3) > f2(1.3) and f1(3) > f2(3). It is also important
to notice that under the same densimetric Froude number condition, the maximum scour depth in
the vicinity of square abutment is much larger than that around the semi-circular abutment.
Another important consideration here is to include D50 in the relationship between dmax and Fo.
By including the median sediment grain size, the connection between flow and sediment can be
built under ice covered flow for both abutments. The data and fitting curve from Figure 4 has
further strengthened the hypothesis that ice cover has a stronger impact on the maximum scour
depth than shape factor of the abutment.
The maximum scour depth with three different bed sediments are compared in Figure 3.2-5. As
predicted in the previous hypothesis, the maximum scour depth increases with the decrease of
D50. For coarse sand (D50=0.58), the maximum scour depth under smooth ice cover is similar to
that in open channels, which indicates the smooth cover has less impact on the scour
development. However, for fine sediments (D50=0.50 and D50=0.47), the ice cover has a stronger
impact on the maximum scour depth than open channels.

60
Figure 3.2- 5 The variation of D50 with scour depth under different conditions
Under the same flow condition in open channel, results also show that square abutment
contributes a higher maximum scour depth compared to that from semi-circular one. With an ice
cover as an extra boundary on top, as reported by Sui et al. (2010b), the location of maximum
velocity is closer to the channel bed than for the corresponding open channel flow. The increased
gradient of the near bed velocity leads to a higher bed shear stress, which contributes the deeper
scour hole in covered flow. With the increase of ice cover roughness, the locus of maximum
velocity moves closer to the bed compared to the smooth ice cover. This explains the reason of a
deeper scour depth under rough ice cover.
Figure 3.2-6 indicates that the variation of the maximum scour depth around the two abutments
in open channels, smooth cover and rough cover in different bed sediments.

61
Square abutment Semi-circular abutment
(a)
(b)
(d)
(e)
(c)
(f)
Figure 3.2- 6 The variation of maximum scour depth with different sediments and abutments

62
Figure 3.2-6 (a) ~ (c) show the variation of maximum scour depth with different bed sediments
around the square abutment, while Figure 3.2-6 (d) ~ (f) represent the variation of maximum
scour depth with the three sediments around the semi-circular abutment. It is clear that with an
increase of Fo, the ratio of maximum scour depth to approach flow depth increases
correspondingly under all flow condition with or without ice cover. It can also be seen that under
the same densimetric Froude number, with decreasing D50, the scour depth difference between
smooth ice cover and rough ice cover also decreases. For both abutments, with the decrease of
D50, the impact of ice cover roughness has a more clear impact on the scour depth.
As mentioned above, the impact of the shape factor for semi-circular abutment on scour depth is
smaller than that in open channels. To find the impact of shape factors, the derivative of dmax/h to
Fo is possible by using Equation (3.2-2) and (3.2-3).
9937.20282.2)'( max oF
h
d
(3.2-6)
1305.05728.0)'( max oF
h
d
(3.2-7)
By making equation (3.2-6) equals to equation (3.2-7), it is found that when Fo =2.11, the
difference between square abutment and semi-circular abutment is the smallest. At this point, the
shape factor for semi-circular abutment is 0.66. From the calculation, the shape factor for semi-
circular abutment has a range from 0.66 ~0.71.
The following multi-relationship can be used to describe the impact of shape factor on maximum
scour depth:
),(max
so KFfh
d
(3.2-8)
In which, Fo is the densimetric Froude number and Ks is the shape factor for different abutments.
For square abutment, the shape factor has a value of 1, which is same to that in open channels.
However, for the semi-circular abutment under ice covered condition, the shape factor will be
around 0.66~0.71, which is smaller than that in open channels.
The presence of an ice cover induces a redistribution of the highest velocities compared with the
open channel flow around bridge abutments, and thus leads to a higher available energy for the
scouring phenomenon. The relationship in Figure 3.2-7 also shows that with an increase in D50,
the ratio of maximum scour depth to flow depth decreases. While under the same flow and
sediment condition, the ice cover can result in a deeper scour depth. By increasing the

63
densimetric Froude number, the ratio increases correspondingly under open channel, smooth
cover and rough cover. But compared to the ratio in open channels, the rough cover has the
largest value and smooth cover has the second largest.
Figure 3.2- 7 The variation of maximum scour depth with different covered conditions
The experimental research conducted by Munteanu and Frenette (2010) showed that, an increase
up to 55% of maximum scour depth can be reached around the bridge pier under ice covered
conditions. From our study, for bridge abutments under rough ice cover, the increase on
maximum scour depth is around 30% ~ 40% for all the sediments. While for the smooth cover,
under the same flow condition, the increase of maximum scour depth is less than 30%. From the
authors’ understanding, the sediment transport under ice cover depends on the flow re-
distribution due to ice cover. A rough ice cover can cause more turbulence compared to the
smooth ice cover and open channel.
3.2.3 Conclusions
Ice cover plays an important role in the development of local scour hole around bridge abutments.
Experiments have been conducted to study the impact of ice cover on bridge abutments with

64
solid foundations in the soil. Two types commonly used abutments were built, namely semi-
circular and square abutments. For three non-uniform sediments, the profiles of local scour
around abutments were plotted. By using Buckingham Pi theorem for dimensional analysis, the
densimetric Froude number was used as one parameter to investigate the impact of shape factor
and ice cover roughness on maximum scour depth around abutments. Results indicate that the
impact of shape factor for semi-circular abutments on maximum scour depth is smaller in
covered conditions than that in open channels. The range of shape factor is between 0.66 and
0.71. Additionally, ice cover roughness also has a more pronounced impact on the maximum
scour depth. However, due to the limitation of experimental data, further experiments can lead to
a higher degree of certainty regarding the influence of shape factor on scour for semi-circular
abutment under ice covered conditions. Future work will include: flow velocity analysis in the
vicinity of bridge abutments under ice cover and analysis of the armor layer.
References
1. Ackermann N L, Shen H T, Olsson P, 2002, Local scour around circular piers under ice
covers. Proceeding of the 16th IAHR International Symposium on Ice, International Association
of Hydraulic Engineering Research, Dunedin, New Zealand.
2. Coleman S E, Lauchlan C S, Melville B W, 2003, Clear water scour development at
bridge abutments, Journal of Hydraulic Research, 41(5): 521–531.
3. Dey S, Barbhuiya A K, 2005, Time variation of scour at abutments, Journal of Hydraulic
Engineering, ASCE, 131 (1): 11-23.
4. Ettema Robert, Daly Steven F, 2004, Sediment transport under ice. ERDC/CRREL TR-
04-20. Cold regions research and Engineering Laboratory, US Army Corps of Engineers.
5. Ettema Robert, Braileanu, F, Muste M, 2000, Method for estimating sediment transport
in ice covered channels, Journal of Cold Regions Engineering, Vol. 14, No. 3, pp. 130-144.
6. Froehlich D C, 1989, Local scour at bridge abutments. Proc. Natl. Conf. Hydraulic
Engineering, ASCE, 13-18.
7. Hains D B, 2004, An experimental study of ice effects on scour at bridge piers. PhD
Dissertation, Lehigh University, Bethlehem, PA.

65
8. Hains Decker, Zabilansky Leonard, 2004, Laboratory test of scour under ice: Data and
preliminary results. ERDC/CRREL TR-04-09. Cold regions research and Engineering
Laboratory, US Army Corps of Engineers.
9. Hicks F, 2009, An overview of river ice problems: CRIPE 07 guest editorial Cold regions
Science and Technology, 55: pp. 175-185.
10. Imhof D, 2004. Risk assessment of existing bridge structures. PhD thesis, University of
Cambridge, UK.
11. Lau Y L, Krishnappan B G, 1985, Sediment transport under ice cover. Journal of
Hydraulic Engineering, ASCE, 111(6), pp. 934-950.
12. Laursen E M, Toch A, 1956, Scour around bridge piers and abutments. Iowa Highway
Research Board Bulletin, No 4.
13. Luigia Brandimarte, Paolo Paron, Giuliano Di Baldassarre, 2012, Bridge pier scour: a
review of process, measurements and estimates. Environmental Engineering and Management
Journal, Vol 11 (5).
14. Munteanu A, Frenette R, 2010, Scouring around a cylindrical bridge pier under ice
covered flow condition-experimental analysis, R V Anderson Associates Limited and Oxand
report.
15. Melville B W, 1992, Local scour at bridge abutments. Journal of Hydraulic Engineering,
ASCE, Vol 118 (4), pp. 615-631.
16. Melville B W, 1997, Pier and Abutment scour: integrated approach, Journal of Hydraulic
Engineering, ASCE, Vol 123(2): 125-136.
17. NCHRP Web-only Document 181, 2011, Evaluation of Bridge-Scour Research:
Abutment and Contraction Scour Processes and Prediction. NCHRP Project 24-27(02).
18. Sui Jueyi, Wang Desheng, Karney B, 2000, Suspended sediment concentration and
deformation of riverbed an a frazil jammed reach, Canadian Journal of Civil Engineering, Vol.
27, 1120-1129.
19. Sui Jueyi, Faruque M A A, Balanchandar Ram, 2009, Local scour caused by submerged
square jets under model ice cover. Journal of Hydraulic Engineering, ASCE, Vol 135 (4), pp.
316-319.
66
20. Sui Jueyi, Afzalimehe Hossein, Samani A K, Meherani M, 2010a, Clear-water scour
around semi-elliptical abutments with armored beds. International Journal of Sediment Research,
Vol 25(3), pp.233-244.
21. Sui Jueyi, Wang Jun, He Yun, Krol Faye, 2010b, Velocity profile and incipient motion of
frazil particles under ice cover. International Journal of Sediment Research, Vol 25(1), pp. 39-51.
22. Wang J, Sui J, Karney B, 2008, Incipient motion of non-cohesive sediment under ice
cover – an experimental study. Journal of Hydrodynamics, Vol 20(1), pp. 177-124.

67
3.3 Scour morphology around bridge abutments with non-uniform sediment under ice
cover
Sediment transport, including the erosion of river bed sediment, is a common problem in water
resource management. Bridge abutments and piers in rivers are used to support the infrastructure
of a bridge and are crucial for the safety of bridges. Bridge abutments extend perpendicularly
from the bank into the river flow. The erosion around bridge structures can weaken the structural
stability of a bridge and is a public safety concern.
Local scour refers to the erosion of sediment directly around infrastructure by running water.
From an engineering perspective, determining the maximum scour depth is important so that
provisions can be made in the design and construction (Chang, 2002). The local scour around
bridge foundations is an important aspect of river hydraulic engineering as studies have shown
that local scour has caused huge economic loss around the world. For example, in 1987, 17
bridges were destroyed in New York and New England and in Georgia in 1994 over 500 bridges
were damaged due to the scouring during flood events (Richardson and Davis, 2001).
Furthermore, a nation-wide study conducted by the US Federal Highway Administration, found
that 75% of 383 bridge failures in 1973 involved abutment damage and 25% involved pier
damage (Chang, 1973).
Over the past few decades, local scour around bridge abutments in open channels has received
wide attention, and many researchers have conducted numerous studies on this topic (e.g.,
Laursen and Toch, 1956; Froehlich, 1989; Melville, 1997; Coleman et al, 2003; Dey 2005).
These studies can be broadly grouped into two categories (Zhang, 2005). The first is the
prediction of scour depth by using empirical or semi-empirical formulae based on field data or
experimental data and the second method is based on numerical simulations. There are three
main types of scour depth estimation formulae (Lim, 1997): 1) the regime approach, which
relates the scour depth to the increased discharge or flow at the abutment; 2) the dimensional
analysis, where relevant dimensionless parameters describing the scour are correlated (most of
the past formulas are obtained from this way); and 3) analytical or semi-empirical approach,
which is based on sediment transport relation between approach flow and increased shear stress
at the abutment site.

68
Natural river beds are composed of non-uniform sediment (i.e., a large range in grain-size),
however, very few studies recognize the influence of non-uniform bed sediment on the
development and morphology of local scour holes (e.g., Wu et al. 2000; Sui et al. 2010a, Zhang
et al. 2012). The direct result of non-uniform sediment transport in alluvial rivers is grain sorting.
This can result in the formation of armor layer around the bridge abutment and influence the
development and the morphology of scour holes.
In the northern regions of Canada, ice cover on rivers can present numerous engineering
challenges as the ice cover can last for several months. River ice formation seasonally affects the
water flow and sediment transport in alluvial channels. Field observations indicate that ice cover
significantly affects velocity profiles and sediment transport processes in rivers (Figure 3.3-1). A
solid ice cover can lead to an increased in the composite resistance and almost double the wetted
perimeter. The armor layer and bed morphology of the local scour coupled with non-uniform
sediments under ice cover has not been studied extensively.
There is little experimental research on the development and morphology of local scour around
bridge abutments under ice cover with non-uniform sediments (Ackermann et al, 2002; Sui et al,
2009, 2010b). A small-scale flume experimental study in open channel with artificial non-
uniform sediments was conducted by Sui et al. (2010) and another large-scale flume experiment
with simulated ice cover was conducted in 2012 by the authors. The scour morphology of the
local scour from these two studies is presented here. In addition, the grain size distribution was
also measured around the bridge abutment in the second, large-scale, flume experiment.
Figure 3.3- 1 A comparison of flow profiles with (a) and without (b) ice cover
(Reproduced from Ettema and Daly, 2004)

69
3.3.1 Methodology
Small-scale flume experiment
The first experiment was conducted in a 5.6m long, 0.31m wide, 0.4m deep recirculating flume
(Sui et al., 2010a). The semi-circular abutment model was used (Figure 3.3-2) and the scour hole
morphology was investigated under different flow conditions.
As shown in Figure 3.3-2, the semi-circular abutment was placed in a sediment box which has a
dimension of 1m long, 0.3m wide and 0.1m deep. To study the impact of sediment grain size on
the local scour development, two layers of uniform sediment with different grain-sizes were put
in the sediment box. The flow rate in the flume was controlled by an inlet valve and flow
dissipaters were used in front of the flume to reduce the turbulence. The semi- circular abutment
model was leveled in the sand box and set against the flume wall. The flume was slowly filled to
prevent a scour hole from developing prior to the initiation of the experiment. A weir was
installed at the rear of the flume to control the depth of water in the flume and once the
appropriate water depth was reached, the valve was adjusted to obtain the desired discharge. In
this study, a constant flow depth 0.06m was maintained for each run. A pump was used to
circulate the water from the reservoir back to the head.
Figure 3.3- 2 The experimental setup of the small scale flume (left) and large scale flume (right)
Observation indicated that the time for achieving maximum scour depth in uniform sediments
was approximately 12 hours. Herein, the running time ranges between 12 and 15 hours at which

70
point the maximum scour depth was carefully measured by using a point gauge with a resolution
of ± 0.01mm.
Table 3.3- 1 Experimental data of small scale flume experiments
H (m) d (mm) da (mm) 3da (mm) U (m/s) ds (m)
0.06 0.26 1.15 3.45 0.24 0.034
0.06 0.26 2.36 7.08 0.34 0.017
0.06 0.26 4.00 12.00 0.41 0.024
0.06 0.52 2.36 7.08 0.34 0.023
0.06 0.52 4.00 12.00 0.41 0.027
0.06 0.84 4.00 12.00 0.41 0.036
0.06 0.26 1.15 3.45 0.28 0.048
0.06 0.26 2.36 7.08 0.39 0.024
0.06 0.26 4.00 12.00 0.47 0.029
0.06 0.52 2.36 7.08 0.39 0.031
0.06 0.52 4.00 12.00 0.47 0.030
0.06 0.84 4.00 12.00 0.47 0.051
0.06 0.26 1.15 3.45 0.31 0.061
0.06 0.26 2.36 7.08 0.44 0.030
0.06 0.26 4.00 12.00 0.53 0.043
0.06 0.52 2.36 7.08 0.44 0.055
0.06 0.52 4.00 12.00 0.53 0.050
0.06 0.84 4.00 12.00 0.53 0.064
Uniform sediments have been used for the purpose of comparison. Three bed materials were
used with diameter of 0.26mm, 0.52mm and 0.84mm. Coarse sediment with diameter (da) of
1.15mm, 2.34mm and 4.0 mm were overlain on top of the bed material to create an armor layer.
From a previous study conducted by Froehlich (1995), the thickness of the armor layer has been
designated as 3da. The maximum scour depth of the local scour around bridge abutment are
found in Table 3.3-1, in which H is the flow depth, d is the diameter of bed material, da is the

71
median diameter of the armor layer particle, U is the mean flow velocity and ds is the scour depth
near the abutment.
Large-scale flume experiment
The small-scale flume experiment has many advantages including ease of use, greater control of
flow and bed conditions and lower power usage. However, compared to the natural rivers, small-
scale flumes are not adequate to study the grain-size and ice cover impact on the bed morphology
of the local scour. To overcome the limitations of a small-scale flume, a large-scale flume
experiment was conducted in 2012. The setup of the large-scale flume can be found in Figure
3.3-2.
As shown in Figure 3.3-2, the flume has a dimension of 40m long, 2.0m wide and 1.3m deep.
Two sand boxes with a depth of 0.3m were constructed 10.2m from each other. For the purpose
of observing scouring process from outside of the flume, one side of the flume wall in the sand
box was replaced by Plexiglass. The semi-circular abutment model was also made from
Plexiglass with a radius of 20cm and 1.0m high.
In this large scale experiment, the ice cover was simulated by using styrofoam panel which
covered the whole sand box area. To study the bed morphology under different ice covers, a
rough ice cover was created by attaching small cubes of the Styrofoam to the underside of the
simulated ice cover. The small cubes have a dimension of 2.5cm × 2.5cm × 2.5cm, with a
spacing distance 3.5cm from each other.
Three different non-uniform sediments were used in this flume. The D50 of these three sediments
were 0.58mm, 0.50cm, 0.47mm. It is important to note that the non-uniform sediment used here
are natural sands which were purchased from a local aggregate mine. The velocity range in sand
box 1 was 0.16 - 0.26m/s, while in sand box 2, the range is 0.14 - 0.21m/s. At the beginning of
each experiment, the flume was slowly filled by adjusting the valves in the holding tank. To
protect the scour from the initial filling of the flume, a template was made to cover the bed
material. After the required water depth was reached, the template was removed to start the
scouring process. Observations indicated that the running time to reach maximum scour depth
around the semi-circular abutment was approximately 24 hours.

72
To measure the approaching velocity and flow profile around the bridge abutment, a SonTek IQ
velocity meter was installed in front of the sand box. The velocity meter also provided flow
depth, pressure and temperature. In the sand box, a staff gauge was installed for reading water
depth directly. A 10MHz SonTek Acoustic Doppler Velocimeter (ADV) was also used at the end
of each experiment to measure the flow field in the scour hole. The ADV measures the phase
change caused by the Doppler Shift occurs when the signal reflects off the particles in the flow.
The running condition of this large scale flume experiment can be found in Table 3.3-2.
Table 3.3- 2 Experimental data of small scale flume experiments
Running
condition
D50
(mm)
Running
time (h)
Flume
width
(m)
Water
depth
(m)
Approaching
velocity
(m/s)
Open
channel
0.58 24 2 0.07 0.21
0.58 24 2 0.19 0.23
0.58 24 2 0.07 0.26
0.50 24 2 0.07 0.21
0.50 24 2 0.19 0.23
0.50 24 2 0.07 0.26
0.47 24 2 0.07 0.21
0.47 24 2 0.19 0.23
0.47 24 2 0.07 0.26
Smooth
cover
0.58 24 2 0.07 0.23
0.58 24 2 0.19 0.20
0.58 24 2 0.07 0.20
0.50 24 2 0.07 0.23
0.50 24 2 0.19 0.20
0.50 24 2 0.07 0.20
0.47 24 2 0.07 0.23
0.47 24 2 0.19 0.20
0.47 24 2 0.07 0.20

73
3.3.2 Results and discussion
Local scour pattern and profile
At the end of each experiment, digital photos were taken for the small-scale flume experiment
and for the large -scale flume experiment, the local scour was manually measured and then
mapped using Surfer 10, Golden Software. The local scour patterns of the small-scale and large-
scale flume experiments are compared in Figure 3.3-3.
As reported by Sui et al. (2010), in the small scale flume experiment, the coarse sediment tended
to stay in the scour hole because due to the large mass compared to the fine-grained sediment
and fine sediments were sheltered behind the coarse sediments. Because coarse particles need
more energy to move to the downstream the development of an armor layer depends not only on
the approaching velocity, but also the sediment grain size and the thickness of the armor layer.
Depending on the conditions of approaching flow and armor layer, the armoring process occurs
in the upstream portion of the scour hole. The sediment pile was highly compacted in the
upstream portion of the scour area (Sui et al. 2010). However, the downstream portion of the
scour was less compaction (Figure 3.3-3(a)).
Figure 3.3-3(a) shows the sediment redistribution around in the small scale flume in open
channels. It was also noted that the scour close to the upstream toe area around the abutment was
generally deeper. In the downstream side of the abutment, the local scour area is smaller
compared to that from the upstream. The scouring process showed that the transport of fine
Rough
cover
0.58 24 2 0.07 0.20
0.58 24 2 0.19 0.20
0.58 24 2 0.07 0.22
0.50 24 2 0.07 0.20
0.50 24 2 0.19 0.20
0.50 24 2 0.07 0.22
0.47 24 2 0.07 0.20
0.47 24 2 0.19 0.20
0.47 24 2 0.07 0.22
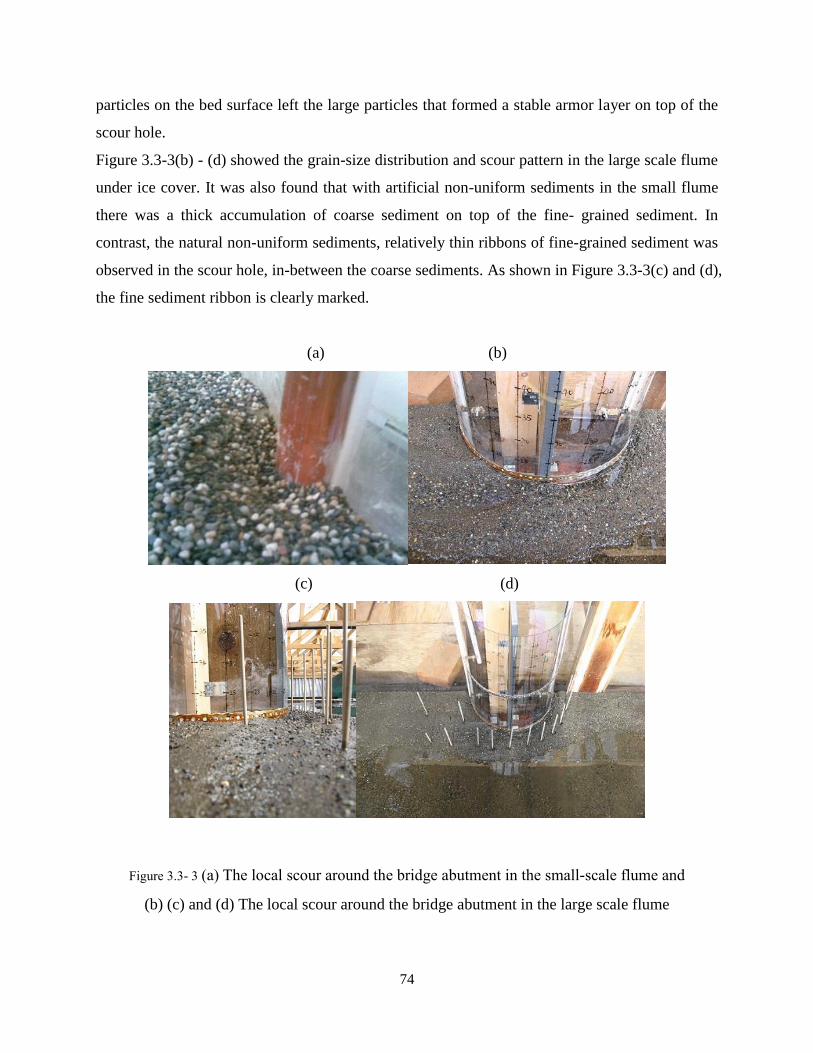
74
particles on the bed surface left the large particles that formed a stable armor layer on top of the
scour hole.
Figure 3.3-3(b) - (d) showed the grain-size distribution and scour pattern in the large scale flume
under ice cover. It was also found that with artificial non-uniform sediments in the small flume
there was a thick accumulation of coarse sediment on top of the fine- grained sediment. In
contrast, the natural non-uniform sediments, relatively thin ribbons of fine-grained sediment was
observed in the scour hole, in-between the coarse sediments. As shown in Figure 3.3-3(c) and (d),
the fine sediment ribbon is clearly marked.
(a) (b)
(c) (d)
Figure 3.3- 3 (a) The local scour around the bridge abutment in the small-scale flume and
(b) (c) and (d) The local scour around the bridge abutment in the large scale flume
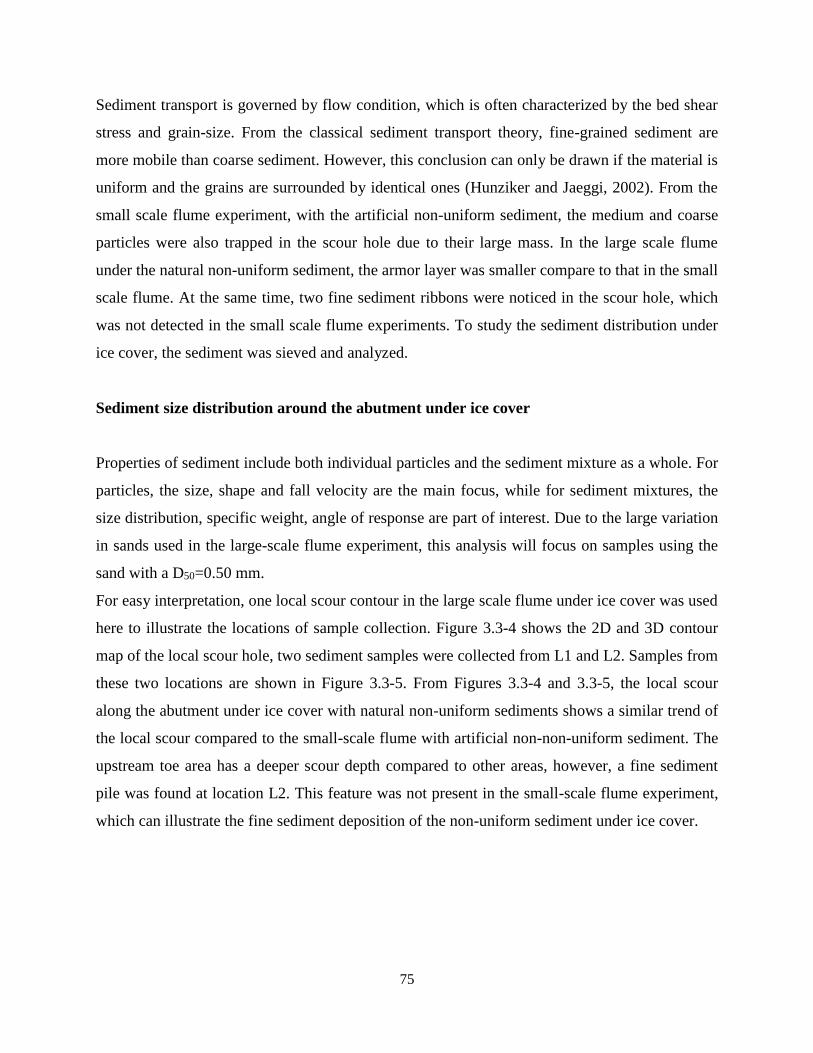
75
Sediment transport is governed by flow condition, which is often characterized by the bed shear
stress and grain-size. From the classical sediment transport theory, fine-grained sediment are
more mobile than coarse sediment. However, this conclusion can only be drawn if the material is
uniform and the grains are surrounded by identical ones (Hunziker and Jaeggi, 2002). From the
small scale flume experiment, with the artificial non-uniform sediment, the medium and coarse
particles were also trapped in the scour hole due to their large mass. In the large scale flume
under the natural non-uniform sediment, the armor layer was smaller compare to that in the small
scale flume. At the same time, two fine sediment ribbons were noticed in the scour hole, which
was not detected in the small scale flume experiments. To study the sediment distribution under
ice cover, the sediment was sieved and analyzed.
Sediment size distribution around the abutment under ice cover
Properties of sediment include both individual particles and the sediment mixture as a whole. For
particles, the size, shape and fall velocity are the main focus, while for sediment mixtures, the
size distribution, specific weight, angle of response are part of interest. Due to the large variation
in sands used in the large-scale flume experiment, this analysis will focus on samples using the
sand with a D50=0.50 mm.
For easy interpretation, one local scour contour in the large scale flume under ice cover was used
here to illustrate the locations of sample collection. Figure 3.3-4 shows the 2D and 3D contour
map of the local scour hole, two sediment samples were collected from L1 and L2. Samples from
these two locations are shown in Figure 3.3-5. From Figures 3.3-4 and 3.3-5, the local scour
along the abutment under ice cover with natural non-uniform sediments shows a similar trend of
the local scour compared to the small-scale flume with artificial non-non-uniform sediment. The
upstream toe area has a deeper scour depth compared to other areas, however, a fine sediment
pile was found at location L2. This feature was not present in the small-scale flume experiment,
which can illustrate the fine sediment deposition of the non-uniform sediment under ice cover.

76
Figure 3.3- 4 The scour contour in the large scale flume
Figure 3.3- 5 The sediment samples L1 (left) and L2 (right)
Figure 3.3-5 shows the sediment sample collected from different locations along the semi-
circular abutment. As shown in Figure 3.3-5, the sample in L1 was mainly coarse particles, and
in contrast the sample from L2 was comprised mainly by fine sediments. Furthermore, it was
observed from the cross section of the scour hole along the abutment is that in the scour hole
there is a sudden elevation increase (Figure 3.3-6). To investigate if there is any different of
sediment composition, samples were also collected at this location (L3).
The cumulative size distribution from L1, L2, L3 are plotted in Figure 3.3-7. For the purpose of
comparison, the sand analysis of the original natural non-uniform sediment was also plotted. It
can be found that from the figure that, due to the sediment deposition effect, fine particles were
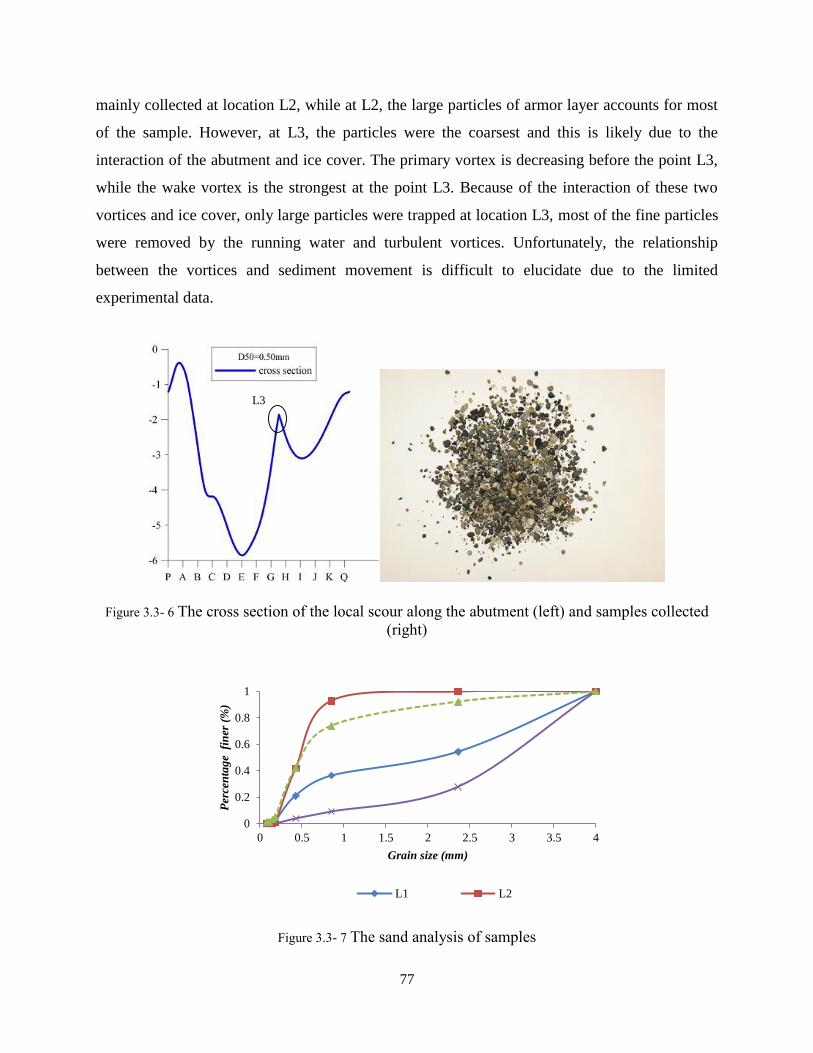
77
mainly collected at location L2, while at L2, the large particles of armor layer accounts for most
of the sample. However, at L3, the particles were the coarsest and this is likely due to the
interaction of the abutment and ice cover. The primary vortex is decreasing before the point L3,
while the wake vortex is the strongest at the point L3. Because of the interaction of these two
vortices and ice cover, only large particles were trapped at location L3, most of the fine particles
were removed by the running water and turbulent vortices. Unfortunately, the relationship
between the vortices and sediment movement is difficult to elucidate due to the limited
experimental data.
Figure 3.3- 6 The cross section of the local scour along the abutment (left) and samples collected
(right)
Figure 3.3- 7 The sand analysis of samples
0
0.2
0.4
0.6
0.8
1
0 0.5 1 1.5 2 2.5 3 3.5 4
Per
cen
tag
e f
iner
(%
)
Grain size (mm)
L1 L2
L3

78
The maximum scour depth analysis
Small scale flume
To study the impact of diameter of bed material on the maximum scour depth (ds), the
densimetric Froude number was used for the small-scale flume analysis, which can be defined in
the following equation:
dgUFo / (3.3-1)
In which, g is the gravitational acceleration, Uo is the approaching velocity, Δρ is mass
difference between sediment and water, d is the diameter of the bed material.
Figure 3.3- 8 The variation of scour depth with densimetric Froude number in small-scale flume
By plotting the maximum scour depth with the densimetric Froude number in the small scale
flume, the following relationship can be found under open flow condition:
0404.00061.00025.0 2 oo
s FFd
d
(3.3-2)
The maximum scour depth increases with an increase in densimetric Froude number. For natural
non-uniform sediments in the large-scale flume, the following analysis was conducted.
Large scale flume
0404.00061.00025.0 2 oos FF
d
d

79
Similarly, under smooth ice cover in the large-scale flume, the maximum scour depth varied with
the densimetric Froude number and the data are found in Figure 3.3-9. However, for natural non-
uniform sediment the diameter of the bed material was replaced by the D50. It can also noted
from Figure 3.3-8 and Figure 3.3-9 that, for natural non-uniform sediments, a small increase in
the densimetric Froude number can change the maximum scour depth significantly compare to
that in the artificial non-uniform sediment. In addition, this research demonstrates that the
turbulence in the large-scale flume has strong impact on the scour depth around semi-circular
abutments.
Figure 3.3- 9 The variation of scour depth under smooth ice cover in large scale flume
3.3.3 Conclusions
By using experimental data gained from two flume experiments on the local scour around semi-
circular abutments, the bed morphology of the local scour with non-uniform sediment was
examined. The small-scale flume experiment with the artificial non-uniform sediment showed
the formation of an armor layer and significant erosion around the abutment. The large-scale
flume experiment with natural non-uniform sediment showed that under ice cover, at different
locations of the abutment, the sediment sorting process were more clear. The armor layer only
forms in the scour hole while fine sediment deposition was located at the downstream of the
abutment. One relationship of maximum scour depth with densimetric Froude number was also
developed for the small scale flume experiment. However, due to the limitation of experimental

80
data, the relationship between ice cover roughness and sediment movement is not clear and
further experimental data are needed to clearly assess this.
References
1. Ackermann N L, Shen H T, Olsson P, 2002, Local scour around circular piers under ice
covers. Proceeding of the 16th IAHR Internnational Symposium on Ice, Internnational
Association of Hydraulic Engineering Research, Dunedin, New Zealand.
2. Chang F F M, 1973, A statistical summary of the cause and cost of bridge failures. Office
of Research, Federal Highway Administration, Washington D C, US.
3. Chang H H, 2002, Fluvial processes in river engineering, Reissue 2002, Krieger
Publishing Company, Krieger Drive, Malabar, Florida, pp. 80-104.
4. Coleman S E, Lauchlan C S, Melville B W, 2003, Clear water scour development at
bridge abutments, Journal of Hydraulic Research, 41(5), pp. 521–531.
5. Dey S, Barbhuiya A K, 2005, Time variation of scour at abutments, Journal of Hydraulic
Engineering, ASCE, 131 (1), pp. 11-23.
6. Ettema R, Daly S F, 2004, Sediment transport under ice, Cold Regions Research and
Engineering Laboratory, ERDC/CRREL TR-04-20, pp. 8.
7. Froehlich D C, 1989, Local scour at bridge abutments. Proc. Natl. Conf. Hydraulic
Engineering, ASCE, pp. 13-18.
8. Laursen E M, Toch A, 1956, Scour around bridge piers and abutments. Iowa Highway
Research Board Bulletin, No 4.
9. Lim S Y, 1997, Equilibrium clear-water scour around an abutment, Journal of Hydraulic
Engineering, 123(3), pp. 237-243.
10. Melville B W, 1997, Pier and Abutment scour: integrated approach, Journal of Hydraulic
Engineering, 123(2), pp. 125-136.
11. Richardson E V, Davis S R, 2001, Evaluating scour at bridges. HEC18 FHWA NHI-001,
Federal Highway Administration, US Department of Transportation, Washington, DC.
12. Sui J, Faruque M A A, Balanchandar R, 2009, Local scour caused by submerged square
jets under model ice cover. Journal of Hydraulic Engineering, ASCE, Vol 135 (4), pp. 316-319.

81
13. Sui J, Afzalimehr H, Samani A K, Maherani M, 2010a, Clear water scour around semi-
elliptical abutments with armored bed, International Journal of Sediment Research, Vol. 25, No.
3, pp. 233-244.
14. Sui J, Wang J, He Y, Krol F, 2010b, Velocity profile and incipient motion of frazil
particles under ice cover. International Journal of Sediment Research, Vol 25(1), pp. 39-51.
15. Wu W, Wang S, Jia Y, 2000b, Non-uniform sediment transport in alluvial rivers, Journal
of Hydraulic research, 38(6), pp. 427-434.
16. Zhang H, 2005, Study of flow and bed evolution in channels with spur dykes, PhD
Dissertation, Ujigawa Hydraulics Laboratory, Kyoto University, Japan.
17. Zhang H, Nakagawa H, Mizutani H, 2012, Bed morphology and grain size characteristics
around a spur dike, International Journal of Sediment Research, Vol. 27, No. 2, pp. 141-157.

82
3.4 Armor layer analysis of local scour around bridge abutments under ice cover
Local scour is the erosion of sediments in the vicinity of bridge foundations. Depending on if
there is a sediment supply from approaching flow, the scour can be categorized as either clear
water scour or live-bed scour (Barbhuiya and Dey, 2004). Clear water scour occurs with the
absence of sediments transported from upstream while live-bed scour takes place when the scour
hole is continuously fed with sediments by the approaching flow.
Local scour is a challenging problem for hydraulic engineers. Most existing studies are
conducted in small scale flumes with uniform sediment. Natural river beds are composed of a
mixture of different sizes of sand and gravel. Very few studies use natural sand due to its
complexity. The finer materials will be transported faster than the coarser materials under the
same flow conditions, and the remaining bed material becomes coarser. This coarsening process
is stopped once a layer of coarse material completely covers the river bed and protects the finer
materials beneath it from being transported. After this process is completed, the river bed is
armored and the coarser layer is called armor layer (Yang, 2003).
The incipient velocity for non-uniform sediments varies more in comparison to that of uniform
sediment. Advances in the non-uniform sediment movement play a key role in theoretical
analysis and engineering practice pertaining to channel and reservoir design, physical sediment
model analysis and numerical simulation (Xu et al, 2008).
Meyer-Peter and Mueller (1948) defined the formula describing armor layer sediment size by
using one mean grain size of the bed to calculate the sediment size in the armor layer. The
following equation was developed.
2/36/1
1 90/ dnK
SDd
(3.4-1)
where d is the sediment size in the armor layer, S is the channel slope, D is the mean flow depth,
K1 is a constant equal to 0.058 when D is in meters; n is the channel bottom roughness or
Manning’s roughness, and d90 is the bed material size where 90% of the material is finer. Yang
(1973) developed his criteria by using the approach velocity to illustrate the incipient motion.
For open channels, the logarithmic law for velocity distribution is applied. However, in his
equation, the relative roughness effect was treated as constant due to insufficient data. Kuhnle
83
(1993) conducted flume experiments on the incipient motion of gravel and sand mixtures with
different ratios. By calculating critical shear stress for incipient motion, it was found that for
gravel-sand mixtures, the gravel showed an increasing critical bed shear stress with increasing
grain size. Dey and Barbhuiya (2004) examined clear water scour at abutments in armored beds.
It was found that the scour depth with an armor layer in clear water scour is always greater than
that without armor layer for the same bed sediment. Around bridge piers, Dey and Raika (2007)
noticed that the scour depth with an armor layer is less than that without an armor layer for the
same bed sediments when the scour hole is shielded by a compact secondary armor layer. Some
recent relevant work on the non-uniform sediment transport can also be found from Khullar et al.
(2010) and Jha et al. (2011). Guo (2012) gave a critical review of pier scour in clear water for
non-uniform sediments. The flow-structure-sediment factors were analyzed systematically and
several empirical equations were reviewed. Zhang et al. (2012) found that the mean grain size
and geometric standard deviation of the bed sediments are two important and practical
parameters in characterizing the changes in bed morphology and composition around spur dikes.
Furthermore, river ice seasonally affects the flow distribution and results in a change in sediment
transport in natural rivers around bridge foundations. The impact of ice cover on sediment
transport is important for cold regions in the northern hemisphere. The velocity field changes
significantly under ice cover due to the presence of an extra boundary layer. As identified by
Melville (1992), the primary vortex, together with the down flow are the principal causes of local
scour around bridge abutments. With the presence of ice cover, the down flow can be increased,
which also increases the sediment transport around bridge abutments.
Regarding the effects of river ice on scour and sediment transport, studies such as Ackermann et
al. (2002), Hains (2004), Hains and Zabilansky (2004), Munteanu (2004), Andre and Tran (2012)
pointed out that combination of increased ice cover roughness and pressure flow resulted in a
larger scour depth. Smith and Ettema’s (1997) experiments showed that the two layer assumption
was especially inadequate for characterizing flow resistance and sediment transport rates. Ettema
et al. (2000) developed a new method for estimating sediment transport and identified the
importance of assessing flow resistance attributable to bed surface drag. Li (2012) obtained field
estimates of the composite Manning’s coefficient associated with ice cover. By using four
different methods, winter measurements of ice covered rivers in Canada were analyzed. The
results show that the composite Manning’s coefficient ranges from 0.013 to 0.040. The results

84
are useful for modeling ice covered river flow and determining the sediment transport under ice
cover.
To date, there is still no research connecting the non-uniform sediment and ice cover. In this
research, three non-uniform sediments and two types of ice cover are applied to study the armor
layer in the scour hole as well as the impacts of ice cover on the maximum scour depth.
3.4.1 Methodology
One large scale flume was used in this study. The set-up of the flume is indicated in Figure 3.4-1.
The flume was 2m wide, 1.3m deep and 38.2m long. Two 0.3m deep sand boxes were created to
hold non-uniform sediment. The flume was covered with treated waterproof plywood acting as a
false river bed. To compare the shape factor of the abutment as recognized by Melville (1992),
two abutments were made from Plexiglass. On the outside surface of the abutment, different
measuring lines have been drawn for the purpose of comparing scour profiles at different
locations (Figure 3.4-2). For the square abutment, the upstream surface and corner B are the
locations of the maximum scour depth from previous studies, so four equal distance lines were
made along the upstream surface. While for the semi-circular abutment, 12 lines having an equal
central angle of 15º were drawn which are used when describing the scour depth along the
abutment.

85
Figure 3.4- 1 The layout of the experimental large scale flume
Figure 3.4- 2 Dimensions and measuring points of abutments
Three natural non-uniform sediment mixtures were used in this study. The D50s were 0.58mm,
0.50mm and 0.47mm respectively, with geometric standard deviation (σg) of 2.61, 2.53 and 1.89.
For all the three sediments, the value of σg is larger than 1.4, which can be treated as non-
uniform sediments (Dey and Barbhuiya, 2004). Two types of ice covers were used, namely
smooth cover and rough cover. Smooth ice cover was constructed from Styrofoam, while the
rough ice cover is modified by attaching small cubes to underside of the smooth cover. The small
cubes have a dimension of 2.5cm × 2.5cm × 2.5cm, with spacing of 3.5cm from each other
(Figure 3.4-3).

86
Figure 3.4- 3 Experimental flume set up and rough ice cover (up); Armor layer around the square
abutment corner (bottom)
A 10 MHz SonTek Acoustic Doppler Velocimeter (ADV) was used to measure the flow field at
the end of each experiment, which had the equilibrium scour depth. The sampling frequency for
ADV was 25Hz. After each experiment, photos of the local scour around the abutment were
taken. After measurement was completed, sediment samples from different scour locations were
collected. For the square abutment, samples from corner B were collected and for semi-circular
abutment samples from location E to F were collected. Additionally, sediment samples from the
downstream fine sediment ridge were collected for the purpose of comparison with armor layer.
Surface sampling was used in accordance with Ettema (1984). The thickness of the natural armor
layer varies from d to 3d, in which d is the particle size of armor layer (Froehlich, 1995). For this
study, surface samples were collected by a small scoop. At the end of each experiment,
sediments in the armor layer were sieved and analyzed. The bottom elevations were measured by
using the measuring lines on the abutment. The scour contours were plotted using Surfer 10,
Golden Software. In all, 54 experiments have been carried out. The experimental conditions are
presented in Table 3.4-1.

87
Table 3.4- 1 Test condition and non-uniform sediment composition of each experiment
Abutment
type
Cover
condition D50 (mm)
D16 (mm)
D84(mm) D90(mm) depth (m)
Average
velocity
(m/s)
Square
abutment
Open
channel
0.58 0.28 1.91 2.57 0.07 0.26
0.58 0.28 1.91 2.57 0.07 0.21
0.58 0.28 1.91 2.57 0.19 0.21
0.50 0.26 1.66 2.09 0.07 0.26
0.50 0.26 1.66 2.09 0.07 0.21
0.50 0.26 1.66 2.09 0.19 0.21
0.47 0.23 0.82 1.19 0.07 0.26
0.47 0.23 0.82 1.19 0.07 0.21
0.47 0.23 0.82 1.19 0.19 0.21
Smooth
cover
0.58 0.28 1.91 2.57 0.07 0.20
0.58 0.28 1.91 2.57 0.19 0.16
0.58 0.28 1.91 2.57 0.07 0.23
0.50 0.26 1.66 2.09 0.07 0.20
0.50 0.26 1.66 2.09 0.19 0.16
0.50 0.26 1.66 2.09 0.07 0.23
0.47 0.23 0.82 1.19 0.07 0.20
0.47 0.23 0.82 1.19 0.19 0.16
0.47 0.23 0.82 1.19 0.07 0.23
Rough
cover
0.58 0.28 1.91 2.57 0.07 0.22
0.58 0.28 1.91 2.57 0.07 0.20
0.58 0.28 1.91 2.57 0.19 0.14
0.50 0.26 1.66 2.09 0.07 0.22
0.50 0.26 1.66 2.09 0.07 0.20
0.50 0.26 1.66 2.09 0.19 0.14
0.47 0.23 0.82 1.19 0.07 0.22
0.47 0.23 0.82 1.19 0.07 0.20

88
0.47 0.23 0.82 1.19 0.19 0.14
Semi-
circular
Abutment
Open
channel
0.58 0.28 1.91 2.57 0.07 0.21
0.58 0.28 1.91 2.57 0.19 0.23
0.58 0.28 1.91 2.57 0.07 0.26
0.50 0.26 1.66 2.09 0.07 0.21
0.50 0.26 1.66 2.09 0.19 0.23
0.50 0.26 1.66 2.09 0.07 0.26
0.47 0.23 0.82 1.19 0.07 0.21
0.47 0.23 0.82 1.19 0.19 0.23
0.47 0.23 0.82 1.19 0.07 0.26
Smooth
cover
0.58 0.28 1.91 2.57 0.07 0.23
0.58 0.28 1.91 2.57 0.19 0.20
0.58 0.28 1.91 2.57 0.07 0.20
0.50 0.26 1.66 2.09 0.07 0.23
0.50 0.26 1.66 2.09 0.19 0.20
0.50 0.26 1.66 2.09 0.07 0.20
0.47 0.23 0.82 1.19 0.07 0.23
0.47 0.23 0.82 1.19 0.19 0.20
0.47 0.23 0.82 1.19 0.07 0.20
Rough
cover
0.58 0.28 1.91 2.57 0.07 0.20
0.58 0.28 1.91 2.57 0.19 0.20
0.58 0.28 1.91 2.57 0.07 0.22
0.50 0.26 1.66 2.09 0.07 0.20
0.50 0.26 1.66 2.09 0.19 0.20
0.50 0.26 1.66 2.09 0.07 0.22
0.47 0.23 0.82 1.19 0.07 0.20
0.47 0.23 0.82 1.19 0.19 0.20
0.47 0.23 0.82 1.19 0.07 0.22
3.4.2 Results and discussion

89
Scour morphology and geometry
Figure 3.4-3 shows the experimental setup, local scour morphology and armor layers around the
abutments. Figure 3.4-4 shows the contour plotted by Surfer 10 around both square and semi-
circular abutment.
Figure 3.4- 4 Typical local scour contour around square abutment (left) and semi-circular abutment
(right)
The geometry of the scour holes under both open channel and ice covered channel share some
common features. For the square abutment, two scour holes were developed in the scouring
process, one located in corner B, which is also where the maximum scour depth is located. The
other smaller scour hole is located at corner C (Figure 3.4-2). For the semi-circular abutment, the
maximum scour depth is located between E and F (Figure 3.4-2). For both square and semi-
circular abutments, the maximum scour depth is located between 45 to 60 degrees facing the
approaching flow. Figure 3.4-3 shows one typical non-uniform scour hole around the square
abutment.
As shown in Figure 3.4-3, the scour hole is not completely covered by an armor layer. There are
two fine sediment ribbons extending downstream from the main scour hole. For the armor layer
development, an earlier formation of the armor layer is detected in the upstream section. Due to
the interaction between primary vortex and wake vortex behind the abutment, the geometry of
the scour area in the upstream differs substantially from that in the downstream.
Noted by Sui et al. (2010b), the point of the maximum velocity is located at 60% of water depth
for smooth ice cover, while 70% under rough ice cover. Due to movement of the maximum

90
velocity in the transverse direction, stronger turbulence can be generated around the abutment
under ice covers. It is also interesting to note that, under the same flow conditions, the area of the
armor layer under ice cover is larger than that under open channels. Meanwhile, under rough ice
cover, the armor layer area is the largest and extends the longest distance downstream comparing
that of smooth ice cover. While in open channels, the armor layer has the smallest area and
shortest distance from the abutment.
For non-uniform sediment transport under ice cover, Ettema (2002) mentioned that an imposed
ice cover results in an increased composite resistance. The maximum velocity is located between
the cover and channel bed, with its vertical location depended on the relative resistance
coefficients of the channel bed and cover. With rough ice cover, the location of maximum
velocity is lower than that with smooth ice cover and open channel because of the relative large
roughness coefficient. Our data of maximum scour depth under rough cover and smooth cover
supports the above conclusions.
Grain size analysis of armor layer
In the experimental research, three non-uniform sediments were used. Figure 6-5 shows the sieve
analysis of the three sediments. According to United States Standard Test Sieve procedure, the
following sieves were selected for the analysis: 4.0mm, 2.0mm, 0.85mm, 0.5mm, 0.25mm,
0.15mm, 0.063mm. The distribution curves were plotted as the “percentage-finer-than” curve;
D50, D16, D84, D90 are calculated from curves (Figure 3.4-5).
0.00
0.20
0.40
0.60
0.80
1.00
0.000 1.000 2.000 3.000 4.000
per
cen
t fi
ner
sediment size (mm)
D50=0.58mm D50=0.50mm D50=0.47mm

91
Figure 3.4- 5 Distribution curves for the non-uniform sediment
The armor layer initiated its development from the toe area and then extended to the downside of
the abutment. One can see from Figure 3.4-3 that the armor layer covers the outside of the scour
hole. However, because the maximum scour depth is located in the upstream of the abutment,
only the samples from the larger scour hole were analyzed for this paper. Figure 3.4-6 shows
sediment samples of the armor layer and fine sediment deposition of the three uniform sediments.
The armor layer generated in D50=0.58mm sediment is covered by coarser particles. Meanwhile,
coarse particles are also found in fine sediment ridge. With the decreasing of D50, more fine
sediments can be found in armor layer while less coarse particles are found in the fine sediment
ridge. As smaller D50s have less coarse particles, the sediment size in the armor layer decreases.
Smaller particles in the armor layer will provide less protection in the river bed around the bridge
abutment. A smaller grain size in the armor layer can result in a deeper scour depth.
Samples of armor layer in scour hole samples of deposition of the ridge distribution curve
(a) D50= 0.58mm
(b) D50= 0.50mm
(c) D50= 0.47mm

92
Figure 3.4- 6 Samples of armor layer, fine sediment ridge and related distribution curves
Effect of armor layer on maximum scour depth
Zhang et al. (2012) pointed out that the extent of the scour hole exhibits a strong relationship
with the D90. The maximum scour depth and scour volume decrease with an increase of the D90
around a spur dike Dimensional analysis is used to study the relationship of sediment size of the
armor layer and the maximum scour depth.
Dimensional analysis provides a convenient way for building a framework for parameters on
which the maximum scour depth depends. Given the complexity of the interaction of various
parameters, NCHRP (2011) identified five major groups of dimensionless parameters affecting
the maximum scour depth: flow intensity, Froude number, sediment size, abutment and flow
geometry, flow distribution and the abutment stability parameter. In this framework, the
influence of non-uniform sediment size is unclear, and the roughness of ice cover is not
considered. Herein, the maximum scour depth around bridge abutments depends on the
following parameters in this study.
),,,,,,,,,,( 50max HBlDnndgUfd ibs (3.4-2)
where dmax is the maximum scour depth around the abutment; U is the mean approach velocity; ρ
and ρs is the density of the water and non-uniform sediment respectively; d is the armor layer
grain size; nb is the Manning’s coefficient for the channel bed; ni is the Manning’s coefficient of
ice cover roughness; D50 represents the median grain size; l is the width of the abutment; B is
the width of the flume, and H is the approaching flow depth.
For a flow-sediment mixture, the terms g, ρ, and ρs should not appear as independent parameters.
Additionally, abutment blockage ratio is also kept constant in this study. Equation 3.4-1 is used

93
to calculate the armor layer sediment size d. Since the armor layer sediment size is the main
interest here, d is used in the calculation of the densimetric Froude number.
gdUF so 1// (3.4-3)
Equation 3.4-2 can be simplified as the following:
dc
b
iba
od
H
n
n
d
DFA
d
d)()()()( 50max
(3.4-4)
The densimetric Froude number represents the interaction of sediment and flow, D50/d represents
the impact of sediment composition on the armor layer particle size, ni/nb represents the ice cover
roughness and channel bed roughness, and H/d represents the relationship between approaching
flow depth to the armor layer particle size.
In all, 54 experiments on the local scour around bridge abutments were conducted, while 18 of
which were under open channels for comparison. Under open channels, the ice cover roughness
is treated as 0, and Equation 3.4-4 can be written as:
dba
od
H
d
DFA
d
d)()()( 50max
(3.4-5)
To study the impact of the independent variables, namely Fo, D50/d, H/d, and ni/nb, the following
analysis was conducted.
Figures 3.4-6 and 3.4-7 indicate the variation of maximum scour depth to the densimetric Froude
number. With the increase in Fo, the value dmax/d increases correspondingly. Around both square
and semi-circular abutments, under the same densimetric Froude number, the rough ice cover has
the largest relative maximum scour depth. Due to the limitations of experimental data in open
channels, the data points around the semi-circular abutment are not as clear as that around square
abutment. However, from Figure 3.4-7, under rough ice cover conditions, the scour depth still
has the highest value compared to that with smooth ice cover and open channel conditions.

94
Figure 3.4- 7 Variation of maximum scour depth with Fo at square abutment (left) and semi-circular
abutment (right)
Figures 3.4-8 and 3.4-9 compare the variation of the maximum scour depth with different
sediment composition and approaching flow depth. Even with the limited experimental data
around the semi-circular abutment, an increasing trend is still present for both the square and
semi-circular abutment. With the increase in relative flow depth, the maximum scour depth
increase correspondingly. Moreover, the square abutment results in a larger scour depth than that
of semi-circular abutment under same flow conditions.
Figure 3.4- 8 Variation of the maximum scour depth with related variable around square abutment

95
Figure 3.4- 9 Variation of the maximum scour depth with related variable around semi-circular
abutment
Figures 3.4-10 and Figure 3.4-11 show the regression relationship of the above variables around
the square and semi-circular abutments respectively. For both types of abutments, the rough ice
cover leads to a greater dimensionless maximum scour depth compared to that under smooth ice
cover and open channel. The slope in the figures 3.4-10 and 3.4-11 indicates that ice covered
flow has a large slope compared to that of the open channel.
Figure 3.4- 10 Dependence of the maximum scour depth on related variables around square
abutment
R² = 0.8099
R² = 0.8429
0
10
20
30
40
50
60
70
80
0 100000 200000 300000 400000 500000
d m
ax
/ d
open channel rough cover
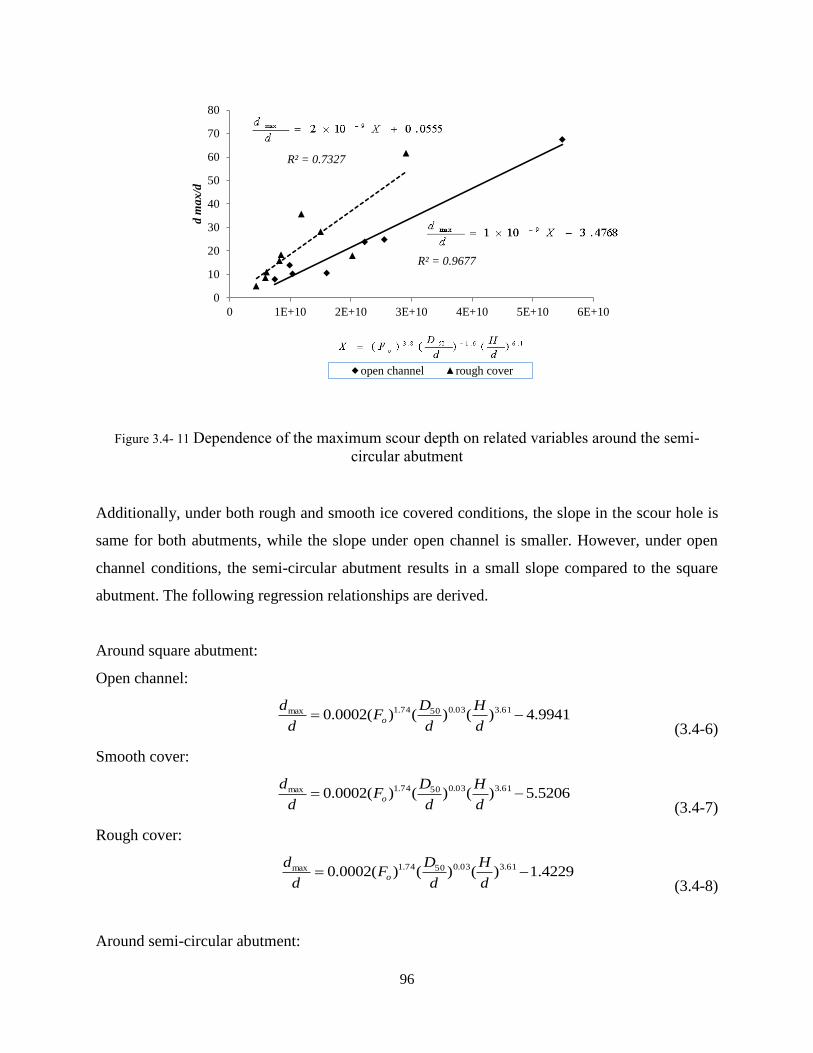
96
Figure 3.4- 11 Dependence of the maximum scour depth on related variables around the semi-
circular abutment
Additionally, under both rough and smooth ice covered conditions, the slope in the scour hole is
same for both abutments, while the slope under open channel is smaller. However, under open
channel conditions, the semi-circular abutment results in a small slope compared to the square
abutment. The following regression relationships are derived.
Around square abutment:
Open channel:
9941.4)()()(0002.0 61.303.05074.1max
d
H
d
DF
d
do
(3.4-6)
Smooth cover:
5206.5)()()(0002.0 61.303.05074.1max
d
H
d
DF
d
do
(3.4-7)
Rough cover:
4229.1)()()(0002.0 61.303.05074.1max
d
H
d
DF
d
do
(3.4-8)
Around semi-circular abutment:
R² = 0.9677
R² = 0.7327
0
10
20
30
40
50
60
70
80
0 1E+10 2E+10 3E+10 4E+10 5E+10 6E+10
d m
ax
/d
open channel rough cover

97
Open channel:
4768.3)()()(101 1.66.1508.39max
d
H
d
DF
d
do
(3.4-9)
Smooth cover:
2705.5)()()(102 1.66.1508.39max
d
H
d
DF
d
do
(3.4-10)
Rough cover:
0555.0)()()(102 1.66.1508.39max
d
H
d
DF
d
do
(3.4-11)
Equations 3.4-6 to 3.4-11 show that H/d has strongest impact on the maximum scour depth
compared to other variables. From the derived relationships both the densimetric Froude number
(variable index 1.74 and 3.8) and approaching flow depth (variable index 3.8 and 6.1) have
stronger impacts on the maximum scour depth than D50/d.
D50/d has the smallest impact for both square and semi-circular abutments. For non-uniform
sediments, if the particle size of the armor layer is larger, then the maximum scour depth around
bridge abutments is smaller under the same flow conditions. In the practical engineering field,
H/d has a relatively large value compared to Fo and D50/d. However, the impact of D50/d is still
not neglected for the consideration of maximum scour depth estimation.
Ice roughness and the armor layer
Research on channel roughness has been conducted; however, for calculating ice cover
roughness, there are still very few studies that can be referred.
Carey (1966) calculated Manning’s roughness coefficient as 0.01~0.0281 by using supporting
field data related to the observed characteristics of the underside of ice cover. From his
calculation, a constant roughness of 0.0251 was used for the winter period. For this study, for
smooth ice cover, the Manning’s coefficient of 0.013 was adapted by referring to Mays (1999).
For this study, the rough ice cover was created by attaching small cubes with dimensions of
2.5cm×2.5cm×2.5cm. Equation 12 is applied to calculate the Manning’s coefficient for rough ice
cover by considering the roughness height of the ice cube (Li, 2012).
6/1039.0 si kn (3.4-12)

98
in which ks is the average roughness height of the ice under side. By using the above equation,
the rough ice cover has a Manning’s coefficient of 0.021, which falls within the ranges
mentioned by Carey (1966). For non-uniform sediment composition with significant portions of
coarse-grain sizes, the channel bed roughness is calculated by using the following equation from
Hager (1999):
6/1
50039.0 Dnb (3.4-13)
The values of dmax/d were compared for both smooth and rough cover under almost the same
conditions in Figure 6-12. Rough cover causes a greater scour depth compared to open channel
around both abutments. However, in some of tests, higher velocity was applied under smooth
cover, which caused a larger dimensionless maximum scour depth.
Figure 3.4- 12 The impact of ice cover roughness on the maximum scour depth
Figure 3.4-13 shows the regression analysis around the square abutment under ice cover, as
indicated by the following equation:
01.377.078.15073.3max )()()()(0001.0d
H
n
n
d
DF
d
d
b
io
(3.4-14)
Figure 3.4-14 shows the regression analysis for the semi-circular abutment, as indicated by the
following equation:
00.300.130.45060.86max )()()()(101d
H
n
n
d
DF
d
d
b
io
(3.4-15)

99
Figure 3.4- 13 Regression relationship under ice cover of related variables around square abutment
Figure 3.4- 14 Regression relationship under ice cover of related variables around semi-circular
abutment
Indexes of independent variables from above equations can be used to indicate the impact of ice
cover and armor layer sediment size. Compared to the ice cover roughness, particle size of armor
layer sediment has a stronger impact on the maximum scour depth. With the increase in particle
diameter of the armor layer, the maximum scour depth decreases correspondingly. Meanwhile,
around the semi-circular abutment, the index for ni/nb equals to 1. From regression analysis, one
can also notice the particle size of the armor layer has a strong impact in reducing the
R² = 0.9329
0
10
20
30
40
50
60
70
80
0 100000 200000 300000 400000 500000 600000 700000
d m
ax/d
square abutment

100
dimensionless maximum scour depth. This conclusion is in line with a previous study conducted
by Sui et al. (2010a). In hydraulic engineering, a mixture of coarse sediments in the vicinity of
bridge foundations can reduce maximum scour depth, which has a similar impact as riprap.
3.4.3 Conclusions
By conducting experimental research on the maximum scour depth under ice cover around
bridge abutments, the impact of armor layer development and ice cover roughness is discussed.
The armor layer grain size has a strong impact on the dimensionless maximum scour depth. With
the increase in the particle size of armor layer, the maximum scour depth decreases
correspondingly. With the increases in ice cover roughness, the maximum scour depth increases.
The relationships between maximum scour depth, water depth, densimetric Froude number, ice
cover roughness, and armor layer grain size are derived by using dimensionless analysis. During
the period of ice cover formation and during the breakup of ice jams, the roughness of ice cover
is beyond our present knowledge. The present study indicates the necessity for further ice scour
research as it relates to hydraulic engineering.
References
1. Ackermann N L, Shen H T, Olsson P, 2002, Local scour around circular piers under ice
covers. Proceeding of the 16th IAHR International Symposium on Ice, International Association
of Hydraulic Engineering Research, Dunedin, New Zealand.
2. Andre R, Thang T, 2012, Mean and turbulent flow fields in a simulated ice-cover channel
with a gravel bed: some laboratory observations, Earth Surface Processes and Landforms, Vol.
37, pp: 951-956.
3. Barbhuiya A K, Dey S, 2004, Local scour at abutments: a review, Sadhana, Vol. 29, part
5, Printed in India, pp. 449-476.
4. Carey K L, 1966, Observed configuration and computed roughness of the underside of
river ice, St Croix River, Wisconsin, Professional paper 550-B, US Geological Survey, pp.
B192-B198.
101
5. Dey S, Barbhuiya A K, 2004, Clear water scour at abutments in thinly armored beds,
Journal of Hydraulic Engineering, ASCE, Vol. 130, No. 7, pp. 622-634.
6. Dey S, Raika R V, 2007, Clear water scour at piers in sand beds with an armor layer of
gravels, Journal of Hydraulic Engineering, ASCE, Vol. 133, No. 6, pp. 703-711.
7. Ettema R, 1984, Sampling armor-layer sediments, Journal of Hydraulic Engineering,
ASCE, Vol. 110, No. 7, pp. 992-996.
8. Ettema R, 2002, Review of alluvial-channel responses to river ice, Journal of Cold
Region Engineering, ASCE, Vol. 16, No. 4, pp.191-217.
9. Ettema R, Braileanu F, Muste M, 2000, Method for estimating sediment transport in ice
covered channels, Journal of Cold Region Engineering, ASCE, Vol. 14, No. 3, pp. 130-144.
10. Ettema R, Daly S, 2004, Sediment transport under ice. ERDC/CRREL TR-04-20. Cold
regions research and Engineering Laboratory, US Army Corps of Engineers.
11. Froehlich D C, 1995, Armor limited clear water construction scour at bridge, Journal of
Hydraulic Engineering, ASCE, Vol. 121, pp. 490-493.
12. Guo J, 2012, Pier scour in clear water for sediment mixtures, Journal of Hydraulic
Research, Vol. 50, No. 1, pp. 18-27.
13. Hager W H, 1999, Wastewater Hydraulics: Theory and Practice, Springer, Berlin, New
York.
14. Hains D B, 2004, An experimental study of ice effects on scour at bridge piers, PhD
Dissertation, Lehigh University, Bethlehem, PA.
15. Hains D B, Zabilansky L, 2004, Laboratory test of scour under ice: data and preliminary
results, Cold regions research and engineering laboratory, ERDC/CRREL TR-04-09.
16. Jha S K, Bombardelli F A, 2011, Theoretical/Numerical model for the transport of non
uniform suspended sediments in open channels, Advances in Water Resources, Vol. 34, pp. 577-
591.
17. Kuhnle, R A, 1993, Incipient motion of sand-gravel sediment mixtures, Journal of
Hydraulic Engineering, Vol. 119, No. 12, pp. 1400-1415.
18. Khullar N K, Kothyari U C, Raju K G R, 2010, Suspended wash load transport of non-
uniform sediments, Journal of Hydraulic Engineering, Vol. 136, No. 8, pp. 534-543.

102
19. Li S S, 2012, Estimates of the Manning’s coefficient for ice covered rivers, Water
Management, Proceedings of the Institution of Civil Engineers, Vol. 165, Issue WM9, pp. 495-
505.
20. Mays L W, 1999, Hydraulic Design Handbook, MaGraw-Hill, pp. 3.12.
21. Melville B W, 1992, Local scour at bridge abutments. Journal of Hydraulic Engineering,
ASCE, Vol 118 (4), pp. 615-631.
22. Meyer-Peter E, Mueller R, 1948, Formula for bed-load transport, Proceedings of
International Association for Hydraulic Research, 2nd Meeting, Deft, Netherlands, pp. 39-64.
23. Munteanu A, 2004, Scouring around a cylindrical bridge pier under partially ice-covered
flow condition, Master thesis, University of Ottawa, Ottawa, Ontario, Canada.
24. NCHRP Web-only Document 181, 2011, Evaluation of Bridge-Scour Research:
Abutment and Contraction Scour Processes and Prediction. NCHRP Project 24-27(02).
25. Smith B T, Ettema R, 1997, Flow resistance in ice covered alluvial channels, Journal of
Hydraulic Engineering, ASCE, Vol. 123, No. 7, pp. 592-599.
26. Sui J, Afzalimehr H, Samani A K, Maherani M, 2010a, Clear-water scour around semi-
elliptical abutmetns with armored beds, International Journal of Sediment Research, Vol. 25, No.
3, pp. 233-244.
27. Sui J, Wang J, He Y, Krol F, 2010b, Velocity profile and incipient motion of frazil
particles under ice cover. International Journal of Sediment Research, Vol 25(1), pp. 39-51.
28. Xu H, Lu J, Liu X, 2008, Non-uniform sediment incipient velocity, International Journal
of Sediment Research, Vol. 23, No. 1, pp. 69-75.
29. Yang C T, 1973, Incipient motion and sediment transport, Journal of the Hydraulics
Division, ASCE, Vol. 99, No. HY10, Proceeding paper 10 067, pp. 1679-1704.
30. Yang C T, 2003, Sediment transport, theory and practice, Krieger publishing company,
Krieger Drive, Malabar, Florida 32950.
31. Zhang H, Nakagawa H, Mizutani H, 2012, Bed morphology and grain size characteristics
around a spur dyke, International Journal of Sediment Research, Vol. 27, No. 2, pp. 141-157.

103
3.5 ADV measurements of flow field along a round abutment under ice covers
Local scour is a complex phenomenon resulting from the interaction of the three dimensional
turbulent flow around bridge foundations and sediment. Local scour around bridge abutments or
piers has been an interesting topic for a long time. As mentioned by Melville (1992), 6 of 10
bridge failures that occurred in New Zealand during Cyclone Bola were related to abutment or
approach scour. Luigia et al. (2012) indicated that approximately 50 to 60 bridges fail on average
each year in the US. The Federal Highway Administration has estimated that over 60% of bridge
collapses in the US is from local scour (NCHRP, 2011).
Bridge foundations should be designed to withstand the effects of scour resulting from designed
floods. Estimation of the scour depth at bridge foundations is a problem that has perplexed
designers for many years. Improving the understanding of local scour is therefore vital for the
engineers responsible for the design of bridge foundations.
In cold regions of northern hemisphere, ice cover is a big issue as it can stay as long as 6 months
on some rivers. Ice cover can result in many problems, such as ice jamming, flooding, restricting
the generation of hydro-power, block river navigation and affect the ecosystem balance (Hicks,
2009). Numerous researches contributed lots work on the ice related hydrology and hydraulic
research (Beltaos, 2000; Prowse, 2001; Ettema and Daly, 2004; Wang, 2008; Sui et al., 2009).
Ice cover can significantly change the flow field and impact of sediment transport in natural
rivers. Lau and Krishnappan (1985), Ettema et al. (2000) developed their own methods for
estimating the sediment transport under ice cover separately. Sui et al. (2000) derived
interrelationships of suspended sediment concentration and riverbed deformation under ice cover
at Hequ Reach of the Yellow River. Turcotte et al. (2011) reviewed the sediment transport
process in ice affected rivers by documenting a range of unique ice and sediment transport
process. Considerable advances have been made concerning ice forces on structures, such as
bridges (Brown, 2000) and dams as reported by Morse and Hicks (2005). However, very few
researches have ever been conducted regarding the local scour around bridge foundations under
different roughness of ice cover. In addition, only a few experiments can be found on the local
scour under ice cover (Ackermann et al. 2002, Hains and Zabilansky, 2004; Sui et al. 2010). To
date, there is still no research measure the flow field in the scour hole around bridge abutment

104
under ice cover. To fill this gap, a series of flume experiments were conducted in 2012. The
objectives of this research are as following.
a. Compare the flow field measured by ADV in open channel and under ice cover around the
semi-circular abutment.
b. Compare the scour depth around the bridge abutment at different locations.
c. Study the impact of sediment composition on the maximum scour depth by introducing a
dimensionless particle parameter.
3.5.1 Methodology
A series of experiments were conducted in a large scale flume with the dimension of 40m long,
2m wide and 1.3m deep. The flume is located at Quesnel River Research Center, Likely, BC,
Canada. The slope of the flume bottom is 0.2%. A holding tank was made in the upstream of the
flume with a volume of 90m3 to keep a constant discharge rate in the experimental zone. Two
valves were connected to adjust water into the holding tank for the purpose of changing the flow
velocity. From the holding tank, water overflowed from a rectangular weir to flow dissipaters in
the experimental zone. One sand box was created in the flume with depth of 30cm. Figure 3.5-1
shows the setup of abutment and ice cover in the large scale flume.
Figure 3.5- 1 Experimental setup
Since ice cover is the main interest here, we made two types of ice cover for the research, namely
smooth cover and rough cover. A smooth ice cover was created from the original Styrofoam. A

105
rough ice cover was created by attaching small cubes of the Styrofoam to the underside of the
smooth ice cover. The small cubes have a dimension of 2.5cm ×2.5cm × 2.5cm, with a spacing
distance of 3.5cm from each other. Meanwhile, three different natural non-uniform sediments
were used in the study. The D50 of the three sediments were 0.58cm, 0.50cm and 0.47cm. One
round abutment with the diameter of 20cm was made from plexiglass. The dimensions of the
abutment and coordinate system can be found in Figure 3.5-2. In front of the sand box, a SonTek
IQ was installed in the bottom of the false floor to measure the approaching flow velocity, water
depth, water temperature, etc. Meanwhile, a staff gauge was also installed in the sand box for
depth measurement. A 10 MHz SonTek ADV was used to measure the flow field in the vicinity
of the abutment. Table 3.5-1 summarizes the experimental conditions and some preliminary
results for each flume run.
Table 3.5- 1 The maximum scour depth under different conditions.
Cover
condition
D50
(mm)
D16
(mm)
D84
(mm)
Water
depth
(m)
Average
velocity
(m/s)
Maximum
scour depth
(cm)
Open
channel
0.58 0.28 1.91 0.07 0.21 0.0
0.58 0.28 1.91 0.19 0.23 5.5
0.58 0.28 1.91 0.07 0.26 2.7
0.50 0.26 1.66 0.07 0.21 3.5
0.50 0.26 1.66 0.19 0.23 7.0
0.50 0.26 1.66 0.07 0.26 6.0
0.47 0.23 0.82 0.07 0.21 0.0
0.47 0.23 0.82 0.19 0.23 15.0
0.47 0.23 0.82 0.07 0.26 15.0
Smooth
cover
0.58 0.28 1.91 0.07 0.23 2.3
0.58 0.28 1.91 0.19 0.20 3.2
0.58 0.28 1.91 0.07 0.20 1.0
0.50 0.26 1.66 0.07 0.23 6.5
0.50 0.26 1.66 0.19 0.20 6.0
0.50 0.26 1.66 0.07 0.20 2.5

106
0.47 0.23 0.82 0.07 0.23 13.5
0.47 0.23 0.82 0.19 0.20 12.0
0.47 0.23 0.82 0.07 0.20 3.0
Rough
cover
0.58 0.28 1.91 0.07 0.20 2.2
0.58 0.28 1.91 0.19 0.20 3.5
0.58 0.28 1.91 0.07 0.22 4.7
0.50 0.26 1.66 0.07 0.20 4.0
0.50 0.26 1.66 0.19 0.20 7.5
0.50 0.26 1.66 0.07 0.22 9.0
0.47 0.23 0.82 0.07 0.20 4.0
0.47 0.23 0.82 0.19 0.20 17.0
0.47 0.23 0.82 0.07 0.22 13.7
To make sure each experiment had the same conditions, the following steps were strictly
followed in the experimental study.
(1) Before each experiment, the abutment model was leveled and fixed in the sand box to make
sure the abutment is upright to the flume bottom. On the outside surface of the abutment,
different measuring lines have been drawn for the purpose of measuring scour depth. In all, 13
measuring lines (P ~ Q) were made for the round abutment (Figure 3.5-2).
(2) At the beginning of each experiment, the flume was slowly filled up by adjusting the valves
in the holding tank. One template was made to cover the scour zone from initial scouring. After
the required water depth was reached, the valves were adjusted to get a certain flow rate in the
flume and the template was then removed to start the experiment. The duration of scour
experiments was 24 hours; enough for the maximum scour depth development in a large flume
from the authors’ observation.
Because the main interest of the research here is the flow field in the scour hole. The down-
looking ADV was used. The sampling interval is 0.04s. At each measuring point, the
measurement last at least 20s.
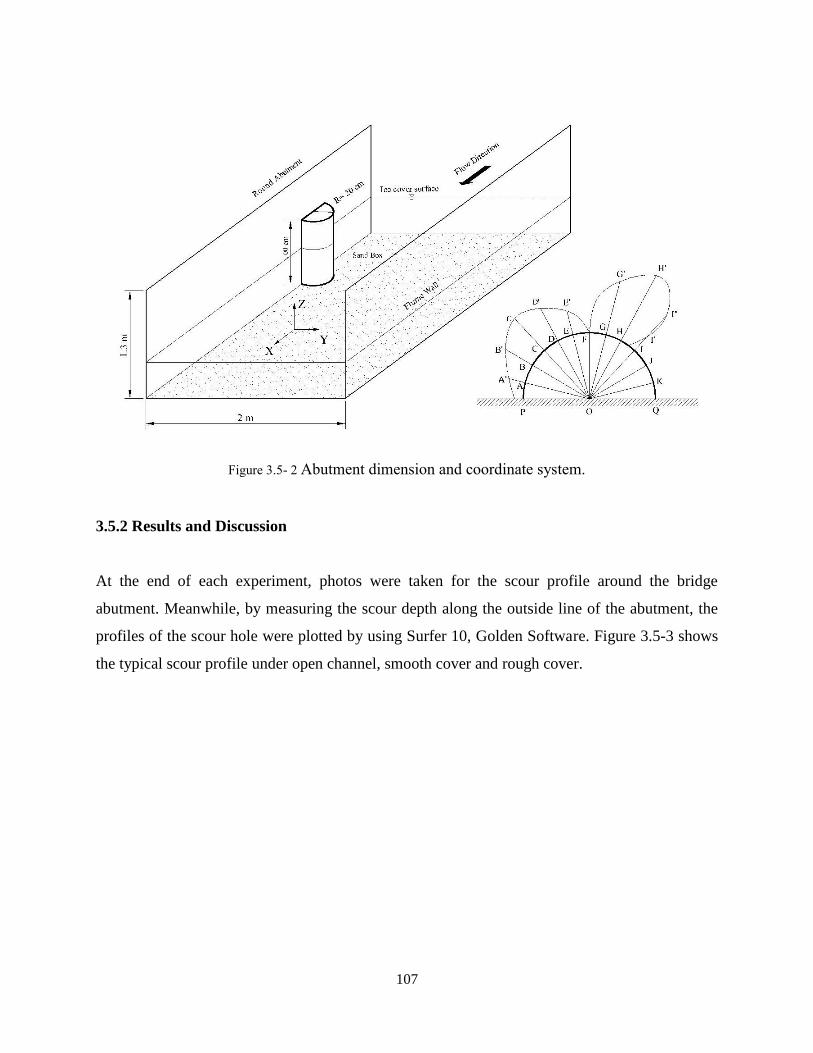
107
Figure 3.5- 2 Abutment dimension and coordinate system.
3.5.2 Results and Discussion
At the end of each experiment, photos were taken for the scour profile around the bridge
abutment. Meanwhile, by measuring the scour depth along the outside line of the abutment, the
profiles of the scour hole were plotted by using Surfer 10, Golden Software. Figure 3.5-3 shows
the typical scour profile under open channel, smooth cover and rough cover.

108

109
Figure 3.5- 3 Contours of scour hole under open channel, smooth cover, and rough cover
Scouring process and contours
From our observation, the scour started form the toe area of the abutment. In the first two hours,
one large scour hole has already been formed. The maximum scour depth is located at the corner
which is around 50º facing upstream. With the developing of scour hole, more sediment moves
out to the downstream, which can also be seen from the pile of fine sediment ridge from Figure
3.5-3. The location of the scour hole is independent on the covered condition. While for the
dimensions of the scour hole, from Figure 3.5-4, it can be seen that ice cover roughness has a
more obvious impact on the profile of the scour. Under rough ice cover, the scouring area is
larger compared to that under smooth cover.
During the scouring process, a primary vortex was observed in the upstream of the abutment. As
mentioned by Dey and Barbhuiya (2005), around the bridge pier, the horseshoe vortex is the
primary reason for scouring. While under ice cover, several small horseshoe vortexes can be
detected in the scour hole. The horseshoe vortex had the direction of clock wise. Meanwhile,
some horizontal vortexes were also noticeable.

110
In the downstream of abutment, a fine sediment ridge can be seen from the outside of Point J and
K to downstream. From our observation, under rough ice cover, the ridge has a longer length
compare to that under smooth ice cover.
As shown in Figure 3.5-4, one can clearly notice the location of the maximum scour depth
around the bridge abutment. The profiles along the measuring points (A ~ K) are different under
ice covers compare to that in open channels. Please also note that the approaching velocity in
open channels is larger that those in covered channels. Following three observations are noted.
(1) In open channel, the maximum scour occurs around C and D, while under ice covers, the
maximum depth locates between B and C. Additionally, under rough ice cover, the maximum
scour depth closes to B. From our understanding, with an increase in ice roughness, we can make
the assumption that in the upstream of the abutment, extra shear stress caused by the ice cover
impacts location of maximum scour depth.
(2) In open channel, one fine sediment ridge can be noticed along from J to Q. However, there
was no clearly fine sediment ridge under ice covers along the abutment. From our observation,
fine sediment ridge locates at a distance downstream away from the abutment under ice covers.
And with the increase in roughness of ice cover, the start point of fine sediment ridge further
from the abutment.

111
Figure 3.5- 4 The scour profile along the round abutment under different conditions
(3) Two scour holes can be noted along the abutment. One locates in the upstream surface of the
abutment, the other locates between measuring points F to I. Meanwhile, along the abutment, F

112
is the dividing point of two scour holes. Under ice covers, the elevation at F is close to the
original channel bed.
(4) From our observation, under ice covers, the scouring process takes more time to reach the
maximum scour depth. In open channels, in the large scale flume, the scour hole develops fast in
the first 3 hours. While under ice cover, due to the increased opposing resistance, the scouring
time is longer than that in open channels. Additionally, with the increase in roughness, the
scouring process under rough cover is longer than that under smooth ice cover.
Velocity distribution under ice cover
As reported by Sui et al. (2010), due to the increased wetted perimeter of flow caused by ice
cover, the composite resistance increased correspondingly. The upper portion of the flow is
mainly affected by the ice cover, while the lower portion is mainly influenced by the channel bed.
The maximum velocity locates between the cover and channel bed. However, in the vicinity of
the abutment, inside the scour hole, the flow field has never been studied.
By using one down-looking ADV, 3D instantaneous velocity can be measured along the
abutment. One should evaluate two parameters provided in the ADV file, which is signal-to-
noise ratio (SNR) and the correlation (COR), to ensure the ADV measurements can provide an
accurate representation of the flow velocity (Wahl, 2000). According to the manufacturer, the
SNR is a function of turbidity, the amount of particulate matter in the flow. COR is an indicator
the relative consistency of the behavior of the scatters in the sampling volume during the
sampling period. Here we used the following standard: SNR > 15 db, and COR >70%. The
WinADV software program developed by the Bureau of Reclamation’s Water Resources
Research Laboratory was used to filter the ADV data from poor quality or erroneous data based
on the two parameters mentioned above. The velocity field from the upstream surface of the
abutment to the downstream was measured. Figure 3.5-5 shows the Reynolds- averaged velocity
measured along the abutment from A to K under open channels, smooth cover and rough cover.
The following findings have been noticed.
(1) From Point A to I, one can notice that in open channels, the velocity component in the Z
direction is small compared to the X and Y components at the same elevation. Meanwhile,
compare with the value in Z direction under smooth cover and rough cover, the velocities in the

113
Z direction in open channels are so small being close to zero. From our understanding, ice cover
imposed extra force to the flow downwards which creates a higher velocity component in the Z
direction.
(2) From Point J to K, the velocity component is larger than that from A to I in open channels. J
and K are the only two locations that have large Z direction velocity component under open
channel condition. Additionally, the fine sediment ridge was located close to this zone. Due to
the boundary layer of the flume wall, small downward vortexes can be generated in the
downstream of the abutment. Our ADV measurement also proved this assumption.
(3) Under ice covered condition from Point A to F, all the measured velocity components in Z
direction have negative value. However, in the downstream, from G to H, the velocity
component in Z direction has positive value. Based on this, we make the following assumption:
in the upstream, the primary vortex moves downwards, while in the downstream, the vortex
moves upwards from the bottom.
(4) In the upstream of the abutment, velocity component in the X direction is always positive,
while the Y component has the trend from positive to negative. At Point C to E, the Y direction
velocity is the least compared to that in other points. In other words, the Y direction velocity
component decreases along the abutment in the upstream surface till the maximum scour depth.
After that, the Y velocity component increases again to the downstream. Meanwhile, we make
the conclusion that the Y direction velocity contributes less to the maximum scour depth
compared to the velocity component in the X and Z direction.
(5) As mentioned above, in open channels, the maximum scour depth locates between C and D.
While under ice cover, the maximum scour depth locates between B and C. From our ADV
measurement, we also notice that, in open channels, the X direction velocity contributes most to
the scour hole development. While under ice covered condition, the Z direction velocity has the
largest impact.
(6) With the increase in ice cover roughness, the gradient of velocity in all the three directions
decreases, which can be found from the ADV measurements at all points.
(7) No scour hole was observed in the downstream of the abutment under ice cover. However,
from I to K, velocity components are highly turbulent compared to that without ice covers.

114
Point A
Point B
Point C
Point D

115
Point E
Point F
Point G
Point H

116
Point I
Point J
Point K
Figure 3.5- 5 The velocity distribution along the abutment under different conditions: open channel
(Left), smooth cover (Middle), rough cover (right)
3.5.3 Conclusion
The local scour under ice covers were conducted in a large flume in 2012. Equal distance
measuring lines were made along the round abutment to measure the 3D flow velocity in the
scour hole. We found that in open channels, the maximum scour depth locates at the upstream
surface of the abutment with an angle about 50º, while under ice cover, the angle is around 60º.

117
By using a down-looking 3D ADV, the flow field at different locations and elevations were
measured. Compared to the flow in open channel, the velocity component in Z direction
contribute much to the development of scour hole under ice covers. Based on the comparison of
flow distribution, the velocity field around the abutment was analyzed under open channel and
ice covered conditions.
References
1. Ackermann N L, Shen H T, Olsson P, 2002. Local scour around circular piers under ice
covers. Proceeding of the 16th IAHR International Symposium on Ice, International Association
of Hydraulic Engineering Research, Dunedin, New Zealand.
2. Beltaos S, 2000. Advances in river ice hydrology. Hydrological Processes. Vol. 14, pp.
1613-1625.
3. Brown T G, 2000. Ice loads on the piers of Confederation Bridge, Canada. Structural
Engineer, Vol. 78, pp. 18-23.
4. Dey S, Barbhuiya A K, 2005. Turbulent flow field in a scour hole at a semicircular
abutment. Canadian Journal of Civil Engineering, Vol. 32, pp. 213-232.
5. Ettema R, Braileanu, F, Muste M, 2000. Method for estimating sediment transport in ice
covered channels. Journal of Cold Regions Engineering, Vol. 14, No. 3, pp. 130-144.
6. Ettema R, Daly S F, 2004. Sediment transport under ice. ERDC/CRREL TR-04-20. Cold
regions research and Engineering Laboratory, US Army Corps of Engineers.
7. Hains D, Zabilansky L, 2004. Laboratory test of scour under ice: Data and preliminary
results. ERDC/CRREL TR-04-09. Cold regions research and Engineering Laboratory, US Army
Corps of Engineers.
8. Hicks F, 2009. An overview of river ice problems: CRIPE 07 guest editorial Cold regions
Science and Technology, 55: pp. 175-185.
9. Lau Y L, Krishnappan B G, 1985. Sediment transport under ice cover. Journal of
Hydraulic Engineering, ASCE, 111(6), pp. 934-950.
10. Luigia B, Paolo P, Giuliano D B, 2012. Bridge pier scour: a review of process,
measurements and estimates. Environmental Engineering and Management Journal, Vol. 11 (5).

118
11. Melville B W, 1992. Local scour at bridge abutments, Journal of Hydraulic Engineering.
ASCE, Vol. 118, No. 4, pp. 615-631.
12. Morse B, Hicks F, 2005. Advances in river ice hydrology 1999-2003. Hydrological
Processes, Vol. 19, pp. 247-263.
13. NCHRP Web-only Document 181, 2011. Evaluation of Bridge-Scour Research:
Abutment and Contraction Scour Processes and Prediction. NCHRP Project 24-27(02).
14. Prowse T D, 2001. River-Ice ecology: Part A. Hydrologic, geomorphic and water-quality
aspects. Journal of Cold Regions Engineering, Vol. 15, pp. 1-16.
15. Sui J, Wang D, Karney B, 2000. Suspended sediment concentration and deformation of
riverbed an a frazil jammed reach. Canadian Journal of Civil Engineering, Vol. 27, 1120-1129.
16. Sui J, Faruque M A A, Balanchandar R, 2009. Local scour caused by submerged square
jets under model ice cover. Journal of Hydraulic Engineering, Vol. 135, No. 4, pp. 316-319.
17. Sui J, Wang J, He Y, Krol F, 2010. Velocity profile and incipient motion of frazil
particles under ice cover. International Journal of Sediment Research, Vol. 25, No. 1, pp. 39-51.
18. SonTek, 2001, Acoustic Doppler Velocimeter (ADV) principles of operation, SonTek
ADV technical manual, SonTek, San Diego.
19. Turcotte B, Morse B, Bergeron N E, Roy A G, 2011. Sediment transport in ice affected
rivers. Journal of Hydrology, Vol. 409, pp. 561-577.
20. Wahl T L, 2000, Analyzing data using WinADV. Joint Conference on water resources
engineering and water resources planning and management, Minneapolis, Minnesota, pp. 1-10.
21. Wang J, Sui J, Karney B, 2008. Incipient motion of non-cohesive sediment under ice
cover – an experimental study. Journal of Hydrodynamics, Vol. 20, No. 1, pp. 177-124.

119
3.6 The incipient motion of bed material and shear stress analysis around bridge
abutments under ice-cover
Local scour refers to the scour caused by river obstructions such as bridge abutments, piers, and
other objects that obstruct the flow (Chang, 2002). It has been identified as an important issue by
civil engineers for a long time. Excessive scour can cause structural failure and even result in the
loss of life. According to Melville (1992), 29 of 108 bridge failures in New Zealand between
1960 and 1984 were attributed to abutment scour. Over the past few decades, local scour around
bridge abutments has received worldwide attention: Laursen and Toch, 1956; Froehlich, 1995;
Melville, 1997; Coleman et al, 2003; Dey and Barbhuiya, 2005. However, almost all of these
studies were conducted in open channels.
In the Northern Hemisphere, winter lasts up to six months, which is a big challenge for hydraulic
engineers to estimate scour condition around bridges. To fill this gap, some researchers started to
look at this problem from an experimental approach (Ackermann et al., 2002; Hains, 2004;
Munteanu, 2004; Ettema and Daly, 2004; Sui et al., 2009, 2010; Munteanu and Frenette, 2010)
and numerical approach (Beltaos, 2000; Wang et al., 2008).
Ackermann et al. (2002) investigated the effects of ice cover on local scour around bridge piers.
By using uniform sediments, the author’s found that for equivalent averaged flow velocities, the
existence of an ice cover could increase the local scour depth by 25%~35%. For live bed scour, a
rough cover gave a slightly larger scour depth than smooth cover. Munteanu (2004) conducted
experiments on local scour around cylinders and found that under clear water conditions local
scour increased up to 55 percent. Sui et al. (2010) mentioned that the flow velocity profiles
under ice cover appear to be identical regardless of the average flow velocity and flow depth. As
reported by Wang et al. (2008), under ice covered conditions, flow velocity profiles can be
divided into the upper portion which is from the ice cover bottom to the point of the maximum
velocity, and the lower portion, which is from the channel bed to the maximum velocity. When
the channel bed and ice cover have different resistance coefficients, the maximum velocity will
be closer to the surface with the smallest resistance coefficient.
In practice, dimensionless shear stress is used to study the incipient motion. Dey and Barbhuiya
(2005) investigated the three dimensional turbulent flow properties around a short vertical wall
abutment both upstream and downstream of the scour hole in open channels. By using the
120
Reynolds stresses, the bed shear stresses were also calculated. From their experiments, the
maximum bed shear stresses were about 3.2 times that of the incoming flow. Duan et al. (2009)
examined the Reynolds stresses around a spur dike. It was found the Reynolds stress was 2-3
times that of the incoming flow. Since the abutment and spur dike have similar contraction
impact on the flow, all three studies showed the similar amplification factor of bed shear stress in
open channel flow.
For non-uniform sediments, finer materials can be transported faster than coarser materials under
constant flow conditions. The remaining coarser layer is called armor layer (Yang, 2003). With
the development of an armor layer, further sediment transport is inhibited. Non-uniform
sediment makes up typical bed composition in natural rivers.
To date, there are no known experimental studies on clear water scour around bridge abutments
under ice covered conditions with non-uniform sediments. The effects of ice cover and armor
layer have to be considered in the analysis of local scour. In this study, we started with a particle
force analysis under ice cover by introducing armor layer particle size. Then the dimensionless
shear stress was calculated.
3.6.1 Experimental setup and measurement
Experiments were conducted in a 40m long, 2m wide and 1.3m deep flume located at Quesnel
River Research Center, BC, Canada (Figure 3.6-1a). The flume had a bottom slope of 0.2% and a
90m3 volume holding tank was located in the upstream section of the flume to keep a constant
flow rate in the experimental zone. At the end of the holding tank, water overflowed from a
rectangular weir to flow dissipaters in the experimental zone. Two types of ice cover were used
in the research, namely smooth cover and rough cover. The ice cover was 6m long, which
covered the experimental sand box area completely. Two abutment models were made from
plexi-glass, semi-circular and square abutments (Figure 3.6-1b). The abutment model was
located in the sand box to simulate a bridge abutment with a solid foundation in the floodplain. A
smooth ice cover was created from Styrofoam panels, while a rough ice cover was created by
attaching small cubes of the Styrofoam to the underside of the smooth ice cover. The small cubes
had dimensions of 2.5cm ×2.5cm × 2.5cm, with a spacing distance of 3.5cm from each other. In
this study, three different natural non-uniform sediments were used in the flume. The D50 of the
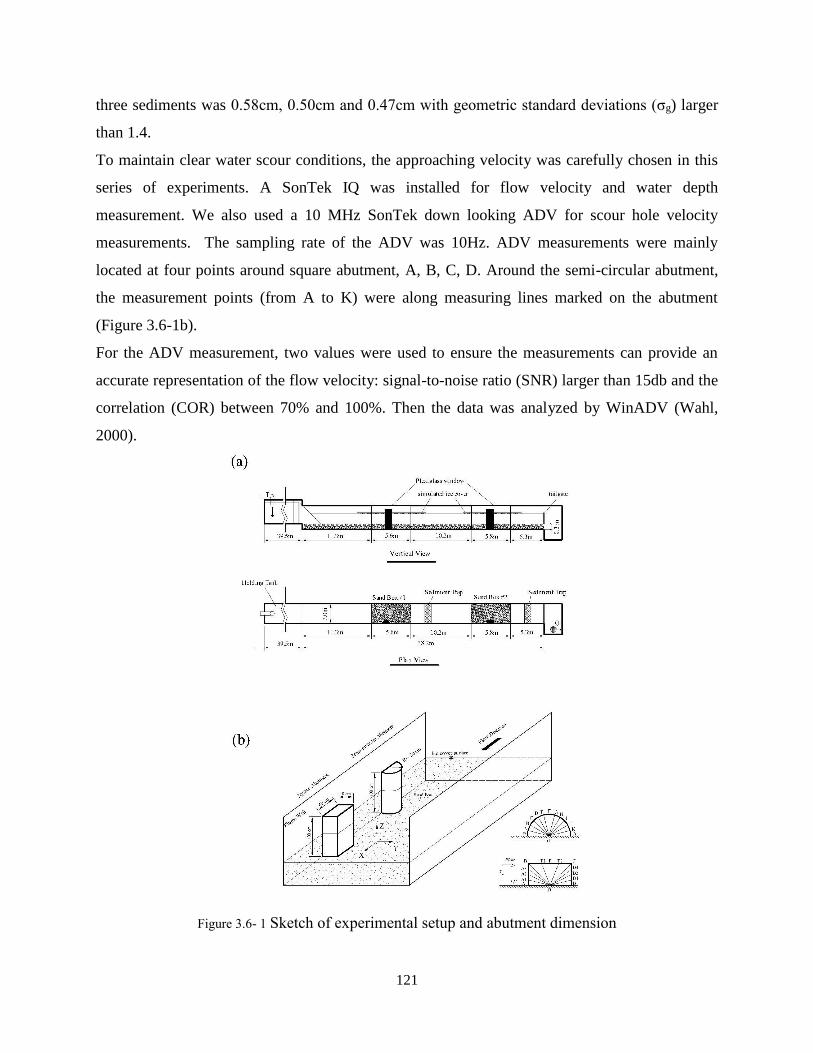
121
three sediments was 0.58cm, 0.50cm and 0.47cm with geometric standard deviations (σg) larger
than 1.4.
To maintain clear water scour conditions, the approaching velocity was carefully chosen in this
series of experiments. A SonTek IQ was installed for flow velocity and water depth
measurement. We also used a 10 MHz SonTek down looking ADV for scour hole velocity
measurements. The sampling rate of the ADV was 10Hz. ADV measurements were mainly
located at four points around square abutment, A, B, C, D. Around the semi-circular abutment,
the measurement points (from A to K) were along measuring lines marked on the abutment
(Figure 3.6-1b).
For the ADV measurement, two values were used to ensure the measurements can provide an
accurate representation of the flow velocity: signal-to-noise ratio (SNR) larger than 15db and the
correlation (COR) between 70% and 100%. Then the data was analyzed by WinADV (Wahl,
2000).
Figure 3.6- 1 Sketch of experimental setup and abutment dimension

122
3.6.2 Results and discussion
Incipient motion under ice cover
The presence of ice cover in the channel altered the flow characteristics to a great extent. From
our observation, the incipient motion started from the toe area of the abutment. Around the
square abutment, the scour started at point B and extends to A and E. While around the semi-
circular abutment, the scour was firstly observed between Point D and E.
The forces acting on a sediment particle at the bottom of the scour hole under ice cover are
shown in Figure 3.6-2. For most natural rivers, the river slopes are small enough that the
component of gravitational force acting on the particle in the direction of flow can be neglected.
As shown in Figure 3.6-2, the forces to be considered related to the incipient motion are the drag
force FD, lift force FL, submerged weight W, and the resistance force FR. The angle of the scour
hole with vertical abutment is α.
Figure 3.6- 2 Incipient motion in the scour hole under ice cover
The scour angle was calculated by measuring the upstream facing scour distance and maximum
scour depth. For the square abutment, the distance from Point B to upstream was measured,
while for the semi-circular abutment, since the maximum scour depth was located between Point
D and E, the larger distance outwards from D and E was used. We found that around the square
abutment, the average scour angle was 65º, while the average scour angle around the semi-
circular abutment was 74º. From the perspective of preventing local scour, the larger the scour

123
angle, the better. Our study indicates the idea that streamline-like abutments cause less local
scour depth under ice-covered condition.
A sediment particle is at a state of incipient motion when the following conditions have been
satisfied:
cos
sin
RL
RD
FFW
FF
(3.6-1)
By using Yang’s criteria (2003) for incipient motion, the drag force can be expressed as:
22
24dDD V
dCF
(3.6-2)
where CD is the drag coefficient at velocity Vd, ρ is the density of water, and Vd is the local
velocity at a distance d above the bed. In open channels, the shear velocity, shear stress or flow
velocity profile can be calculated by using the logarithmic distribution law. The lift force acting
on the particle can be obtained as:
22
24dLL V
dCF
(3.6-3)
where CL is the lift coefficient at velocity Vd.
The submerged weight of the particle can be given by:
g
dW s )(
6
3
(3.6-4)
By applying Equation 3.6-2 to 3.6-4 to Equation 3.6-1, the following relationship can be found:
LD
dCctgC
gdV
1
3
4
(3.6-5)
The lift coefficient and drag coefficient can be determined by experiments. Since the sediments
used here are non-uniform sediment, in Equation 3.6-5, the diameter of the sediment particle will
be replaced by D50, and the following can be derived.
50
1
3
4D
CctgC
gV
LD
d
(3.6-6)
From Equation 3.6-6, one can note that, with the increase in scour angle, the velocity needed to
move the particle in the scour hole will increase correspondingly. When the scour angle is equal
to 90º, the velocity reaches maximum. However, when the scour angle is less than 90º the critical

124
velocity for incipient motion in the scour hole will be smaller compared to that with flat beds
under the same flow conditions.
Regarding the drag coefficient CD, since the Reynolds number in this research was larger than
105, the Stokes Law cannot be applied. By referring the relationship between drag coefficient and
Reynolds number for a sphere, developed by Graf and Acaroglu (1966), the value of CD can be
determined. For the lift coefficient CL, the lift coefficient was a function of shape and density of
the sediment particle. If CL=βCD, the trail and error method was used to get the value of β in this
research.
Around the square abutment, the maximum scour depth was located around Point B, herein, the
measurements at B were used to calculate the near bed velocity. While for the semi-circular
abutment, the maximum scour depth was located between Point D and E, so the measurements at
these two points were used.
Under ice cover, if the flow velocity profile was available, as suggested by Kuhnle et al. (2008),
the bed shear velocity can be calculated by fitting a least square regression to flow velocity and
distance measurements from near the bed to 20% of the depth using the following:
hd
udU C
lg75.5*
(3.6-7)
in which, U*c is the critical bed shear velocity, u is the mean flow velocity at a distance of h.
However, if the velocity profile was not available, the logarithmic velocity distribution
assumption was one of the generally accepted methods for calculating the shear velocity based
on Prandtl and Einstein correction factor (Einstein, 1950).
50
10
*27.12
log75.5D
R
uU
h
C
(3.6-8)
Where Rh is the channel hydraulic radius, u is the average cross sectional velocity, D50 is used to
represent the particle size since the sediment used in this research is non-uniform sediment, χ is
the Einstein multiplication factor, here we used χ=1, and the ice cover can be included in the
channel hydraulic radius. The critical shear velocities were calculated based on Equation 3.6-8.

125
At the end of each experiment, an armor layer developed around the bridge abutment. To assess
the impacts of armor layers, Meyer-Peter and Mueller (1948) developed the following equation
by using one mean grain size of the bed to calculate the sediment size in the armor layer.
2/36/1
1 90/ DnK
SHd
(3.6-9)
Where d is the sediment size in the armor layer; S is the channel slope; H is the mean flow depth;
K1 is the constant number equal to 0.058 when H is in meters; n is the channel bottom roughness
or Manning’s roughness, and D90 is the bed material size where 90% of the material is finer.
To further examine the relationship between near bed velocity and maximum scour depth, Figure
3.6-3 was plotted. From Figure 3.6-3, at least three observations can be noticed.
Figure 3.6- 3 Incipient motion of different sediments with the maximum scour depth
(1) For the same sediment, with the increase in Vd/Uc, the value of dmax/d decreases. From Figure
3.6-3, the slope of the curve represents the changing rate of scour depth. At the beginning, the
scour depth increased quickly. Afterward, with the development of the scour hole and formation
of the armor layer, the changing rate decreased correspondingly. The changing rate became 0 at
the end, which means no variation in scour depth. In other words, the maximum scour depth was
reached.
(2) Under the same flow condition with the same value of Vd/Uc, sediment with smaller D50 had
a larger maximum scour depth. In this case, sediment with D50=0.47mm had the largest
maximum scour depth.

126
(3) When the value of Vd/Uc reached about 14, the values of dmax/d remained constant. During
the scour hole development and formation of the armor layer, the velocity near the scour hole is
higher than the critical velocity of D50. When the maximum scour depth is constant, then the
maximum scour depth is reached.
Dimensionless shear stress
In practice, the shear Reynolds number is usually used to study the incipient motion, which can
be given by:
DUR C
e**
(3.6-10)
in which, U*C is the shear velocity calculated by Equation 3.6-8, D is the grain size diameter, and
ν is the kinetic viscosity of the fluid. Since the sediment used here is non-uniform sediment, the
grain size diameter will be replaced by D50, then Equation 3.6-9 can also be written as follows,
50** DU
R Ce
(3.6-11)
The dimensionless shear stress τ* is calculated by using the following equation:
50
2
**
Dg
U C
(3.6-12)
where Δρ is the difference in mass density between water and sediment.
The relation between shear Reynolds number and dimensionless shear stress is known as the
Shields Diagram, which is widely used for predicting incipient motion in open channels. The
calculated criteria for incipient motion of bed material is presented in Figure 3.6-4. For all three
non-uniform sediments, with the increase in shear Reynolds number, the dimensionless shear
stress increased correspondingly. However, with the same shear Reynolds number, finer
sediment had a higher dimensionless shear stress. In this case, sediment with a D50=0.47mm had
the largest dimensionless shear stress. With a high proportion of finer particles in the non-
uniform sediment, the local scour can easily be triggered around bridge abutments. With the
same bed material, the larger the shear Reynolds number, the larger the dimensionless shear
stress. For the same dimensionless shear stress, the coarser the bed material, the larger the shear
Reynolds number.

127
Figure 3.6- 4 The variation of shear Reynolds number with dimensionless shear stress
Since the maximum scour depth was our main interest in the scour estimation, the maximum
scour depth versus dimensionless shear stress was presented in Figures 3.6-5, 3.6-6 and 3.6-7.
The incipient motion for non-uniform sediment varied more in comparison to that of uniform
sediment. To consider the impacts of armor layer in the maximum scour depth, the ratio of
maximum scour depth to the particle size of armor layer was developed.
Figure 3.6-5 shows the variation of maximum scour depth with the dimensionless shear stress
around a square abutment under both open channel and ice covered condition. The overall trend
of the curve is increasing. With the increase in dimensionless shear stress, the maximum scour
depth increases correspondingly. It is also indicated in the figure that the trend for open channel
and covered conditions were the same for different non-uniform sediments. Due to the protection
from the armor layer, after the dimensionless shear stress reaches the threshold value, the ratio of
maximum scour depth to the particle size of armor layer would be close to constant. However,
the experimental data in the present research was not enough to show the overall trend. More
data are needed to prove this statement in the future, which means larger dimensionless shear
stress will be needed for both open channel and ice covered flow.
Figure 3.6-6 compares the dimensionless shear stress under open channel condition with that of
under rough ice covered condition around a square abutment. Figure 3.6-7 compared the
dimensionless shear stress under smooth ice cover condition with that of under rough covered
condition around a semi-circular abutment. For both types of abutments, the maximum scour
depth increases with the increase in dimensionless shear stress. Under rough cover, less
0
0.005
0.01
0.015
0.02
0.025
0.03
2 2.5 3 3.5 4 4.5 5 5.5 6 6.5 7
τ*
Re*
D50=0.58mm D50=0.50mm D50=0.47mm

128
dimensionless shear stress is needed to reach the same scour depth compared to that for open
channel and smooth covered conditions. With the same dimensionless shear stress, rough cover
results in a deeper scour depth around the abutment compared to that of open flow conditions.
One can note that rough ice cover can cause a deeper scour depth compared to that under smooth
ice covered condition.
Figure 3.6- 5 The maximum scour depth variation with dimensionless shear stress around square
abutment
Figure 3.6- 6 The maximum scour depth variation with dimensionless shear stress under ice cover
and open channel (square abutment)
0
20
40
60
80
100
0.004 0.008 0.012 0.016 0.02 0.024 0.028
dm
ax
/d
Dimensionless shear stress
open channel

129
Figure 3.6- 7 The maximum scour depth variation with dimensionless shear stress under smooth
ice cover and rough ice cover (semi-circular abutment)
3.6.3 Conclusions
The present study investigated the features of incipient motion under ice cover with non-uniform
sediments. Experiments have been conducted by using two abutment models and three non-
uniform sediments, under open flow condition and two ice-covered conditions. The following are
the main conclusions that can be drawn from this study:
1. The average scour angle around a semi-circular abutment is around 10 degrees larger than that
around the square abutment under clear water conditions. The streamline-like abutment with a
solid foundation in the floodplain causes less local scour depth than that caused by the square
abutment under ice-covered condition.
2. Based on the scour angle around bridge abutment, it was found that for same non-uniform
sediment, due to the formation of an armor layer, the maximum scour depth remains constant.
3. With the increase in dimensionless shear stress, the maximum scour depth increases
correspondingly. Additionally, the presence of ice cover can result in a deeper maximum scour
depth compared to that under open flow condition. In reality, when the ice cover forms in early
winter and breaks up in early spring, the roughness coefficient of ice cover (or ice jam) is
surprisingly larger than the stable covered period during winter. Therefore the scour depth
around bridge abutment at this time may increase due to the enlarged roughness coefficient.
0
10
20
30
40
50
60
70
0.01 0.012 0.014 0.016 0.018 0.02 0.022 0.024 0.026
dm
ax
/dDimensionless shear stress
smooth cover rough cover

130
The present research deals with the incipient motion and dimensionless shear stress for non-
uniform sediments under ice covered condition. Further work needs to be carried out to
investigate the velocity profile under ice cover in the scour hole around abutments with solid
foundations.
Notation
CD= drag coefficient at velocity Vd
CL= lift coefficient at velocity Vd
d= sediment size in the armor layer
D50 = Mean diameter of sediment for which 50% of the sample is finner (mm)
FD= Drag force for incipient motion
FL= Lift force
FR= Resistance force
g = gravity acceleration (ms-²)
H= mean flow depth
n= Manning’s roughness value
Re* = Reynolds number (-)
S= channel slope
U*c= critical bed shear velocity
u= mean velocity at distance h from the bottom
W= Particle submerged weight
α = scour angle (-)
ρ= density of water
ρs= density of sediment
σg= geometric standard deviation (-)
τ*= dimensionless shear stress (-)

131
References
1. Ackermann, N. L., Shen, H. T., Olsson, P. (2002) Local scour around circular piers under
ice covers. Proc. Int. Conf. 16th IAHR International Symposium on Ice, IAHR, Dunedin, New
Zealand.
2. Coleman, S. E., Lauchlan, C. S., Melville, B. W. (2003). Clear water scour development
at bridge abutments, J. Hydraulic Res., 41(5), 521–531.
3. Dey, S., Barbhuiya, A. K. (2005). Turbulent flow field in a scour hole at a semicircular
abutment, Can. J. Civ. Eng., 32, 213-232.
4. Duan, J. G., He, L., Fu, X., Wang, Q. (2009). Mean flow and turbulence around
experimental spur dike, Adv. Water Resour., 32, 1717-1725.
5. Ettema, R., Braileanu, F., Muste, M. (2000). Method for estimating sediment transport in
ice covered channels. J. Cold Reg. Eng., ASCE, 14( 3), 130-144.
6. Ettema, R., Daly, S. (2004). Sediment transport under ice. ERDC/CRREL TR-04-20.
Cold regions research and Engineering Laboratory, US Army Corps of Engineers.
7. Froehlich, D. C., (1995). Armor limited clear water construction scour at bridge. J.
Hydraulic Eng., 121, 490-493.
8. Graf, W. H., Acaroglu, E. R. (1966). Setting velocities of natural grains. Bulletin of the
International Association of Scientific Hydrology, 11(4).
9. Hains, D. B. (2004). An experimental study of ice effects on scour at bridge piers. PhD
Dissertation, Lehigh University, Bethlehem, PA.
10. Laursen, E. M., Toch, A. (1956). Scour around bridge piers and abutments. Iowa
Highway Research Board Bulletin, No 4.
11. Melville, B. W. (1992). Local scour at bridge abutments. J. Hydraulic Eng., 118, 615-
631.
12. Melville, B. W. (1997). Pier and Abutment scour: integrated approach. J. Hydraulic Eng.,
123(2), 125-136.
13. Munteanu, A. (2004). Scouring around a cylindrical bridge pier under partially ice-
covered flow condition. Master thesis, University of Ottawa, Ottawa, Ontario, Canada.
132
14. Munteanu, A., Frenette, R. (2010). Scouring around a cylindrical bridge pier under ice
covered flow condition-experimental analysis. R V Anderson Associates Limited and Oxand
report.
15. Sui, J., Faruque, M. A. A., Balachandar, R. (2009). Local scour caused by submerged
square jets under model ice cover. J. Hydraulic Eng., 135(4), 316-319.
16. Sui, J., Wang, J., He, Y., Krol, F. (2010). Velocity profile and incipient motion of frazil
particles under ice cover. International Journal of Sediment Research, 25(1), 39-51.
17. Smith, B. T., Ettema, R. (1997). Flow resistance in ice covered alluvial channels. J.
Hydraulic Eng., 123( 7), 592-599.
18. Wahl, T. L. (2000). Analyzing data using WinADV. 2000 Joint Conference on water
resources engineering and water resources planning and management. Minneapolis, Minnesota,
1-10.
19. Wang, J., Sui, J., Karney, B. (2008). Incipient motion of non-cohesive sediment under ice
cover – an experimental study. Journal of Hydrodynamics, 20(1), 177-124.
20. Yang, C. T. (2003). Sediment transport, theory and practice. Krieger publishing company,
Krieger Drive, Malabar, Florida.

133
4 GENERAL CONCLUSION
Experiments have been conducted in a large scale flume to study the impact of ice cover
roughness and non-uniform sediments on the local scour around two types of commonly used
abutments. It is found that ice cover plays an important role in the development of local scour
hole around bridge abutments, including bed morphology, maximum scour depth, maximum
scour depth location, armor layer etc. The general conclusions are as follows.
The location of the maximum scour depth along the abutment is around 60º from the flume wall
for semi-circular abutment. While the maximum scour depth around square abutment locates in
the upstream corner. The results indicate that the impact of shape factor for semi-circular
abutments on maximum scour depth is smaller in covered conditions than that in open channels.
The range of shape factor is between 0.66 and 0.71. The downstream slope in the scour hole is
also smaller compared to that in the upstream. Under ice cover, the average scour depth is
always greater compared to that in open channels. The average scour depth under rough ice
cover is 35% greater than that under smooth ice cover. In this research, densimetirc Froude
number is also used to investigate the impacts of non-uniform sediment composition on local
scour. The scour volume and scour area are calculated and compared to open channel, smooth
and rough cover conditions.
By using Buckingham Pi theorem for dimensional analysis, the impact of shape factor and ice
cover roughness on maximum scour depth around abutments is investigated. Empirical equations
of the maximum scour depth are developed, which indicates that with an increase in sediment
grain size, the maximum scour depth decreased correspondingly.
Furthermore, the impact of armor layer development and ice cover roughness is discussed. The
armor layer only forms in the scour hole while fine sediment deposition is located at the
downstream of the abutment. The armor layer grain size has a strong impact on the
dimensionless maximum scour depth. With the increase in the particle size of armor layer, the
maximum scour depth decreases correspondingly. The relationships between maximum scour
depth, water depth, densimetric Froude number, ice cover roughness, and armor layer grain size
are derived by using dimensionless analysis.
By using a down-looking 3D ADV, the flow field at different locations and elevations around
two abutments was measured. Compared to the flow in open channel, the velocity component in

134
Z direction contributes much to the development of scour hole under ice covers. Additionally,
features of incipient motion under ice cover with non-uniform sediments are studied at the end of
the research. It is interesting to find that the average scour angle around a semi-circular abutment
is around 10 degrees larger than that around the square abutment under clear water conditions.
The streamline-like abutment with a solid foundation in the floodplain causes less local scour
depth than that caused by the square abutment under ice-covered condition. With the increase in
dimensionless shear stress, the maximum scour depth increases correspondingly.
In reality, ice cover is a big issue in the northern hemisphere. When the ice cover forms in early
winter and breaks up in early spring, the roughness of ice cover (or ice jam) is completely
different, compared to that with stable covered period during the winter. Up to date, the impact
of ice cover is beyond our knowledge. The present study indicates the necessity for further ice
scour research as it relates to hydraulic engineering. Empirical equations developed from the
present research can also be used for the estimation of scour depth under ice cover in hydraulic
engineering.

135
5 APPENDIX
Table 5- 1 Experimental data collected at non-uniform sand (D50 = 0.58 mm)
date abutment
type
flume
cover
maximum
depth
(cm)
average
velocity
(m/s)
approach
depth
scour
volume(cm3)
scour
area
(cm2)
average
scour
depth
(cm)
0922 square open 9.5 0.26 0.07 411.46 267.38 1.54
0923 square open 4 0.21 0.07 288.18 355.35 0.81
0926 square open 5.5 0.21 0.19 661.88 592.79 1.12
0927 round open 0 0.21 0.07 0.00 0.00 0.00
0928 round open 5.5 0.23 0.19 1433.09 1009.79 1.42
0929 round open 2.7 0.26 0.07 570.46 782.08 0.73
0930 round smooth 2.3 0.23 0.07 273.33 466.68 0.59
1001 round smooth 3.2 0.2 0.19 696.74 907.55 0.77
1002 round smooth 1 0.2 0.07 165.88 494.57 0.34
1003 square smooth 3.1 0.2 0.07 167.72 264.03 0.64
1004 square smooth 4 0.16 0.19 706.36 733.16 0.96
1005 square smooth 8 0.23 0.07 1201.07 509.75 2.36
1006 square rough 6.5 0.22 0.07 1400.24 904.46 1.55
1007 square rough 5.7 0.21 0.07 993.01 766.47 1.30
1008 square rough 5 0.14 0.19 785.24 518.72 1.51
1009 round rough 2.2 0.21 0.07 238.63 540.96 0.44
1010 round rough 3.5 0.2 0.19 459.50 376.34 1.22
1011 round rough 4.7 0.22 0.07 1127.69 715.74 1.58

136
Table 5- 2 Experimental data collected at non-uniform sand (D50 = 0.50 mm)
date abutment
type
flume
cover
maximum
depth
(cm)
average
velocity
(m/s)
approach
depth
(m)
scour
volume
(cm3)
scour
area
(cm2)
average
scour
depth (cm)
1018 square open 16.4 0.26 0.07 24930.95 3977.91 6.27
1019 square open 7 0.21 0.07 1131.11 1188.88 0.95
1020 square open 6.5 0.21 0.19 1412.31 645.86 2.19
1021 round open 0 0.21 0.07 0.00 0.00 0.00
1022 round open 15 0.23 0.19 19095.94 3335.68 5.72
1023 round open 15 0.26 0.07 16847.15 3401.70 4.95
1024 round smooth 13.5 0.23 0.07 6520.80 1895.73 3.44
1025 round smooth 12 0.2 0.19 5856.95 1758.72 3.33
1026 round smooth 3 0.2 0.07 187.58 213.61 0.88
1027 square smooth 8 0.2 0.07 1610.17 757.03 2.13
1028 square smooth 6.5 0.16 0.19 1002.35 536.94 1.87
1029 square smooth 15.5 0.23 0.07 12372.14 3101.20 3.99
1030 square rough 16.5 0.22 0.07 14090.53 3885.92 3.63
1031 square rough 8.3 0.21 0.07 3582.35 1421.59 2.52
1101 square rough 8 0.14 0.19 2723.10 1151.93 2.36
1102 round rough 4 0.21 0.07 565.81 469.97 1.20
1104 round rough 17 0.2 0.19 13986.93 3020.83 4.63
1103 round rough 13.7 0.22 0.07 3224.38 1150.13 2.80

137
Table 5- 3 Experimental data collected at non-uniform sand (D50 = 0.47 mm)
date abutment
type
flume
cover
maximum
depth
(cm)
average
velocity
(m/s)
approach
depth
(m)
scour
volume
(cm3)
scour area
(cm2)
average
scour depth
(cm)
1107 square open 15 0.26 0.07 8277.42 2002.30 4.13
1108 square open 7.5 0.21 0.07 1007.74 532.61 1.89
1109 square open 6 0.21 0.19 1010.42 652.13 1.55
1110 round open 3.5 0.21 0.07 778.15 717.05 1.09
1111 round open 7 0.23 0.19 3278.91 1528.65 2.14
1112 round open 6 0.26 0.07 3712.67 2240.62 1.66
1113 round smooth 6.5 0.23 0.07 1674.01 1187.83 1.41
1114 round smooth 6 0.2 0.19 2350.44 1549.43 1.52
1117 round smooth 2.5 0.2 0.07 361.83 511.09 0.71
1116 square smooth 4 0.2 0.07 540.29 547.31 0.99
1115 square smooth 4.5 0.16 0.19 608.74 643.44 0.95
1118 square smooth 10.5 0.23 0.07 4752.10 1631.03 2.91
1119 square rough 11 0.22 0.07 4343.89 1657.09 2.62
1120 square rough 6 0.21 0.07 1537.33 832.45 1.85
1121 square rough 4.5 0.14 0.19 999.56 808.63 1.24
1122 round rough 4 0.21 0.07 481.45 507.46 0.95
1123 round rough 7.5 0.2 0.19 2190.03 881.93 2.48
1124 round rough 9 0.22 0.07 5892.06 2264.36 2.60

138
Table 5- 4 Scour contours at D50 = 0.58 mm
Date Contour
0922
0923
0926

139
0928
0929
0930
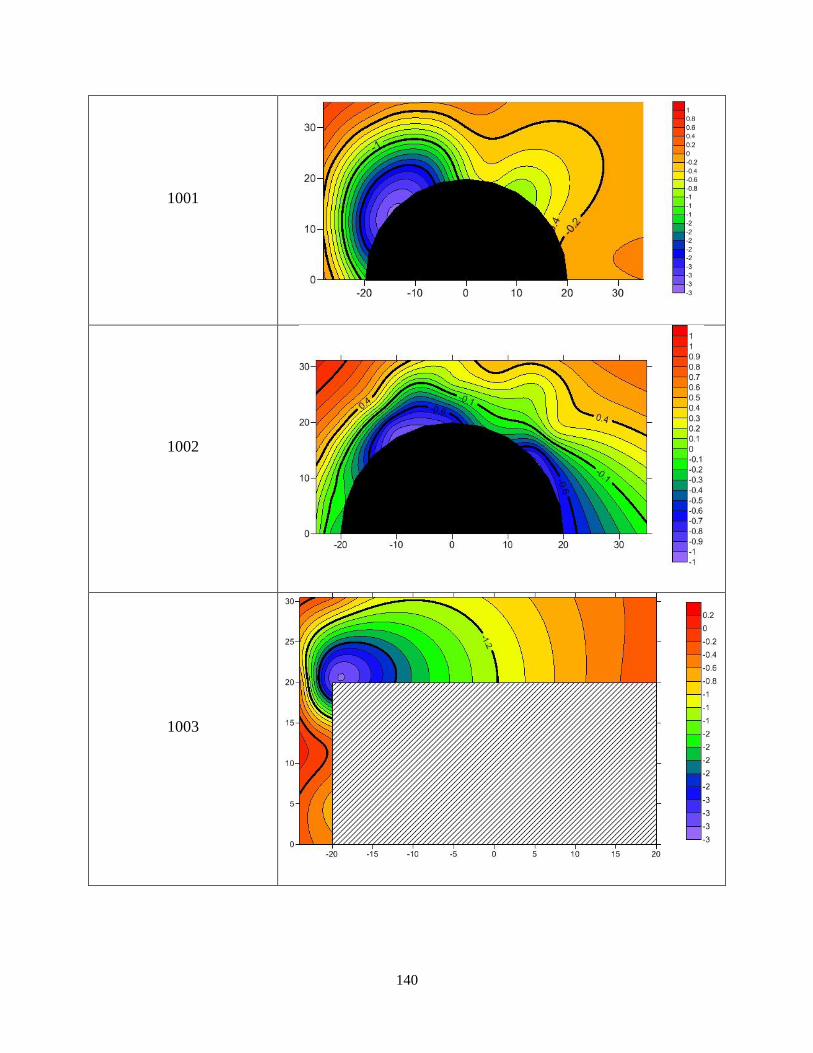
140
1001
1002
1003

141
1004
1005
1006

142
1007
1008
1009

143
1010
1011

144
Table 5- 5 Scour contours at D50 = 0.50 mm
Date Contour
1018
1019
1020

145
1022
1023
1024

146
1025
1026
1027

147
1028
1029
1030

148
1031
1101
1102

149
1103
1104

150
Table 5- 6 Scour contours at D50 = 0.47 mm
Date Contour
1107
1108
1109

151
1110
1111
1112

152
1113
1114
1115

153
1116
1117
1118

154
1119
1120
1121

155
1122
1123
1124