level 1 mathematics and statistics (91028) 2015 · level 1 mathematics and statistics, 2015 ... 1 2...
TRANSCRIPT
910280
1SUPERVISOR’S USE ONLY
9 1 0 2 8
© New Zealand Qualifications Authority, 2015. All rights reserved.No part of this publication may be reproduced by any means without the prior permission of the New Zealand Qualifications Authority.
ASSESSOR’S USE ONLY
TOTAL
Level 1 Mathematics and Statistics, 201591028 Investigate relationships between tables,
equations and graphs
9.30 a.m. Monday 9 November 2015 Credits: Four
Achievement Achievement with Merit Achievement with ExcellenceInvestigate relationships between tables, equations and graphs.
Investigate relationships between tables, equations and graphs, using relational thinking.
Investigate relationships between tables, equations and graphs, using extended abstract thinking.
Check that the National Student Number (NSN) on your admission slip is the same as the number at the top of this page.
You should attempt ALL the questions in this booklet.
Show ALL working.
If you need more space for any answer, use the page(s) provided at the back of this booklet and clearly number the question.
Check that this booklet has pages 2 – 16 in the correct order and that none of these pages is blank.
YOU MUST HAND THIS BOOKLET TO THE SUPERVISOR AT THE END OF THE EXAMINATION.
QUESTION ONE
A plant is growing on the surface of a pond. Hank noticed the plant on Day 1. Two days later Hank was worried about the plant and started measuring the area that the plant covered.
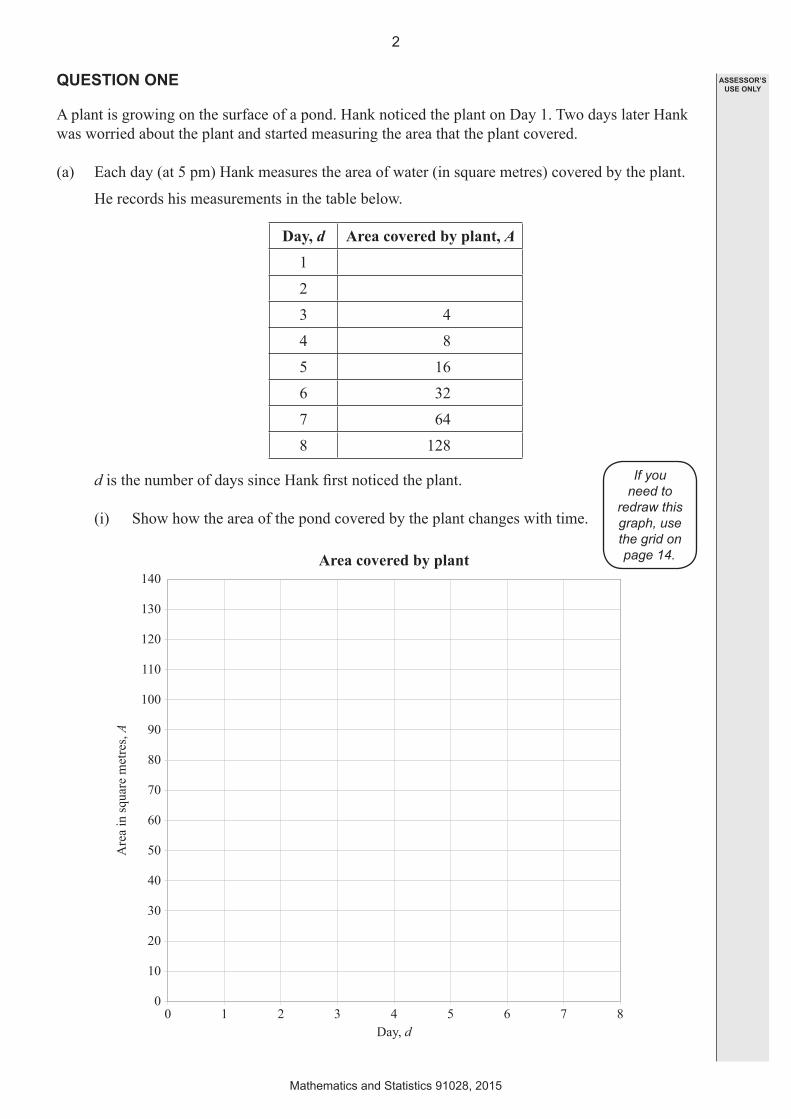
(a) Each day (at 5 pm) Hank measures the area of water (in square metres) covered by the plant.
He records his measurements in the table below.
Day, d Area covered by plant, A1
23 44 85 166 327 648 128
d is the number of days since Hank first noticed the plant.
(i) Show how the area of the pond covered by the plant changes with time.
0
0
10
20
30
40
50
60
70
80
90
100
110
120
130
140
1 2 3 4 5 6 7 8Day, d
Are
a in
squa
re m
etre
s, A
Area covered by plant
If you need to
redraw this graph, use the grid on page 14.
2
Mathematics and Statistics 91028, 2015
ASSESSOR’S USE ONLY
(ii) The plant followed the same pattern of growth from the time when it was first noticed. What area of the pond was covered by the plant when it was first noticed?
Explain your answer.
(iii) Give the equation that describes the area of the plant covering the pond after d days.
(iv) If no intervention takes place, on which day will Hank first measure the area of the plant to be more than 500 square metres?
3
Mathematics and Statistics 91028, 2015
ASSESSOR’S USE ONLY
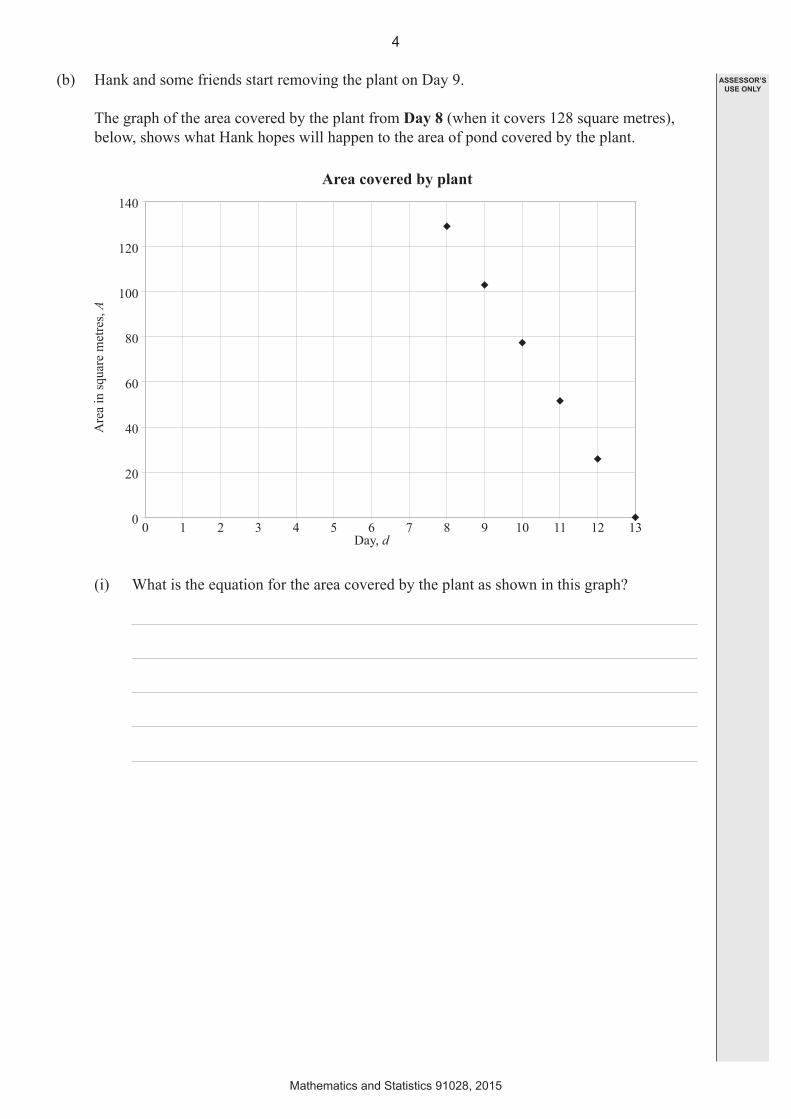
(b) Hank and some friends start removing the plant on Day 9.
The graph of the area covered by the plant from Day 8 (when it covers 128 square metres), below, shows what Hank hopes will happen to the area of pond covered by the plant.
00
20
40
60
80
100
120
140
1 2 3 4 5 6 7 8 9 10 11 12 13Day, d
Are
a in
squa
re m
etre
s, A
Area covered by plant
(i) What is the equation for the area covered by the plant as shown in this graph?
4
Mathematics and Statistics 91028, 2015
ASSESSOR’S USE ONLY
(ii) What is unrealistic about this graph?
Write at least TWO comments with justification.
5
Mathematics and Statistics 91028, 2015
ASSESSOR’S USE ONLY
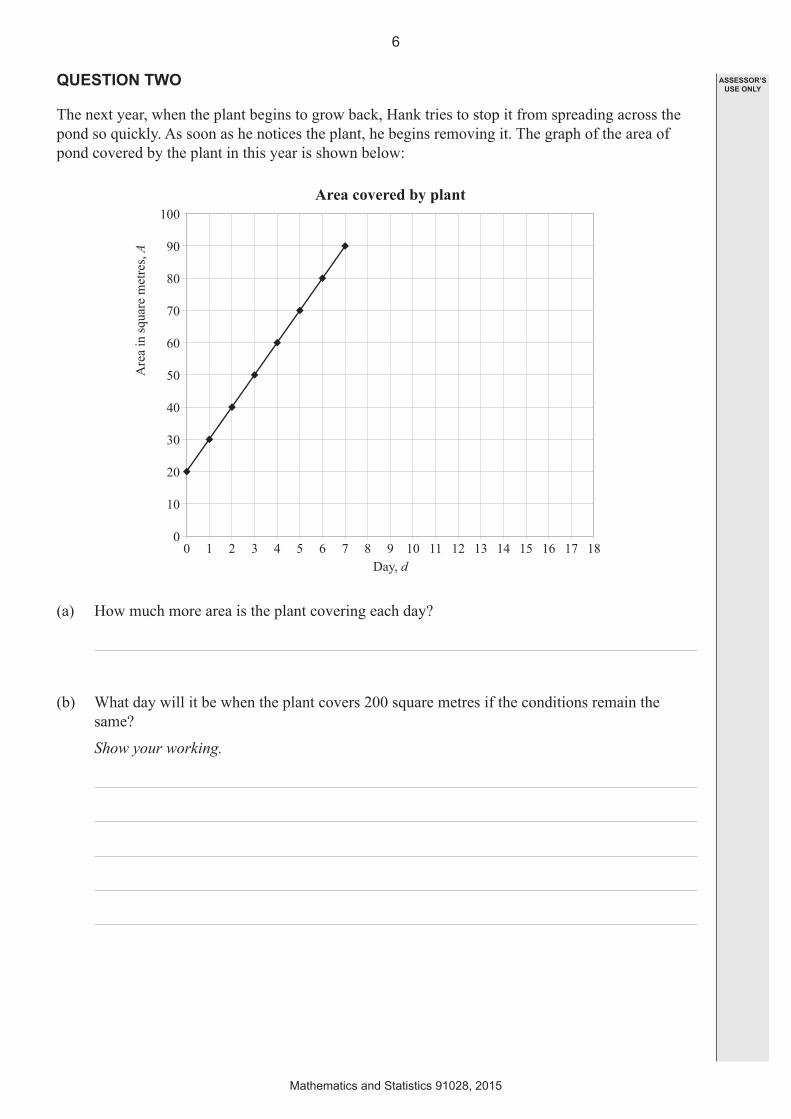
QUESTION TWO
The next year, when the plant begins to grow back, Hank tries to stop it from spreading across the pond so quickly. As soon as he notices the plant, he begins removing it. The graph of the area of pond covered by the plant in this year is shown below:
00
10
20
30
40
50
60
70
80
90
100
1 2 3 4 5 6 7 8 9 10 11 12 13 14 15 16 17 18Day, d
Are
a in
squa
re m
etre
s, A
Area covered by plant
(a) How much more area is the plant covering each day?
(b) What day will it be when the plant covers 200 square metres if the conditions remain the same?
Show your working.
6
Mathematics and Statistics 91028, 2015
ASSESSOR’S USE ONLY

After 7 days removing some of the plant by himself, Hank decides to get help.
(c) One friend helps on Day 8 and Day 9.
The area covered by the plant stays the same for Day 8 and Day 9.
00
10
20
30
40
50
60
70
80
90
100
1 2 3 4 5 6 7 8 9 10 11 12 13 14 15 16 17 18Day, d
Are
a in
squa
re m
etre
s, A
Area covered by plant
(i) What is the equation of this new section of the graph on Day 8 and Day 9?
(ii) What does this section of the graph mean?
(d) Two more friends come to help. Now the area covered by the plant decreases by 15 square metres each day until the plant is completely removed.
(i) Draw a graph on the grid above to show the area of pond covered by the plant from Day 10.
(ii) On what day will there be no plant left?
If you need to
redraw this graph, use the grid on page 14.
7
Mathematics and Statistics 91028, 2015
ASSESSOR’S USE ONLY
(e) The equation of the line for Day 9 onwards is A = 225 – 15d.
If Hank’s 2 friends had come on Day 8, what would the equation of this line have been?
Explain your reasoning.
8
Mathematics and Statistics 91028, 2015
ASSESSOR’S USE ONLY
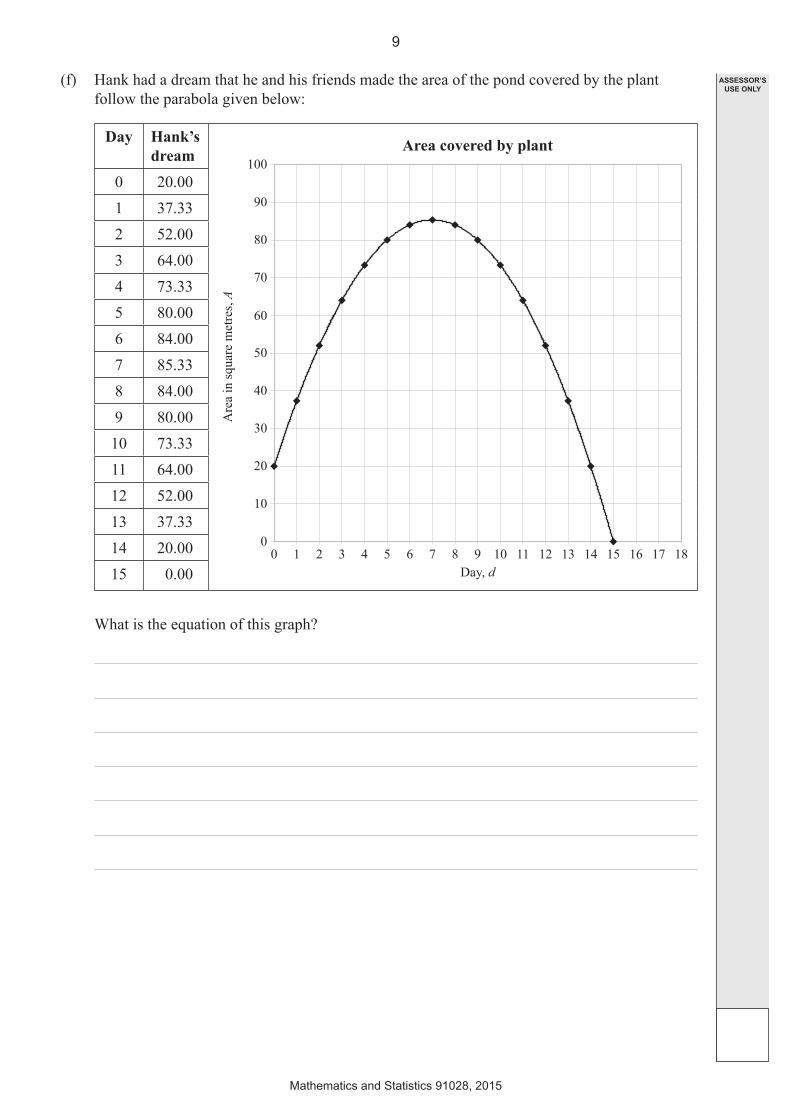
(f) Hank had a dream that he and his friends made the area of the pond covered by the plant follow the parabola given below:
Day Hank’s dream
00
10
20
30
40
50
60
70
80
90
100
1 2 3 4 5 6 7 8 9 10 11 12 13 14 15 16 17 18Day, d
Are
a in
squa
re m
etre
s, A
Area covered by plant
0 20.001 37.332 52.003 64.004 73.335 80.006 84.007 85.338 84.009 80.0010 73.3311 64.0012 52.0013 37.3314 20.0015 0.00
What is the equation of this graph?
9
Mathematics and Statistics 91028, 2015
ASSESSOR’S USE ONLY
QUESTION THREE
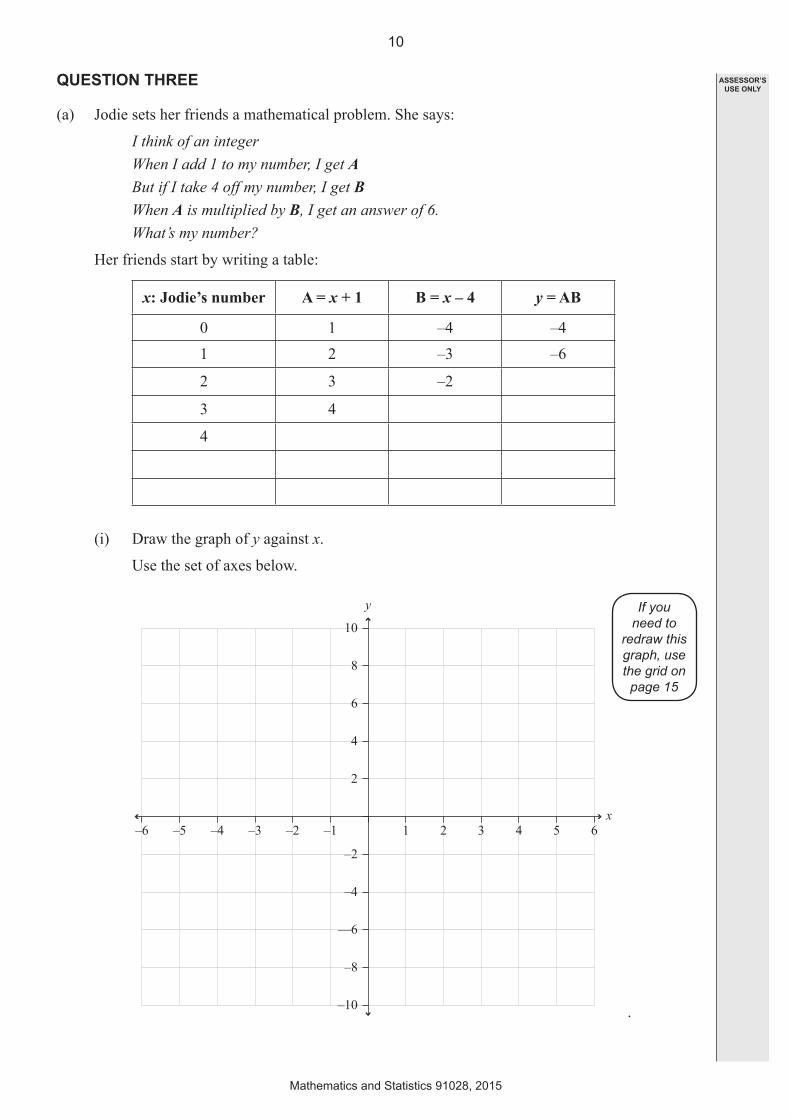
(a) Jodie sets her friends a mathematical problem. She says:
I think of an integer When I add 1 to my number, I get A But if I take 4 off my number, I get B When A is multiplied by B, I get an answer of 6. What’s my number?
Her friends start by writing a table:
x: Jodie’s number A = x + 1 B = x – 4 y = AB
0 1 –4 –41 2 –3 –6
2 3 –2
3 4
4
(i) Draw the graph of y against x.
Use the set of axes below.
2
–2
–4
––6
–8
–10
4
6
8
10
y
x–6 –5 –4 –3 –2 –1 1 2 3 4 5 6
.
If you need to
redraw this graph, use the grid on page 15
10
Mathematics and Statistics 91028, 2015
ASSESSOR’S USE ONLY
(ii) What is the equation of the graph that matches the table above, in terms of x?
y =
(iii) Explain how Jodie’s number can be found from the graph if the answer is 6.
(iv) Suppose Jodie had said “A multiplied by B gives me –10”.
What does your graph tell you about the solutions to this new problem?
11
Mathematics and Statistics 91028, 2015
ASSESSOR’S USE ONLY
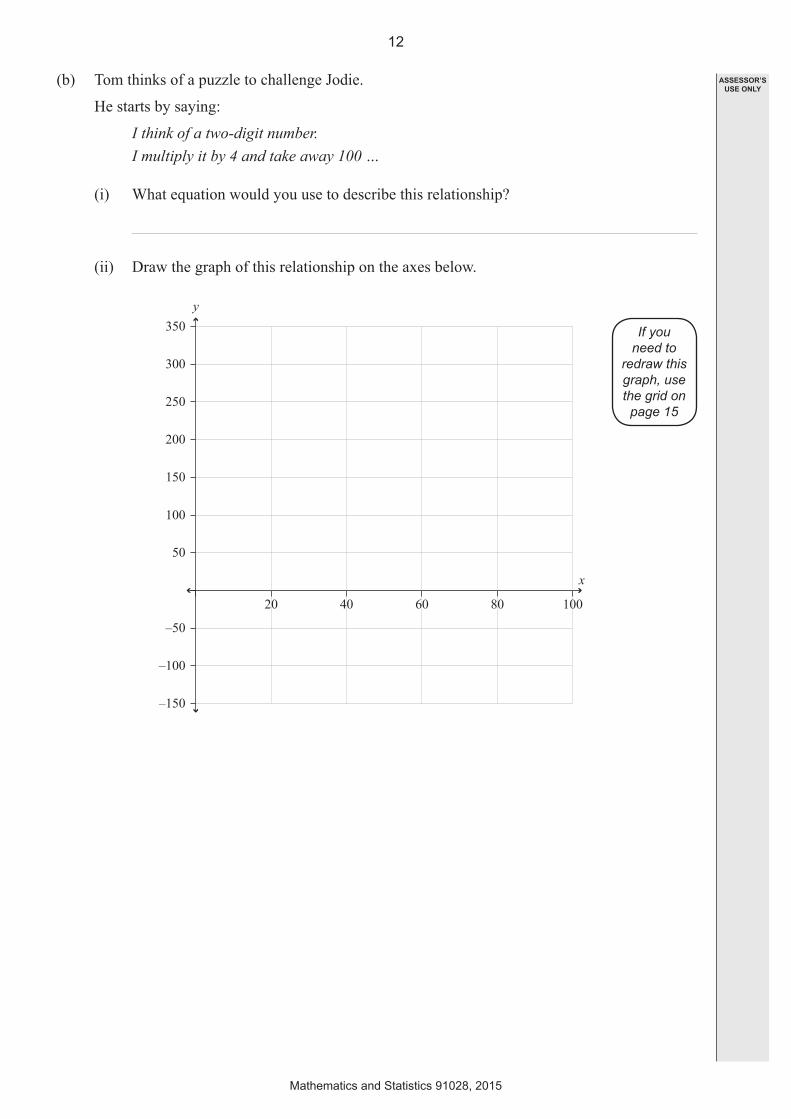
(b) Tom thinks of a puzzle to challenge Jodie.
He starts by saying:
I think of a two-digit number. I multiply it by 4 and take away 100 …
(i) What equation would you use to describe this relationship?
(ii) Draw the graph of this relationship on the axes below.
150
50
100
–50
–100
–150
200
250
300
350y
x
20 40 60 80 100
If you need to
redraw this graph, use the grid on page 15
12
Mathematics and Statistics 91028, 2015
ASSESSOR’S USE ONLY
(iii) Tom’s whole puzzle is:
Guess my 2-digit number: If I multiply it by 4 and take away 100 … I get the same as when I add 47 to it and then multiply the result by 1.12 Explain how the solution to Tom’s question can be found, and give the solution as
accurately as possible.
13
Mathematics and Statistics 91028, 2015
ASSESSOR’S USE ONLY
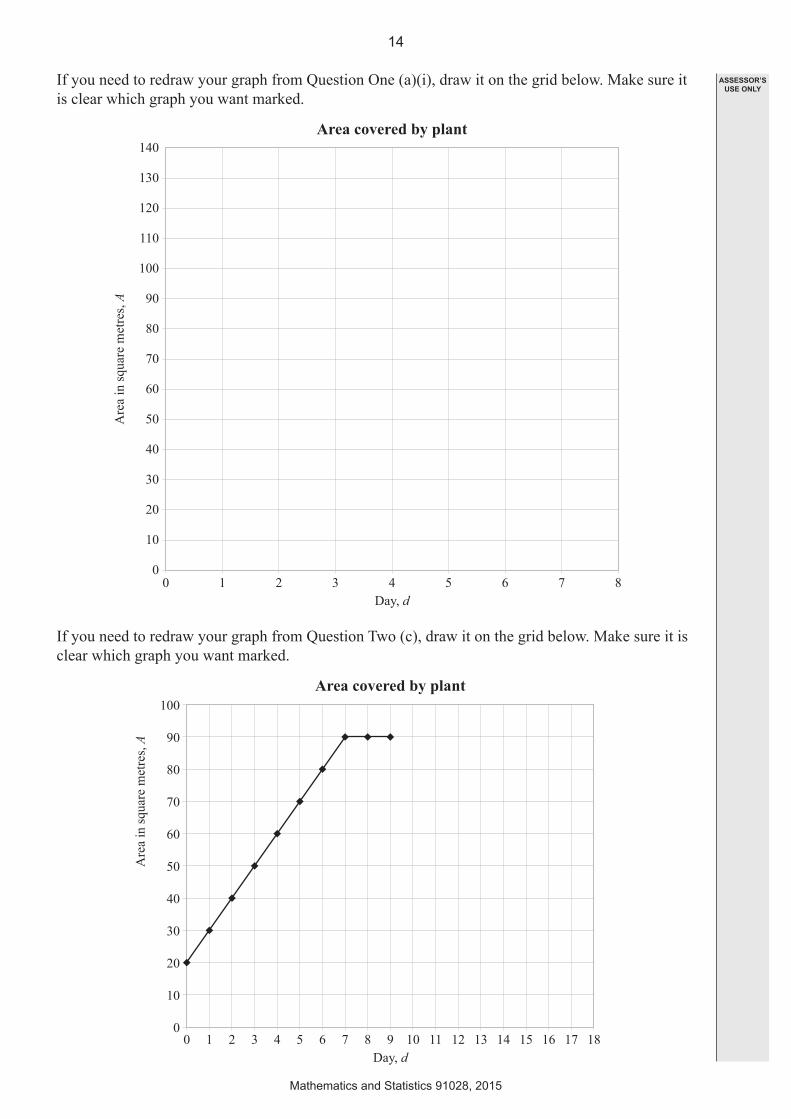
If you need to redraw your graph from Question One (a)(i), draw it on the grid below. Make sure it is clear which graph you want marked.
00
10
20
30
40
50
60
70
80
90
100
110
120
130
140
1 2 3 4 5 6 7 8Day, d
Are
a in
squa
re m
etre
s, A
Area covered by plant
If you need to redraw your graph from Question Two (c), draw it on the grid below. Make sure it is clear which graph you want marked.
00
10
20
30
40
50
60
70
80
90
100
1 2 3 4 5 6 7 8 9 10 11 12 13 14 15 16 17 18Day, d
Are
a in
squa
re m
etre
s, A
Area covered by plant
14
Mathematics and Statistics 91028, 2015
ASSESSOR’S USE ONLY

If you need to redraw your graph from Question Three (a)(i), draw it on the grid below. Make sure it is clear which graph you want marked.
2
–2
–4
––6
–8
–10
4
6
8
10
y
x–6 –5 –4 –3 –2 –1 1 2 3 4 5 6
If you need to redraw your graph from Question Three (b)(ii), draw it on the grid below. Make sure it is clear which graph you want marked.
150
50
100
–50
–100
–150
200
250
300
350y
x
20 40 60 80 100
15
Mathematics and Statistics 91028, 2015
ASSESSOR’S USE ONLY

91
02
816
Mathematics and Statistics 91028, 2015
ASSESSOR’S USE ONLY
QUESTION NUMBER
Extra paper if required.Write the question number(s) if applicable.