level 1 mathematics and statistics (91028) 2020
TRANSCRIPT

910280
1SUPERVISOR’S USE ONLY
9 1 0 2 8
© New Zealand Qualifications Authority, 2020. All rights reserved.No part of this publication may be reproduced by any means without the prior permission of the New Zealand Qualifications Authority.
Level 1 Mathematics and Statistics 202091028 Investigate relationships between tables, equations
and graphs
9.30 a.m. Friday 20 November 2020 Credits: Four
Achievement Achievement with Merit Achievement with ExcellenceInvestigate relationships between tables, equations and graphs.
Investigate relationships between tables, equations and graphs, using relational thinking.
Investigate relationships between tables, equations and graphs, using extended abstract thinking.
Check that the National Student Number (NSN) on your admission slip is the same as the number at the top of this page.
You should attempt ALL the questions in this booklet.
Show ALL working.
Grids are provided on some pages. This is working space for the drawing of a graph or a diagram, constructing a table, writing an equation, or writing your answer
If you need more room for any answer, use the extra space provided at the back of this booklet.
Check that this booklet has pages 2–20 in the correct order and that none of these pages is blank.
YOU MUST HAND THIS BOOKLET TO THE SUPERVISOR AT THE END OF THE EXAMINATION.
ASSESSOR’S USE ONLY
TOTAL
Tick this box if there is no writing
in this booklet

QUESTION ONE
(a) Give the equation of the graph shown below.
– 4
x
y
2
4
6
8
–2
– 6
–8
– 4 –2– 6 2 4 6
Equation:
(b) Three friends – Anaru, Bahman, and Cael – are about to start saving. Each friend has a different savings plan. They want to compare how much they will save over the next 9 years.
None of the friends will withdraw any money from their savings plans at any stage.
(i) Anaru puts an amount of money into a bank account at the start of his savings plan. His money will gain compound interest on this amount at the end of each year.
Anaru’s plan can be represented by S = 50 × 1.3t
where S is the amount of savings (in dollars $)
and t is the number of years since the savings plan started.
How much money did Anaru put into his saving plan at the start?
2
Mathematics and Statistics 91028, 2020
ASSESSOR’S USE ONLY

(ii) Bahman does not want to use a bank, and instead plans to keep his money in a well‑hidden shoebox. He puts $50 into the shoebox at the start of his savings plan. Bahman will not receive any interest, but he will put an extra $40 into the shoebox at the end of each year.
Write the equation that represents Bahman’s savings plan.
(iii) The details of Cael’s savings plan are shown in the table below.
Cael already has $100 in his bank account when the friends start their comparisons.
End of year (t)
Total savings amount in $ (S)
1 110
2 121
3 133.10
4
5
6
7
8
9
Write the equation that represents Cael’s savings plan.
3
Mathematics and Statistics 91028, 2020
ASSESSOR’S USE ONLY
(iv) A fourth friend, Deli, also decides to start saving into a bank account. The graph on the next page shows Deli’s savings plan.
The equation for Deli’s savings plan is S = 10(t – 2)2 + 40.
Using tables, equations, AND graphs, compare the amounts saved by Anaru, Cael, and Deli (i.e. only the friends who are using a bank to save) at various stages during the 9 years.
(All graphs in this question can be considered to be continuous graphs.)
4
Mathematics and Statistics 91028, 2020
ASSESSOR’S USE ONLY

0 1 2 3 4 5 6 7 8 90
50
100
150
200
250
300
350
400
450
500
550
t(Years)
S(Total
savings)
Deli’s savings plan
5
Mathematics and Statistics 91028, 2020
ASSESSOR’S USE ONLY
QUESTION TWO
(a) Using the axes below, sketch the graph of y = x2 + 2x – 8.
– 4 –2– 6 2 4 6
– 4
x
y
2
4
6
8
–2
– 6
–8
–10
10
If you need to redraw this graph,
use the grid on page 16.
6
Mathematics and Statistics 91028, 2020
ASSESSOR’S USE ONLY

(b) (i) Tui is in her school volleyball team. She is practising hitting the ball over the net, as shown in the diagram below. The height of the top of the net is 2.4 metres above the horizontal ground.
The equation of the path of the ball can be given by H = – 0.2(x + 2)(x – 8)
where x is the horizontal distance from the net and H is the vertical distance above the ground.
0
H
x
Net2.4 m high
Tui hits the ball from here
H = – 0.2(x + 2)(x – 8)
Horizontal ground
Diagram is NOT to scale
How much higher than the top of the net will the ball be as it passes over it?
(ii) Tui is concerned that the opposition players will “block” her shots at the net, i.e. jump up and stop her shot from coming over the net (as shown in the picture).
How could altering the equation of the path of the ball, H = – 0.2(x + 2)(x – 8), have an effect on whether or not her shot is being blocked at the net?
Provide at least two suggestions that are based on graphical reasons.
Photo: https://www.nj.com/highschoolsports/2019/08/girls‑volleyball‑returning‑stat‑leaders‑for‑2019.html
7
Mathematics and Statistics 91028, 2020
ASSESSOR’S USE ONLY

(c) (i) Tane is practising his volleyball skills by throwing the ball over the net.
Tane is at a horizontal distance of 3.2 metres from the net, and he hits the ball from a vertical height of 2.3 metres.
The ball travels in a perfect parabola shape, over the net, reaching a maximum height of 4.8 metres when it is at a horizontal distance of 1.8 metres on the other side of the net.
0
H
x
Net2.4 m high
Tane hits the ball from here(–3.2, 2.3)
Horizontal ground
Ball lands here
Diagram is NOT to scale
Maximum height(1.8, 4.8)
Find the equation of the path travelled by the volleyball as it leaves Tane’s hand and heads over the net, as shown in the diagram above, where x is the horizontal distance from the net and H is the vertical distance above the ground.
The x‑axis will be at ground level, and the H‑axis will be in line with the net.
Justify your answer with full and clear working.
Silhouettes: https://www.istockphoto.com/nz/vector/volleyball‑men‑silhouettes‑gm165691738‑11469557
8
Mathematics and Statistics 91028, 2020
ASSESSOR’S USE ONLY

9
Mathematics and Statistics 91028, 2020
This page has been deliberately left blank.The examination continues on the following page.

(ii) Ruru joins Tane, standing on the opposite side of the net. Tane sends the ball over the net towards Ruru. The equation of the path travelled by this volleyball is H = – 0.25(x – 2.1)2 + 3.9.
Ruru dives to reach the ball before it hits the ground, but misses the ball.
Using equations OR graphs, find how far away from the net the ball will first hit the ground.
Justify your answer with full and clear working.
You may choose to use the graph paper provided opposite.
Photo: https://www.staradvertiser.com/2019/03/07/photo‑gallery/uh‑mens‑volleyball‑hawaii‑vs‑king/
10
Mathematics and Statistics 91028, 2020
ASSESSOR’S USE ONLY

H
x
11
Mathematics and Statistics 91028, 2020
ASSESSOR’S USE ONLY

QUESTION THREE
(a) Using the axes below, sketch the graph of y = 3(x – 1).
1 2 3 4 5–1–2
5
10
15
20
25
30
–5
x
y
If you need to redraw this graph,
use the grid on page 17.
12
Mathematics and Statistics 91028, 2020
ASSESSOR’S USE ONLY
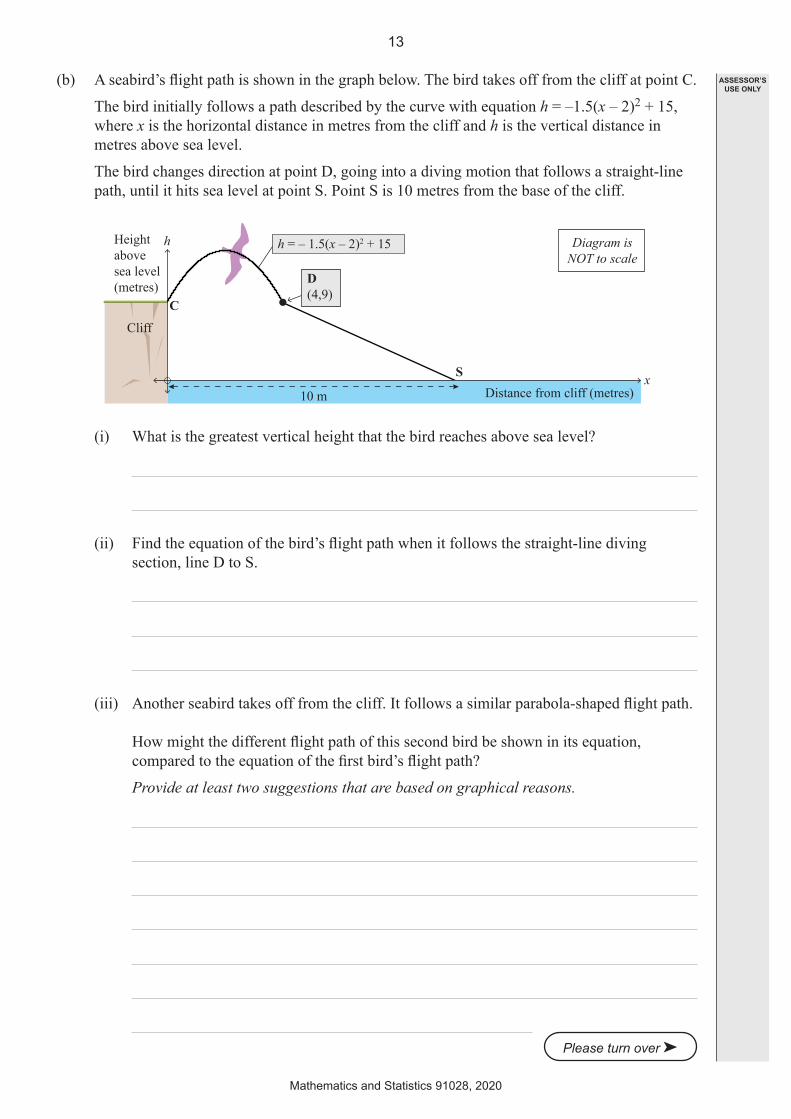
(b) A seabird’s flight path is shown in the graph below. The bird takes off from the cliff at point C.
The bird initially follows a path described by the curve with equation h = –1.5(x – 2)2 + 15, where x is the horizontal distance in metres from the cliff and h is the vertical distance in metres above sea level.
The bird changes direction at point D, going into a diving motion that follows a straight‑line path, until it hits sea level at point S. Point S is 10 metres from the base of the cliff.
h
S
Cliff
C
10 m
Height above sea level (metres)
Distance from cliff (metres)
D(4,9)
h = – 1.5(x – 2)2 + 15
x
Diagram is NOT to scale
(i) What is the greatest vertical height that the bird reaches above sea level?
(ii) Find the equation of the bird’s flight path when it follows the straight-line diving section, line D to S.
(iii) Another seabird takes off from the cliff. It follows a similar parabola-shaped flight path.
How might the different flight path of this second bird be shown in its equation, compared to the equation of the first bird’s flight path?
Provide at least two suggestions that are based on graphical reasons.
Please turn over ➤
13
Mathematics and Statistics 91028, 2020
ASSESSOR’S USE ONLY

(c) A farmer wants to set up three rectangular fields, of equal area, side by side. He has a total of 120 metres of fencing for this project, and he wants to find the set-up that maximises the total area of the fields.
The required set‑up is shown below.
Diagram is NOT to scale
Use tables, equations, AND graphs to investigate the relationship between the total area of the fields and the lengths of the various fences he could use.
Image: macrovector, www.freepik.com
14
Mathematics and Statistics 91028, 2020
ASSESSOR’S USE ONLY

y
x0
15
Mathematics and Statistics 91028, 2020
ASSESSOR’S USE ONLY
SPARE GRIDS
If you need to redo Question Two (a), use the grid below. Make sure you make it clear which answer you want marked.
– 4 –2– 6 2 4 6
– 4
x
y
2
4
6
8
–2
– 6
–8
–10
10
16
Mathematics and Statistics 91028, 2020
ASSESSOR’S USE ONLY

If you need to redo Question Three (a), use the grid below. Make sure you make it clear which answer you want marked.
1 2 3 4 5–1–2
5
10
15
20
25
30
–5
x
y
17
Mathematics and Statistics 91028, 2020
ASSESSOR’S USE ONLY

18
Mathematics and Statistics 91028, 2020
ASSESSOR’S USE ONLY
QUESTION NUMBER
Extra space if required.Write the question number(s) if applicable.

19
Mathematics and Statistics 91028, 2020
ASSESSOR’S USE ONLY
QUESTION NUMBER
Extra space if required.Write the question number(s) if applicable.

91
02
820
Mathematics and Statistics 91028, 2020
ASSESSOR’S USE ONLY
QUESTION NUMBER
Extra space if required.Write the question number(s) if applicable.