level 1 mathematics and statistics (91028) 2014 · level 1 mathematics and statistics, 2014 91028...
TRANSCRIPT
910280
1SUPERVISOR’S USE ONLY
9 1 0 2 8
© New Zealand Qualifications Authority, 2014. All rights reserved.No part of this publication may be reproduced by any means without the prior permission of the New Zealand Qualifications Authority.
ASSESSOR’S USE ONLY
TOTAL
Level 1 Mathematics and Statistics, 201491028 Investigate relationships between tables,
equations and graphs
9.30 am Tuesday 18 November 2014 Credits: Four
Achievement Achievement with Merit Achievement with ExcellenceInvestigate relationships between tables, equations and graphs.
Investigate relationships between tables, equations and graphs, using relational thinking.
Investigate relationships between tables, equations and graphs, using extended abstract thinking.
Check that the National Student Number (NSN) on your admission slip is the same as the number at the top of this page.
You should attempt ALL the questions in this booklet.
Show ALL working.
If you need more space for any answer, use the page(s) provided at the back of this booklet and clearly number the question.
Check that this booklet has pages 2 – 10 in the correct order and that none of these pages is blank.
YOU MUST HAND THIS BOOKLET TO THE SUPERVISOR AT THE END OF THE EXAMINATION.
QUESTION ONE
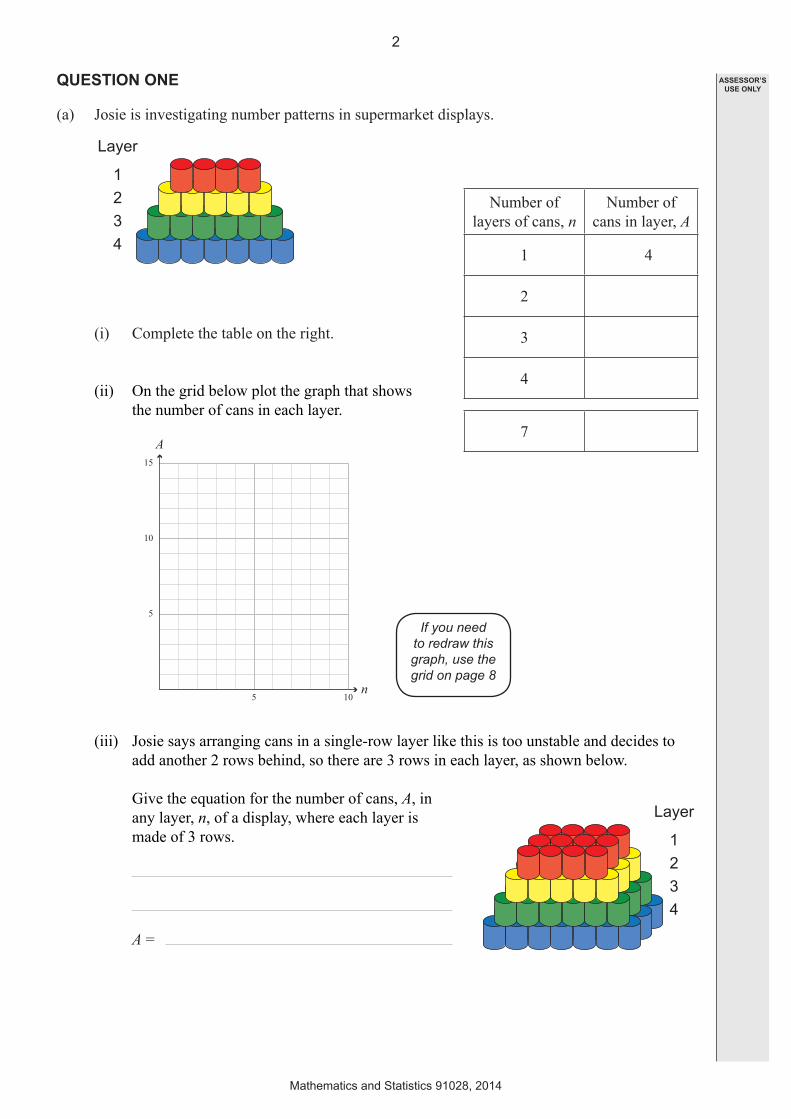
(a) Josie is investigating number patterns in supermarket displays.
Layer
1234
(i) Complete the table on the right.
(ii) On the grid below plot the graph that shows the number of cans in each layer.
5 10
5
10
15
n
A
(iii) Josie says arranging cans in a single-row layer like this is too unstable and decides to add another 2 rows behind, so there are 3 rows in each layer, as shown below.
Give the equation for the number of cans, A, in any layer, n, of a display, where each layer is made of 3 rows.
A =
Number of layers of cans, n
Number of cans in layer, A
1 4
2
3
4
7
Layer
1234
If you need to redraw this graph, use the grid on page 8
2
Mathematics and Statistics 91028, 2014
ASSESSOR’S USE ONLY
(iv) A display is 15 layers high. It also has 4 cans in each row of the top layer.
How many cans would she need for the bottom layer of this display if each layer is made of 3 rows?
You must show use of your equation.
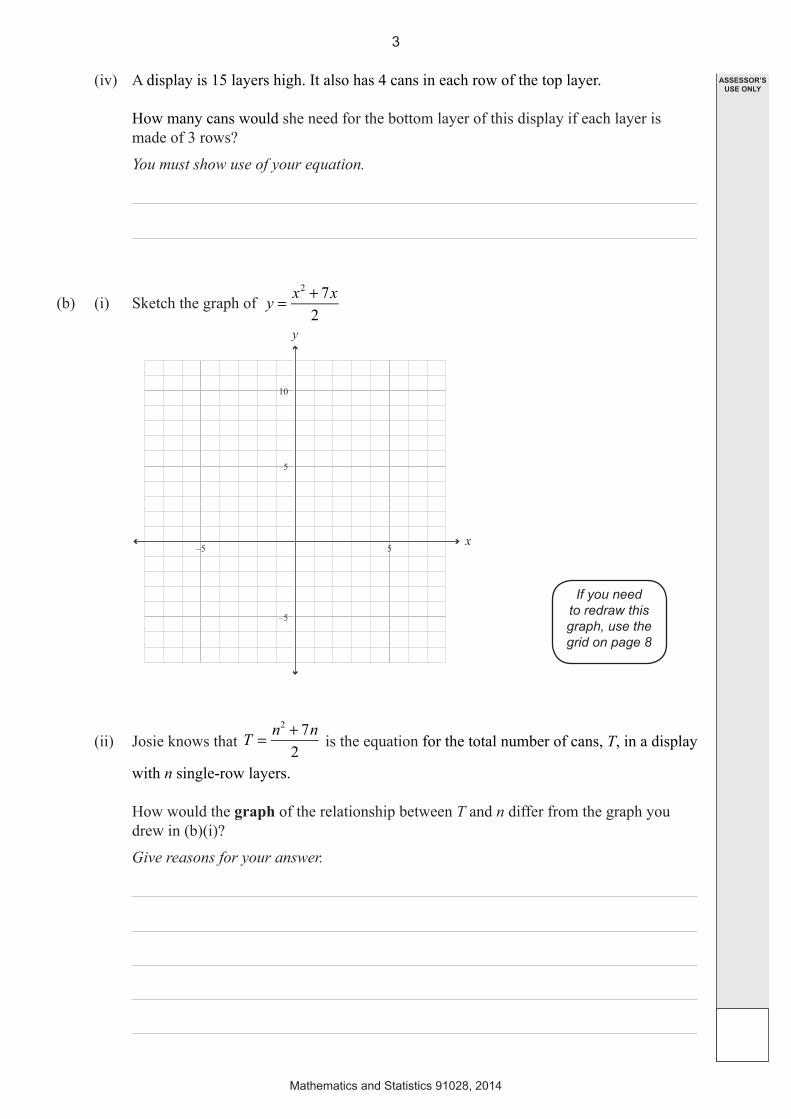
(b) (i) Sketch the graph of = +y x x72
2
5–5
–5
10
5
x
y
(ii) Josie knows that Tn n72
2
= + is the equation for the total number of cans, T, in a display
with n single-row layers. How would the graph of the relationship between T and n differ from the graph you
drew in (b)(i)?
Give reasons for your answer.
If you need to redraw this graph, use the grid on page 8
3
Mathematics and Statistics 91028, 2014
ASSESSOR’S USE ONLY
QUESTION TWO
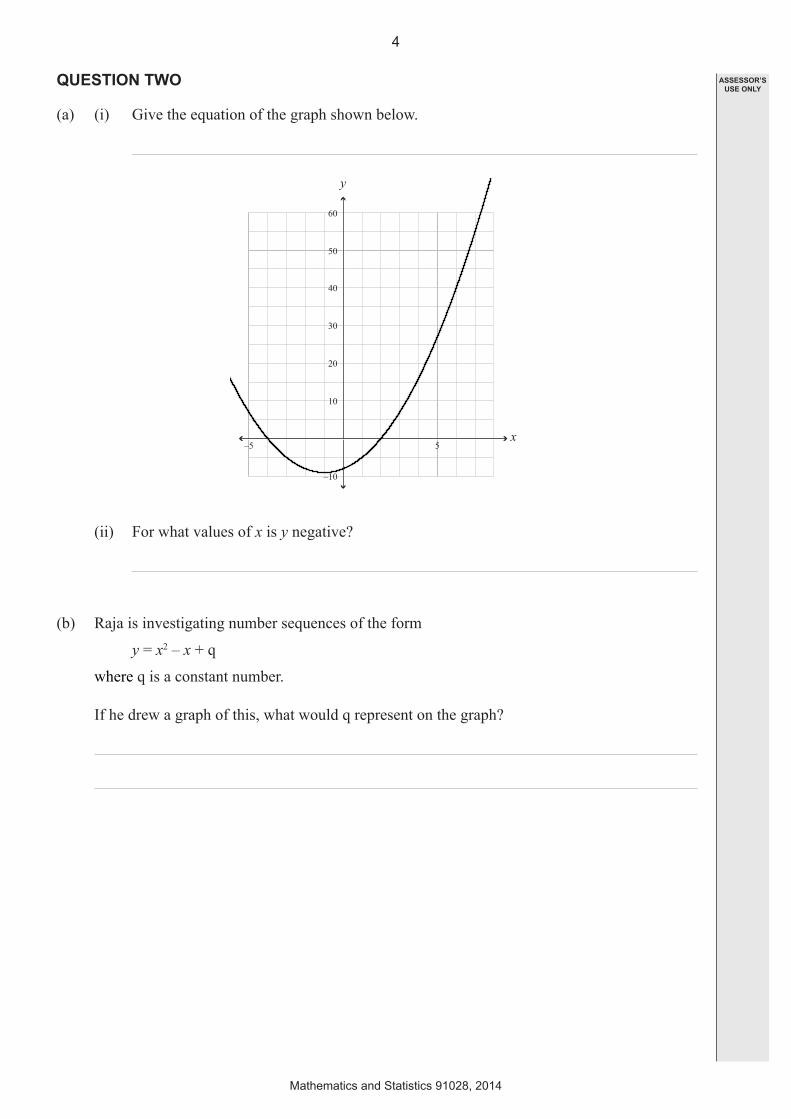
(a) (i) Give the equation of the graph shown below.
5–5
–10
40
50
60
20
30
10
x
y
(ii) For what values of x is y negative?
(b) Raja is investigating number sequences of the form
y = x2 – x + q
where q is a constant number.
If he drew a graph of this, what would q represent on the graph?
4
Mathematics and Statistics 91028, 2014
ASSESSOR’S USE ONLY
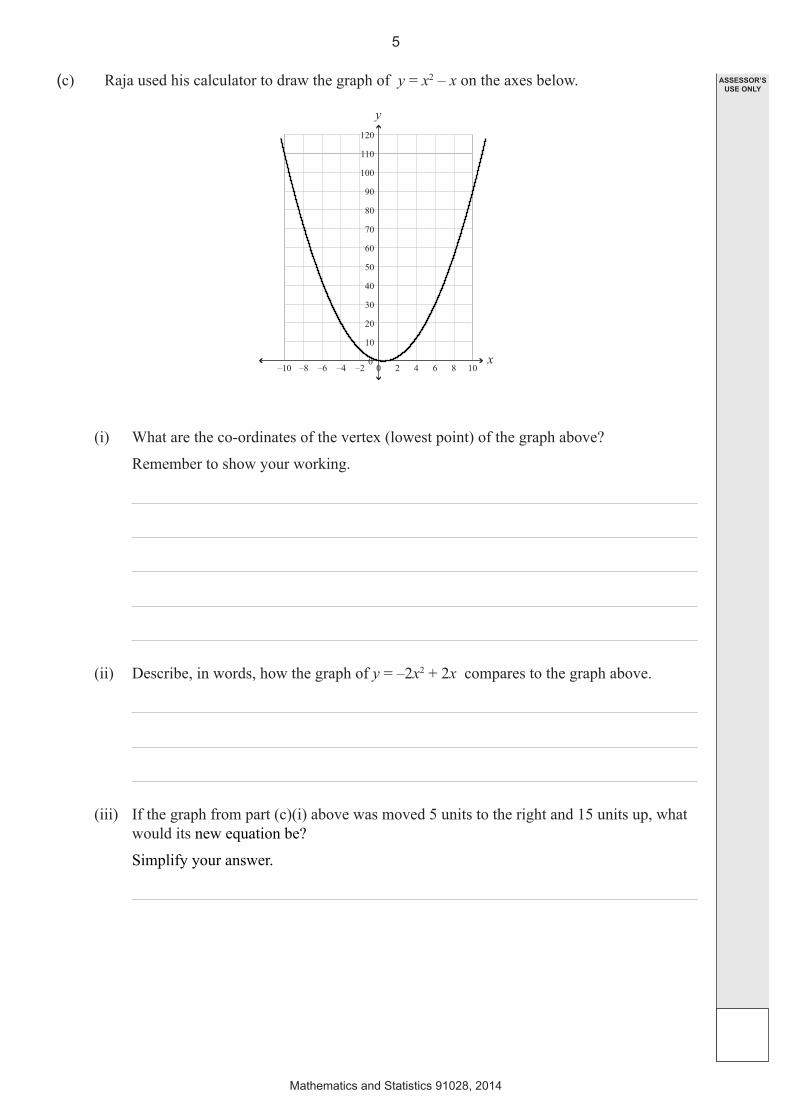
(c) Raja used his calculator to draw the graph of y = x2 – x on the axes below.
4 6 8 10x
y
40
50
60
70
80
90
100
110
120
20
30
10
–10 –8 –6 –4 –2 0 20
(i) What are the co-ordinates of the vertex (lowest point) of the graph above?
Remember to show your working.
(ii) Describe, in words, how the graph of y = –2x2 + 2x compares to the graph above.
(iii) If the graph from part (c)(i) above was moved 5 units to the right and 15 units up, what would its new equation be?
Simplify your answer.
5
Mathematics and Statistics 91028, 2014
ASSESSOR’S USE ONLY
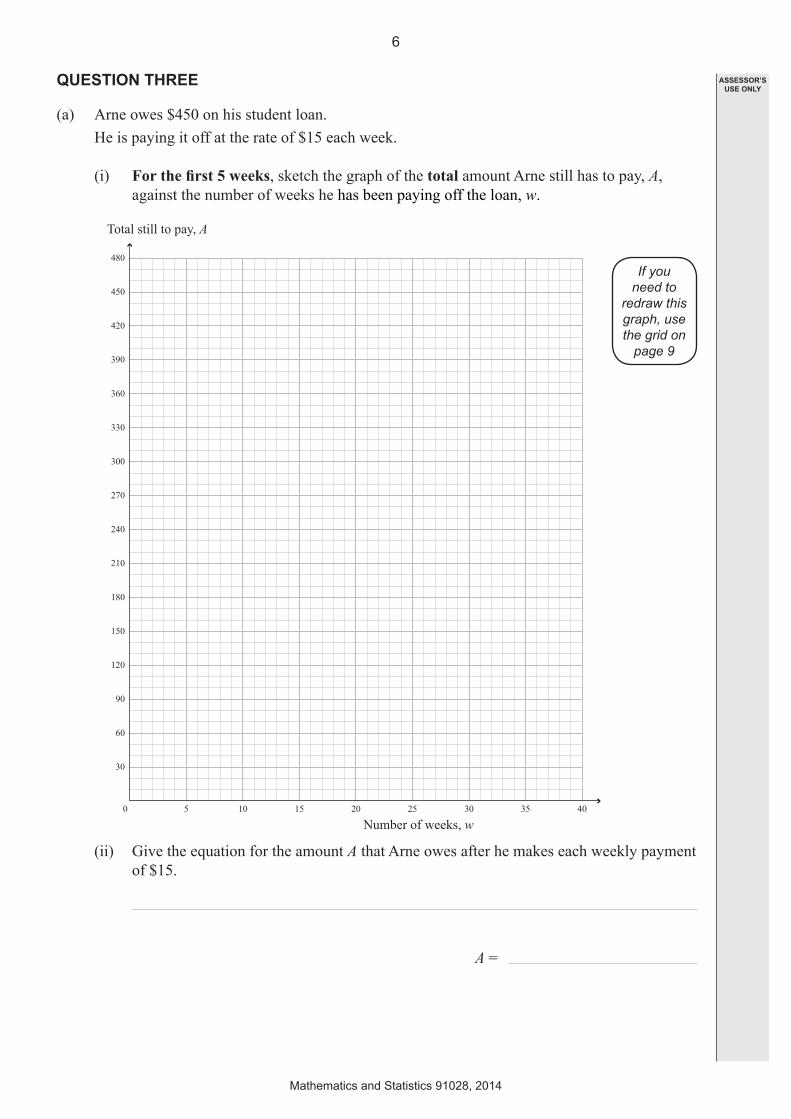
QUESTION THREE
(a) Arne owes $450 on his student loan. He is paying it off at the rate of $15 each week.
(i) For the first 5 weeks, sketch the graph of the total amount Arne still has to pay, A, against the number of weeks he has been paying off the loan, w.
5 10 15 20 25 30 35 40
Number of weeks, w
Total still to pay, A
30
60
90
120
150
180
210
240
270
300
330
360
390
420
450
480
0
(ii) Give the equation for the amount A that Arne owes after he makes each weekly payment of $15.
A =
If you need to
redraw this graph, use the grid on
page 9
6
Mathematics and Statistics 91028, 2014
ASSESSOR’S USE ONLY
(iii) Arne decides that he wants to go overseas for a holiday. Hewantstofinishrepayingallofhisloanattheendof25weeks. He looks at what he has left to pay and decides he can repay the loan exactly at the end
of 25 weeks if he increases the amount he repays to $20 a week.
Add this section to your graph.
(iv) After how many weeks did he start paying $20 per week?
(v) Give the equation for the graph representing the increased payments.
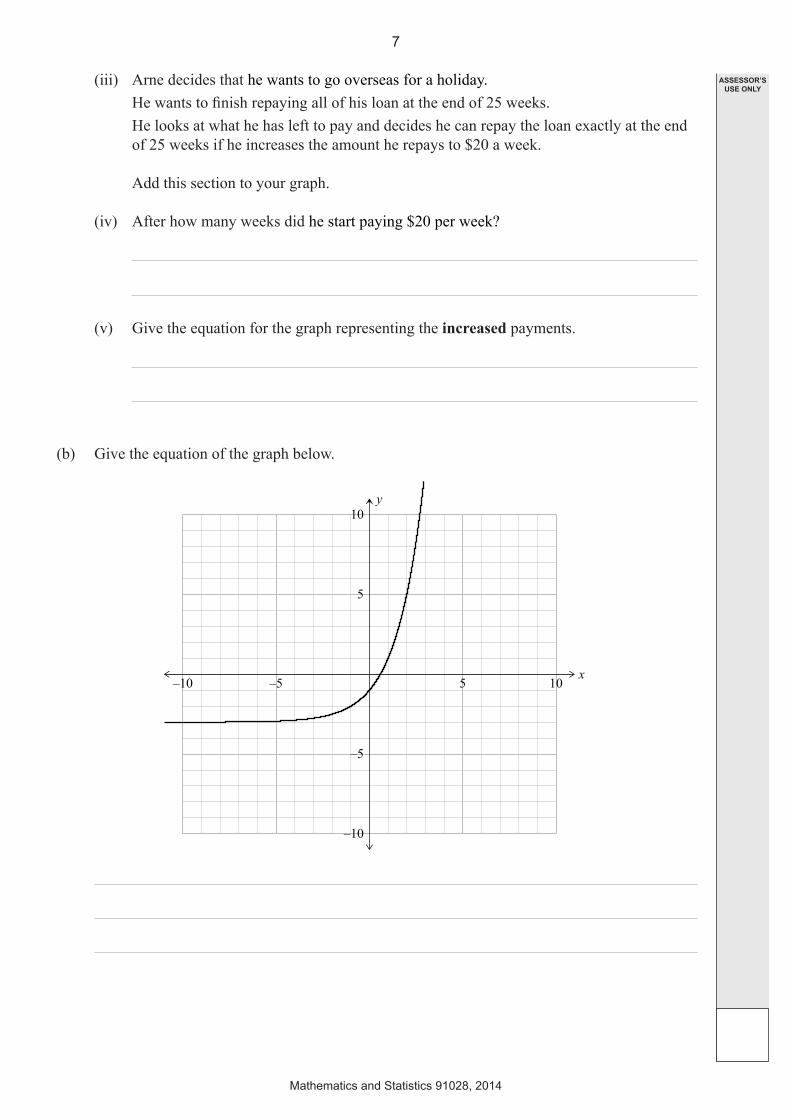
(b) Give the equation of the graph below.
y
x
5
5–5 10–10
–5
–10
10
7
Mathematics and Statistics 91028, 2014
ASSESSOR’S USE ONLY
If you need to redraw your graph from Question One (a)(ii), draw it on the grid below. Make sure it is clear which graph you want marked.
5 10
5
10
15
n
A
If you need to redraw your graph from Question One (b)(i), draw it on the grid below. Make sure it is clear which graph you want marked.
5–5
–5
10
5
x
y
8
Mathematics and Statistics 91028, 2014
ASSESSOR’S USE ONLY
If you need to redraw your graph from Question Three (a)(i), draw it on the grid below. Make sure it is clear which graph you want marked.
5 10 15 20 25 30 35 40
Number of weeks, w
Total still to pay, A
30
60
90
120
150
180
210
240
270
300
330
360
390
420
450
480
0
9
Mathematics and Statistics 91028, 2014
ASSESSOR’S USE ONLY
10
Mathematics and Statistics 91028, 2014
ASSESSOR’S USE ONLY
QUESTION NUMBER
Extra paper if required.Write the question number(s) if applicable.


91
02
8