laboratoire hubert curien, umr cnrs 5516, 2 università...
TRANSCRIPT

M. Vivona1,3,4, S. Girard1,2, C. Marcandella2, E. Pinsard3, A. Laurent3, T. Robin3, B. Cadier3, M. Cannas4, A. Boukenter1, Y. Ouerdane1
1
Laboratoire Hubert Curien, UMR CNRS 5516,Saint-Etienne (France)
2
CEA, DAM, DIF, Arpajon (France)
3 iXFiber SAS, Lannion (France)4 Università
di Fisica, Palerme (Italie)

1
1.
Context of our investigation
2.
Experimental details :
3.
Results related to on‐line characterization
4.
Results related to spectroscopic characterization
5.
Conclusions
Active and passive on‐line measurements under ‐irradiation (CEA Arpajon ‐
Paris)

2
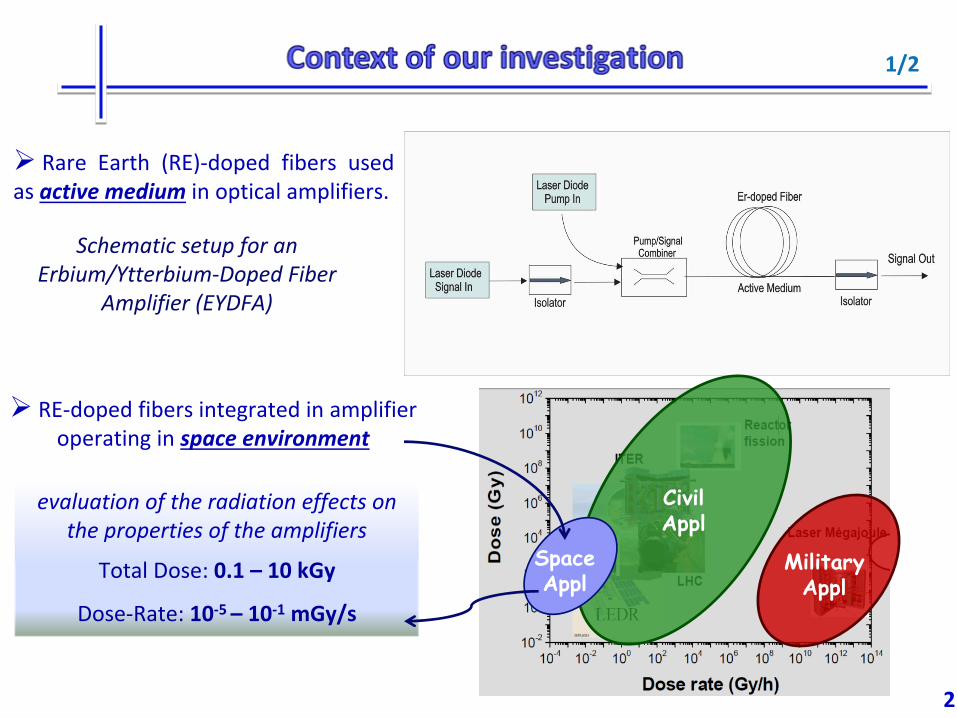
Rare
Earth
(RE)‐doped
fibers
used as active medium
in optical amplifiers.
Schematic setup for an Erbium/Ytterbium‐Doped Fiber
Amplifier (EYDFA)
1/2
2
Rare
Earth
(RE)‐doped
fibers
used as active medium
in optical amplifiers.
Schematic setup for an Erbium/Ytterbium‐Doped Fiber
Amplifier (EYDFA)
evaluation of the radiation effects on the properties of the amplifiers
Total Dose: 0.1 – 10 kGy
Dose‐Rate: 10‐5 – 10‐1
mGy/s
Civil Appl
Military Appl
Space Appl
RE‐doped fibers
integrated in amplifier operating in space environment
1/2

4
Most of previous works dedicated to understand attenuation mechanisms were performed in passive configuration
(without pumping of RE ions during the test).
√
G.M. Williams et al., IEEE TNS 45 (1998) 1531 √
B. Fox, IEEE TNS, 57 (2010) 1618
Fewer experiments characterized
RE‐optical fibers in active configuration
they show a high degradation in radiative environment.
M. Alam, et al. OSA/OFC2007, paper OMF4J. Ma, et al., Optic Express, 17(18),15571, 2009
No amplification No Amplification (amplifier gain = 0) at 120,
200 or 500 Gy.
Aim: understanding of the physical mechanisms responsible for the signal degradation and evaluation of the hardening treatment efficiency.
0 100 200 300 400 500-10
0
10
20
M. Alam (0.1 Gy/s)
M. Alam (0.2 Gy/s)
J. Ma (0.4 Gy/s)
Am
plifi
er G
ain
(dB
m)
Dose (Gy)
3
2/2
4
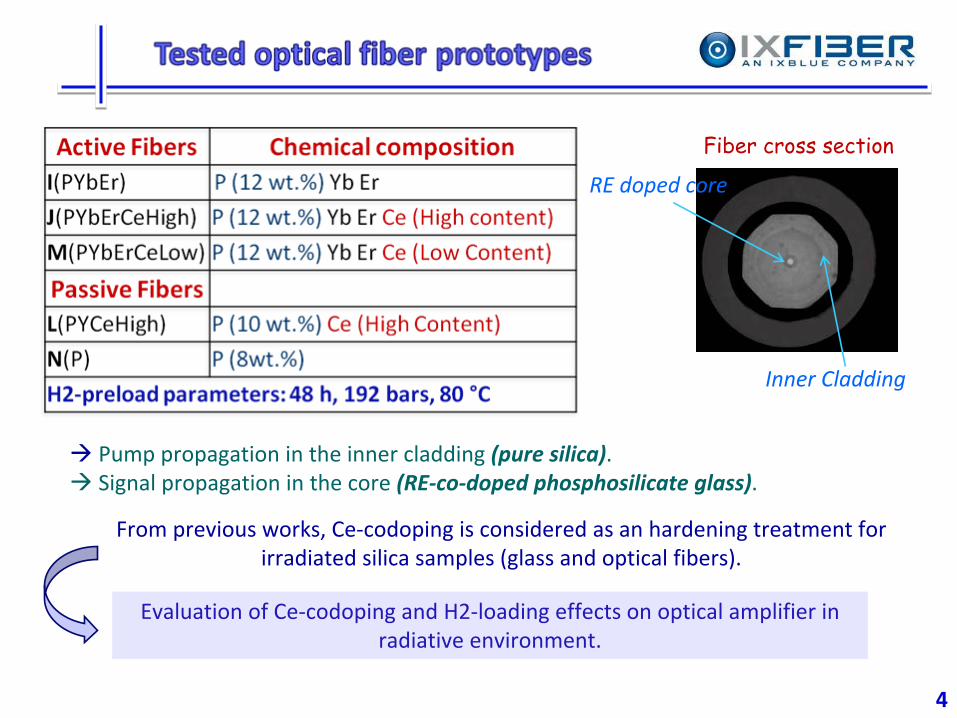
Pump
propagation in the inner cladding (pure silica). Signal propagation in the core (RE‐co‐doped phosphosilicate glass).
From previous works, Ce‐codoping is considered as an hardening treatment for irradiated silica samples (glass and optical fibers).
Evaluation of Ce‐codoping and H2‐loading effects on optical amplifier in radiative environment.
Inner Cladding
RE doped core
Fiber cross section

6
Pumping of the Yb3+‐ions.
Amplifier configuration
(counter-pumped scheme) under –ray radiation.
Radiation chamber
Pompe
PumpLaser Diode (MM) at
915 nm
Signal Laser Diodeat
1545 nm
‐ray radiation at 1.2MeV.
Dose‐rate= 3 mGy/s.
Total dose up to 800 Gy.
Room temperature.
PWM
5
7
0 1 2 3 4 5 6 7
0.0
0.1
0.2
0.3
0.4
0.5
0.6
0.7
0.8
Lase
r Out
put P
ower
at 1
.5 µ
m (W
)
Pump Power (W)
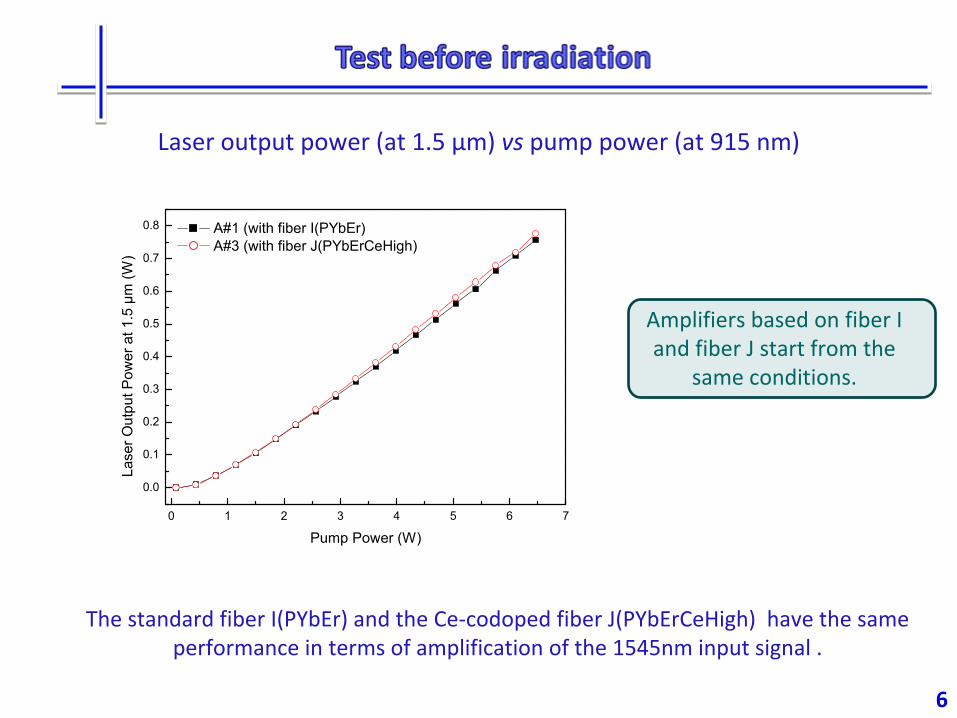
A#1 (with fiber I(PYbEr) A#3 (with fiber J(PYbErCeHigh)
The standard fiber I(PYbEr) and the Ce‐codoped fiber J(PYbErCeHigh) have the same performance in terms of amplification of the 1545nm input signal
.
Laser output power (at 1.5 µm) vs
pump power (at 915 nm)
6
Amplifiers based on fiber I and fiber J start from the
same conditions.
8
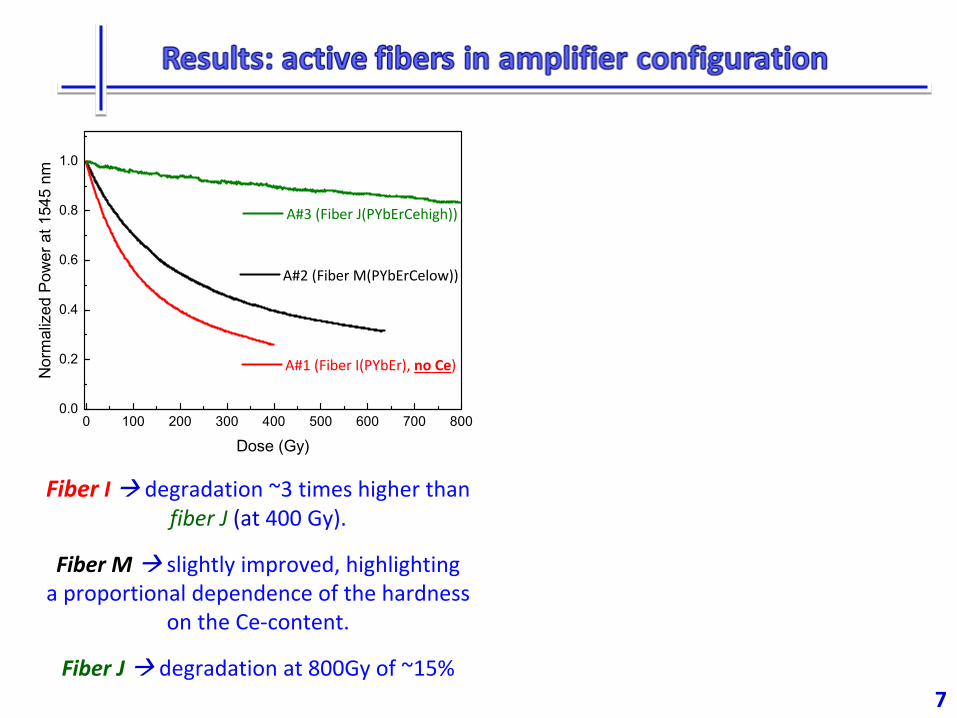
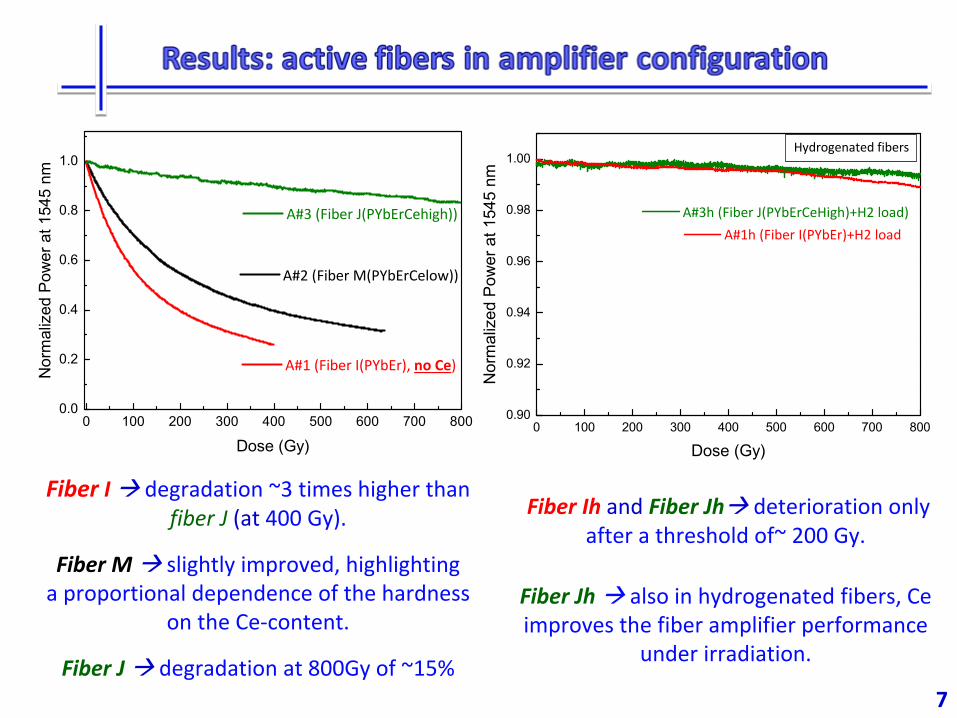
Fiber
I degradation
~3 times higher than fiber J (at 400 Gy).
Fiber M slightly improved, highlighting a proportional dependence of the hardness
on the Ce‐content.
Fiber J
degradation at 800Gy of ~15%
0 100 200 300 400 500 600 700 8000.0
0.2
0.4
0.6
0.8
1.0
A#1 (Fiber I(PYbEr), no Ce)
A#2 (Fiber M(PYbErCelow))
A#3 (Fiber J(PYbErCehigh))
Nor
mal
ized
Pow
er a
t 154
5 nm
Dose (Gy)
7
Fiber
I
degradation
~3 times higher than fiber J (at 400 Gy).
Fiber M slightly improved, highlighting a proportional dependence of the hardness
on the Ce‐content.
Fiber J
degradation at 800Gy of ~15% 8
0 100 200 300 400 500 600 700 8000.0
0.2
0.4
0.6
0.8
1.0
A#1 (Fiber I(PYbEr), no Ce)
A#2 (Fiber M(PYbErCelow))
A#3 (Fiber J(PYbErCehigh))
Nor
mal
ized
Pow
er a
t 154
5 nm
Dose (Gy)
Fiber Ih and
Fiber Jh deterioration only after a threshold of~ 200 Gy.
Fiber Jh
also
in hydrogenated fibers, Ce improves the fiber amplifier performance under irradiation.
0 100 200 300 400 500 600 700 8000.90
0.92
0.94
0.96
0.98
1.00Hydrogenated fibers
A#1h (Fiber I(PYbEr)+H2 load
Nor
mal
ized
Pow
er a
t 154
5 nm
Dose (Gy)
A#3h (Fiber J(PYbErCeHigh)+H2 load)
7

9
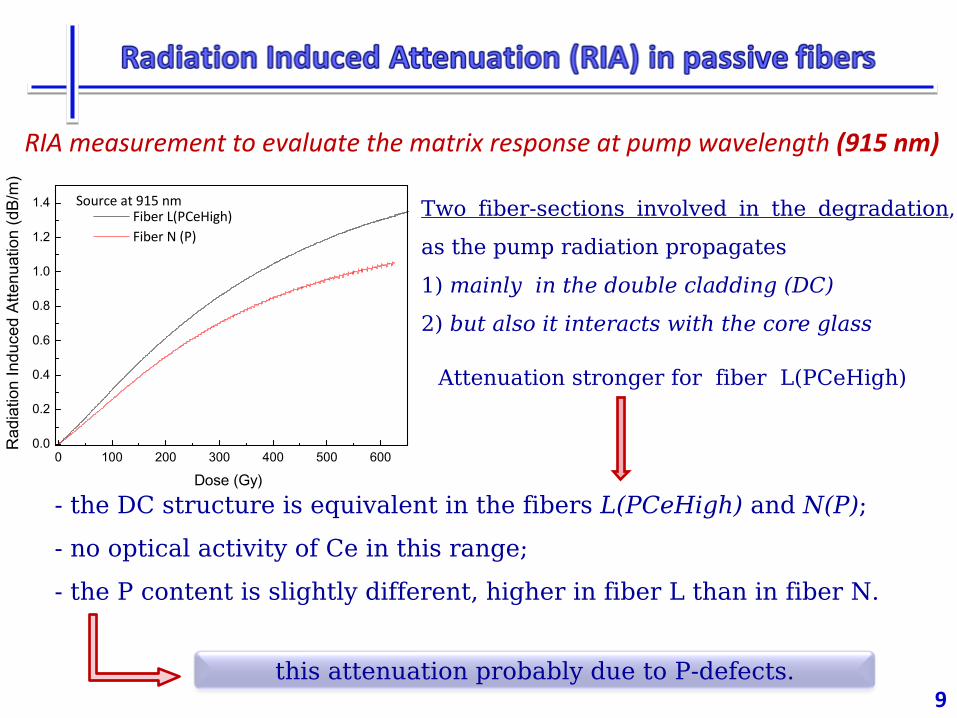
Radiation Induced Attenuation (RIA) measurements under –ray radiation on fiber L(PCeHigh) and N(P)
and their hydrogenated versions.
Signal Diode (DFB)at
1545 nm
Same source of amplifier configuration
RIA at 1545 nmII.
RIA 1000
÷1650nmIII.
I. RIA at 915 nm
Halogen
Light Source
CCD
PWM
Pump
Diode (MM) at
915 nm
PWM
8

10
0 100 200 300 400 500 6000.0
0.2
0.4
0.6
0.8
1.0
1.2
1.4 Source at 915 nm
Rad
iatio
n In
duce
d A
ttenu
atio
n (d
B/m
)
Dose (Gy)
Fiber L(PCeHigh) Fiber N (P)
RIA measurement to evaluate the matrix response at pump wavelength (915 nm)
Two fiber-sections involved in the degradation, as the pump radiation propagates
1) mainly in the double cladding (DC) 2) but also it interacts with the core glass
Attenuation stronger for fiber L(PCeHigh)
9
0 100 200 300 400 500 6000.0
0.2
0.4
0.6
0.8
1.0
1.2
1.4 Source at 915 nm
Rad
iatio
n In
duce
d A
ttenu
atio
n (d
B/m
)
Dose (Gy)
Fiber L(PCeHigh) Fiber N (P)
RIA measurement to evaluate the matrix response at pump wavelength (915 nm)
Two fiber-sections involved in the degradation, as the pump radiation propagates
1) mainly in the double cladding (DC) 2) but also it interacts with the core glass
Attenuation stronger for fiber L(PCeHigh)
- the DC structure is equivalent in the fibers L(PCeHigh)
and N(P); - no optical activity of Ce in this range;-
the P content is slightly different, higher in fiber L than in fiber N.
9this attenuation probably
due to P-defects.
111000 1100 1200 1300 1400 1500 16000.0
0.2
0.4
0.6
0.8
Rad
iatio
n In
duce
d A
tteni
atio
n (d
B/m
)
W avelength (nm)
Total Deposited Dose ~300 Gy Fiber N Fiber L
0 100 200 300 400 500 600 700 8000.0
0.2
0.4
0.6
0.8
1.0
1.2
1.4
1.6Source at 1545 nm
Rad
iatio
n In
duce
d At
tenu
atio
n (d
B/m
)
Dose (Gy)
Fiber N(P) Fiber L(PCeHigh)
RIA at signal wavelength (1545 nm) and in the range 1000 ÷ 1650nm
Only the fiber N(P)
is affected by an high attenuation in this range.
In the NIR domain, presence of the P- related defect P1
after irradiation
In fiber L(PCeHigh), Ce
interacts with P1
sites and/or its precursors, leading to the performance improvement of the
Ce-doped optical fibers.
N.B. : NO Recovery after irradiation
10
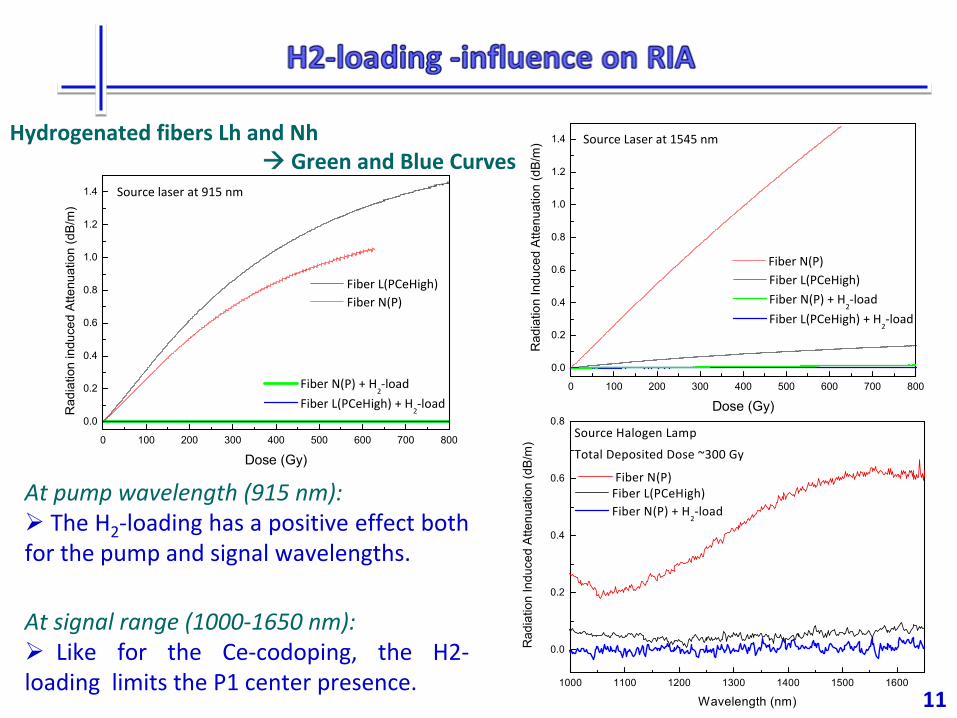
1000 1100 1200 1300 1400 1500 1600
0.0
0.2
0.4
0.6
0.8Source Halogen Lamp
Total Deposited Dose ~300 Gy
Fiber N(P)
Rad
iatio
n In
duce
d A
ttenu
atio
n (d
B/m
)
Wavelength (nm)
Fiber L(PCeHigh) Fiber N(P) + H
2‐load
0 100 200 300 400 500 600 700 800
0.0
0.2
0.4
0.6
0.8
1.0
1.2
1.4
Fiber N(P) + H2‐load
Fiber L(PCeHigh) + H2‐load
Source laser at 915 nm
Rad
iatio
n in
duce
d At
tenu
atio
n (d
B/m
)
Dose (Gy)
Fiber L(PCeHigh) Fiber N(P)
0 100 200 300 400 500 600 700 800
0.0
0.2
0.4
0.6
0.8
1.0
1.2
1.4 Source Laser at 1545 nm
Fiber L(PCeHigh) Fiber N(P)
Rad
iatio
n In
duce
d A
ttenu
atio
n (d
B/m
)
Dose (Gy)
Fiber N(P) + H2‐load
Fiber L(PCeHigh) + H2‐load
At pump wavelength (915 nm): The H2
‐loading has a positive effect both for the pump and signal wavelengths.
At signal range (1000‐1650 nm):
Like
for
the
Ce‐codoping,
the
H2‐
loading limits the P1 center presence.11
Hydrogenated fibers Lh and Nh Green and Blue Curves

13
Study of the microscopic mechanisms at the origin of the behavior of the radiation response.
Confocal Raman Microscopy(source: laser He‐Cd at 442 nm, P~ µW)(detector system: 2400grooves/mm, CCD)
Time‐resolved photo‐luminescence(source: tunable laser Nd:YAG, pulse ~5ns, 10Hz)(detector system: 150grooves/mm, Intensified CCD)
12
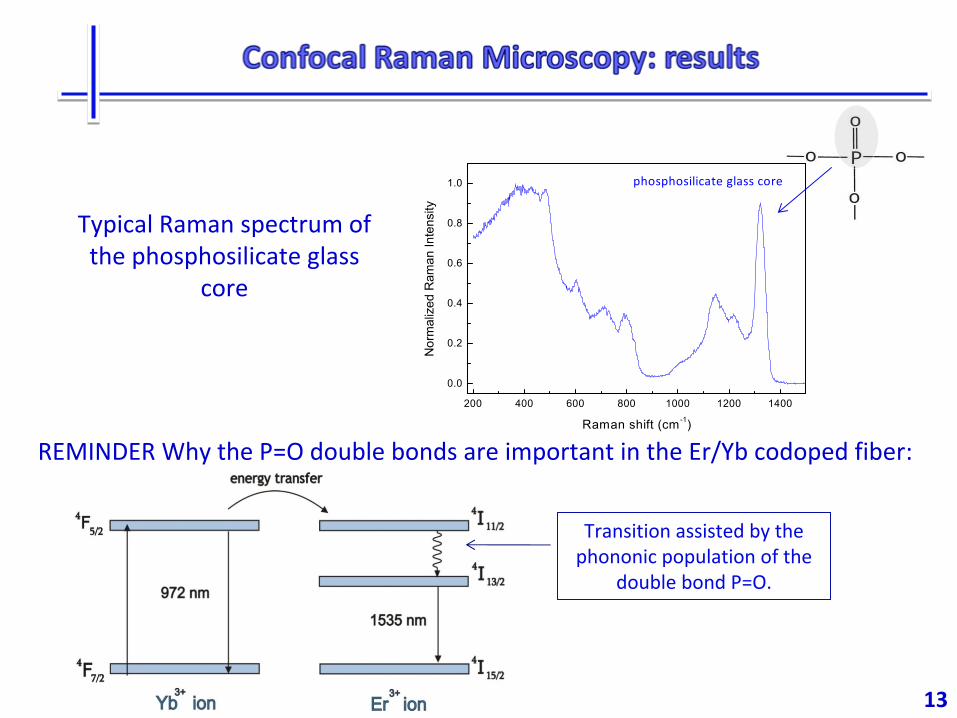
13
Transition assisted by the
phononic population of the
double bond P=O.
200 400 600 800 1000 1200 1400
0.0
0.2
0.4
0.6
0.8
1.0
Nor
mal
ized
Ram
an In
tens
ityRaman shift (cm-1)
phosphosilicate glass core
Typical
Raman spectrum of the phosphosilicate glass
core
REMINDER Why
the P=O double bonds are important
in the Er/Yb codoped fiber:
13

0 2000 4000 6000 8000 10000
0.7
0.8
0.9
1.0
1.1
Fiber I Fiber N
Nor
mal
ized
Ram
an In
tens
ity a
t ~13
20 c
m-1
Dose (Gy)
Fiber J Fiber L Fiber M
RRééponseponse
aux radiations X aux radiations X àà
10 keV 10 keV Fibers with
Ce
Fibers without
Ce200 400 600 800 1000 1200 1400
0.0
0.2
0.4
0.6
0.8
1.0
Nor
mal
ized
Ram
an In
tens
ity
Raman shift (cm-1)
phosphosilicate glass core
Reduction of P=O double bonds after X‐irradiation of ~15% for fiber
without Ce.
Ce-codoping: the interaction between the Ce and the P gives a hardening effect with the preservation of P=O
14
The same effect of preservation noticed in H2-loaded fibers (Ih and Jh)

0 5 10 15 20 25 30 35 40e-4
e-3
e-2
e-1
e0
Fiber J ‐irradiated (~11.5 ms)
Fiber I pristine (~10.3 ms) Fiber J pristine (~10.3 ms)
Fiber I ‐irradiated (~12.7 ms)
Nor
mal
ized
Lum
ines
cenc
e
Time (ms)
EXC
~ 975 nm
15
Study of the decay kineticsinformation about the ion interaction with its surroundings.
Lifetime of the PL band peaked at
~1545 nm, related to Er3+‐emission
(4I13/2
→4I15/2
)
Variation higher for fiber I than fiber J. Better radiation response of the Ce‐codoped fiber.
Fiber I (Ce‐free)Fiber J (Ce‐codoped)
A longer lifetime increases the probability of the ESA occurrence

0 5 10 15 20 25 30 35 40e-4
e-3
e-2
e-1
e0
Fiber J ‐irradiated (~11.5 ms)
Fiber I pristine (~10.3 ms) Fiber J pristine (~10.3 ms) Fiber Jh ‐irradiated (~10.6 ms)
EXC ~ 975 nm
Nor
mal
ized
Lum
ines
cenc
e
Time (ms)
Fiber I ‐irradiated (~12.7 ms) Fiber Ih ‐irradiated (~12.7 ms)
15
Fiber I (Ce‐free)Fiber J (Ce‐codoped)
The irradiated fiber Ih is affected by the same variation of the
lifetime value as the fiber I. No variations for the fiber Jh.
Lifetime of the PL band peaked at
~1545 nm, related to Er3+‐emission
(4I13/2
→4I15/2
)

Our work points out the positive effect of Ce‐codoping and H2
‐loading on active optical fiber properties and highlights some microscopic characteristics.
1.
Ce and H2 have a key role in the hardening of the active optical fibers (less degradation of transmitted IR signal).
2.
Presence of P1 centers
in the standard fiber (Ce free or no treated with hydrogen).
3.
Efficiency keeping of the energy transfer between Yb and Er in the Ce-codoped fiber under gamma irradiation thanks to preservation of the P=O double bonds.
4.
No variations of the lifetime values respect to the pristine fibers for the fiber Jh (Ce-codoped and H2-preloaded).
16

Thank you for your attention.
marilena.vivona@univ‐st‐etienne.fr