evaluation of novel technologies for the miniaturization...
TRANSCRIPT
ICSO 2014 Tenerife, Canary Islands, Spain
International Conference on Space Optics 7 - 10 October 2014
EVALUATION OF NOVEL TECHNOLOGIES FOR THE MINIATURIZATION OF
FLASH IMAGING LIDAR
V. Mitev1, A. Pollini
1, J. Haesler
1, D. Perenzoni
2, D. Stoppa
2, C. Kolleck
3, M. Chapuy
4, E. Kervendal
4,
João Pereira do Carmo5
1CSEM, Switzerland.
2FBK, Italy.
3LZH, Germany,
4Astrium EADS, France,
5ESA-ESTEC, The Netherlands
I. INTRODUCTION
Planetary exploration constitutes one of the main components in the European Space activities. Missions to Mars,
Moon and asteroids are foreseen where it is assumed that the human missions shall be preceded by robotic
exploitation flights. The 3D vision is recognised as a key enabling technology in the relative proximity navigation of
the space crafts, where imaging LiDAR is one of the best candidates for such 3D vison sensor.
Imaging LiDARs exist on the market since several years, being used in a number of geodesy, topography and
metrology tasks. Anyway, the use of mechanical scanners needed to achieve 3D imaging results in bulky, fragile,
power consuming and slow operating devices [1], which are in contradiction with requirements for planetary
missions. As a solution for space exploration, the imaging LiDAR shall be based on miniature and low-power-
consumption subsystems.
Flash imaging LiDAR systems are newcomers in the large family of optical sensors considered for the support of
Guidance Navigation and Control (GN&C) operations for space exploration spacecrafts or terrestrial mobile
platforms (e.g. unmanned aerial vehicle) [2-4]. The increased interest for flash imaging LiDAR results from the
recent progresses made in several key technologies considered for the implementation of different LiDAR
subsystems. These technologies are related to either illumination heads (e.g. laser technologies), photodetector
arrays (e.g. time-of-flight large format matrix detectors) or miniaturized opto-electromechanical systems (MOEMS).
Often, these technologies have been designed and developed for applications rather different from the considered
space applications, resulting in substantial differences in terms of functionality and performances. However, several
of these technologies have now reached a level of maturity that makes them relevant for the design and the
realization of miniaturized flash imaging LiDARs for space applications.
The background described above determines the motivation for the project MILS (Miniaturized Imaging LiDAR
System, Phase 1) and also the objectives of this study: to demonstrate and validate novel technology components
supporting the realisation of MILS in accordance to the requirements of future ESA planetary missions.
II. OBJECTIVES AND PERSPECTIVE NOVEL TECHNOLOGIES
The MILS applications, considered for future missions, are as follows:
Landing on Mars, Moon and Asteroid: to provide information for appearance of surface hazards during a
decent and Landing manoeuvres sequence.
Rendezvous and Docking (RVD): to provide information for the relative position of an orbital spacecraft
(SC) and a smaller SC, where the SC is a cooperative target equipped with retroreflectors.
Rover Navigation (RN): to provide image and distance of the surface at the proximity of the Rover which
are necessary for its autonomous navigation (on Mars or Moon).
The technology review identified three novel technologies potentially capable to answer the MILS requirements:
Single-Photon Avalanche Diode (SPAD) array detector [5, 6], Active Pixel Sensor/In-Pixel Photon Demodulation
(APS/IPPD) array detector [7, 8] and Micro-Opto-Electro-Mechanical Systems (MOEMS) pointer [9]. Example of
modules for detection and pointing containing these components are presented in Figs. 1-3.
The ranging method using the SPAD array is direct Time-of-Flight (TOF) by means of Time-Correlated Single
Photon Counting (TCSPC) [10]. The convenient illumination for this ranging method is a laser generating pulses in
the nano- and picoseconds range. The ranging method using the APS/IPPD array is based on indirect TOF
measurements via phase detection [11]. It consists in the detection of the shift of the phase due to the TOF, of the RF
waveform modulating the amplitude of the cw laser beam. The concept for using MOEMS is not in the way the
scanning is used in the “flying spot” scanning LiDARs, where the narrow-divergence beam successively illuminates
the single pixels of the detector footprint. The current concept consists in the illumination of the footprints of
detector array segments, each containing a number of single pixels footprints. We refer this concept as “slow
scanning”.
Preliminary analytical and numerical studies of the MILS performances were carried out based, as a figure of
merit, on the accuracy of measurement. This accuracy combines the statistical error achievable with the respective

ICSO 2014 Tenerife, Canary Islands, Spain
International Conference on Space Optics 7 - 10 October 2014
sensors and the uncertainty following the platform moving during the integration time. The accuracy requirements
are combined with the requirements for resolution and imaged area (or angle) size stated for proximity navigation in
the expected planetary mission scenario. The results from the numerical modelling pointed out the critical
performances of the novelty components to be verified in 3D flash imaging: i) the statistical error of the range
measurement, ii) the pixel number and iii) the pixel density. In the present study we decided to concentrate on the
verification of the statistical error achievable with the considered sensors.
Fig. 1. Back- , side- and front-view of the SPAD detector head PCB, respectively in the left, central and right panel.
The sensor is seen in the right panel, inside the white circle.
Fig. 2. View of the APS/IPPD array assembly
Fig. 3. Magnetic optical MEMS pointing device. Left panel: Top view with aluminium support, which also acts
as a heat sink. The ceramic substrate is screwed onto this support. Right panel: Zoomed view of the micromirror assembly. The inclined view shows the 4x4 mm
2 mirror in the centre. The mirror is uncoated on this picture.
III. TECHNOLOGY DEMONSTRATOR BREADBOARD
To demonstrate the precision of the selected technologies for flash imaging LiDAR measurements we assembled a
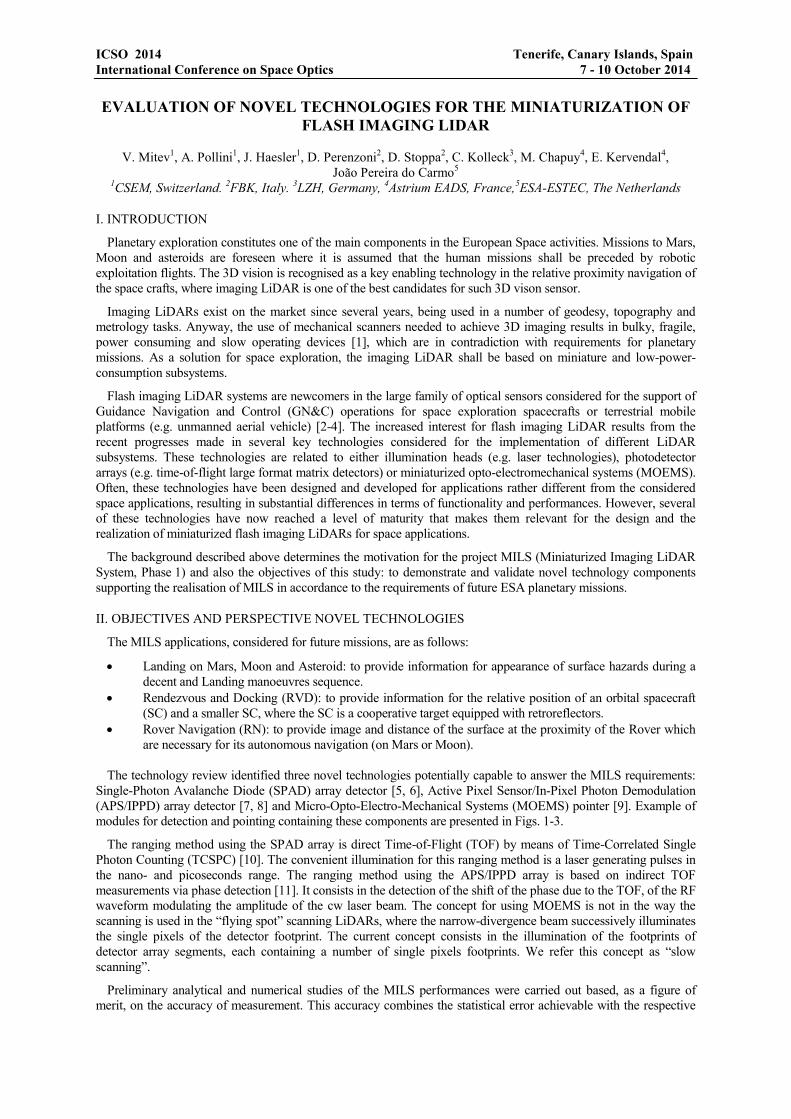
Technology Demonstrator BreadBoard (TDBB). The key building-blocks of the TDBB are three modules, each
supporting the SPAD array, the APS/IPPD array and the MOEMS mirror modules. The same TDBB was used for
APS/IPPD
Mounting
support
Mother
board
Read-out
electronics
board

ICSO 2014 Tenerife, Canary Islands, Spain
International Conference on Space Optics 7 - 10 October 2014
both 3D flash LiDAR configurations: (i) Indirect TOF, using APS/IPPD and amplitude modulated continuous wave
(cw) laser; (ii) Direct TOF/TCSPC using SPAD array and pulsed laser.
The optical receiver is a camera objective with a clear aperture diameter of 48 mm, determined by the front
mounted interference filter. The interference filters for both configurations have a FWHM (full width at half
maximum) of 12 nm with peak transmission of 75%. Various lenses are used to form the divergence of the laser
beam, producing footprint of 0.5 – 1.5 m diameters at distance of 80 m. The key specifications of the components
are presented in Tables 1-3. The MOEMS mirror has a size of 4x4 mm2 and mechanical tilting angle is +/-8 deg in
both axes. The TDBB is assembled on an optical breadboard, mounted on a chariot, supporting also all necessary
power supplies, interfaces and computer. A picture of the TDBB without the power supplies and the computer is
presented in Fig. 4.
Table 1. Specifications of the SPAD array
MF32 Pixel Array Pixel number 32x32 pixels
Pixel pitch 50 m x 50 m
Sensor array size 1.6 mm x 1.6 mm
Die size 4.5 mm x 4.5 mm
SPAD Active area (circular shape) 5.6 m diameter
Fill Factor 1%
Dead time ~50 ns
Photon detection efficiency >20 %@500 nm; >15 %@650 nm
Dark count rate per pixel ~50 counts/sec
Response time jitter ~220 ps (average)
Time-to-Digital
Converter (TDC)
TDC range 96 ns
TDC resolution 10 bits; 93.75 ps
Table 2. Specifications of the APS/IPPD array
Parameter Value
Full Well capacity 8900 e-
Conversion Factor 69 µV/e-
Dark Noise 40 e-
Fill Factor 14 %
Pixel Pitch 6.3 µm
Demodulation Contrast 72 % @ 16 MHz and 850 nm illumination
Number of Pixel 256 x 256 Pixel
Active Area 1.6 x 1.6 mm
Target Distance Standard Deviation 20 mm @ 16 MHz and 850 nm illumination
Table 3. Specifications of the lasers in the TDBB
Specification Direct TOF/TCSPC, SPAD array Phase measurement, APS/IPPD
Laser type Diode laser, pulsed, gain-switched Diode laser, cw
Manufacturer PicoQuant GmbH Toptica GmbH
Model LDH-D-C-635M iBEAM-SMART-660-S
Wavelength 635 nm 661 nm
Max pulse energy 71 pJ n.a.
Average power cw Max 1.2 mW Max 130 mW
Beam divergence 3.2 mrad x 1.1 mrad 2 mrad
Waveform Pulse duration ~100 ps; PRR till 80 MHz Quasi-harmonic modulation,
20 MHz
ICSO 2014 Tenerife, Canary Islands, Spain
International Conference on Space Optics 7 - 10 October 2014
Fig. 4. View of the TDBB (Technology Demonstrator BreadBoard)
IV. TEST AND ASSESSMENT
A. APS/IPPD, ranging method: indirect TOF/phase detection
The test of the TDBB configuration with APS/IPPS in indirect TOF measurement was performed with targets
containing several stepwise features. The measurements were performed in the following conditions: laser power:
50-100 mW; integration time = 14ms; average on 100-200 images; modulation frequency is 20 MHz, determining
an ambiguity range of 7.5 m.
One example of measurement is shown in Fig. 5. The 3D image of the target, reproduced from the measurements
with the APS is shown in Fig. 5 right panel.
The results from APS/IPPD test are as follows:
No systematic error is observed.
The achieved statistical error of the distance measurement is in the range of 25mm-40mm.
Distance measurements beyond the ambiguity range are possible, but they require a priori coarse knowledge
(or guess) of the distance, where the coarse interval shall be provided with uncertainty less than the
ambiguity range itself.
The statistical error is improved by increasing the number of averaged images at short integration time, rather
than by increasing signal integration time of single measurement.
The measurements require relatively high laser illumination power (up to cw 100 mW), as well as an
increase of the target albedo by covering it with white paper (see left panel in Fig. 5).
B. SPAD array, ranging method: direct TOF/TCSPC
The test of the TDBB configuration with SPAD array in direct TOF measurement was performed both with
targets containing stepwise features and targets having individual shapes. The measurements were performed at the
following conditions: laser power: ~0.1-0.5 mW, integrated photon count numbers in a single measurement per pixel
max ~4000; laser PRR from 0.1 to 2 MHz. The ranges to target were limited by the test facilities, up to 51 m.
One example of measurement with stepwise target is presented in Figs. 6,7 and 8. They present measurements of
stepwise, individual and of a spherical shape targets.
We may summarise the results from SPAD array test as follows:
No systematic error is observed.
No range ambiguity

ICSO 2014 Tenerife, Canary Islands, Spain
International Conference on Space Optics 7 - 10 October 2014
The achieved statistical error of the distance measurement is ~14.4 mm; this value corresponds to the range
resolution corresponding to the time resolution of the TDC.
With the same subsystem and measurement specifications, the laser power to achieve the same statistical
error with SPAD array is ~3 orders of magnitude less than the laser power needed in case of APS/IPPD. The superior sensitivity is the reason to select SPAD array for the preliminary design of MILS Elegant
BreadBoard (EBB), presented in [12].
Fig. 5. Result from APS/IPPD test. Left panel: picture of the target; the numbers show the height of the
stepwise features in mm. Right panel: 3D image from the LiDAR measurement. Please see the reconstruction
of the features “a”, “b” and “c” (inverted upside down). The target is at 4.55 m
Fig. 6. Result from SPAD test. Left: Picture of the step feature having height of 100 mm; Right: 3D image of the
encircled part of the target reproduced from the LiDAR measurement. Range to target is 4.9 m.

ICSO 2014 Tenerife, Canary Islands, Spain
International Conference on Space Optics 7 - 10 October 2014
Fig. 8. Result from SPAD test. Left: Picture of the target “soft toy Teddy Bear”, Right: 3D image reconstructed
from LiDAR measurements. Range to target is 8.8 m.
Fig. 9. Result from SPAD test. Left: Picture of the spherical target, diameter 40 cm. Right: 3D image
reconstructed from the LiDAR measurements. Range to target is 22.4 m.
Fig. 10. Result from SPAD/MOEMS test. Left: Picture of the target, Middle: individual 3D images, Right:
Combined image from the four successive images obtained by slow scanning. Range to target is 25 m.
C. Slow scanning with MOEMS
The slow scanning (Fig. 10) was performed at four pointing directions of the laser beam resulting in four partially
overlapping beam footprints on the target. The target shape recovery was done by overlapping the respective partial
3D images from each of the beams. The measurements were performed only in TDBB configuration with SPAD
array, at target range of 25 m. From the “slow scanning” test with MOEMS we may summarise the following:
- The “slow scanning” allows the concentration of more illumination laser power on a smaller part of the
target, with the same overall sensor array footprint.
b
d
c
a d
c b
a
ICSO 2014 Tenerife, Canary Islands, Spain
International Conference on Space Optics 7 - 10 October 2014
- In measurement of surface, this power concentration does not give advantage in reducing the total
measurement time, since the time to scan increases proportionally to the power concentration.
- This concentration gives definite advantage when it is necessary to track single object inside the sensor array
footprint, i.e. the capabilities of MOEMS in slow scanning are critical in reducing the required laser power in
EBB and FM for the application RVD.
V. VALIDATION OF THE MODEL USED FOR EVALUATION OF THE MILS PERFORMANCE
Following the results from SPAD and APS/IPPD tests with the TDBB, we proposed the MILS and MILS EBB to
be based on direct TOF/TCSPC measurements implementing large SPAD array [12]. In view of the MILS
performance evaluation, a validation of the analytical and numerical models was performed. The performance
evaluation model has two main components. The first component of the model is the LiDAR equation [13]. This
equation, applied to direct TOF/TCSPC measurements, provides the mean number of signal counts per laser pulse as
a function of the subsystem specifications and the parameters of the measurement.
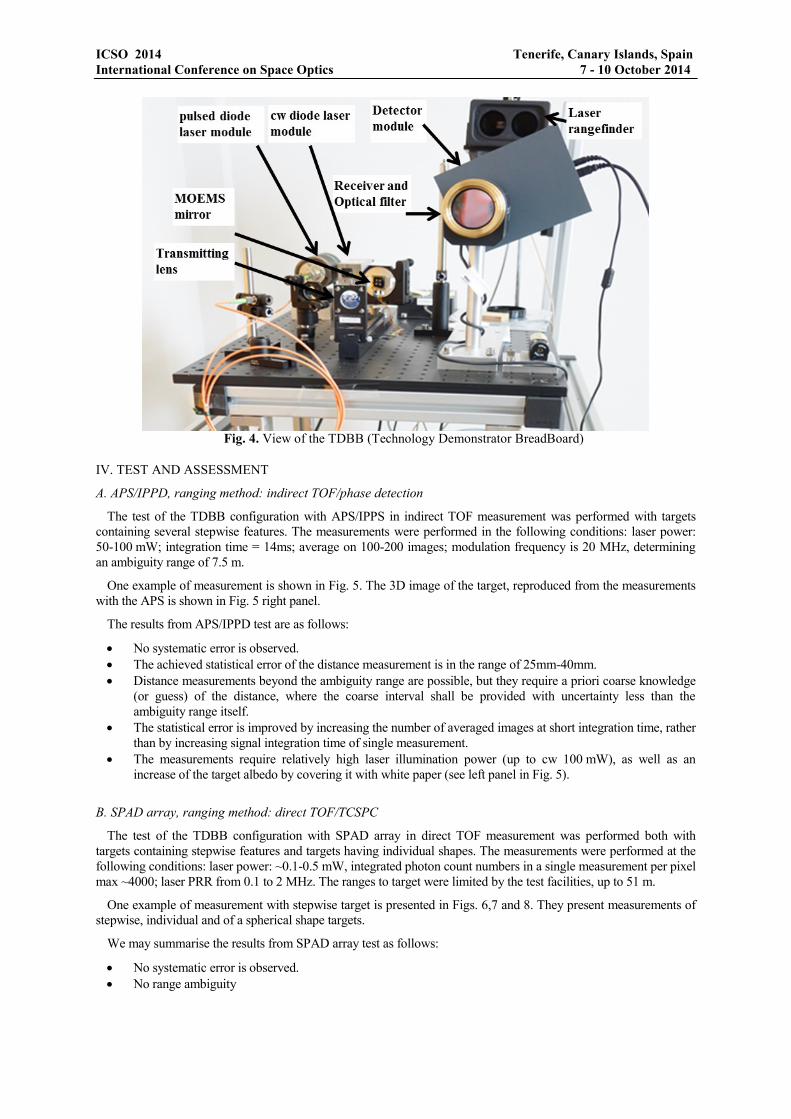
A large set of measurements of the total signal count values were performed, with a flat surface of polystyrene
foam as target, having albedo of 0.95, at a distance of 6 m. In parallel, following the LiDAR equation of the model,
the values of the total counts per histogram were calculated, based on the values for the subsystems specifications,
range to target and albedo. The two results, i.e., the ones determined experimentally and the ones determined from
the LiDAR equation are compared in Fig. 11. The comparison assumes an efficiency of the receiver optics of 0.445,
which was the only subsystem specification not verified separately for this measurement.
Fig. 11. Power balance of the TDBB with SPAD array.
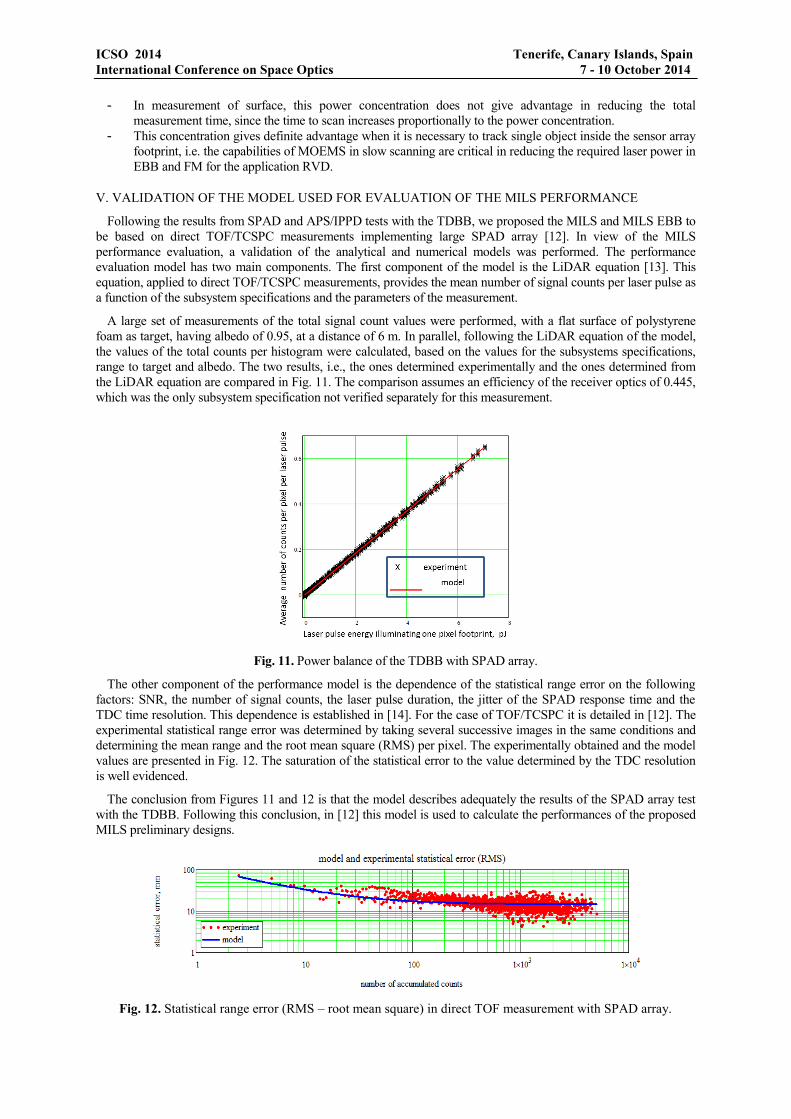
The other component of the performance model is the dependence of the statistical range error on the following
factors: SNR, the number of signal counts, the laser pulse duration, the jitter of the SPAD response time and the
TDC time resolution. This dependence is established in [14]. For the case of TOF/TCSPC it is detailed in [12]. The
experimental statistical range error was determined by taking several successive images in the same conditions and
determining the mean range and the root mean square (RMS) per pixel. The experimentally obtained and the model
values are presented in Fig. 12. The saturation of the statistical error to the value determined by the TDC resolution
is well evidenced.
The conclusion from Figures 11 and 12 is that the model describes adequately the results of the SPAD array test
with the TDBB. Following this conclusion, in [12] this model is used to calculate the performances of the proposed
MILS preliminary designs.
Fig. 12. Statistical range error (RMS – root mean square) in direct TOF measurement with SPAD array.
ICSO 2014 Tenerife, Canary Islands, Spain
International Conference on Space Optics 7 - 10 October 2014
VI. CONCLUSION
The objectives stated at the start of the activity have been achieved. The most promising technologies having the
potential for miniaturization of the imaging LiDAR have been identified and experimentally investigated. The
experimental investigation was performed with a breadboard (TDBB), where the representative components for the
novelty technologies were assembled and operated in a flash imaging LiDAR mode.
The TDBB tests provided a collection of 3D images of various targets of both stepwise geometry and some of
individual shape. The capabilities of APS/IPPD and SPAD array have been identified. The tests demonstrated that
the SPAD array, having superior sensitivity, has the potential to answer the requirement for the three basic
measurement scenario in future planetary missions: Landing, RVD and RN.
The APS/IPPD measurements are limited to short range due to both its short ambiguity range and inferior
sensitivity. At the same time, this type of sensor has superior pixel number compared to SPAD array and very likely
it will keep this superiority in the future. This would be an advantage in a debris removal scenario as detection is
performed at short range. The ambiguity range limitation may be solved if the flash 3D LiDAR may operate in a
GN&C system providing independently a coarse knowledge of the distance to target.
The results from the tests were used to validate the performance model for flash imaging LiDAR using SPAD
array, as the proposed MILS design will be based on it. This includes: i) the power balance; ii) the dependence of the
statistical range error on the signal, noise and the system specifications. The validated MILS numerical evaluation
model was then used to validate the performances of the proposed MILS preliminary designs for each of the
required application (Landing, RDV and RN) in [12].
ACKNOWLEDGEMENTS
Acknowledgements are due to Dr. T. Akiyama, Dr. W. Noell and Prof. N. de Rooij from EPFL, Switzerland, as
well as Dr. S. Lani from CSEM, Switzerland, for making available the MOEMS mirror.
REFERENCES
[1] J. Pereira do Carmo, B. Moebius, M. Pfennigbauer, R. Bond, I. Bakalski, M. Foster, S. Bellis, M. Humphries, R. Fisackerly, B. Houdou, “Imaging lidars for space applications”, Proceedings of SPIE: Optics and Photonics, vol. 7061-16, 2008.
[2] J. A. Keim, S. Mobasser, Da Kuang, Y. Cheng, T. Ivanov, A. E. Johnson, H. R. Goldberg, G. Khanoyan, and D. B. Natzic, “Field Test Implementation to Evaluate a Flash Lidar as a Primary Sensor for Safe Lunar Landing”, IEEE Aerospace Conference, 06 - 13 March 2010, Big Sky MT, USA, Proceedings, pp. 121-134, 2010.
[3] A. E. Johnson, J. A. Keim, T. Ivanov “Analysis of Flash Lidar Field Test Data for Safe Lunar Landing” ibid, pp. 135-145, 2010.
[4] J. D. Weinberg, R. Craig, P. Earhart, I. Gravseth, K. L Miller, “Flash LIDAR Systems for Hazard Detection, Surface Navigation and Autonomous Rendezvous and Docking”, LEAG Workshop on Enabling Exploration: The Lunar Outpost and Beyond, October 1-5, 2007, Houston, Texas, pp.3023-3024, 2007.
[5] C. Niclass, 2008, “Single-Photon Imaging in CMOS: Picosecond Resolution for Three-Dimentional Imaging”, PhD Thesis, EPFL, Lausanne 2008.
[6] J. Richardson, R. Walker, L. Grant, E. Charbon, M. Gersbach, D. Stoppa, F. Borghetti, R. K. Henderson, “A 32x32 50ps resolution 10 bit time to digital converter array in 130nm CMOS for time correlated imaging”, IEEE Custom Integrated Circuits Conference San Jose, California, USA, 13-16 Sept. 2009, pp. 77-80, 2009.
[7] R. Lange “3D Time-of-Flight Distance Measurement with Custom Solid-State Image Sensors in CMOS/CCD-Technology” PhD Thesis, University Siegen, 2000.
[8] T. Oggier, M. Lehmann, R. Kaufmann, M. Schweizer, M. Richter, P. Metzler, G. Lang, F. Lustenberger, N. Blanc, An all-solid-state optical range camera for 3D real-time imaging with sub-centimeter depth resolution (SwissRanger), Optical Design and Engineering, SPIE, v. 5249, pp. 534-545, 2004.
[9] Ç. Ataman, S. Lani, W. Noell, N. de Rooij, “A dual-axis pointing mirror with moving-magnet actuation“, J. Micromech. Microeng., v. 23, No.2, 025002 (13pp), 2013.
[10] W. Becker, 2005, Advanced Time-Correlated Single-Photon Counting techniques, Springer, Berlin [11] El Mechat M’Hamed-Ali, “Statistical Range Estimation for Optical Time-of-Flight 3D Imaging”,
Dissertation, ETHZ, Zurich, 2010. [12] A. Pollini, J. Haesler, V. Mitev, J. Pereira do Carmo, “Performance modelling of miniaturized flash-
imaging LiDARs for future Mars exploration missions”, paper Ref. 66403, ICSO 2014, 7-10 October, Tenerife, Canary Islands, Spain, to be published.
[13] A. V. Jelalian, Laser Radar System, Artech House, Boston-London, 1992. [14] D. C. Carmer and L. M. Peterson, “Laser radar in robotics”, Proc. of the IEEE, vol. 84, 299-320, 1996.