l ab or m arket i ndustr y profile...
TRANSCRIPT
FloridaLogistics &
DistributionIndustry
2017 Edition
Source: Florida Department of Economic Opportunity, Bureau of Labor Market Statistics
L a b o r M a r k e t I n d u s t r y P r o f i l e
Florida Logistics and Distribution
Florida has been called “The Gateway to the Americas” because the geographic location positions the state ideally as a hub of commerce to all parts of the world. The state has one of the world's most extensive multi-modal transportation systems, featuring international airports, deep-water shipping ports, and extensive highway and rail networks. Florida’s transportation infrastructure includes a 122,000-mile highway system; 15 deep-water seaports; 3,000 miles of freight rail tracks; 20 commercial service airports, and two commercially licensed spaceports.
The logistics and distribution industry cluster includes the following industry subsectors: wholesale trade; air transportation; water transportation; truck transportation; support activities for transportation; and warehousing and storage.
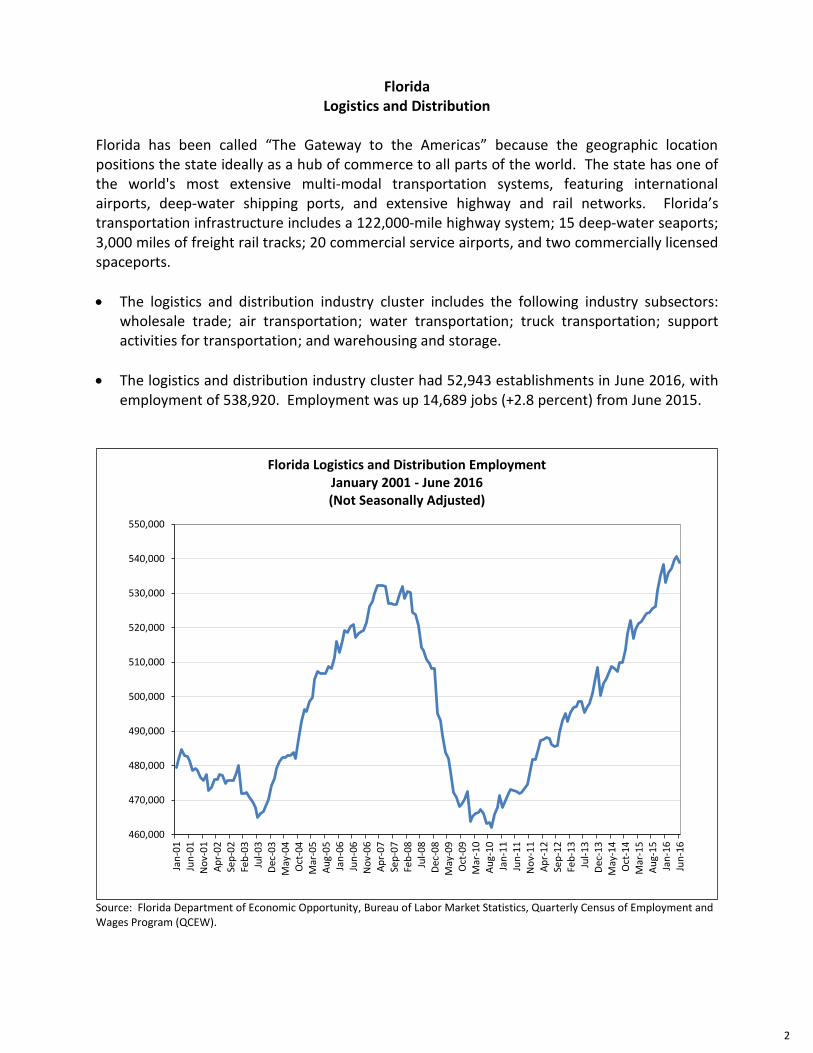
The logistics and distribution industry cluster had 52,943 establishments in June 2016, with employment of 538,920. Employment was up 14,689 jobs (+2.8 percent) from June 2015.
Source: Florida Department of Economic Opportunity, Bureau of Labor Market Statistics, Quarterly Census of Employment and Wages Program (QCEW).
460,000
470,000
480,000
490,000
500,000
510,000
520,000
530,000
540,000
550,000
Jan
-01
Jun
-01
No
v-0
1A
pr-
02
Sep
-02
Feb
-03
Jul-
03
Dec
-03
May
-04
Oct
-04
Mar
-05
Au
g-0
5Ja
n-0
6Ju
n-0
6N
ov-
06
Ap
r-0
7Se
p-0
7Fe
b-0
8Ju
l-0
8D
ec-0
8M
ay-0
9O
ct-0
9M
ar-1
0A
ug-
10
Jan
-11
Jun
-11
No
v-1
1A
pr-
12
Sep
-12
Feb
-13
Jul-
13
Dec
-13
May
-14
Oct
-14
Mar
-15
Au
g-1
5Ja
n-1
6Ju
n-1
6
Florida Logistics and Distribution EmploymentJanuary 2001 - June 2016(Not Seasonally Adjusted)
2
Logistics and distribution employment peaked with 532,232 jobs in March 2007. After March 2008, employment began declining steadily and reached a low of 461,960 jobs in September 2010. Employment has been on an upward trend since September 2010, increasing to 538,920 jobs in June 2016.
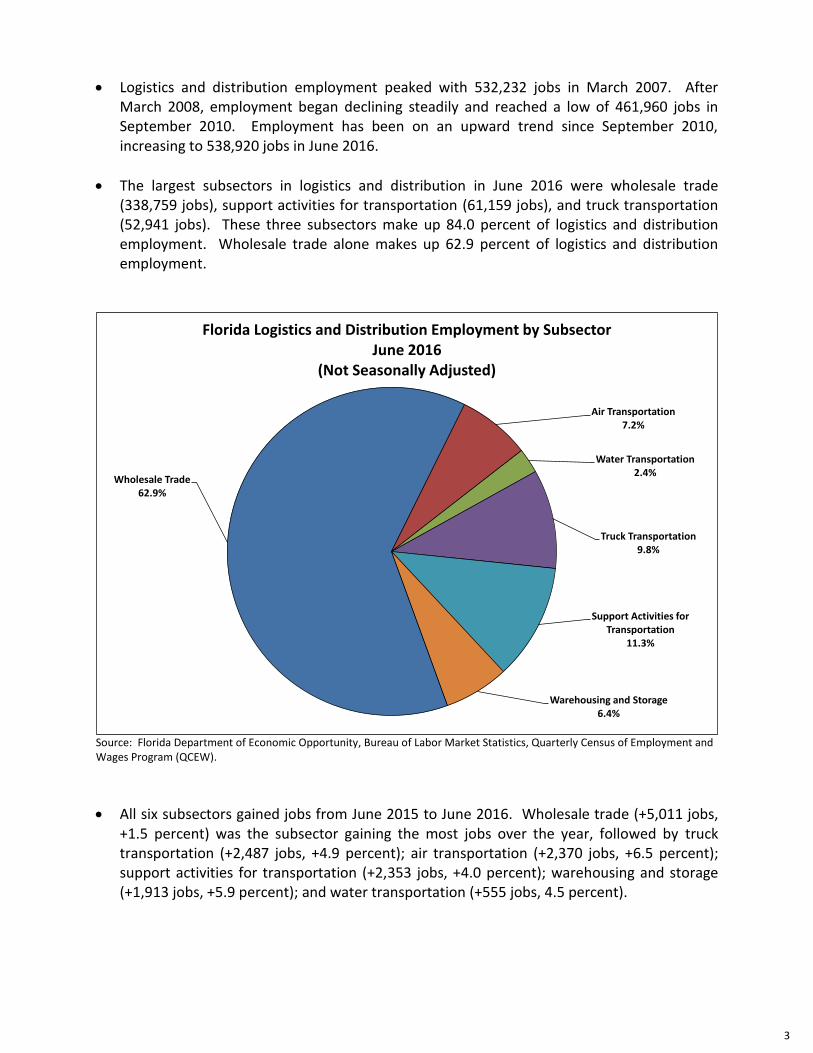
The largest subsectors in logistics and distribution in June 2016 were wholesale trade (338,759 jobs), support activities for transportation (61,159 jobs), and truck transportation (52,941 jobs). These three subsectors make up 84.0 percent of logistics and distribution employment. Wholesale trade alone makes up 62.9 percent of logistics and distribution employment.
Source: Florida Department of Economic Opportunity, Bureau of Labor Market Statistics, Quarterly Census of Employment and Wages Program (QCEW).
All six subsectors gained jobs from June 2015 to June 2016. Wholesale trade (+5,011 jobs, +1.5 percent) was the subsector gaining the most jobs over the year, followed by truck transportation (+2,487 jobs, +4.9 percent); air transportation (+2,370 jobs, +6.5 percent); support activities for transportation (+2,353 jobs, +4.0 percent); warehousing and storage (+1,913 jobs, +5.9 percent); and water transportation (+555 jobs, 4.5 percent).
Wholesale Trade62.9%
Air Transportation7.2%
Water Transportation2.4%
Truck Transportation9.8%
Support Activities for Transportation
11.3%
Warehousing and Storage6.4%
Florida Logistics and Distribution Employment by Subsector June 2016
(Not Seasonally Adjusted)
3
Source: Florida Department of Economic Opportunity, Bureau of Labor Market Statistics, Quarterly Census of Employment and Wages Program (QCEW).
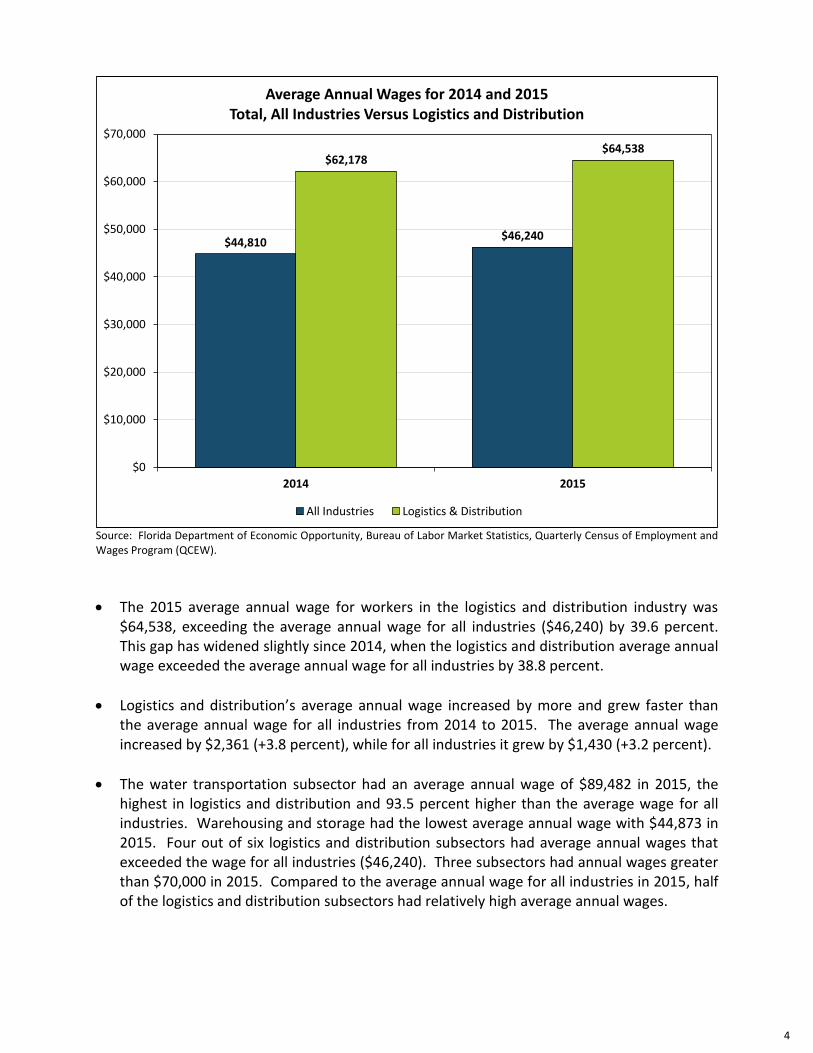
The 2015 average annual wage for workers in the logistics and distribution industry was $64,538, exceeding the average annual wage for all industries ($46,240) by 39.6 percent. This gap has widened slightly since 2014, when the logistics and distribution average annual wage exceeded the average annual wage for all industries by 38.8 percent.
Logistics and distribution’s average annual wage increased by more and grew faster than the average annual wage for all industries from 2014 to 2015. The average annual wage increased by $2,361 (+3.8 percent), while for all industries it grew by $1,430 (+3.2 percent).
The water transportation subsector had an average annual wage of $89,482 in 2015, the highest in logistics and distribution and 93.5 percent higher than the average wage for all industries. Warehousing and storage had the lowest average annual wage with $44,873 in 2015. Four out of six logistics and distribution subsectors had average annual wages that exceeded the wage for all industries ($46,240). Three subsectors had annual wages greater than $70,000 in 2015. Compared to the average annual wage for all industries in 2015, half of the logistics and distribution subsectors had relatively high average annual wages.
$44,810$46,240
$62,178$64,538
$0
$10,000
$20,000
$30,000
$40,000
$50,000
$60,000
$70,000
2014 2015
Average Annual Wages for 2014 and 2015Total, All Industries Versus Logistics and Distribution
All Industries Logistics & Distribution
4

All Education and Training Levels
Source: Florida Department of Economic Opportunity, Bureau of Labor Market Statistics, Long Term Projections Program, forecast to 2024.
The 15 largest occupations specific to logistics and distribution make up 55.7 percent of the total employment in the industry cluster.
The largest logistics and distribution-specific occupation in 2016 was sales representatives, wholesale and manufacturing, non-technical, which has a median hourly wage of $23.58.
Among the fifteen largest industry-specific occupations, median hourly wages range from a high of $53.15 for general and operations managers to a low of $9.51 for hand packers and packagers.
Six out of the 15 largest occupations have a median wage greater than $20.00 per hour.
All of the 15 largest occupations are projected to increase in employment through 2024.
Sales representatives, wholesale and manufacturing, non-technical are expected to gain the most jobs of all of the top 15 logistics and distribution-specific occupations from 2016 to 2024 (+6,709 jobs). Cargo and freight agents are expected to grow the fastest (+12.17 percent).
Ten of the top 15 industry-specific occupations require training beyond high school, but none require a bachelor’s degree. Higher wages are found in occupations with greater training requirements.
2016
% of Median
Employment Industry Hourly Training
Occupation Title 2016 2024 Total Percent Total Wage Requirement
Total, All Logistics and Distribution Occupations 536,361 577,604 41,243 7.69
Sales Representatives, Wholesale and Manufacturing, Non-technical 76,574 83,283 6,709 8.76 14.28 23.58 Postsecondary Vocational
Heavy and Tractor-Trailer Truck Drivers 47,035 51,719 4,684 9.96 8.77 17.83 Postsecondary Vocational
Laborers and Freight, Stock, and Material Movers, Hand 44,636 48,548 3,912 8.76 8.32 11.34 Less than High School
Stock Clerks and Order Fillers 17,912 19,328 1,416 7.91 3.34 11.32 High School Diploma
Sales Representatives, Wholesale & Mfg, Tech. & Sci. Prod. 14,628 15,438 810 5.54 2.73 34.47 Postsecondary Vocational
Shipping, Receiving, and Traffic Clerks 12,726 13,133 407 3.20 2.37 13.87 Postsecondary Vocational
Light Truck or Delivery Services Drivers 12,710 13,837 1,127 8.87 2.37 14.21 Postsecondary Vocational
Industrial Truck and Tractor Operators 11,269 12,013 744 6.60 2.10 15.26 Postsecondary Vocational
First-Line Supervisors of Non-Retail Sales Workers 10,876 11,819 943 8.67 2.03 37.86 Associate Degree
Reservation and Transportation Ticket Agents and Travel Clerks 10,338 10,943 605 5.85 1.93 15.17 High School Diploma
Packers and Packagers, Hand 9,888 10,814 926 9.36 1.84 9.51 Less than High School
Aircraft Mechanics and Service Technicians 8,974 9,813 839 9.35 1.67 26.17 Postsecondary Vocational
Flight Attendants 8,229 8,992 763 9.27 1.53 26.04 High School Diploma
General and Operations Managers 7,170 7,766 596 8.31 1.34 53.15 Associate Degree
Cargo and Freight Agents 5,884 6,600 716 12.17 1.10 19.40 Postsecondary Vocational
Top Occupations in the Logistics and Distribution Industry Cluster For All Training Levels
2016-2024 Change
5
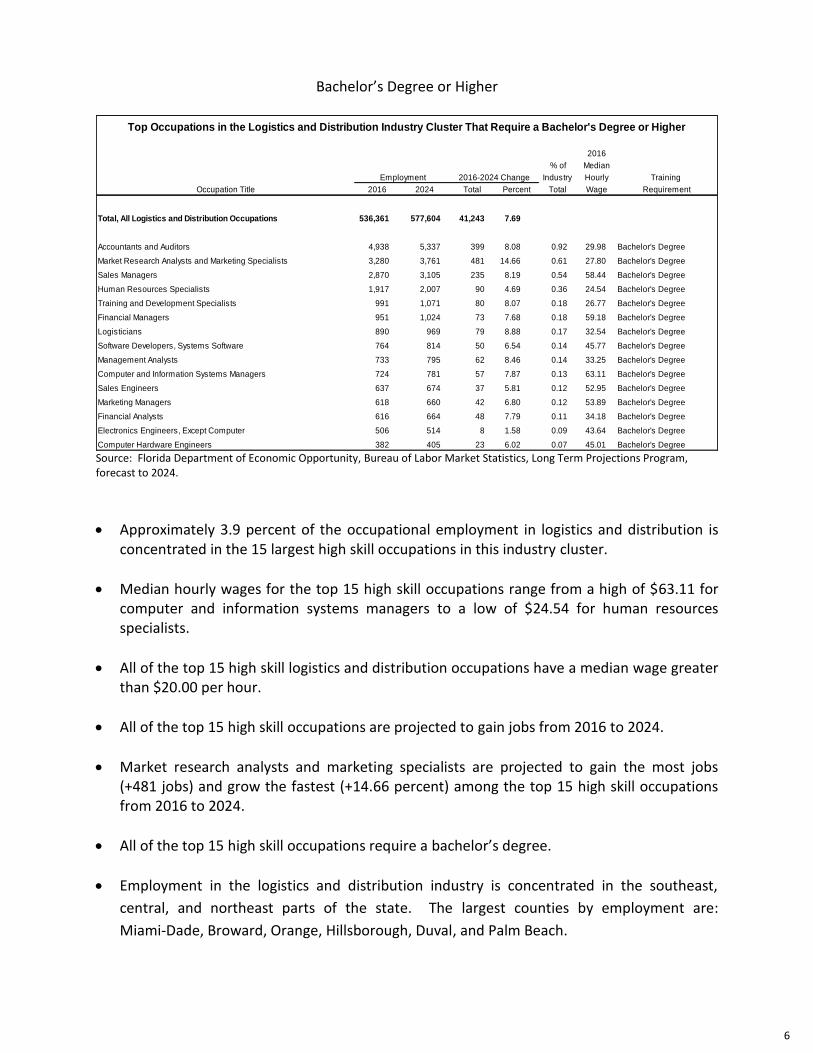
Bachelor’s Degree or Higher
Source: Florida Department of Economic Opportunity, Bureau of Labor Market Statistics, Long Term Projections Program, forecast to 2024.
Approximately 3.9 percent of the occupational employment in logistics and distribution is concentrated in the 15 largest high skill occupations in this industry cluster.
Median hourly wages for the top 15 high skill occupations range from a high of $63.11 for computer and information systems managers to a low of $24.54 for human resources specialists.
All of the top 15 high skill logistics and distribution occupations have a median wage greater than $20.00 per hour.
All of the top 15 high skill occupations are projected to gain jobs from 2016 to 2024.
Market research analysts and marketing specialists are projected to gain the most jobs (+481 jobs) and grow the fastest (+14.66 percent) among the top 15 high skill occupations from 2016 to 2024.
All of the top 15 high skill occupations require a bachelor’s degree.
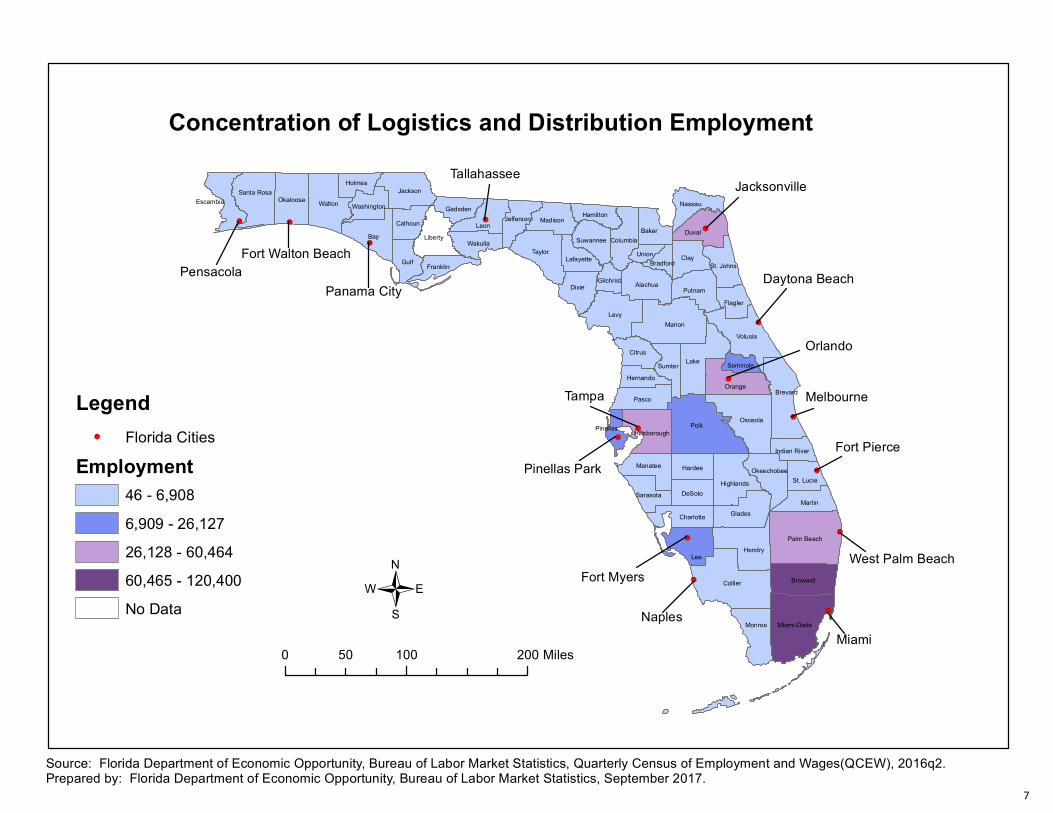
Employment in the logistics and distribution industry is concentrated in the southeast,
central, and northeast parts of the state. The largest counties by employment are:
Miami-Dade, Broward, Orange, Hillsborough, Duval, and Palm Beach.
2016
% of Median
Employment Industry Hourly Training
Occupation Title 2016 2024 Total Percent Total Wage Requirement
Total, All Logistics and Distribution Occupations 536,361 577,604 41,243 7.69
Accountants and Auditors 4,938 5,337 399 8.08 0.92 29.98 Bachelor's Degree
Market Research Analysts and Marketing Specialists 3,280 3,761 481 14.66 0.61 27.80 Bachelor's Degree
Sales Managers 2,870 3,105 235 8.19 0.54 58.44 Bachelor's Degree
Human Resources Specialists 1,917 2,007 90 4.69 0.36 24.54 Bachelor's Degree
Training and Development Specialists 991 1,071 80 8.07 0.18 26.77 Bachelor's Degree
Financial Managers 951 1,024 73 7.68 0.18 59.18 Bachelor's Degree
Logisticians 890 969 79 8.88 0.17 32.54 Bachelor's Degree
Software Developers, Systems Software 764 814 50 6.54 0.14 45.77 Bachelor's Degree
Management Analysts 733 795 62 8.46 0.14 33.25 Bachelor's Degree
Computer and Information Systems Managers 724 781 57 7.87 0.13 63.11 Bachelor's Degree
Sales Engineers 637 674 37 5.81 0.12 52.95 Bachelor's Degree
Marketing Managers 618 660 42 6.80 0.12 53.89 Bachelor's Degree
Financial Analysts 616 664 48 7.79 0.11 34.18 Bachelor's Degree
Electronics Engineers, Except Computer 506 514 8 1.58 0.09 43.64 Bachelor's Degree
Computer Hardware Engineers 382 405 23 6.02 0.07 45.01 Bachelor's Degree
Top Occupations in the Logistics and Distribution Industry Cluster That Require a Bachelor's Degree or Higher
2016-2024 Change
6
!(
!(!(!(
!(
!(
!(
!(
!(
!(
!(
!(!(
!(
!(
PensacolaFort Walton Beach
Panama City
TallahasseeJacksonville
Tampa
Pinellas Park
Fort Myers
Naples
Daytona Beach
Orlando
Melbourne
Fort Pierce
West Palm Beach
Miami
Polk
Collier
LevyMarion
Lake
Bay
Lee
Osceola
Palm Beach
Taylor
Volusia
Walton
Brevard
Miami-Dade
Hendry
Duval
Dixie
Clay
Leon
Broward
Gulf
Glades
Orange
Liberty
Monroe
Pasco
Alachua
Jackson
Highlands
Putnam
Martin
Citrus
Baker
Manatee
Nassau
Madison
Hardee
DeSoto
Wakulla
Charlotte
Flagler
St. Lucie
Franklin
Holmes
Lafayette
HamiltonGadsdenOkaloosa
Santa Rosa
Hillsborough
Columbia
Sumter
Escambia
St. Johns
Calhoun
Okeechobee
Jefferson
Sarasota
Suwannee
Washington
Hernando
Indian River
Gilchrist
Union
Pinellas
Seminole
Bradford
Concentration of Logistics and Distribution Employment
Legend!( Florida Cities
Employment46 - 6,9086,909 - 26,12726,128 - 60,46460,465 - 120,400No Data
Source: Florida Department of Economic Opportunity, Bureau of Labor Market Statistics, Quarterly Census of Employment and Wages(QCEW), 2016q2.
/0 100 20050 Miles
Prepared by: Florida Department of Economic Opportunity, Bureau of Labor Market Statistics, September 2017.7
!(
!(!(!(
!(
!(
!(
!(
!(
!(
!(
!(!(
!(
!(
PensacolaFort Walton Beach
Panama City
Tallahassee Jacksonville
Tampa
Pinellas Park
Fort Myers
Naples
Daytona Beach
Orlando
Melbourne
Fort Pierce
West Palm Beach
Miami
Polk
Collier
LevyMarion
Lake
Bay
Lee
Osceola
Palm Beach
Taylor
Volusia
Walton
Brevard
Miami-Dade
Hendry
Duval
Dixie
Clay
Leon
Broward
Gulf
Glades
Orange
Liberty
Monroe
Pasco
Alachua
Jackson
Highlands
Putnam
Okaloosa
Martin
Citrus
Baker
Santa Rosa
Manatee
Nassau
Hillsborough
Madison
Hardee
Columbia
DeSoto
Wakulla
Charlotte
Sumter
Escambia
Flagler
St. Johns
Calhoun
St. LucieOkeechobee
Franklin
Jefferson
Sarasota
Suwannee
Holmes
Lafayette
HamiltonGadsdenWashington
Hernando
Indian River
GilchristUnion
Seminole
Bradford
Pinellas
Concentration of Logistics and Distribution Establishments by Location
Legend!( Florida Cities
Establishments10 - 214215 - 748749 - 1,6191,620 - 5,2145,215 - 10,002
/0 100 20050 Miles
Source: Infogroup Inc., Employer Database 2017-2nd EditionPrepared by: Florida Department of Economic Opportunity, Bureau of Labor Market Statistics, September 2017.
8