jak/stat signalling mediates cell survival in response to tissue stress
TRANSCRIPT

© 2016. Published by The Company of Biologists Ltd.
JAK/STAT signalling mediates cell survival in response to tissue
stress
Marco La Fortezza, Madlin Schenk, Andrea Cosolo, Addie Kolybaba, Isabelle Grass, Anne-Kathrin
Classen
Ludwig-Maximilians-University Munich, Faculty of Biology
Grosshaderner Strasse 2-4, 82152 Planegg-Martinsried, Germany
Keywords: JAK/STAT, JNK, cell survival, compensatory proliferation, cancer, injury-induced
apoptosis, Eiger, cell ablation
Corresponding author:
Dr. Anne-Kathrin Classen
Ludwig-Maximilians-University Munich
Faculty of Biology, Biozentrum
Grosshaderner Strasse 2-4
D-82152 Planegg-Martinsried
Germany
Tel +49 89 2180 74325
Fax +49 89 2180 74236
Dev
elo
pmen
t • A
dvan
ce a
rtic
le
http://dev.biologists.org/lookup/doi/10.1242/dev.132340Access the most recent version at First posted online on 6 July 2016 as 10.1242/dev.132340

Abstract
Tissue homeostasis relies on the ability of tissues to respond to stress. Tissue regeneration and
tumour models in Drosophila have shown that JNK is a prominent stress-response pathway promoting
injury-induced apoptosis and compensatory proliferation. A central question remaining unanswered is
how both responses are balanced by activation of a single pathway. JAK/STAT signalling, a potential
JNK target, is implicated in promoting compensatory proliferation. While we observe JAK/STAT
activation in imaginal discs upon damage, our data demonstrates that JAK/STAT and its downstream
effector Zfh2 promote survival of JNK-signalling cells instead. The JNK component fos and the pro-
apoptotic gene hid are regulated in a JAK/STAT-dependent manner. This molecular pathway restrains
JNK-induced apoptosis and spatial propagation of JNK-signalling, thereby limiting the extent of tissue
damage, as well as facilitating systemic and proliferative responses to injury. We find that the pro-
survival function of JAK/STAT also drives tumour growth under conditions of chronic stress. Our study
defines JAK/STAT function in tissue stress and illustrates how crosstalk between conserved signalling
pathways establishes an intricate equilibrium between proliferation, apoptosis and survival to restore
tissue homeostasis.
Dev
elo
pmen
t • A
dvan
ce a
rtic
le

Introduction
Tissue homeostasis relies on the ability of tissues to respond to stress caused by damaging
environmental insults. Physical wounding, toxins, reactive oxygen species or UV irradiation induce
cellular damage and thus disrupt tissue integrity. Mounting an appropriate response is essential to
tissue repair and to prevent chronic cellular stress that drives diseases (Fulda et al., 2010). While
much progress has been made to elucidate signalling pathways that seal wounds, remove damaged
cells, promote regenerative proliferation or mediate patterning of regenerated tissue, little is known
about how cross-talk between these pathways coordinates repair processes to restore homeostasis.
Drosophila progenitor organs called imaginal discs have provided deep insights into cellular
adaptations to tissue stress. Surgical excision (Bryant, 1975, Haynie and Bryant, 1976, Katsuyama et
al., 2015) or cell ablation induced by pro-apoptotic transgenes (Grusche et al., 2011, Herrera et al.,
2013, Smith-Bolton et al., 2009) elucidated cellular responses that promote wound healing (Sun and
Irvine, 2014, Kashio et al., 2014, Razzell et al., 2011). Disc size is restored by accelerated
proliferation of cells proximal (Sustar et al., 2011, Bosch et al., 2008) and distal (Herrera et al., 2013)
to the wound site. Lacking tissue-resident stem cells, fate plasticity displayed by parenchymal disc
cells facilitates repatterning of replaced tissues (Herrera et al., 2013, Herrera and Morata, 2014,
Repiso et al., 2013, Schuster and Smith-Bolton, 2015). In contrast, regeneration of the Drosophila
adult midgut is driven by tissue-resident stem cells (Ohlstein and Spradling, 2006, Jiang et al., 2009,
Osman et al., 2012, Staley and Irvine, 2010). Strikingly, while midgut and imaginal discs utilize stem
cell-dependent and independent repair processes, both tissues activate similar signalling pathways
that underlie potentially highly conserved stress responses.
The JNK/MAPK-cascade is among the earliest pathways activated in damaged tissues, triggered by
loss of epithelial polarity (Brumby and Richardson, 2003, Uhlirova et al., 2005, Igaki, 2009, Wu et al.,
2010, Zhu et al., 2010), apoptosis of cells (Ryoo et al., 2004, Shlevkov and Morata, 2012) or physical
wounding (Bosch et al., 2005, Ramet et al., 2002, Lee et al., 2005). JNK regulates stress responses
via activation of the transcription factor AP-1 (Eferl and Wagner, 2003), formed by Jun and Fos homo-
and heterodimers. JNK activation is required for cytoskeletal rearrangement during wound closure
(Rios-Barrera and Riesgo-Escovar, 2013, Bosch et al., 2005) and promotes elimination of damaged
cells by injury-induced apoptosis (Bogoyevitch et al., 2010, Chen, 2012, Shlevkov and Morata, 2012,
Luo et al., 2007, Moreno et al., 2002). Importantly, JNK drives compensatory proliferation to replace
damaged tissues, through cell-autonomous (Bosch et al., 2008, Sun and Irvine, 2011, Grusche et al.,
2011) and non-autonomous (Bergantinos et al., 2010, Mattila et al., 2005, Ryoo et al., 2004)
mechanisms. A central question remaining unanswered is how these different responses –
proliferation and apoptosis - are brought into equilibrium downstream of JNK to restore tissue
homeostasis.
Dev
elo
pmen
t • A
dvan
ce a
rtic
le

Apoptotic JNK targets that facilitate clearing of damaged cells include the dIAP-inhibitors reaper (rpr),
head involution defective (hid) or p53 (Shlevkov and Morata, 2012, Luo et al., 2007, Moreno et al.,
2002). Activation of rpr, hid and p53 drives further activation of JNK via the initiator Caspase Dronc
(Shlevkov and Morata, 2012). JNK also activates the TNFα homologue Eiger (Perez-Garijo et al.,
2013), leading to activation of JNK in nearby cells (Perez-Garijo et al., 2013, Bergantinos et al., 2010,
Wu et al., 2010). This positive feedback could drive excessive cell elimination and therefore, needs to
be restrained to prevent unlimited spatial propagation of pro-apoptotic JNK activity. How spatial
constraints on JNK-propagation are established is poorly understood.
Importantly, apoptosis of damaged cells stimulates compensatory proliferation by JNK-dependent
activation of growth pathways including Wnt/-catenin, TFG/SMAD, JAK/STAT, Hippo/Yorkie and
EGF (Sun and Irvine, 2011, Wells et al., 2006, Kondo et al., 2006, Huh et al., 2004, Sun and Irvine,
2014, Morata et al., 2011, Pastor-Pareja and Xu, 2013). While the requirement for these pathways
differs depending on context (Smith-Bolton et al., 2009, Herrera et al., 2013, Fan and Bergmann,
2008), many have been implicated in metazoan responses to stress (Sun and Irvine, 2014, Pahlavan
et al., 2006, Chen, 2012). Importantly, preventing execution of apoptosis in damaged cells causes
sustained proliferative signalling and eventual tumour formation in Drosophila (Kondo et al., 2006,
Perez-Garijo et al., 2004, Ryoo et al., 2004, Huh et al., 2004, Perez-Garijo et al., 2009, Martin et al.,
2009), emphasizing how strongly apoptotic, survival and proliferative signals need to be balanced to
re-establish normal tissue size.
Current models propose that JAK/STAT (Janus kinase/Signal transducer and activator of
transcription) signalling is a major mediator of compensatory, cancerous and developmental
proliferation. Cytokine-like ligands in Drosophila are encoded by upd (unpaired), upd2, and upd3 and
signal through conserved pathway components encoded by single genes, specifically the receptor
Domeless (Dome), the Janus kinase Hopscotch (Hop) and the transcription factor Stat92E
(Arbouzova and Zeidler, 2006). As in mammals, JAK/STAT plays diverse roles in fly development by
regulating hemocyte activation (Myllymaki and Ramet, 2014), appendage patterning (Ayala-Camargo
et al., 2013, Johnstone et al., 2013, Ayala-Camargo et al., 2007), or stem cell maintenance (Gregory
et al., 2008). A proliferative function for JAK/ STAT was suggested by early studies of tissue growth
during disc development (Bach et al., 2003, Tsai and Sun, 2004, Mukherjee et al., 2005).
Subsequently, JAK/STAT has been widely implicated in promoting proliferation of neoplastic cells
(Classen et al., 2009, Wu et al., 2010, Davie et al., 2015, Bunker et al., 2015, Amoyel et al., 2014)
and aberrant non-autonomous proliferation of wild type cells in fly models of tumorigenesis (Vaccari
and Bilder, 2005, Herz et al., 2006, Moberg et al., 2005). Activation of upd transcription upon tissue
damage has been linked to compensatory proliferation in imaginal discs and adult guts (Jiang et al.,
2009, Pastor-Pareja et al., 2008, Katsuyama et al., 2015, Wu et al., 2010, Lin et al., 2009, Bunker et
al., 2015, Santabarbara-Ruiz et al., 2015). Other studies suggest that JAK/STAT is involved in cell
competition, where signalling either promotes winner cell state (Schroeder et al., 2013, Rodrigues et
al., 2012) or compensatory proliferation in response to looser cell elimination (Kolahgar et al., 2015).
Dev
elo
pmen
t • A
dvan
ce a
rtic
le

Despite this wealth of work, little is known about target genes mediating proliferative JAK/STAT
function. In fly tumours, STAT-responsive enhancers have been mapped (Davie et al., 2015), but only
few target genes regulating tissue size have been described (Tsai and Sun, 2004, Betz et al., 2008,
Hasan et al., 2015). However, several studies implicate that developmental functions of JAK/STAT
are mediated by the transcriptional repressors Chinmo (Flaherty et al., 2010), Zfh1 (Ohayon et al.,
2009, Leatherman and Dinardo, 2008) and Zfh2 (Perea et al., 2013, Guarner et al., 2014, Ayala-
Camargo et al., 2013).
We wanted to better understand the precise role of JAK/STAT in cellular adaptations to stress and to
gain a better insight into how JAK/STAT may regulate compensatory proliferation after tissue damage.
Because JAK/ STAT is required for regeneration in the grasshopper leg to the mouse liver (Yamada
et al., 1997, Bando et al., 2013, Cressman et al., 1996, Li et al., 2002, Wuestefeld et al., 2003, Zhao
et al., 2014), dissecting the function of this highly conserved pathway is essential for our
understanding of regenerative processes.
To achieve this, we employed an imaginal disc model of tissue stress, which utilizes ectopic
expression of the TNFα homologue Eiger (Smith-Bolton et al., 2009) (Fig. S1), triggering JNK
activation (Igaki and Miura, 2014, Andersen et al., 2015) and apoptosis (Fig.S1D-D’’’). Therefore, this
model has been previously employed to study tissue regeneration in response to local cell ablation
(Herrera et al., 2013, Smith-Bolton et al., 2009). Eiger-expression induces multiple hallmarks of local
and systemic stress responses, such as compensatory proliferation and dILP8-induced
developmental delay (Fig. S1E,G) (Smith-Bolton et al., 2009). Because Eiger induces tissue stress in
wild type discs, it represents an ideal model to distinguish JAK/STAT-functions in physiological stress
from secondary effects incurred by developmental patterning or tumorigenic models. Instead of
promoting compensatory proliferation, we found that JAK/STAT promotes survival of JNK-signalling
cells - thereby emerging as a central regulator of injury-induced apoptosis to restrain excessive tissue
damage and facilitate initiation of compensatory responses.
Results
Eiger-mediated JNK activation enables functional studies of JNK-dependent stress responses
We expressed Eiger under the control of rotund(rn)-GAL4, which drives expression in the wing disc
pouch, fated to give rise to the future wing blade. We induced eiger-expression on developmental day
7 and temporally limited UAS-eiger expression to 40 hours by using a temperature-sensitive GAL80-
repressor (Fig. S1A-C, Experimental Procedures). In agreement with previous studies (Herrera et al.,
2013, Smith-Bolton et al., 2009), we observed extensive cell ablation in discs (Fig. S1E-E’), which
gave rise to a 50% reduction in adult wing size (Fig. S1H). G-trace-lineage labelling (Evans et al.,
2009) of rnGAL4-expressing cells followed by FACS-analysis revealed that about 85% of rnGAL4-
Dev
elo
pmen
t • A
dvan
ce a
rtic
le

lineage cells were eliminated after 40 h of Eiger-stimulation (Fig.1A-A’, Fig. S2A-A’’). This correlated
with an induction of a 2-day developmental delay at the larval-pupal transition (Fig. S1G).
In agreement with Eiger triggering JNK activation (Igaki and Miura, 2014), we found that Eiger-
stimulated discs broadly activate the JNK-responsive TRE-reporter (Fig. 1C) (Chatterjee and
Bohmann, 2012). The TRE-reporter was specifically activated at the wound site, where reporter
activity is completely absent in control discs (Fig. 1B-C). Consistent with cell-non-autonomous
activation of JNK by Eiger (Perez-Garijo et al., 2013) and by tissue damage (Bosch et al., 2005,
Herrera et al., 2013, Wu et al., 2010), TRE activation extended beyond a G-trace-labelled domain, in
which eiger-expression was induced (Fig.1C, Fig. 2F). FACS-analysis demonstrated that while 4.5%
of cells in the disc belonged to the surviving rnGAL4-lineage, 29% of cells in the disc activated TRE-
GFP (Fig. S2A-A’, B-B’).
We first wanted to quantify cell proliferation in Eiger-stimulated discs near the wound site, as well as
in the whole disc between 0 h (R0) and 48 h (R48) into the recovery period after the end of cell
ablation (Fig. S1A, E-E’). We used image segmentation algorithm (Fiji) to specifically measure total
disc size, the size of the surviving rnGAL4-lineage labelled by G-trace, the number of mitotic cells
marked by phospho-histone 3 (pH3) or the number of cells in S-phase marked by BrdU-incorporation
(Fig. 1D-G, Fig. S1F). We found that at R0, G-trace-labelled cells in the pouch account for about 3%
of the total disc volume (Fig.1D). This is in close agreement with FACS measurements (4.5%, Fig.
S2A’), which also detect an additional subset of G-trace-labelled cells in the notum. This analysis
verified that volume quantifications of cell populations in Fiji accurately approximate cell counts. Our
analysis revealed a marked increase in cell proliferation between R0 and R24, both near the wound
site (Fig.1F) as well as in the entire disc (Fig.1G, Fig. S2E). Mitotic rates do not increase further
between R24 and R48 (Fig. 1F, G). When we quantified the volume of the total disc and that of the G-
trace-labelled population, we found that they increased in size by 36% and 126% respectively
(Fig.1D, E).
While cell ablation can be induced more efficiently by expression of pro-apoptotic transgenes, such as
UAS-reaper (Herrera et al., 2013), we did not observe broad activation of JNK in this context (Fig.
S2C,D). Because Eiger-stimulated discs displayed broad activation and provided genetic access to
JNK-signalling cells, we utilized expression of Eiger to investigate the role of JAK/STAT in JNK-
mediated responses to tissue stress.
JAK/STAT is activated in response to Eiger-induced tissue damage
To understand if JAK/STAT plays a role in imaginal disc regeneration, we analysed JAK/STAT activity
in response to eiger-expression. JAK/STAT activation can be visualized using the 10xSTAT-dGFP
reporter (Bach et al., 2007), which is almost undetectable in wild type discs (Fig. 2A). Analysis of the
10xSTAT-dGFP reporter revealed that JAK/STAT is upregulated in response to eiger-expression
Dev
elo
pmen
t • A
dvan
ce a
rtic
le

induced at day 5 or day 7 of development (Fig. 2B,C). Reporter activation can be also observed upon
reaper-expression, suggesting that stress induced by ectopic cell death is sufficient to cause
JAK/STAT activation (Fig. S3E). Importantly, in Eiger-stimulated discs, JAK/STAT activation was
detected beyond the pouch periphery and thus extended beyond JNK-domains marked by TRE-
activity (Fig. 2F). JAK/STAT signalling declined within the following 24 h suggesting that it is
downregulated after eiger-expression ceased (Fig. S3A-C compare to Fig. S3B’-C’). We furthermore
examined JAK/STAT activation when eiger was induced at later stages of development. Surprisingly,
JAK/STAT activity was almost undetectable when eiger was induced at day 8 (Fig. 2D, S3D-D’).
Unpaired-ligands are upregulated upon Eiger-induced tissue damage
Previous reports and our studies demonstrate that the JAK/STAT-ligands upd1, upd2 and upd3 are
transcriptionally upregulated in response to stress from physical injury (Katsuyama et al., 2015,
Pastor-Pareja et al., 2008) or tumorous growth (Wu et al., 2010, Bunker et al., 2015), indicating that
pathway upregulation may be driven by JNK-dependent upd transcription. We found that transcription
of upd’s is highly elevated in Eiger-stimulated discs, whereas dome, hop and Stat92E are not (Fig.
2E). Recapitulating the decline in 10xSTAT-dGFP activity in response to eiger-induction at day 8, upd
transcription was strongest at day 5 and day 7 but decreased by more than half when eiger was
induced at day 8 (Fig. 2E).
Loss of JAK/STAT activation at day 8 was not due to a decline in Eiger-mediated JNK-activation, as
TRE-activity was as strong on day 8 as on day 7 (Fig. S3F,G). This suggests that even though
JAK/STAT activation coincides with JNK-activity (Katsuyama et al., 2015, Pastor-Pareja et al., 2008),
JNK alone may not be sufficient to stimulate this pathway. This is supported by broader activation of
JAK/STAT compared to JNK (Fig. 2F). Strikingly, the failure to activate JAK/STAT at late
developmental stages correlated with a pronounced decline in the ability of larvae to induce a
developmental delay at the larval-pupal transition (Fig. S3H) and with a strong reduction in recovered
adult wing size (Fig. S3I). These correlations suggest that JAK/STAT maybe a crucial mediator of
JNK-induced compensatory responses in imaginal discs.
JAK/STAT activity is not required for compensatory proliferation
JAK/STAT has been reported to play a role in promoting cell proliferation in wild type (Bach et al.,
2003, Tsai and Sun, 2004, Mukherjee et al., 2005), tumorous (Classen et al., 2009, Wu et al., 2010,
Davie et al., 2015, Bunker et al., 2015, Amoyel et al., 2014) and surgically injured discs (Katsuyama
et al., 2015). To test whether JAK/STAT is generally required to drive compensatory proliferation, we
quantified mitotic events after Eiger-stimulation in discs with impaired JAK/STAT signalling. We
genetically reduced JAK/STAT activity by two approaches: (1) we reduced gene dosage of JAK/STAT
components in the entire animal by heterozygosity for domeG0441, hop34 and Stat92E 85C9 alleles or (2)
we interfered with JAK/STAT signalling exclusively in eiger-expressing cells through expression of
Dev
elo
pmen
t • A
dvan
ce a
rtic
le

RNAi constructs targeting JAK/STAT components (Fig. S5A), a dominant-negative dome (domeΔcyt) or
the inhibitor Socs36E under the control of rnGAL4-tubGAL80ts.
Strikingly, even though 50% of the tissue in Eiger-stimulated discs activated JAK/STAT (Fig.2 B,C),
discs heterozygous for domeG0441, hop34 and Stat92E 85C9 alleles did not show any evidence of a
reduction in mitotic events or total disc size (Fig. 3A-F). Instead, we observed a mild increase in Eiger-
stimulated discs heterozygous for hop34. These results were opposite to what we expected if
JAK/STAT regulated compensatory proliferation. We thus wanted to confirm these findings by
interfering with JAK/STAT specifically in Eiger-stimulated cells. Neither rnGAL4-driven co-expression
of dome RNAi, domeΔcyt nor Socs36E reduced the number of mitotic events within surviving eiger-
expressing cells (Fig. 3G-K). Instead, mitotic rates slightly increased, while remaining unchanged in
the rest of the disc (Fig. 3K, Fig. S4A, C). Importantly, effects on eiger-expressing cells co-expressing
transgenic constructs are strongest at R0 but decline as GAL4-activity decreased (Fig. 3K).
Combined, our results strongly argue against the previously assigned role of JAK/STAT in directly
promoting compensatory proliferation in response to stress.
JAK/STAT is required for survival of JNK-signalling cells
While total disc size of Eiger-stimulated discs was similar to discs with genetically impaired JAK/STAT
activity (Fig. 3F, Fig. S4D), we were surprised to notice that the number of G-trace labelled cells that
survived eiger-expression was dramatically reduced when JAK/STAT signalling was inhibited.
Specifically, we found that expression of dome RNAi, domeΔcyt or SOCS36E caused a 3-10 fold
reduction in the size of G-trace-labelled populations (Fig. 3L, S4B).
These observations suggested that more eiger-expressing cells die when JAK/STAT signalling is
impaired. Indeed, we observed a 2-fold increase in areas positive for activated Caspase-3 if
JAK/STAT activity was exclusively reduced in Eiger-expressing cells (Fig. 4A-E), and up to 10-fold
increase in Eiger-stimulated discs heterozygous for domeG0441, hop34 or Stat92E 85C9 (Fig. 4F-I). The
more pronounced effect observed for heterozygous tissues likely arises as a result of the tissue-wide
reduction of JAK/STAT activity in this background. Reduction is also achieved in domains, which
displayed JAK/STAT and JNK activation but are located outside of the rnGAL4-lineage (Fig. 1C, Fig.
2B-C, Fig. 2F). Importantly, genetic reduction of JAK/STAT in developing wild type discs under the
same conditions does not cause any elevation of apoptosis (Fig. S5B-E). Combined our data highlight
a specific role for JAK/STAT as an important mediator of cell survival specifically in JNK-signalling
cells.
Dev
elo
pmen
t • A
dvan
ce a
rtic
le

JAK/STAT activity suppresses activation of JNK-signalling
To understand how JAK/STAT may promote cell survival, we tested if genetically reducing JAK/STAT
activity causes further elevation of JNK, which could divert JNK-dependent compensatory responses
towards apoptosis. To this end, we monitored JNK-activity using TRE-reporters in eiger-expressing
discs heterozygous for domeG0441, hop34 and Stat92E 85C9 alleles. Our quantifications suggested that
after cell ablation, 14% of the wing pouch area activated the TRE-reporter (Fig. 4J, N). In Eiger-
stimulated discs heterozygous for domeG0441, hop34 and Stat92E 85C9 we observed a 2-3 fold increase
in the area positive for TRE-activation (Fig. 4K-N). These results indicate that reduction of JAK/STAT
signalling promotes non-autonomous expansion of JNK signalling beyond eiger-expressing cells and
that this may underlie the observed increase in apoptotic index in JAK/STAT-impaired, Eiger-
stimulated discs (Fig. 4A-I).
Our observations prompted two important predictions. First, broad activation of JNK in JAK/STAT
impaired discs suggested that JAK/STAT acts as a suppressor of JNK signalling. Repression of JNK
by JAK/STAT could either be mediated by direct transcriptional effects on JNK core components, or
indirectly, by suppression of apoptosis and prevention of Dronc-driven positive feedback-activation of
JNK. This mechanism would restrain cell-non-autonomous activation of JNK, excessive apoptosis and
tissue damage. A second prediction implies that interfering with JAK/STAT increases the extent of
tissue damage due to elevation of cell death. Thereby, the ability of discs to mount an appropriate
regenerative response is reduced as cells required to drive regenerative responses are eliminated by
excessive cell death.
A survival-promoting function of JAK/STAT is mediated by Zfh2
We did not find any evidence that negative JNK-regulators are transcriptionally activated by Stat92E.
We therefore wanted to understand if JAK/STAT may regulate cell survival by impinging on pro-
apoptotic JNK target genes rpr and hid that act in combination with grim as inhibitors of IAP (Inhibitor
of Apoptosis) proteins. To this end, we first performed a bioinformatic Clover analysis of the promoter
regions of rpr, hid and grim using highly stringent parameter selections (Frith et al., 2004). As
previously suggested (Shlevkov and Morata, 2012, Luo et al., 2007, Moreno et al., 2002), we
identified multiple AP-1-binding motifs associated with these loci (Fig. S7A, data not shown). In
agreement with studies on JNK-induced apoptosis (Shlevkov and Morata, 2012, Luo et al., 2007,
Moreno et al., 2002), we specifically observed induction of hid expression in Eiger-stimulated discs
(Fig. 5A). The mild increase in hid levels likely represents an underestimate because eiger-expressing
cells make up only 4.5% of the entire disc used for qRT-PCR analysis (Fig. S2A, A’). Eiger-expressing
discs heterozygous for Df(3L)H99, a deficiency removing rpr, hid and grim loci, displayed a
pronounced ‘undead cell’ phenotype (Fig. S6A,B) (Perez-Garijo et al., 2009, Martin et al., 2009,
Kondo et al., 2006), suggesting that upregulation of hid contributes to Eiger-mediated cell death.
Dev
elo
pmen
t • A
dvan
ce a
rtic
le

While one previous study reports Eiger-mediated induction of apoptosis to be independent of hid
activation (Igaki et al., 2002), we suggest that the small adult eye phenotype observed upon eiger co-
expression with the strong apoptosis inhibitor p35 is a consequence of epithelial tissue architecture
disruption rather than a failure to prevent Eiger-induced cell death (Fig. S6L). Combined, previous
reports and our results support the notion that induction of cell death in eiger-expressing discs is
specifically mediated by AP-1/JNK-dependent activation of hid.
Strikingly, our Clover analysis also revealed multiple, highly clustered mammalian ZEB1-binding
motifs the hid promoter (Fig. S7A) as well as in the promoter of the kay gene coding for the AP-1
component dFos (Fig. S7B). ZEB1-binding motifs localized to highly conserved DNA sequences as
shown by mVISTA analysis (Frazer et al., 2004, Bray et al., 2003) and to open chromatin regions,
likely representing regulatory elements, as demonstrated by overlays with previously published ATAC-
seq data sets (Fig. S7) (Davie et al., 2015). ZEB-proteins are homologous to Drosophila Zfh1 and
Zfh2 (Zinc-finger homeobox) proteins, which act as transcriptional repressors (Postigo et al., 1999,
Postigo and Dean, 1999). Both Zfh1 and Zfh2 were previously identified to be downstream effectors
of JAK/STAT (Leatherman and Dinardo, 2008, Ayala-Camargo et al., 2013). This is reflected by Zfh2-
expression mirroring JAK/STAT-activation patterns in developing wing discs (Fig. 5E) (Ayala-
Camargo et al., 2013) and a sufficiency of JAK/STAT to induce Zfh2 expression de novo (Fig. S6C,
D). We hypothesized that Drosophila ZEB-proteins could directly mediate repression of kay in Eiger-
stimulated discs (Fig. 5A), thereby restraining JNK-activation to promote cell survival. At the same
time, ZEB-proteins could compete with AP-1 for transcriptional repression of hid, thereby limiting AP-
1/Hid-induced apoptosis to promote cell survival. Indeed, in eiger-expressing discs heterozygous for
STAT92E85C9, the upstream regulator of Zfh-proteins, we observed strong upregulation of hid and kay
expression if compared to discs expressing eiger alone (Fig.5B).
To first understand if Zfh1 or Zfh2 expression was altered in tissue damage, we performed
immunofluorescence and qRT-PCR analysis on Eiger-stimulated discs. We found that levels of Zfh2,
but not of Zfh1, are elevated in response to eiger-expression (Fig. 5C-F). Zfh2 upregulation occurred
specifically in regions with high levels of JAK/STAT activation (compare Fig. 2B, C with Fig. 5F). In
addition, we found transcripts of zfh2 but not of zfh1 to be elevated (Fig. 5G). The observed mild
increase in zfh2 transcription represents a strong underestimate, as cell expressing zfh-2 de novo
make up only a small portion of entire imaginal discs used for qRT-PCR analysis. In agreement with
Zfh2 being a JAK/STAT effector, heterozygosity for STAT92E85C9 reduces Zfh2 expression in Eiger-
stimulated discs (Fig. S6E-G).
To test if Zfh2 in Eiger-stimulated discs may be required to promote JAK/STAT-dependent survival by
repressing hid and kay transcription, we performed genetic experiments to reduce or increase Zfh2
function. We found that expression of an RNAi construct targeting zfh2 (Fig. S6H) increased
apoptosis in eiger-expressing discs by almost 4-fold (Fig. 5H-J). In contrast, overexpression of UAS-
zfh2 strongly promoted survival of eiger-expressing cells and resulted in a 10-fold increase in the size
Dev
elo
pmen
t • A
dvan
ce a
rtic
le

of surviving rnGAL4-derived cell populations (Fig. 5K-M). While we found that Zfh1 levels were not
upregulated in response to Eiger-stimulation, overexpression of zfh1 promoted survival of eiger-
expressing cells as well, even phenocopying overexpression of the strong apoptosis inhibitor p35
(Fig. S6I-L). The survival-promoting function of either Zfh1 or Zfh2 suggests that both proteins can
induce potent survival signals in stressed tissues, similar to developmental contexts (Ohayon et al.,
2009, Guarner et al., 2014).
JAK/STAT activity prevents excessive tissue damage in response to tissue stress
We predicted that interfering with JAK/STAT signalling, and therefore with Zfh2 function, must
increase the extend of tissue damage incurred by Eiger due to elevation of cell death. Consistent with
these predictions we found that Eiger-stimulated discs with genetically reduced JAK/STAT activity
developed into significantly smaller adult wings (Fig. 6A, B). Expression of domeΔcyt, Socs36E or RNAi
constructs targeting multiple pathway components, including zfh2, as well as heterozygosity for
domeG0441, hop34 and Stat92E 85C9, caused a significant drop in adult wing size index by 30-90% (Fig.
6B). Importantly, genetic downregulation of JAK/STAT in wild type discs at day 7 does not cause a
comparable reduction in wing size (Fig. S8A), emphasizing that survival-promoting function of
JAK/STAT is specifically required during tissue stress responses.
Notably, rnGAL4-driven overexpression of upd1, upd2 or zfh2 in eiger-expressing cells did not
increase adult wing size (Fig. 6B). Extra Upd may not translate into JAK/STAT hyperactivation, due to
pathway saturation in eiger-expressing cells. While zfh2 overexpression promoted cell survival, it did
not rescue other defects such as loss of epithelial polarity (Fig. 5L), which interferes with wing
morphogenesis.
To test whether JAK/STAT was also required for stress responses induced by physical wounding, we
analysed adult wings that developed from discs of surgically pinched larvae (Pastor-Pareja et al.,
2008, Kashio et al., 2014). Reducing JAK/STAT function in the posterior compartment by expressing
an RNAi construct targeting hop caused a pronounced reduction in adult wing sizes developing from
discs, in which pinching had been targeted to the posterior compartment visualized by co-expression
of GFP (Fig. S8B). In contrast, no reduction in size of the posterior compartment was observed for
adult wings derived from undamaged control discs raised under the same conditions (not shown).
These data suggest that cellular responses to genetically or surgically induced damage critically rely
on JAK/STAT activation to facilitate restoration of normal tissue homeostasis. Combined, our results
strongly imply that a reduction in final tissue size upon JAK/STAT inhibition reflects an excessive loss
of tissue due to cell death rather than a failure of the tissue to undergo compensatory proliferation.
Dev
elo
pmen
t • A
dvan
ce a
rtic
le

JAK/STAT activity promotes efficient induction of compensatory responses
We wanted to investigate further if the observed reduction in adult wing sizes upon JAK/STAT
inhibition is exclusively caused by a loss of tissue to cell death or if other regenerative processes may
be disturbed. A process that contributes to successful tissue restoration is the induction of a dILP8-
dependent developmental delay at the larval-pupal transition, which extends the time available for
repair before metamorphosis (Colombani et al., 2012, Garelli et al., 2012). We found that interfering
with JAK/STAT in eiger-expressing cells also caused a profound reduction in developmental delays
induced by Eiger-stimulation (Fig. 6C).
To understand if altered dILP8-expression underlied this observation, we quantified expression of a
GFP-reporter driven from the endogenous dILP8 locus (Garelli et al., 2012). We found that the
reporter was strongly expressed in the pouch of Eiger-stimulated discs (Fig. S8C). In contrast,
interfering with JAK/STAT by expression of dome RNAi or domeΔcyt in eiger-expressing cells
significantly reduced the area of GFP-expression (Fig. 6D, Fig. S8D,E). This suggests that loss of
dILP8-expression, caused by impaired JAK/STAT in JNK-signalling cells, underlies the observed
failure to efficiently induce a developmental delay.
To test whether JAK/STAT signalling is sufficient to induce developmental delays, we expressed the
JAK/STAT-ligands Upd1 or Upd2 in wild type discs using MS1096-GAL4. However, no difference in
pupariation timing between upd-expressing and stage-matched wild type larvae was observed (Fig.
S8F). While a recent study links dILP8-expression to JAK/STAT signalling (Katsuyama et al., 2015),
our data implies that dILP8 is not a direct target gene of STAT92E. Instead we suggest that cells,
which normally express dILP8 in response to JNK activation are more likely to die when JAK/STAT
signalling is reduced, thereby preventing efficient expression of dILP8 and induction of a
developmental delay. The failure to induce this important systemic response reduces the time
available for repair and likely contributes to the decrease in recovered adult wing sizes we observed
upon genetic reduction of JAK/STAT signalling (Fig. 6B).
JAK/STAT regulates survival in a RasV12;scrib tumour model
To understand if JAK/STAT generally acts as a survival-promoting pathway in the context of tissue
stress, we revisited the role of JAK/STAT in established fly tumour models. Previous studies suggest
that activation of JAK/STAT drives tumorous overgrowth in discs mutant for tumour suppressor genes,
such as scribbled (scrib) or Psc-Su(z)2 (Wu et al., 2010, Classen et al., 2009). scrib cells, similar to
eiger-expressing cells, exhibit strong JNK-activation correlating with elevated transcription of upd
cytokines (Wu et al., 2010, Bunker et al., 2015, Leong et al., 2009, Brumby and Richardson, 2003).
While scrib cells have a growth disadvantage if surrounded by wild type cells, they efficiently
cooperate with oncogenic RasV12 to create invasive tumours in clonal assays (Brumby and
Dev
elo
pmen
t • A
dvan
ce a
rtic
le

Richardson, 2003, Wu et al., 2010). Larvae carrying MARCM-induced RasV12; scrib2 clones fail to
pupariate (Fig. 7M), a response linked to dILP8-activation correlating with tumour load (Garelli et al.,
2012). We found that RasV12; scrib2 clones covered about 47% of eye-antennal discs, compared to
19% for wild type clones (Fig. 7A, B, D). When we probed RasV12; scrib2 clones for activated Dcp-1,
we did not observe any difference in apoptotic patterns compared to wild type tissue (Fig. 7F, G).
When we completely removed JAK/STAT function in RasV12; scrib2 clones by homozygosity for a
Stat92E85C9 allele, RasV12; scrib2 clone size was reduced from 47% to 28% of the eye disc area (Fig.
7B-D). Comparison of cell division rates within RasV12; scrib2 and RasV12; scrib2, Stat92E85C9 clones did
not reveal any significant changes upon loss of JAK/STAT function (Fig. 7B’, C’, E). However, in
contrast to RasV12; scrib2 clones, RasV12; scrib2, Stat92E85C9 clones displayed a 4.3-fold increase in
areas of Dcp-1 activation (Fig. 7G, H, I), suggesting that increased cell death of Stat92E mutant cells
underlies the smaller sizes of RasV12; scrib2, Stat92E 85C9 clones (Fig. 7A-D). The reduction in RasV12;
scrib2, Stat92E 85C9 clone size reduced total tumour load and allowed a significant proportion of host
larvae to progress to pupal stages (Fig. 7M).
Strikingly, RasV12; scrib2 clones displayed ectopic activation of Zfh2 (Fig. 7J, K) but not of Zfh1 (not
shown), indicating activation of a JNK-JAK/STAT-Zfh2 stress module by neoplastic transformation.
Importantly, ectopic expression of Zfh2 was completely abolished within RasV12; scrib2, Stat92E 85C9
clones (Fig. 7L). These results support the notion that Zfh2 expression is regulated by JAK/STAT in
multiple contexts of cellular stress and that stress-dependent Zfh2 activation in imaginal discs directly
correlates with cell survival.
Combined, our results support a model in which cellular stress caused by genetic cell ablation,
physical wounding or tumorous growth drives activation of JAK/STAT to promote survival of JNK-
signalling cells. Activation of JAK/STAT signalling thereby facilitates the induction and execution of
local and systemic compensatory responses, rather than promoting compensatory cell proliferation
directly (Fig. 7N).
Discussion
JNK activation during tissue stress drives elimination of damaged cells by apoptosis (Bogoyevitch et
al., 2010, Chen, 2012, Shlevkov and Morata, 2012, Luo et al., 2007, Moreno et al., 2002) and
compensatory proliferation necessary to replace lost tissues (Bosch et al., 2005, Bergantinos et al.,
2010, Mattila et al., 2005, Ryoo et al., 2004, Sun and Irvine, 2011). Our work provides an answer to
the central question of how these Janus-faced responses can be balanced by JNK. We show that in
contrast to prevalent models, JAK/STAT signalling downstream of JNK does not promote
compensatory proliferation, but instead supports cell survival and thereby contributes to tissue growth
(Fig. 7N). The decision between JAK/STAT-dependent survival and JNK-induced apoptosis may
Dev
elo
pmen
t • A
dvan
ce a
rtic
le

depend on a relative cellular ratio between JAK/STAT and JNK signalling, which is determined by the
position of cells within respective signalling gradients (Fig. S9B, B’). As a consequence of its pro-
survival function, JAK/STAT indirectly supports regenerative growth by allowing JNK to initiate dILP8-
dependent developmental delays and, possibly, by facilitating Hippo/Yorkie-driven proliferation (Sun
and Irvine, 2014). In fact, JNK-dependent Yorkie activation (Sun and Irvine, 2011) may occur
independently of Jun/Fos-mediated transcription (Sun and Irvine, 2013), therefore JAK/STAT and
Zfh2-dependent repression of kay/fos could suppress induction of JNK-dependent apoptosis without
suppressing activation of Yorkie and thus of Hippo/Yorkie-driven compensatory proliferation.
Hippo/Yorkie signalling, in turn, may sustain unpaired-activation and JAK/STAT signalling (Staley and
Irvine, 2010, Bunker et al., 2015, Sarikaya and Extavour, 2015) even if JNK-signalling is low. This
signalling cross-talk would facilitate the stabilisation of a wound-proximal tissue domain supporting
compensatory survival and proliferation.
Our new interpretation of JAK/STAT in promoting cell survival in response to tissue damage and in
tumors can be reconciled with previous studies: JAK/STAT mutations frequently reduced tissue size.
This was interpreted as a reduction in growth (Classen et al., 2009, Wu et al., 2010, Mukherjee et al.,
2005, Amoyel et al., 2014), but we suggest it is a consequence of excessive cell death. Similarly, Upd
overexpression has been previously reported to drive cell proliferation (Bach et al., 2003, Classen et
al., 2009, Tsai and Sun, 2004). However, continuous overexpression of Upd can also induce
apoptosis (not shown) and, thus potentially also sustained JNK-dependent compensatory proliferation
driving tissue growth. So far, only isolated studies have implicated JAK/STAT in cell survival (Betz et
al., 2008, Hasan et al., 2015, Guarner et al., 2014, Ohayon et al., 2009). For example, the apoptosis
inhibitor dIAP has been suggested to be a positively regulated target of Stat92E protecting cells from
apoptosis (Betz et al., 2008, Hasan et al., 2015). We identify the JAK/STAT effector Zfh2 as a
potential repressor of kay and hid activity; a molecular pathway expected to restrain excessive JNK-
activity and induction of apoptosis (Fig. S9A). Similarly, Dpp/TGF-dependent repression of rpr by
Schnurri has been reported to prevent JNK-mediated apoptosis. Curiously, this occurs in contexts
where JNK function is required to mediate cell shape remodelling during development (Beira et al.,
2014) and therefore bears conceptual similarities to a model where JAK/STAT-dependent repression
of kay and hid prevents JNK-mediated apoptosis but not Hippo/Yorkie-dependent compensatory
proliferation. Our work does currently not address if JAK/STAT only promotes survival during stress or
also during development. Cells carrying JAK/STAT mutations are eliminated from developing wing
discs (Rodrigues et al., 2012) by a process called cell competition. However, in the light of recent
studies, which implicate JNK-signalling in competitive cell elimination (Kolahgar et al., 2015), more
studies are clearly needed to dissect the functional contribution of stress-signals in this context.
Combined, these studies and our work suggests that JNK-dependent apoptosis can be counteracted
by multiple molecular pathways impinging on anti- and pro-apoptotic genes.
While the role of mammalian IL-6/STAT3 in regeneration needs to be further investigated, many
evidences point to JNK and JAK/STAT pathways as crucial mediators of compensatory responses
Dev
elo
pmen
t • A
dvan
ce a
rtic
le

and tumorigenesis in mammalian tissues (Chen, 2012). A previous report suggests that JAK/STAT
activation during mouse liver regeneration potentially confers a cell-protective function; similarly
facilitating initiation of compensatory responses, rather then directly promoting cell proliferation
(Wuestefeld et al., 2003). Therefore, the dominant pro-survival function of JAK/STAT in response to
tissue stress, which we find to be essential for successful restoration of tissue homeostasis, appears
highly relevant to human contexts of cellular stress in physiological or pathological conditions.
Dev
elo
pmen
t • A
dvan
ce a
rtic
le

Experimental procedures
Drosophila stocks
For detailed genotypes please refer to Supplementary Table 1. For temporal and spatial control of
Eiger-expression please refer to Fig. S1, Supplementary procedures and (Smith-Bolton et al., 2009).
Immunohistochemistry
Larval cuticles were fixed in 4% PFA/PBS for 15 min at room temperature. Washing steps were
performed in 0.1% Triton X-100/PBS (PBT), blocking in 5% NGS/PBT. Primary antibodies were
incubated overnight at 4°C: mouse α-Nub (1:100, S.Cohen), rabbit α-GFP (1:1000, Immunokontakt),
mouse α-H3S10p (1:2000, Abcam), rabbit α-cCasp-3 (1:500, Cell Signaling), rabbit α-Dcp1 (1:500,
Cell Signaling), rabbit α-βGal (1:500, Capell), rat α-Zfh1 (1:500, R.Lehmann), rat α-Zfh2 (1:300,
C.Doe). Secondary antibodies (Molecular Probes), DAPI and phalloidin-TRITC (Sigma) were
incubated for 2 h at room temperature. Reference and experimental samples were processed
together and imaged using the same settings (Leica TCS-SP5). Images were analysed using FIJI
(ImageJ v1.47) (see Supplement).
Real-time qPCR
RNA was extracted from ca. 80 wing disc using Qiagen RNAlater and RNeasy protocols. cDNA
libraries were prepared using standard protocols including Ambion TurboDNase and Invitrogen
Superscript III kits. qPCR was performed using Fast SYBR Green (Applied Biosystems) on a CFX-96
Real-Time machine (BioRad). Data was analysed using the ΔΔCt method and normalized to at least
two housekeeping genes (Supplementary Table S2).
Adult wings size analysis
Wing size index (Ws) is calculated as average of five different wing phenotypes (w) (Fig. 5A) weighted
with the frequencies at which they occurred (f) (Ws = Σwi×fi / Σfi). Samples were compared in a paired
manner to control wings from the same experimental replicate (Wilcoxon signed rank test, α=0.05, n ≥
3 sample populations).
D
evel
opm
ent •
Adv
ance
art
icle

Acknowledgements
We thank R. Smith-Bolton, D. Bohmann, E. Bach, G. Halder, S. Cohen, R. Lehmann, C. Doe, E.
Sanchez-Herrero, F. Diaz-Benjumea, N. Gompel and H. Leonhardt for sharing reagents and
resources. We thank Bloomington and VDRC for fly stocks, and DSHB for antibodies. We thank the
LSM, IMPRS-LS and IRTG-SFB1064 graduate schools for supporting our students.
Dev
elo
pmen
t • A
dvan
ce a
rtic
le
References
AMOYEL, M., ANDERSON, A. M. & BACH, E. A. 2014. JAK/STAT pathway dysregulation in tumors: a Drosophila perspective. Semin Cell Dev Biol, 28, 96-103.
ANDERSEN, D. S., COLOMBANI, J., PALMERINI, V., CHAKRABANDHU, K., BOONE, E., ROTHLISBERGER, M., TOGGWEILER, J., BASLER, K., MAPELLI, M., HUEBER, A. O. & LEOPOLD, P. 2015. The Drosophila TNF receptor Grindelwald couples loss of cell polarity and neoplastic growth. Nature, 522, 482-6.
ARBOUZOVA, N. I. & ZEIDLER, M. P. 2006. JAK/STAT signalling in Drosophila: insights into conserved regulatory and cellular functions. Development, 133, 2605-16.
AYALA-CAMARGO, A., ANDERSON, A. M., AMOYEL, M., RODRIGUES, A. B., FLAHERTY, M. S. & BACH, E. A. 2013. JAK/STAT signaling is required for hinge growth and patterning in the Drosophila wing disc. Dev Biol, 382, 413-26.
AYALA-CAMARGO, A., EKAS, L. A., FLAHERTY, M. S., BAEG, G. H. & BACH, E. A. 2007. The JAK/STAT pathway regulates proximo-distal patterning in Drosophila. Dev Dyn, 236, 2721-30.
BACH, E. A., EKAS, L. A., AYALA-CAMARGO, A., FLAHERTY, M. S., LEE, H., PERRIMON, N. & BAEG, G. H. 2007. GFP reporters detect the activation of the Drosophila JAK/STAT pathway in vivo. Gene Expr Patterns, 7, 323-31.
BACH, E. A., VINCENT, S., ZEIDLER, M. P. & PERRIMON, N. 2003. A sensitized genetic screen to identify novel regulators and components of the Drosophila janus kinase/signal transducer and activator of transcription pathway. Genetics, 165, 1149-66.
BANDO, T., ISHIMARU, Y., KIDA, T., HAMADA, Y., MATSUOKA, Y., NAKAMURA, T., OHUCHI, H., NOJI, S. & MITO, T. 2013. Analysis of RNA-Seq data reveals involvement of JAK/STAT signalling during leg regeneration in the cricket Gryllus bimaculatus. Development, 140, 959-64.
BEIRA, J. V., SPRINGHORN, A., GUNTHER, S., HUFNAGEL, L., PYROWOLAKIS, G. & VINCENT, J. P. 2014. The Dpp/TGFbeta-dependent corepressor Schnurri protects epithelial cells from JNK-induced apoptosis in drosophila embryos. Dev Cell, 31, 240-7.
BERGANTINOS, C., COROMINAS, M. & SERRAS, F. 2010. Cell death-induced regeneration in wing imaginal discs requires JNK signalling. Development, 137, 1169-79.
BETZ, A., RYOO, H. D., STELLER, H. & DARNELL, J. E., JR. 2008. STAT92E is a positive regulator of Drosophila inhibitor of apoptosis 1 (DIAP/1) and protects against radiation-induced apoptosis. Proc Natl Acad Sci U S A, 105, 13805-10.
BOGOYEVITCH, M. A., NGOEI, K. R., ZHAO, T. T., YEAP, Y. Y. & NG, D. C. 2010. c-Jun N-terminal kinase (JNK) signaling: recent advances and challenges. Biochim Biophys Acta, 1804, 463-75.
BOSCH, M., BAGUNA, J. & SERRAS, F. 2008. Origin and proliferation of blastema cells during regeneration of Drosophila wing imaginal discs. Int J Dev Biol, 52, 1043-50.
BOSCH, M., SERRAS, F., MARTIN-BLANCO, E. & BAGUNA, J. 2005. JNK signaling pathway required for wound healing in regenerating Drosophila wing imaginal discs. Dev Biol, 280, 73-86.
Dev
elo
pmen
t • A
dvan
ce a
rtic
le
BRAY, N., DUBCHAK, I. & PACHTER, L. 2003. AVID: A global alignment program. Genome Res, 13, 97-102.
BRUMBY, A. M. & RICHARDSON, H. E. 2003. scribble mutants cooperate with oncogenic Ras or Notch to cause neoplastic overgrowth in Drosophila. Embo J, 22, 5769-79.
BRYANT, P. J. 1975. Regeneration and duplication in imaginal discs. Ciba Found Symp, 0, 71-93.
BUNKER, B. D., NELLIMOOTTIL, T. T., BOILEAU, R. M., CLASSEN, A. K. & BILDER, D. 2015. The transcriptional response to tumorigenic polarity loss in Drosophila. Elife, 4.
CHATTERJEE, N. & BOHMANN, D. 2012. A versatile PhiC31 based reporter system for measuring AP-1 and Nrf2 signaling in Drosophila and in tissue culture. PLoS One, 7, e34063.
CHEN, F. 2012. JNK-induced apoptosis, compensatory growth, and cancer stem cells. Cancer Res, 72, 379-86.
CLASSEN, A. K., BUNKER, B. D., HARVEY, K. F., VACCARI, T. & BILDER, D. 2009. A tumor suppressor activity of Drosophila Polycomb genes mediated by JAK-STAT signaling. Nat Genet, 41, 1150-5.
COLOMBANI, J., ANDERSEN, D. S. & LEOPOLD, P. 2012. Secreted peptide Dilp8 coordinates Drosophila tissue growth with developmental timing. Science, 336, 582-5.
CRESSMAN, D., GREENBAUM, L., DEANGELIS, R., CILIBERTO, G., FURTH, E., POLI, V. & R, T. 1996. Liver failure and defective hepatocyte regeneration in interleukin-6-deficient mice. Science, 274, 1379-83.
DAVIE, K., JACOBS, J., ATKINS, M., POTIER, D., CHRISTIAENS, V., HALDER, G. & AERTS, S. 2015. Discovery of Transcription Factors and Regulatory Regions Driving In Vivo Tumor Development by ATAC-seq and FAIRE-seq Open Chromatin Profiling. PLoS Genet, 11, e1004994.
EFERL, R. & WAGNER, E. F. 2003. AP-1: a double-edged sword in tumorigenesis. Nat Rev Cancer, 3, 859-68.
EVANS, C. J., OLSON, J. M., NGO, K. T., KIM, E., LEE, N. E., KUOY, E., PATANANAN, A. N., SITZ, D., TRAN, P., DO, M. T., YACKLE, K., CESPEDES, A., HARTENSTEIN, V., CALL, G. B. & BANERJEE, U. 2009. G-TRACE: rapid Gal4-based cell lineage analysis in Drosophila. Nat Methods, 6, 603-5.
FAN, Y. & BERGMANN, A. 2008. Distinct mechanisms of apoptosis-induced compensatory proliferation in proliferating and differentiating tissues in the Drosophila eye. Dev Cell, 14, 399-410.
FLAHERTY, M. S., SALIS, P., EVANS, C. J., EKAS, L. A., MAROUF, A., ZAVADIL, J., BANERJEE, U. & BACH, E. A. 2010. chinmo is a functional effector of the JAK/STAT pathway that regulates eye development, tumor formation, and stem cell self-renewal in Drosophila. Dev Cell, 18, 556-68.
FRAZER, K. A., PACHTER, L., POLIAKOV, A., RUBIN, E. M. & DUBCHAK, I. 2004. VISTA: computational tools for comparative genomics. Nucleic Acids Res, 32, W273-9.
FRITH, M. C., FU, Y., YU, L., CHEN, J. F., HANSEN, U. & WENG, Z. 2004. Detection of functional DNA motifs via statistical over-representation. Nucleic Acids Res, 32, 1372-81.
Dev
elo
pmen
t • A
dvan
ce a
rtic
le

FULDA, S., GORMAN, A. M., HORI, O. & SAMALI, A. 2010. Cellular stress responses: cell survival and cell death. Int J Cell Biol, 2010, 214074.
GARELLI, A., GONTIJO, A. M., MIGUELA, V., CAPARROS, E. & DOMINGUEZ, M. 2012. Imaginal discs secrete insulin-like peptide 8 to mediate plasticity of growth and maturation. Science, 336, 579-82.
GREGORY, L., CAME, P. J. & BROWN, S. 2008. Stem cell regulation by JAK/STAT signaling in Drosophila. Semin Cell Dev Biol, 19, 407-13.
GRUSCHE, F. A., DEGOUTIN, J. L., RICHARDSON, H. E. & HARVEY, K. F. 2011. The Salvador/Warts/Hippo pathway controls regenerative tissue growth in Drosophila melanogaster. Dev Biol, 350, 255-66.
GUARNER, A., MANJON, C., EDWARDS, K., STELLER, H., SUZANNE, M. & SANCHEZ-HERRERO, E. 2014. The zinc finger homeodomain-2 gene of Drosophila controls Notch targets and regulates apoptosis in the tarsal segments. Dev Biol, 385, 350-65.
HASAN, S., HETIE, P. & MATUNIS, E. L. 2015. Niche signaling promotes stem cell survival in the Drosophila testis via the JAK-STAT target DIAP1. Dev Biol, 404, 27-39.
HAYNIE, J. L. & BRYANT, P. J. 1976. Intercalary regeneration in imaginal wing disk of Drosophila melanogaster. Nature, 259, 659-62.
HERRERA, S. C., MARTIN, R. & MORATA, G. 2013. Tissue homeostasis in the wing disc of Drosophila melanogaster: immediate response to massive damage during development. PLoS Genet, 9, e1003446.
HERRERA, S. C. & MORATA, G. 2014. Transgressions of compartment boundaries and cell reprogramming during regeneration in Drosophila. Elife, 3, e01831.
HERZ, H. M., CHEN, Z., SCHERR, H., LACKEY, M., BOLDUC, C. & BERGMANN, A. 2006. vps25 mosaics display non-autonomous cell survival and overgrowth, and autonomous apoptosis. Development, 133, 1871-80.
HUH, J. R., GUO, M. & HAY, B. A. 2004. Compensatory proliferation induced by cell death in the Drosophila wing disc requires activity of the apical cell death caspase Dronc in a nonapoptotic role. Curr Biol, 14, 1262-6.
IGAKI, T. 2009. Correcting developmental errors by apoptosis: lessons from Drosophila JNK signaling. Apoptosis, 14, 1021-8.
IGAKI, T., KANDA, H., YAMAMOTO-GOTO, Y., KANUKA, H., KURANAGA, E., AIGAKI, T. & MIURA, M. 2002. Eiger, a TNF superfamily ligand that triggers the Drosophila JNK pathway. EMBO J, 21, 3009-18.
IGAKI, T. & MIURA, M. 2014. The Drosophila TNF ortholog Eiger: emerging physiological roles and evolution of the TNF system. Semin Immunol, 26, 267-74.
JIANG, H., PATEL, P. H., KOHLMAIER, A., GRENLEY, M. O., MCEWEN, D. G. & EDGAR, B. A. 2009. Cytokine/Jak/Stat signaling mediates regeneration and homeostasis in the Drosophila midgut. Cell, 137, 1343-55.
Dev
elo
pmen
t • A
dvan
ce a
rtic
le

JOHNSTONE, K., WELLS, R. E., STRUTT, D. & ZEIDLER, M. P. 2013. Localised JAK/STAT pathway activation is required for Drosophila wing hinge development. PLoS One, 8, e65076.
KASHIO, S., OBATA, F. & MIURA, M. 2014. Interplay of cell proliferation and cell death in Drosophila tissue regeneration. Dev Growth Differ, 56, 368-75.
KATSUYAMA, T., COMOGLIO, F., SEIMIYA, M., CABUY, E. & PARO, R. 2015. During Drosophila disc regeneration, JAK/STAT coordinates cell proliferation with Dilp8-mediated developmental delay. Proc Natl Acad Sci U S A, 112, E2327-36.
KOLAHGAR, G., SUIJKERBUIJK, S. J., KUCINSKI, I., POIRIER, E. Z., MANSOUR, S., SIMONS, B. D. & PIDDINI, E. 2015. Cell Competition Modifies Adult Stem Cell and Tissue Population Dynamics in a JAK-STAT-Dependent Manner. Dev Cell.
KONDO, S., SENOO-MATSUDA, N., HIROMI, Y. & MIURA, M. 2006. DRONC coordinates cell death and compensatory proliferation. Mol Cell Biol, 26, 7258-68.
LEATHERMAN, J. L. & DINARDO, S. 2008. Zfh-1 controls somatic stem cell self-renewal in the Drosophila testis and nonautonomously influences germline stem cell self-renewal. Cell Stem Cell, 3, 44-54.
LEE, N., MAURANGE, C., RINGROSE, L. & PARO, R. 2005. Suppression of Polycomb group proteins by JNK signalling induces transdetermination in Drosophila imaginal discs. Nature, 438, 234-7.
LEONG, G. R., GOULDING, K. R., AMIN, N., RICHARDSON, H. E. & BRUMBY, A. M. 2009. Scribble mutants promote aPKC and JNK-dependent epithelial neoplasia independently of Crumbs. BMC Biol, 7, 62.
LI, W., LIANG, X., KELLENDONK, C., POLI, V. & TAUB, R. 2002. STAT3 contributes to the mitogenic response of hepatocytes during liver regeneration. J Biol Chem, 277, 28411-7.
LIN, G., XU, N. & XI, R. 2009. Paracrine Unpaired Signaling through the JAK/STAT Pathway Controls Self-renewal and Lineage Differentiation of Drosophila Intestinal Stem Cells. J Mol Cell Biol.
LUO, X., PUIG, O., HYUN, J., BOHMANN, D. & JASPER, H. 2007. Foxo and Fos regulate the decision between cell death and survival in response to UV irradiation. Embo J, 26, 380-90.
MARTIN, F. A., PEREZ-GARIJO, A. & MORATA, G. 2009. Apoptosis in Drosophila: compensatory proliferation and undead cells. Int J Dev Biol, 53, 1341-7.
MATTILA, J., OMELYANCHUK, L., KYTTALA, S., TURUNEN, H. & NOKKALA, S. 2005. Role of Jun N-terminal Kinase (JNK) signaling in the wound healing and regeneration of a Drosophila melanogaster wing imaginal disc. Int J Dev Biol, 49, 391-9.
MOBERG, K. H., SCHELBLE, S., BURDICK, S. K. & HARIHARAN, I. K. 2005. Mutations in erupted, the Drosophila ortholog of mammalian tumor susceptibility gene 101, elicit non-cell-autonomous overgrowth. Dev Cell, 9, 699-710.
MORATA, G., SHLEVKOV, E. & PEREZ-GARIJO, A. 2011. Mitogenic signaling from apoptotic cells in Drosophila. Dev Growth Differ, 53, 168-76.
Dev
elo
pmen
t • A
dvan
ce a
rtic
le

MORENO, E., YAN, M. & BASLER, K. 2002. Evolution of TNF signaling mechanisms: JNK-dependent apoptosis triggered by Eiger, the Drosophila homolog of the TNF superfamily. Curr Biol, 12, 1263-8.
MUKHERJEE, T., HOMBRIA, J. C. & ZEIDLER, M. P. 2005. Opposing roles for Drosophila JAK/STAT signalling during cellular proliferation. Oncogene, 24, 2503-11.
MYLLYMAKI, H. & RAMET, M. 2014. JAK/STAT pathway in Drosophila immunity. Scand J Immunol, 79, 377-85.
OHAYON, D., PATTYN, A., VENTEO, S., VALMIER, J., CARROLL, P. & GARCES, A. 2009. Zfh1 promotes survival of a peripheral glia subtype by antagonizing a Jun N-terminal kinase-dependent apoptotic pathway. EMBO J, 28, 3228-43.
OHLSTEIN, B. & SPRADLING, A. 2006. The adult Drosophila posterior midgut is maintained by pluripotent stem cells. Nature, 439, 470-4.
OSMAN, D., BUCHON, N., CHAKRABARTI, S., HUANG, Y. T., SU, W. C., POIDEVIN, M., TSAI, Y. C. & LEMAITRE, B. 2012. Autocrine and paracrine unpaired signaling regulate intestinal stem cell maintenance and division. J Cell Sci, 125, 5944-9.
PAHLAVAN, P. S., FELDMANN, R. E., JR., ZAVOS, C. & KOUNTOURAS, J. 2006. Prometheus' challenge: molecular, cellular and systemic aspects of liver regeneration. J Surg Res, 134, 238-51.
PASTOR-PAREJA, J. C., WU, M. & XU, T. 2008. An innate immune response of blood cells to tumors and tissue damage in Drosophila. Dis Model Mech, 1, 144-54; discussion 153.
PASTOR-PAREJA, J. C. & XU, T. 2013. Dissecting social cell biology and tumors using Drosophila genetics. Annu Rev Genet, 47, 51-74.
PEREA, D., MOLOHON, K., EDWARDS, K. & DIAZ-BENJUMEA, F. J. 2013. Multiple roles of the gene zinc finger homeodomain-2 in the development of the Drosophila wing. Mech Dev, 130, 467-81.
PEREZ-GARIJO, A., FUCHS, Y. & STELLER, H. 2013. Apoptotic cells can induce non-autonomous apoptosis through the TNF pathway. Elife, 2, e01004.
PEREZ-GARIJO, A., MARTIN, F. A. & MORATA, G. 2004. Caspase inhibition during apoptosis causes abnormal signalling and developmental aberrations in Drosophila. Development, 131, 5591-8.
PEREZ-GARIJO, A., SHLEVKOV, E. & MORATA, G. 2009. The role of Dpp and Wg in compensatory proliferation and in the formation of hyperplastic overgrowths caused by apoptotic cells in the Drosophila wing disc. Development, 136, 1169-77.
POSTIGO, A. A. & DEAN, D. C. 1999. Independent repressor domains in ZEB regulate muscle and T-cell differentiation. Mol Cell Biol, 19, 7961-71.
POSTIGO, A. A., WARD, E., SKEATH, J. B. & DEAN, D. C. 1999. zfh-1, the Drosophila homologue of ZEB, is a transcriptional repressor that regulates somatic myogenesis. Mol Cell Biol, 19, 7255-63.
RAMET, M., LANOT, R., ZACHARY, D. & MANFRUELLI, P. 2002. JNK signaling pathway is required for efficient wound healing in Drosophila. Developmental biology, 241, 145-56.
Dev
elo
pmen
t • A
dvan
ce a
rtic
le

RAZZELL, W., WOOD, W. & MARTIN, P. 2011. Swatting flies: modelling wound healing and inflammation in Drosophila. Dis Model Mech, 4, 569-74.
REPISO, A., BERGANTINOS, C. & SERRAS, F. 2013. Cell fate respecification and cell division orientation drive intercalary regeneration in Drosophila wing discs. Development, 140, 3541-51.
RIOS-BARRERA, L. D. & RIESGO-ESCOVAR, J. R. 2013. Regulating cell morphogenesis: the Drosophila Jun N-terminal kinase pathway. Genesis, 51, 147-62.
RODRIGUES, A. B., ZORANOVIC, T., AYALA-CAMARGO, A., GREWAL, S., REYES-ROBLES, T., KRASNY, M., WU, D. C., JOHNSTON, L. A. & BACH, E. A. 2012. Activated STAT regulates growth and induces competitive interactions independently of Myc, Yorkie, Wingless and ribosome biogenesis. Development, 139, 4051-61.
RYOO, H. D., GORENC, T. & STELLER, H. 2004. Apoptotic cells can induce compensatory cell proliferation through the JNK and the Wingless signaling pathways. Dev Cell, 7, 491-501.
SANTABARBARA-RUIZ, P., LOPEZ-SANTILLAN, M., MARTINEZ-RODRIGUEZ, I., BINAGUI-CASAS, A., PEREZ, L., MILAN, M., COROMINAS, M. & SERRAS, F. 2015. ROS-Induced JNK and p38 Signaling Is Required for Unpaired Cytokine Activation during Drosophila Regeneration. PLoS Genet, 11, e1005595.
SARIKAYA, D. P. & EXTAVOUR, C. G. 2015. The Hippo pathway regulates homeostatic growth of stem cell niche precursors in the Drosophila ovary. PLoS Genet, 11, e1004962.
SCHROEDER, M. C., CHEN, C. L., GAJEWSKI, K. & HALDER, G. 2013. A non-cell-autonomous tumor suppressor role for Stat in eliminating oncogenic scribble cells. Oncogene, 32, 4471-9.
SCHUSTER, K. J. & SMITH-BOLTON, R. K. 2015. Taranis Protects Regenerating Tissue from Fate Changes Induced by the Wound Response in Drosophila. Dev Cell, 34, 119-28.
SHLEVKOV, E. & MORATA, G. 2012. A dp53/JNK-dependant feedback amplification loop is essential for the apoptotic response to stress in Drosophila. Cell Death Differ, 19, 451-60.
SMITH-BOLTON, R. K., WORLEY, M. I., KANDA, H. & HARIHARAN, I. K. 2009. Regenerative growth in Drosophila imaginal discs is regulated by Wingless and Myc. Dev Cell, 16, 797-809.
STALEY, B. K. & IRVINE, K. D. 2010. Warts and Yorkie mediate intestinal regeneration by influencing stem cell proliferation. Curr Biol, 20, 1580-7.
SUN, G. & IRVINE, K. D. 2011. Regulation of Hippo signaling by Jun kinase signaling during compensatory cell proliferation and regeneration, and in neoplastic tumors. Dev Biol, 350, 139-51.
SUN, G. & IRVINE, K. D. 2013. Ajuba family proteins link JNK to Hippo signaling. Sci Signal, 6, ra81.
SUN, G. & IRVINE, K. D. 2014. Control of growth during regeneration. Curr Top Dev Biol, 108, 95-120.
SUSTAR, A., BONVIN, M., SCHUBIGER, M. & SCHUBIGER, G. 2011. Drosophila twin spot clones reveal cell division dynamics in regenerating imaginal discs. Dev Biol, 356, 576-87.
Dev
elo
pmen
t • A
dvan
ce a
rtic
le

TSAI, Y. C. & SUN, Y. H. 2004. Long-range effect of upd, a ligand for Jak/STAT pathway, on cell cycle in Drosophila eye development. Genesis, 39, 141-53.
UHLIROVA, M., JASPER, H. & BOHMANN, D. 2005. Non-cell-autonomous induction of tissue overgrowth by JNK/Ras cooperation in a Drosophila tumor model. Proc Natl Acad Sci U S A, 102, 13123-8.
VACCARI, T. & BILDER, D. 2005. The Drosophila tumor suppressor vps25 prevents nonautonomous overproliferation by regulating notch trafficking. Dev Cell, 9, 687-98.
WELLS, B. S., YOSHIDA, E. & JOHNSTON, L. A. 2006. Compensatory proliferation in Drosophila imaginal discs requires Dronc-dependent p53 activity. Curr Biol, 16, 1606-15.
WU, M., PASTOR-PAREJA, J. C. & XU, T. 2010. Interaction between Ras(V12) and scribbled clones induces tumour growth and invasion. Nature, 463, 545-8.
WUESTEFELD, T., KLEIN, C., STREETZ, K. L., BETZ, U., LAUBER, J., BUER, J., MANNS, M. P., MULLER, W. & TRAUTWEIN, C. 2003. Interleukin-6/glycoprotein 130-dependent pathways are protective during liver regeneration. J Biol Chem, 278, 11281-8.
YAMADA, Y., KIRILLOVA, I., PESCHON, J. J. & FAUSTO, N. 1997. Initiation of liver growth by tumor necrosis factor: deficient liver regeneration in mice lacking type I tumor necrosis factor receptor. Proc Natl Acad Sci U S A, 94, 1441-6.
ZHAO, X. F., WAN, J., POWELL, C., RAMACHANDRAN, R., MYERS, M. G., JR. & GOLDMAN, D. 2014. Leptin and IL-6 family cytokines synergize to stimulate Muller glia reprogramming and retina regeneration. Cell Rep, 9, 272-84.
ZHU, M., XIN, T., WENG, S., GAO, Y., ZHANG, Y., LI, Q. & LI, M. 2010. Activation of JNK signaling links lgl mutations to disruption of the cell polarity and epithelial organization in Drosophila imaginal discs. Cell Res, 20, 242-5.
Dev
elo
pmen
t • A
dvan
ce a
rtic
le

Figures
Figure 1.
Eiger-expression enables functional studies of JNK stress responses
(A) G-trace labelling (cyan) visualizes the rotund(rn)GAL4 cell-lineage in wing discs. (A’) Progeny of
rnGAL4, G-trace-labelled cells (cyan, actin in red) after 40 h of Eiger-mediated cell ablation (CA) at
recovery points R0, R24, R48 hours.
(B) Wing pouch expressing the JNK-reporter TRE-GFP (red in overlay), stained for DAPI, and Nubbin
(cyan in overlay) visualizing a lineage similar to rnGAL4-derived cells.
(C) Wing pouch after cell ablation (CA) expressing TRE-RFP (red in overlay) containing rnGAL4, G-
trace-labelled cells (cyan in overlay) stained for DAPI.
(D) Volume occupied by rnGAL4, G-trace-labelled cells and (E) total wing disc volumes at recovery
time points R0, R24 and R48.
(F) Normalized pH3-positive, mitotic events within rnGAL4, G-trace-labelled volume and (G) within
total disc volumes at R0, R24, R48.
Graphs display mean ± S.E.M for R0 n=16, R24 n=12, R48 =13 discs. U-tests were performed to test
for statistical significance (* p<0.05, ** p<0.01, *** p<0.001).
All scale bars: 100 µm.
Dev
elo
pmen
t • A
dvan
ce a
rtic
le

Figure 2.
JAK/STAT is activated in response to tissue damage
(A) Wing disc expressing the JAK/STAT-reporter 10XSTAT-dGFP (cyan in overlay) stained for DAPI
and Actin (red in overlay).
(B-D) Wing pouch after cell ablation (CA) induced at day 5 (B), day 7 (C) or day 8 (D). Discs were
stained for DAPI, Actin (red in overlay) and express 10XSTAT-dGFP (cyan in overlay).
(E) qRT-PCR analysis of upd1, upd2, upd3, dome, hop and Stat92E transcripts after cell ablation (CA)
induced at day 5, day 7 or day 8. Fold-induction relative to unablated controls is reported. Graphs
display mean ± S.E.M for n≥3 biological replicates.
(F) Fluorescence intensity of rnGAL4, G-trace (n=5 discs), TRE-RFP (n=6 discs) and 10XSTAT-dGFP
(n=12 discs) reporter signals at R0. Intensity plots were scaled to maximum measured values;
interpolated averages are reported as function of relative positions between pouch centre and disc
edge. Graphs display interpolated mean ± S.E.M.
All scale bars: 100 µm.
Dev
elo
pmen
t • A
dvan
ce a
rtic
le
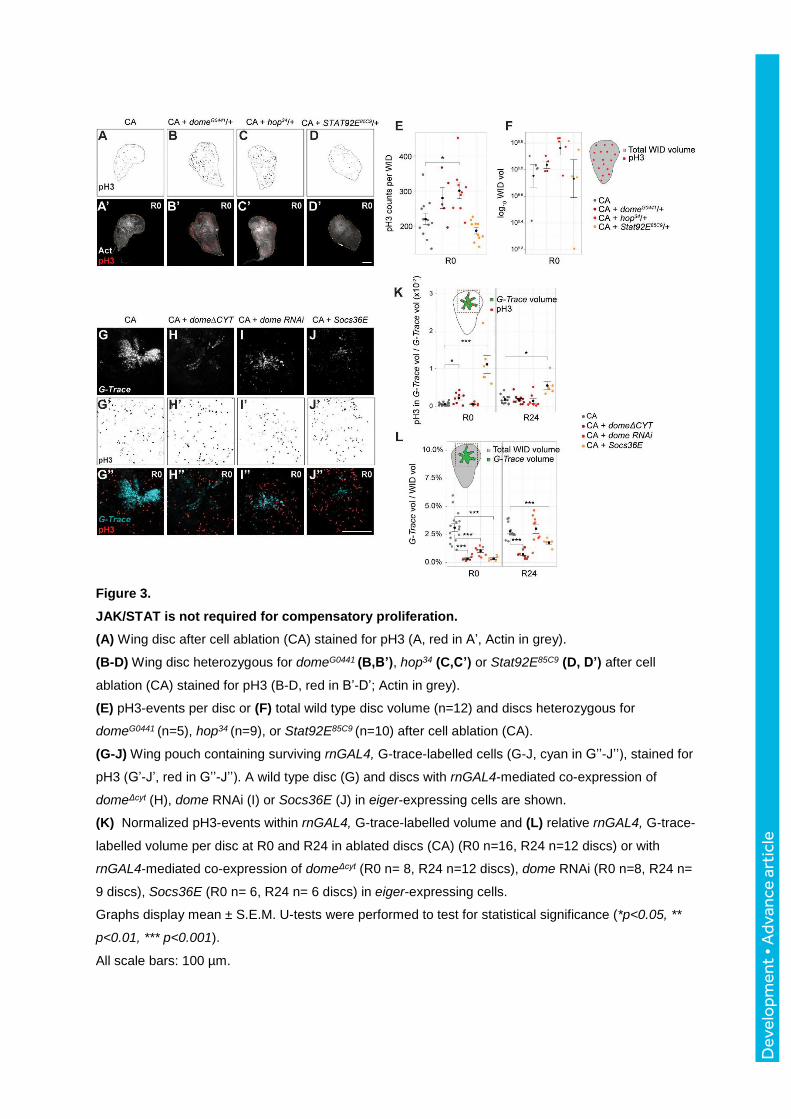
Figure 3.
JAK/STAT is not required for compensatory proliferation.
(A) Wing disc after cell ablation (CA) stained for pH3 (A, red in A’, Actin in grey).
(B-D) Wing disc heterozygous for domeG0441 (B,B’), hop34 (C,C’) or Stat92E85C9 (D, D’) after cell
ablation (CA) stained for pH3 (B-D, red in B’-D’; Actin in grey).
(E) pH3-events per disc or (F) total wild type disc volume (n=12) and discs heterozygous for
domeG0441 (n=5), hop34 (n=9), or Stat92E85C9 (n=10) after cell ablation (CA).
(G-J) Wing pouch containing surviving rnGAL4, G-trace-labelled cells (G-J, cyan in G’’-J’’), stained for
pH3 (G’-J’, red in G’’-J’’). A wild type disc (G) and discs with rnGAL4-mediated co-expression of
domeΔcyt (H), dome RNAi (I) or Socs36E (J) in eiger-expressing cells are shown.
(K) Normalized pH3-events within rnGAL4, G-trace-labelled volume and (L) relative rnGAL4, G-trace-
labelled volume per disc at R0 and R24 in ablated discs (CA) (R0 n=16, R24 n=12 discs) or with
rnGAL4-mediated co-expression of domeΔcyt (R0 n= 8, R24 n=12 discs), dome RNAi (R0 n=8, R24 n=
9 discs), Socs36E (R0 n= 6, R24 n= 6 discs) in eiger-expressing cells.
Graphs display mean ± S.E.M. U-tests were performed to test for statistical significance (*p<0.05, **
p<0.01, *** p<0.001).
All scale bars: 100 µm.
Dev
elo
pmen
t • A
dvan
ce a
rtic
le

Figure 4.
JAK/STAT is required for survival of Eiger-stimulated cells
(A-D) Wing disc after cell ablation (CA) (A) and with rnGAL4-mediated co-expression of domeΔcyt (B),
dome RNAi (C), or Socs36E (D) in eiger-expressing cells stained for Cleaved Caspase-3 to visualize
apoptotic cells (cyan) and Actin (red).
(E) Cleaved Caspase-3 volume in ablated discs (CA, R0 n=15, R24 n= 4 discs) or with rnGAL4-
mediated co-expression of domeΔcyt (R0 n= 12, R24 n= 3 discs), dome RNAi (R0 n= 10, R24 n= 4
discs), or Socs36E (R0 n= 6, R24 n= 6 discs) in eiger-expressing cells at R0 and R24.
(F-H) Ablated discs heterozygous for domeG0441 (F), hop34 (G) or Stat92E85C9 (H) stained for Cleaved
Caspase-3 (cyan) and Actin (red) at R0.
(I) Cleaved Caspase-3-positive volumes per disc after cell ablation (CA) (n= 12 discs) or in discs
heterozygous for domeG0441(n= 4 discs), hop34 (n= 9 discs), or Stat92E85C9 (n= 8 discs) at R0.
(J-M) Disc expressing the JNK reporter TRE-RFP (cyan) after cell ablation (CA) (J) or if heterozygous
for domeG0441(K), hop34 (L), or Stat92E85C9 (M) at R0.
(N) Quantification of TRE-RFP positive area per disc after cell ablation (CA) (n= 14 discs) and in discs
heterozygous for domeG0441 (n= 8 discs), hop34 (n= 4 discs), or Stat92E85C9 (n= 8 discs).
Graphs display mean ± S.E.M. U-tests were performed to test for statistical significance (* p<0.05, **
p<0.01, *** p<0.001).
All scale bars: 100 µm.
Dev
elo
pmen
t • A
dvan
ce a
rtic
le

Figure 5.
A survival-promoting function of JAK/STAT is mediated by Zfh2
(A) qRT-PCR analysis of rpr, hid, grim and fos (kay) transcripts at R0. Fold-induction relative to
unablated discs is reported. Each graph shows mean ± S.E.M for n≥3 biological replicates.
(B) qRT-PCT analysis of hid and kay at R0 in Eiger-expressing discs heterozygous mutant for
Stat92E85C9. Fold-induction relative to ablated discs. Each graph shows mean ± S.E.M for n=2
biological replicates.
(C-F) Unablated discs (C, E) and ablated discs (D, F) stained for Zfh1 (C, D) or Zfh2 (E,F) at R0.
(G) qRT-PCR analysis of zfh1 and zfh2 transcripts at R0. Fold-induction relative to unablated discs is
reported. Each graph shows mean ± S.E.M for n=3 biological replicates.
(H, I) Disc after cell ablation (H) or with rnGAL4-mediated co-expression of zfh2 RNAi (I) in eiger-
expressing cells stained for Dcp-1 to visualize apoptotic cells (cyan) and Actin (red) at R0.
(J) Dcp1-positive volume per disc after cell ablation (CA) (n=4 discs) or in discs with rnGAL4-
mediated co-expression zfh2 RNAi (n= 3 discs) in eiger-expressing cells at R0.
(K, L) Disc after cell ablation (K) or discs with rnGAL4-mediated co-expression of UAS-zfh2 (L) in
eiger-expressing cells stained for Dcp-1 (cyan) and Actin (red) at R0.
Dev
elo
pmen
t • A
dvan
ce a
rtic
le

(M) rnGAL4, G-trace-labelled volume in ablated discs (n= 16 discs) and RFP-labelled volume in discs
with rnGAL4-mediated co-expression UAS-Zfh2[EAB] (n= 7 discs) in eiger-expressing cells at R0.
Graphs display mean ± S.E.M. U-tests were performed to test for statistical significance (* p<0.05, **
p<0.01, *** p<0.001).
All scale bars: 100 µm.
Dev
elo
pmen
t • A
dvan
ce a
rtic
le

Figure 6.
JAK/STAT prevents excessive damage upon tissue stress
(A) Five adult wing size phenotypes were classified to score tissue damage after eiger-expression at
D7.
(B) Average wing sizes developing from Eiger-stimulated disc (CA) or combined with rnGAL4-
mediated co-expression of UAS-transgenes or in genetic backgrounds heterozygous for domeG0441,
hop34, or Stat92E85C9. Graphs display mean ± S.D. of average scores derived from ≥3 experiments. T-
tests were performed to test for statistical significance (* p<0.05). n= number of wings scored.
(C) Cumulative fraction of larvae undergoing larval-pupal transitions, which carry Eiger-stimulated
discs (CA) (n= 210) or were combined with rnGAL4-mediated co-expression of upd1 (n= 213),
domeΔcyt (n=201), dome RNAi (n= 196), or hop RNAi (n=230). Graphs display mean ± S.E.M. of
average scores from ≥3 experiments.
(D) Relative disc area expressing dILP8-GFP after cell ablation (CA) (R0 n=12, R24 = 4 discs) and in
discs combined with rnGAL4-mediated co-expression of domeΔcyt (R0 n= 5, R24 n= 3 discs) or dome
RNAi (R0 n= 5, R24 n= 7 discs) in eiger-expressing cells.
Graphs display mean ± S.E.M. U-tests were performed to test for statistical significance (* p<0.05, **
p<0.01, *** p<0.001).
Dev
elo
pmen
t • A
dvan
ce a
rtic
le

Figure 7.
JAK/STAT regulates survival in a RasV12;scrib tumour model
(A-C) Eye imaginal discs carrying neutral (A), RasV12;scrib2 (B, B’) or RasV12;scrib2,Stat92E85C9 (C, C’)
GFP-marked MARCM clones (cyan in A-C) stained for pH3 (B’, C’, red in A-C).
(D) Area occupied by neutral (n= 4), RasV12;scrib2 (n= 5) or RasV12;scrib2,Stat92E85C9 (n= 5) clones,
normalized to total eye imaginal disc (EID) area.
(E) pH3-events in RasV12;scrib2 (n= 5) or RasV12;scrib2,Stat92E85C9 (n= 5) clones per eye disc
normalized to total clone area per disc.
(F-H) Eye discs carrying neutral (F), RasV12;scrib2 (G, G’) or RasV12;scrib2,Stat92E85C9 (H, H’) clones
(cyan in F-H) stained for Dcp-1 (G’, H’, red in F-H). Clone borders indicated by outline in G’, H’.
(I) Dcp-1-positive area within RasV12;scrib2 (n= 6) or RasV12;scrib2,Stat92E85C9 (n= 8) clones
normalized to total clone area per disc.
(J-L) Eye discs carrying neutral (J), RasV12;scrib2 (K, K’) or RasV12;scrib2,Stat92E85C9 (L, L’) clones
(cyan in J-L) stained for Zfh2 (K’, L’, red in J-L).
(M) Cumulative fraction of larvae undergoing larval-pupal transitions carrying RasV12;scrib2 or
RasV12;scrib2,Stat92E85C9 clones.
Dev
elo
pmen
t • A
dvan
ce a
rtic
le

(N) Cells activating JNK in response to stress induce compensatory proliferation as well as injured-
induced apoptosis. JAK/STAT suppresses apoptosis, thereby limiting the extent of tissue damage and
promoting compensatory responses, such as induction of development delays.
Graphs display mean ± S.E.M. U-tests were performed to test for statistical significance (* p<0.05, **
p<0.01, *** p<0.001).
All scale bars: 100 µm.
Dev
elo
pmen
t • A
dvan
ce a
rtic
le

Supplementary experimental procedures
Temporal and spatial control of Eiger-expression
To induce expression of eiger, experiments were carried out as described in (Smith-Bolton et
al., 2009) and in Fig.S1. Briefly, rnGal4, UASegr, tubGal80TS/TM6B, tubGal80 lines were
outcrossed to a w1118 wild type strain or strains carrying indicated alleles or transgenes.
Larvae were staged by collecting 50 1st instar larvae per vial 24 h after a 6 h egg collection.
Larvae were raised at 18°C and shifted to 30°C for 40h at day 7 after egg deposition (D7
AED), unless noted otherwise. Genetic cell ablation experiments using UASrpr;; ptcGAL4,
tubGAL80TS or rnGal4, UASrpr, tubGal80TS were induced by a 16 h or a 24 h shift to 30°C at
day 8 AED, respectively.
Flow cytometry
Flow cytometry analysis of wing imaginal disc cells was performed as described (de la Cruz
and Edgar, 2008). Briefly, 20-30 dissected wing imaginal discs were dissociated in PBS with
9XTrypsin-EDTA (Sigma) supplemented with 1.5 µg/ml Hoechst 33342 for 2-3 h at room
temperature. Cell profiles were obtained using a FACS Aria II instrument (BD Biosciences)
and analysed using FlowJo 8.8.7 (Tree Star) software.
BrdU labelling
Larvae were dissected in Shields and Sang M3 medium and incubated for 30 min with
100µg/µl BrdU (Sigma) at room temperature. Cuticles were fixed in 4% PFA for 15 minutes
and subsequently washed with 0.5% Triton X-100/PBS in all washing steps. Fixed tissues
were incubated for 45 min in 2N HCl and washed with 0.1M H3BO3 for 2 min twice. Antibody
incubations, sample mounting and analysis was carried out as described above.
Transcription factor binding site prediction
Bioinformatic analysis for potential transcription factor binding sites was performed using the
program Clover (Cis-eLement OVERrepresentation) (Frith et al., 2004) in combination with
position-weighted-matrices (PWM) obtained from the JASPAR collection (Mathelier et al.,
2014). The p-value threshold of all predictions was set to p<0.05. Drosophila chromosome 2R
was used as background sequence in all calculations. For each gene, genomic sequences
(dm6 genome version) of 2.5 kb upstream from the transcriptional start site (TSS) and the
entire first intron, if present, were selected for analysis. For short genes with a sequence
shorter than 2 kb (e.g. rpr and grim) or for genes without introns, a 2.5 kb sequence
downstream of the 3’UTR was add to the analysis. All results are documented in
Supplemental .wig files. Data was visualized using USCS genome browser tools. mVISTA
conservation analysis (Frazer et al., 2004, Bray et al., 2003) was run on kay and hid genomic
Dev
elo
pmen
t • S
uppl
emen
tary
info
rmat
ion
Development 143: doi:10.1242/dev.132340: Supplementary information

region by comparing D.melanogaster to: D.simulans, D. sechellia, D. erecta, D. yakuba, D.
ananassae, D. pseudobscura, D. persimilis, D. willistoni, D. virilis, D. grimshawi. Genomic
sequences were obtained from FlyBase. ATAC-seq profiles were previously published (Davie
et al., 2015) (GEO access number: GSE59078) and used in this work as predictors of open
chromatin regions.
Image analysis and quantification General Information
Images were taken using 20X or 63X objectives (without additional optical zoom). Stacks
were imaged at 1024x1024 pixel resolution and a z-step size of 1µm. Control and
experimental samples were prepared under the same conditions on the same day, as well as
imaged using the same conditions on the same day.
GFP volume quantification (G-trace lineage labelling)
Masks of the GFP signal were generated applying the ‘Threshold’ (settings: ‘Triangle’, stack
histogram, dark background) and ‘Remove Outliers’ (settings: black and white pixels removal
with radii= 1-10 at a constant threshold of 50) function to entire image stacks in FIJI. The
resulting masks were analysed using the ‘3D Object Counter’ function (settings: threshold=
128, min=10 max=Inf, Exclude Object On Edges=FALSE). Measured volumes for each disc
were summed up and used to describe total GFP volume per disc.
pH3 and BrdU counts
Masks of pH3 (or BrdU) events per disc were generated by applying the ‘Threshold’ (settings:
‘Li’, stack histogram, dark background) and ‘Remove Outliers’ (settings: black and white
pixels removal with radii= 1-5 at a constant threshold of 50) function to entire image stacks in
FIJI. The resulting masks were analysed using the ‘3D Object Counter’ function (settings:
threshold= 128, min=10 max=Inf, Exclude Object On Edges=FALSE). The total number of
counted particles was considered to represent mitotic or DNA replication events per disc.
pH3-positive mitotic events in G-trace lineage labelled cells (volumetric method)
To count the number of cells marked by pH3 within the GFP-positive, G-trace volume, the
pH3 mask was ‘Subtracted’ (FIJI function) from the GFP mask. The resulting mask was
analysed using the ‘3D Object Counter’ function (settings: threshold= 128, min=10 max=Inf,
Exclude Object On Edges=FALSE). The new total counts of particles were considered to be
mitotic events in GFP-positive cells.
pH3-positive mitotic events in G-trace lineage labelled cells (absolute counts)
Nuclei of GFP-positive, cells were counted manually using the ‘multi-point selection’ tool
across stacks with z-step size of 2 µm. In the same disc, pH3-positive mitotic events within
Dev
elo
pmen
t • S
uppl
emen
tary
info
rmat
ion
Development 143: doi:10.1242/dev.132340: Supplementary information

the G-trace labelled region were manually counted across the entire stack. pH3 and nuclei
counts were paired and ratios compared between genotypes.
TRE-reporter quantifications
Image stacks were manually curated to eliminate TRE-reporter activity signals arising from
the peripodial membrane. The peripodium shows extensive TRE-reporter activity, which was
not subject of this study. Maximum projections of the final image stacks were obtained in FIJI
and
masks of the area with active reporter were generated using the ‘Threshold’ (settings:
‘IsoData’, stack histogram, dark background) and ‘Remove Outliers’ (settings: black and white
pixels removal with radii=1-10 at a constant threshold of 50) function. The areas of resulting
masks were quantified using the ROI analyzer in FIJI.
Dev
elo
pmen
t • S
uppl
emen
tary
info
rmat
ion
Development 143: doi:10.1242/dev.132340: Supplementary information

General information Genotypes Source
w 118
rn-Gal4,UAS-egr,tub-GAL80 TS /TM6b, tub-GAL80 TS I Hariharan, R Smith-Bolton
UAS-FLP,Ubi-p63E.FRT>STOP>FRT-Stinger15F2 Bloomington
TRE-RFP D Bohmann
TRE-GFP D Bohmann
UAS-Bsk DN Bloomington
UAS-puc Bloomington
10XSTATdGFP/Cyo E Bach
domeG0441 /FM7, ubi-GFP Bloomington
hop34/FM7, ubi-GFP N Perrimon
FRT82-Stat92E 85C9 /TM6c E Bach
UAS-domeΔCYT /Cyo, ubi-GFP E Bach
UAS-Socs36E E Bach
zfh2[EAB] F. J. Díaz-Benjumea and E. Sánchez-Herrero
UAS-upd1/Cyo, ubi-GFP M Zeidler
w; UAS-upd2/Cyo M Zeidler
dilp8-GFP Bloomington
w; FRT 82B Bloomington
yw, ey-FLP; act>y +>GAL4, UAS-GFP/Cyo;FRT82B, tub-GAL80/TM6b G Halder
yw, ey-FLP; UAS-RasV12/Cyo,FRT82B, scrib 2 /TM6b G Halder
UAS-RasV12 /Cyo; FRT82B, scrib 2 , Stat92E 85C9 /Tm6b G Halder
UAS-p35 Bloomington
UAS-domeRNAi /Cyo, ubi-GFP VDRC-KK106071
UAS-hopRNAi BL-HMS00761
UAS-hopRNAi BL-JF01268
UAS-Stat92ERNAi BL-HMS00035
UAS-zfh1.P Bloomington
UAS-zfh1RNAi/TM3, Sb BL-JF02509
UAS-zfh2RNAi/TM6b VDRC-GD13305
Df(3L)H99/TM3, Sb Bloomington
UAS-Dcr2/FM7i;en-Gal4,UAS-GFP Bloomington
MS1096-Gal4/FM7a;Sp/Cyo;Dr/TM6c
ex[e1]-lacZ/SM6 G Halder
upd-LacZ/FM7a
UAS-Hop TumL /CyO N Perrimon
STAT92E-GFP.FLAG/CyO;Dr/TM6c Bloomington
hsflp[122]/+; act>y[+]>GAL4,UAS-GFP/+
Figures Genotypes raised at temperature shift AED
Figure 1
1A +/+;;rn-Gal4,tub-Gal80TS/UAS-FLP,Ubi-p63E-FRT>STOP>FRT-Stinger15F2 18°C 30°C, 40 h 7d
1A',1D,1F +/+;;rn-Gal4,UAS-egr,tub-Gal80TS/UAS-FLP,Ubi-p63E-FRT>STOP>FRT-Stinger15F2 18°C 30°C, 40 h 7d
1B TRE-GFP/+;;+/+ 18°C 30°C, 40 h 7d
1C TRE-RFP/+;;rn-Gal4,UAS-egr,tub-Gal80TS/UAS-FLP,Ubi-p63E-FRT>STOP>FRT-Stinger15F2 18°C 30°C, 40 h 7d
1E,1G +/+;;rn-Gal4,UAS-egr,tub-Gal80TS/+ 18°C 30°C, 40 h 7d
Figure 2
2A 10XSTATdGFP/+;;+/+ 18°C 30°C, 40 h 5d-7d-8d
2B-D 10XSTATdGFP/+;;rn-Gal4,UAS-egr,tub-Gal80TS/+ 18°C 30°C, 40 h 5d-7d-8d
2E +/+;;rn-Gal4,UAS-egr,tub-Gal80TS/+ 18°C 30°C, 40 h 5d-7d-8d
Figure 3
3A,3E-F +/+;;rn-Gal4,UAS-egr,tub-Gal80TS/+ 18°C 30°C, 40 h 7d
3B,3E-3F domeG0441/+;;+/+;;rn-Gal4,UAS-egr,tub-Gal80TS/+ 18°C 30°C, 40 h 7d + 6h
3C,3E-3F hop34 /+;;+/+;;rn-Gal4,UAS-egr,tub-Gal80TS/+ 18°C 30°C, 40 h 7d + 6h
3D,3E-3F +/+;;rn-Gal4,UAS-egr,tub-Gal80TS/FRT82-Stat92E85C9 18°C 30°C, 40 h 7d + 12h
Supplementary Tables Supplementary Table 1 Genotypes and experimental conditions This table lists all fly lines, their sources and the derived genotypes used to generate the data
for each of the main and supplementary figures in this study. Experimental conditions related
to induction of Eiger-expression are listed to the right.
Dev
elo
pmen
t • S
uppl
emen
tary
info
rmat
ion
Development 143: doi:10.1242/dev.132340: Supplementary information

3G,3K-3L +/+;;rn-Gal4,UAS-egr,tub-Gal80TS/UAS-FLP,Ubi-p63E-FRT>STOP>FRT-Stinger15F2 18°C 30°C, 40 h 7d
3H,3K-3L UAS-domeΔCYT/+;;rn-Gal4,UAS-egr,tub-Gal80TS/UAS-FLP,Ubi-p63E-FRT>STOP>FRT-Stinger15F2 18°C 30°C, 40 h 7d
3I,3K-3L UAS-domeRNAi/+;;rn-Gal4,UAS-egr,tub-Gal80TS/UAS-FLP,Ubi-p63E-FRT>STOP>FRT-Stinger15F2 18°C 30°C, 40 h 7d
3J,3K-3L UAS-Socs36E/+;;rn-Gal4,UAS-egr,tub-Gal80TS/UAS-FLP,Ubi-p63E-FRT>STOP>FRT-Stinger15F2 18°C 30°C, 40 h 7d
Figure 4
4A,4E,4I +/+;;rn-Gal4,UAS-egr,tub-Gal80TS/+ 18°C 30°C, 40 h 7d
4B,4E UAS-domeΔCYT/+;;rn-Gal4,UAS-egr,tub-Gal80TS/+ 18°C 30°C, 40 h 7d
4C,4E UAS-domeRNAi/+;;rn-Gal4,UAS-egr,tub-Gal80TS/+ 18°C 30°C, 40 h 7d
4D-E +/+;;rn-Gal4,UAS-egr,tub-Gal80TS/UAS-Socs36E 18°C 30°C, 40 h 7d
4F,4I domeG0441/+;;+/+;;rn-Gal4,UAS-egr,tub-Gal80TS/+ 18°C 30°C, 40 h 7d + 6h
4G,4I hop34 /+;;+/+;;rn-Gal4,UAS-egr,tub-Gal80TS/+ 18°C 30°C, 40 h 7d + 6h
4H-I +/+;;rn-Gal4,UAS-egr,tub-Gal80TS/FRT82-Stat92E85C9 18°C 30°C, 40 h 7d + 12h
4J,4N TRE-RFP/+;;rn-Gal4,UAS-egr,tub-Gal80TS/+ 18°C 30°C, 40 h 7d
4K,4N domeG0441/+;;TRE-RFP/+;;rn-Gal4,UAS-egr,tub-Gal80TS/+ 18°C 30°C, 40 h 7d + 6h
4L,4N hop34 /+;;TRE-RFP/+;;rn-Gal4,UAS-egr,tub-Gal80TS/+ 18°C 30°C, 40 h 7d + 6h
4M-N TRE-RFP/+;;rn-Gal4,UAS-egr,tub-Gal80TS/FRT82-Stat92E85C9 18°C 30°C, 40 h 7d + 12h
Figure 5
5A, 5C, 5E, 5G w118
5A-M +/+;;rn-Gal4,UAS-egr,tub-Gal80TS/+ 18°C 30°C, 40 h 7d
5B +/+;;rn-Gal4,UAS-egr,tub-Gal80TS/FRT82-Stat92E85C9 18°C 30°C, 40 h 7d
5I +/+;;rn-Gal4,UAS-egr,tub-Gal80TS/UAS-Zfh2RNAi 18°C 30°C, 40 h 7d
5K +/+;;rn-Gal4,UAS-egr,tub-Gal80TS/UAS-FLP,Ubi-p63E-FRT>STOP>FRT-Stinger15F2 18°C 30°C, 40 h 7d
5L +/+;;rn-Gal4,UAS-egr,tub-Gal80TS/+;;Zfh2[EAB] 18°C 30°C, 40 h 7d
Figure 6
6A-D +/+;;rn-Gal4,UAS-egr,tub-Gal80TS/+ 18°C 30°C, 40 h 7d
6B-C UAS-upd1/+;;+/+;;rn-Gal4,UAS-egr,tub-Gal80TS/+ 18°C 30°C, 40 h 7d
6B UAS-upd2/+;;+/+;;rn-Gal4,UAS-egr,tub-Gal80TS/+ 18°C 30°C, 40 h 7d
6B-C UAS-domeΔCYT/+;;rn-Gal4,UAS-egr,tub-Gal80TS/+ 18°C 30°C, 40 h 7d
6B-C UAS-domeRNAi/+;;rn-Gal4,UAS-egr,tub-Gal80TS/+ 18°C 30°C, 40 h 7d
6B-C +/+;;rn-Gal4,UAS-egr,tub-Gal80TS/UAS-hopRNAi 18°C 30°C, 40 h 7d
6B +/+;;rn-Gal4,UAS-egr,tub-Gal80TS/UAS-STAT92ERNAi 18°C 30°C, 40 h 7d
6B +/+;;rn-Gal4,UAS-egr,tub-Gal80TS/UAS-Socs36E 18°C 30°C, 40 h 7d
6B +/+;;rn-Gal4,UAS-egr,tub-Gal80TS/UAS-Zfh2RNAi 18°C 30°C, 40 h 7d
6B +/+;;rn-Gal4,UAS-egr,tub-Gal80TS/+;;Zfh2[EAB] 18°C 30°C, 40 h 7d
6B domeG0441/+;;+/+;;rn-Gal4,UAS-egr,tub-Gal80TS/+ 18°C 30°C, 40 h 7d + 6h
6B hop34 /+;;+/+;;rn-Gal4,UAS-egr,tub-Gal80TS/+ 18°C 30°C, 40 h 7d + 6h
6B +/+;;rn-Gal4,UAS-egr,tub-Gal80TS/FRT82-Stat92E85C9 18°C 30°C, 40 h 7d + 12h
6D +/+;;rn-Gal4,UAS-egr,tub-Gal80TS/dIlp8-GFP 18°C 30°C, 40 h 7d
6D UAS-domeΔCYT/+;;rn-Gal4,UAS-egr,tub-Gal80TS/dIlp8-GFP 18°C 30°C, 40 h 7d
6D UAS-domeRNAi/+;;rn-Gal4,UAS-egr,tub-Gal80TS/dIlp8-GFP 18°C 30°C, 40 h 7d
Figure 7
7A,7D-E,7F,7I,7J,7M yw,ey-FLP;;act>y+>GAL4,UAS-GFP/+;;FRT82B,tub-GAL80/FRT82B-iso 25°C
7B,7D-E,7G,7I,7K,7M yw,ey-FLP;;act>y+>GAL4,UAS-GFP/UAS-RasV12;;FRT82B, tub-GAL80/FRT82B,scrib2 25°C
7C-E,7H-I,7L-M yw,ey-FLP;;act>y+>GAL4,UAS-GFP/UAS-RasV12;;FRT82B, tub-GAL80/FRT82B,scrib2 ,Stat92E85C9 25°C
Supplementary figures
Figures Genotypes raised at
Figure S1
S1D,S1G w118 18°C 30°C, 40 h 7d
S1D',S1G-H +/+;;rn-Gal4,UAS-egr,tub-Gal80TS/+ 18°C 30°C, 40 h 7d
S1D'' UAS-bskDN/+;;+/+;;rn-Gal4,UAS-egr,tub-Gal80TS/+ 18°C 30°C, 40 h 7d
S1D''' +/+;;rn-Gal4,UAS-egr,tub-Gal80TS/UAS-puc 18°C 30°C, 40 h 7d
S1E +/+;;rn-Gal4,tub-Gal80TS/UAS-FLP,Ubi-p63E-FRT>STOP>FRT-Stinger15F2 18°C 30°C, 40 h 7d
S1E'-F +/+;;rn-Gal4,UAS-egr,tub-Gal80TS/UAS-FLP,Ubi-p63E-FRT>STOP>FRT-Stinger15F2 18°C 30°C, 40 h 7d
exp. conditions
Dev
elo
pmen
t • S
uppl
emen
tary
info
rmat
ion
Development 143: doi:10.1242/dev.132340: Supplementary information

Figure S2
S2A +/+;;rn-Gal4,tub-Gal80TS/UAS-FLP,Ubi-p63E-FRT>STOP>FRT-Stinger15F2 18°C 30°C, 40 h 7d
S2A' +/+;;rn-Gal4,UAS-egr,tub-Gal80TS/UAS-FLP,Ubi-p63E-FRT>STOP>FRT-Stinger15F2 18°C 30°C, 40 h 7d
S2B TRE-GFP/+;;+/+ 18°C 30°C, 40 h 7d
S2B' TRE-GFP/+;;rn-Gal4,UAS-egr,tub-Gal80TS/+ 18°C 30°C, 40 h 7d
S2C TRE-GFP/+;;rn-Gal4,UAS-rpr,tub-Gal80TS/+ 18°C 30°C, 24 h 7d
S2D UAS-rpr/+;;ptc-Gal4,tub-Gal80TS/TRE-GFP;;+/+ 18°C 30°C, 16 h 7d
S2E +/+;;rn-Gal4,UAS-egr,tub-Gal80TS/+ 18°C 30°C, 40 h 7d
Figure S3
S3A 10XSTATdGFP/+;;+/+ 18°C 30°C, 40 h 7d
S3B-D 10XSTATdGFP/+;;rn-Gal4,UAS-egr,tub-Gal80TS/+ 18°C 30°C, 40 h 5d-7d-8d
S3E 10XSTATdGFP/+;;rn-Gal4,UAS-rpr,tub-Gal80TS/+ 18°C 30°C, 24 h 7d
S3F-G TRE-GFP/+;;rn-Gal4,UAS-egr,tub-Gal80TS/+ 18°C 30°C, 40 h 7d-8d
S3H-I +/+;;rn-Gal4,UAS-egr,tub-Gal80TS/+ 18°C 30°C, 40 h 5d-6d-7d-8d
Figure S4
S4A-D +/+;;rn-Gal4,UAS-egr,tub-Gal80TS/+ 18°C 30°C, 40 h 7d
S4A-D UAS-domeΔCYT/+;;rn-Gal4,UAS-egr,tub-Gal80TS/+ 18°C 30°C, 40 h 7d
S4A-D UAS-domeRNAi/+;;rn-Gal4,UAS-egr,tub-Gal80TS/+ 18°C 30°C, 40 h 7d
S4C-D UAS-Socs36E/+;;rn-Gal4,UAS-egr,tub-Gal80TS/+ 18°C 30°C, 40 h 7d
Figure S5
S5A +/+;;rn-Gal4/+ 21°C
S5A UAS-domeRNAi/+;;rn-Gal4/+ 21°C
S5A +/+;;rn-Gal4/UAS-hopRNAi 21°C
S5A +/+;;rn-Gal4/UAS-STAT92ERNAi 21°C
S5B +/+;;rn-Gal4,tub-Gal80TS/+ 18°C 30°C, 40 h 7d
S5B UAS-domeRNAi/+;;rn-Gal4,tub-Gal80TS/+ 18°C 30°C, 40 h 7d
S5B +/+;;rn-Gal4,tub-Gal80TS/UAS-hopRNAi 18°C 30°C, 40 h 7d
S5B +/+;;rn-Gal4,tub-Gal80TS/UAS-STAT92ERNAi 18°C 30°C, 40 h 7d
Figure S6
S6A,S6E, S6J +/+;;rn-Gal4,UAS-egr,tub-Gal80TS/+ 18°C 30°C, 40 h 7d
S6B +/+;;rn-Gal4,UAS-egr,tub-Gal80TS/Df(3L)H99 18°C 30°C, 40 h 7d
S6C hsflp [122]/+;;+/+, ubi-GFP;; act>y[+]>GAL4,UAS-GFP/+ 21°C 37°C, 15 min
S6D hsflp [122]/+;;UAS-HopTumL /+;; act>y[+]>GAL4,UAS-GFP/+ 21°C 37°C, 15 min
S6H-H'' ptc-Gal4,tub-Gal80TS/+;;UAS-Zfh2RNAi/+ 18°C 30°C, 40 h 7d
S6F +/+;;rn-Gal4,UAS-egr,tub-Gal80TS/FRT82-Stat92E85C9 18°C 30°C, 40 h 7d
S6I w118 18°C 30°C, 40 h 7d
S6K UAS-Zfh1/+;;rn-Gal4,UAS-egr,tub-Gal80TS/+ 18°C 30°C, 40 h 7d
S6L UAS-p35/+;;rn-Gal4,UAS-egr,tub-Gal80TS/+ 18°C 30°C, 40 h 7d
Figure S7
S7A +/+;;rn-Gal4,UAS-egr,tub-Gal80TS/+ 18°C 30°C, 40 h 7d
S7A UAS-upd1/+;;+/+;;rn-Gal4,UAS-egr,tub-Gal80TS/+ 18°C 30°C, 40 h 7d
S7A UAS-upd2/+;;+/+;;rn-Gal4,UAS-egr,tub-Gal80TS/+ 18°C 30°C, 40 h 7d
S7A UAS-domeΔCYT/+;;rn-Gal4,UAS-egr,tub-Gal80TS/+ 18°C 30°C, 40 h 7d
S7A UAS-domeRNAi/+;;rn-Gal4,UAS-egr,tub-Gal80TS/+ 18°C 30°C, 40 h 7d
S7A +/+;;rn-Gal4,UAS-egr,tub-Gal80TS/UAS-hopRNAi 18°C 30°C, 40 h 7d
S7A +/+;;rn-Gal4,UAS-egr,tub-Gal80TS/UAS-STAT92ERNAi 18°C 30°C, 40 h 7d
S7A +/+;;rn-Gal4,UAS-egr,tub-Gal80TS/UAS-Socs36E 18°C 30°C, 40 h 7d
S7A +/+;;rn-Gal4,UAS-egr,tub-Gal80TS/UAS-Zfh2RNAi 18°C 30°C, 40 h 7d
S7A +/+;;rn-Gal4,UAS-egr,tub-Gal80TS/+;;Zfh2[EAB] 18°C 30°C, 40 h 7d
S7A domeG0441/+;;+/+;;rn-Gal4,UAS-egr,tub-Gal80TS/+ 18°C 30°C, 40 h 7d + 6h
S7A hop34 /+;;+/+;;rn-Gal4,UAS-egr,tub-Gal80TS/+ 18°C 30°C, 40 h 7d + 6h
S7A +/+;;rn-Gal4,UAS-egr,tub-Gal80TS/FRT82-Stat92E85C9 18°C 30°C, 40 h 7d + 12h
S7A +/+;;rn-Gal4,tub-Gal80TS/+ 18°C 30°C, 40 h 7d
S7A UAS-upd1/+;;+/+;;rn-Gal4,tub-Gal80TS/+ 18°C 30°C, 40 h 7d
Dev
elo
pmen
t • S
uppl
emen
tary
info
rmat
ion
Development 143: doi:10.1242/dev.132340: Supplementary information

S7A UAS-upd2/+;;+/+;;rn-Gal4,tub-Gal80TS/+ 18°C 30°C, 40 h 7d
S7A UAS-domeΔCYT/+;;rn-Gal4,tub-Gal80TS/+ 18°C 30°C, 40 h 7d
S7A UAS-domeRNAi/+;;rn-Gal4,tub-Gal80TS/+ 18°C 30°C, 40 h 7d
S7A +/+;;rn-Gal4,tub-Gal80TS/UAS-hopRNAi 18°C 30°C, 40 h 7d
S7A +/+;;rn-Gal4,tub-Gal80TS/UAS-STAT92ERNAi 18°C 30°C, 40 h 7d
S7A +/+;;rn-Gal4,tub-Gal80TS/UAS-Socs36E 18°C 30°C, 40 h 7d
S7A +/+;;rn-Gal4,tub-Gal80TS/UAS-Zfh2RNAi 18°C 30°C, 40 h 7d
S7A +/+;;rn-Gal4,tub-Gal80TS/+;;Zfh2[EAB] 18°C 30°C, 40 h 7d
S7A domeG0441/+;;+/+;;rn-Gal4,tub-Gal80TS/+ 18°C 30°C, 40 h 7d + 6h
S7A hop34 /+;;+/+;;rn-Gal4,tub-Gal80TS/+ 18°C 30°C, 40 h 7d + 6h
S7A +/+;;rn-Gal4,tub-Gal80TS/FRT82-Stat92E85C9 18°C 30°C, 40 h 7d + 12h
S7B UAS-dcr2/+;;en-Gal4,UAS-GFP/+;;+/+ 25°C
S7B UAS-dcr2/+;;en-Gal4,UAS-GFP/+;;UAS-hopRNAi/+ 25°C
S7C +/+;;rn-Gal4,UAS-egr,tub-Gal80TS/dIlp8-GFP 18°C 30°C, 40 h 7d
S7D UAS-domeΔCYT/+;;rn-Gal4,UAS-egr,tub-Gal80TS/dIlp8-GFP 18°C 30°C, 40 h 7d
S7E UAS-domeRNAi/+;;rn-Gal4,UAS-egr,tub-Gal80TS/dIlp8-GFP 18°C 30°C, 40 h 7d
S7F MS1096-Gal4/+;;+/+;;+/+ 25°C
S7F MS1096-Gal4/UAS-upd1;;+/+;;+/+ 25°C
S7F MS1096-Gal4/UAS-upd2;;+/+;;+/+ 25°C
Dev
elo
pmen
t • S
uppl
emen
tary
info
rmat
ion
Development 143: doi:10.1242/dev.132340: Supplementary information

Supplementary Table 2 Primers This table lists all primers used for real-time qPCR analysis. House-keeping genes are shown
in red.
Gene Seq. 5' - 3'
upd1 Fwr TCGATATGCGCTTTGTGAAGupd1 Rev TGCTGCTGCTGTAGCAACTTupd2 Fwr TACAAGTTCCTGCCGAACATGACupd2 Rev ACAAGTGGCGATTCTATAAGGGAAACupd3 Fwr CCCCTGAAGCACCTACAGAAupd3 Rev AGGATCCTTTGGCGTTTCTTdome Fwr ATCGCAAAGAATACAAAATAAATTACAAACdome Rev TCTGGAATCTGGAAACTAGAAACCAChop Fwr TATCCGGATTTGGTATGGATGAATGhop Rev TTTTTAAAACAACACAAGCCAGACCSTAT92E Fwr CATGCAATGTGCTCTTCACASTAT92E Rev AGATCTGGACGTGCTTTGCThid Fwr ACAACTTCTTCCGGCAGCAGhid Rev GAAGGGAGGGGAATGGTGTGrpr Fwr CGACTCTGTTGCGGGAGGrpr Rev GGCTTGCGATATTTGCCGGAgrim Fwr GTCGGAGTTTGGATGCTGGGgirm Rev AGTCACGTCGTCCTCATCGTzfh1 Fwr ACGAGCAGAGCAACATGAGCzfh1 Rev CGGCGACATTTTGTTAGCACzfh2 Fwr TGCACACACAACAGATGCGTzfh2 Rev GCACAGCTGACAAAGGAGCA
FwrRev
Act5C Fwr GGCGCAGAGCAAGCGTGGTAAct5C Rev GGGTGCCACACGCAGCTCAT
Tub84B Fwr TGGGCCCGTCTGGACCACAATub84B Rev TCGCCGTCACCGGAGTCCAT
RpL32 Fwr AAGCGGCGACGCACTCTGTTRpL32 Rev GCCCAGCATACAGGCCCAAGRpL13A Fwr AGCTGAACCTCTCGGGACACRpL13A Rev TGCCTCGGACTGCCTTGTAG
HousekeepingHousekeepingHousekeepingHousekeepingHousekeeping
HousekeepingHousekeepingHousekeeping
kaykay
CGAATAGCAAGAATCAGCTGGAGTACTGTCGTTGCTGTTGTGGTTGT
Dev
elo
pmen
t • S
uppl
emen
tary
info
rmat
ion
Development 143: doi:10.1242/dev.132340: Supplementary information

Supplementary Figures Supplementary Figure 1. Experimental procedures
(A) Time line of development and induction of cell ablation by eiger-expression as a function of rearing temperature. Flies were raised at 18°C (blue) and transferred to 30°C (orange) for
40 hours to induce eiger-expression and cell ablation (CA) in wing imaginal discs. CA was
Dev
elo
pmen
t • S
uppl
emen
tary
info
rmat
ion
Development 143: doi:10.1242/dev.132340: Supplementary information
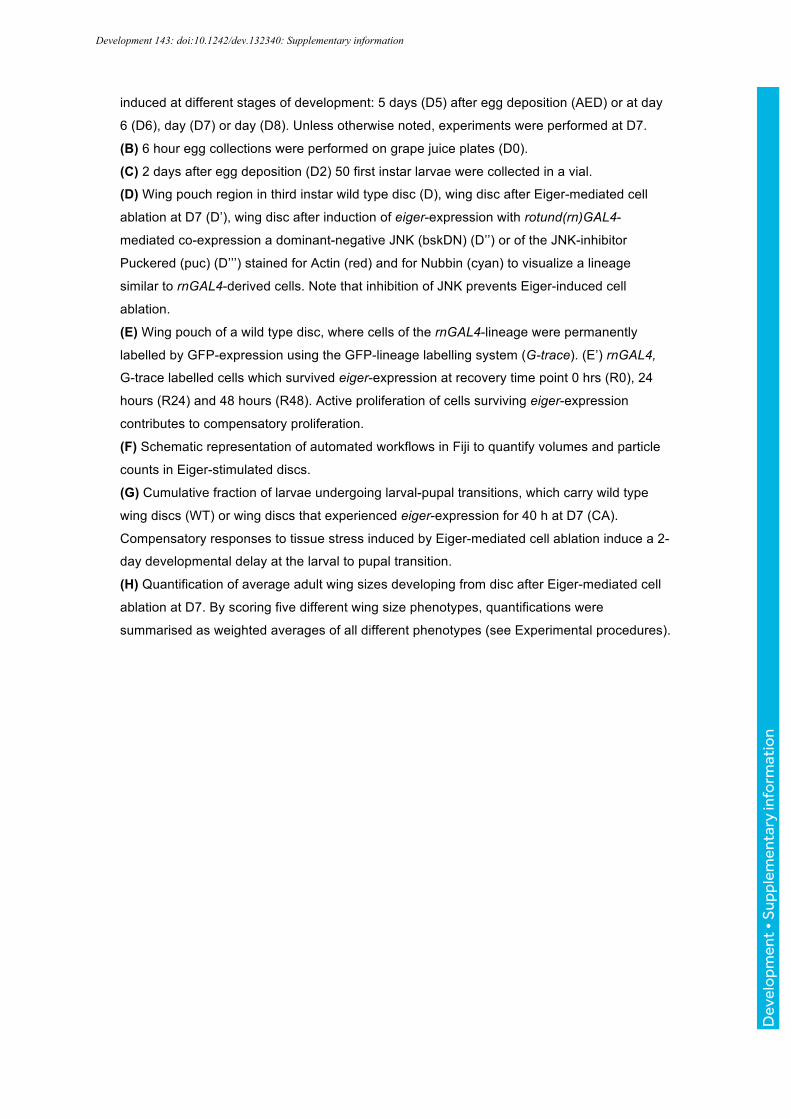
induced at different stages of development: 5 days (D5) after egg deposition (AED) or at day
6 (D6), day (D7) or day (D8). Unless otherwise noted, experiments were performed at D7.
(B) 6 hour egg collections were performed on grape juice plates (D0). (C) 2 days after egg deposition (D2) 50 first instar larvae were collected in a vial. (D) Wing pouch region in third instar wild type disc (D), wing disc after Eiger-mediated cell ablation at D7 (D’), wing disc after induction of eiger-expression with rotund(rn)GAL4-
mediated co-expression a dominant-negative JNK (bskDN) (D’’) or of the JNK-inhibitor
Puckered (puc) (D’’’) stained for Actin (red) and for Nubbin (cyan) to visualize a lineage
similar to rnGAL4-derived cells. Note that inhibition of JNK prevents Eiger-induced cell
ablation.
(E) Wing pouch of a wild type disc, where cells of the rnGAL4-lineage were permanently labelled by GFP-expression using the GFP-lineage labelling system (G-trace). (E’) rnGAL4,
G-trace labelled cells which survived eiger-expression at recovery time point 0 hrs (R0), 24
hours (R24) and 48 hours (R48). Active proliferation of cells surviving eiger-expression
contributes to compensatory proliferation.
(F) Schematic representation of automated workflows in Fiji to quantify volumes and particle counts in Eiger-stimulated discs.
(G) Cumulative fraction of larvae undergoing larval-pupal transitions, which carry wild type wing discs (WT) or wing discs that experienced eiger-expression for 40 h at D7 (CA).
Compensatory responses to tissue stress induced by Eiger-mediated cell ablation induce a 2-
day developmental delay at the larval to pupal transition.
(H) Quantification of average adult wing sizes developing from disc after Eiger-mediated cell ablation at D7. By scoring five different wing size phenotypes, quantifications were
summarised as weighted averages of all different phenotypes (see Experimental procedures).
Dev
elo
pmen
t • S
uppl
emen
tary
info
rmat
ion
Development 143: doi:10.1242/dev.132340: Supplementary information

Supplementary Figure 2. Eiger-expression enables functional studies of JNK-dependent tissue stress responses
(A) FACS analysis of rnGAL4, G-trace-labelled cells expressing GFP in wild type (A) and in wing disc after Eiger-mediated cell ablation (A’). Data is plotted as a function of GFP-levels
and forward scatter (FCS). To quantify the relative number of rnGAL4, G-trace-labelled cells
that survive (A’’), we made use of the following equation X = (CAGFP+* WTGFP-) / (CA GFP- *
WTGFP+).
(B) FACS analysis of cells expressing the JNK reporter TRE-GFP in a wild type disc (B) and a wing disc after Eiger-mediated cell ablation (B’). Data is plotted as a function of GFP-levels
and forward scatter (FCS).
(C, D) Wing pouch of discs expressing the JNK-reporter TRE-GFP (cyan in overlay), co-stained for DAPI or Actin (red in overlay). Discs were subjected to transient cell ablation
driven by rnGAL4, UAS-reaper (rn>rpr) (C) or by patched(ptc)GAL4, UAS-reaper (ptc>rpr)
(D). Compare to Fig.1B, C.
(E) Quantification of BrdU-positive events within Eiger-stimulated discs at R0 (n= 8 discs) and R24 (n= 6 discs).
Graphs display mean ± S.E.M. U-tests were performed to test for statistical significance (*
p<0.05, ** p<0.01, *** p<0.001).
All scale bars: 100 µm.
Dev
elo
pmen
t • S
uppl
emen
tary
info
rmat
ion
Development 143: doi:10.1242/dev.132340: Supplementary information

Supplementary Figure 3. Eiger-induced tissue damage activates JAK/STAT signalling and tissue stress responses
(A) Wing pouch in Eiger-stimulated discs (CA) expressing the JAK/STAT-reporter 10XSTAT-dGFP (cyan in overlay), stained for DAPI or Actin (red in overlay).
(B-D) Wing pouch after eiger-expression was induced at developmental day 5 (B), day 7 (C) or day 8 (D) and imaged at R24. Discs express the JAK/STAT-reporter 10XSTAT-dGFP (cyan
Dev
elo
pmen
t • S
uppl
emen
tary
info
rmat
ion
Development 143: doi:10.1242/dev.132340: Supplementary information

in overlay) and were stained for DAPI or Actin (red in overlay). Overlay images obtained at R0
are shown for comparison (B’-D’).
(E) Wing pouch after transient cell ablation (CA) was induced by rnGAL4, UAS-reaper (rn>rpr). Disc expresses the JAK/STAT-reporter 10XSTAT-dGFP (cyan in overlay), and was
stained for DAPI and Actin (red in overlay). Compare to Fig. 2A.
(F, G) Wing discs after Eiger-stimulated cell ablation (CA) induced on D7 (F) or D8 (G). Discs expressing the JNK reporter TRE-GFP (cyan in overlay) were stained for Actin and for
Cleaved Caspase-3 (cCasp3, red in overlay) to visualize apoptotic cells.
(H) Incident analysis of larva-to-pupal transition timing as well as adult eclosion timing in wild type animals and in animals where eiger-mediated CA was induced at D5, D6, D7 or D8.
(I) Quantification of average adult wing sizes developing from disc after eiger-mediated cell ablation was induced at D5, D6, D7 or D8.
All scale bars: 100 µm.
Dev
elo
pmen
t • S
uppl
emen
tary
info
rmat
ion
Development 143: doi:10.1242/dev.132340: Supplementary information

Supplementary Figure 4. JAK/STAT activation is not required for compensatory proliferation
(A, B) Nuclear counts of G-trace labelled cells (B) and quantification of pH3-positive mitotic events within G-trace labelled cells (A) in ablated discs (CA) and ablated discs with rnGAL4-
mediated co-expression of domeΔcyt or dome RNAi at R0 (for all samples n=3) in eiger-
expressing cells.
(C, D) Quantification of pH3-positive, mitotic events per disc (A) and of total wing disc (WID) volume (B) at R0 and R24 after Eiger-stimulation. Wild type discs (CA) (R0 n=16, R24 n=12
discs) and discs with rnGAL4-mediated co-expression of domeΔcyt (R0 n= 8, R24 n=12 discs),
dome RNAi (R0 n=8, R24 n= 9 discs) or Socs36E (R0 n= 6, R24 n= 6 discs) in eiger-
expressing cells were quantified.
Graphs display mean ± S.E.M. U-test was run to check for statistical significance (* p<0.05 ;;
** p<0.01 ;; *** p<0.001).
Dev
elo
pmen
t • S
uppl
emen
tary
info
rmat
ion
Development 143: doi:10.1242/dev.132340: Supplementary information

Supplementary Figure 5. JAK/STAT activity is required for survival of Eiger-stimulated cells
(A) Knock-down efficiency of UAS-RNAi transgenes targeting dome, hop and Stat92E was quantified by qRT-PCR. Wing imaginal discs expressing the constructs continuously under
the control of rnGAL4 were compared to wild type wing discs. Only about 25% of the total
discs used for this analysis drives expression by rnGAL4 (see Fig. S2A). Therefore the
maximum expected reduction of transcript levels at 100% RNAi efficiency is only 25% (blue
dashed line). Each graph shows mean ± S.E.M for n=2 biological replicates.
(B-E) Wild type wing disc (B) and wing discs with rnGAL4-driven expression of dome RNAi (C), hop RNAi (D) or Stat92E RNAi (E) induced at D7 for 40 hours were stained for Actin (red)
and for Cleaved Caspase-3 (cyan) to visualize apoptotic cells. Maximum projections of entire
image stacks are shown.
Graphs display mean ± S.E.M. U-tests were performed to test for statistical significance (*
p<0.05, ** p<0.01, *** p<0.001).
All scale bars: 100 µm.
Dev
elo
pmen
t • S
uppl
emen
tary
info
rmat
ion
Development 143: doi:10.1242/dev.132340: Supplementary information

Supplementary Figure 6. A survival-promoting function of JAK/STAT is mediated by Zfh2
(A-B) Wild type wing disc (E) and wing disc heterozygous for Df(3L)H99 (F) after Eiger-stimulated cell ablation were stained for Actin. Image in (E) also displays haltere and leg discs
associated with the larger wing disc on the right.
(C-D) ‘Flip-out’ clones positively marked by expression of UAS-GFP under the control of
Act5C-GAL4 (GFP clones, cyan in overlay) in wing discs stained for Zfh2 (red in overlay).
Dev
elo
pmen
t • S
uppl
emen
tary
info
rmat
ion
Development 143: doi:10.1242/dev.132340: Supplementary information

Clones were either wild type (C) or expressed a dominant active form of Hop (UAS-hopTumL)
(D). Yellow arrowheads indicate ectopic expression of Zfh2 in HopTumL expressing clones.
(E-F) Ablated discs (E) and ablated discs also heterozygous for STAT92E85c9 (F) were stained for DAPI and Zfh2. Maximum-projection images of the confocal stacks are shown.
(G) Pixel counts of Zfh2 fluorescence intensity quantified in stainings on ablated discs (gray line) and ablated discs also heterozygous for STAT92E85c9 (orange line). Each curve
represents the average of n=3 independent measurements ± S.E.M.
(H) Wing disc expressing a RNAi construct targeting zfh2 under the control of ptcGAL4. The disc was stained for Zfh2, confirming that Zfh2 signals disappeared in the ptc domain (yellow
arrowheads, H, H’). Transverse section confirms loss of Zfh2 in the ptc domain (H’’).
(I-L) Wild type wing disc (H), wing disc after Eiger-stimulation (I) and wing disc after Eiger-stimulation with rnGAL4-mediated co-expression of Zfh1 (J) and p35 (K) stained for DAPI
(cyan) and Actin (red).
All scale bars: 100 µm unless otherwise noted.
Dev
elo
pmen
t • S
uppl
emen
tary
info
rmat
ion
Development 143: doi:10.1242/dev.132340: Supplementary information
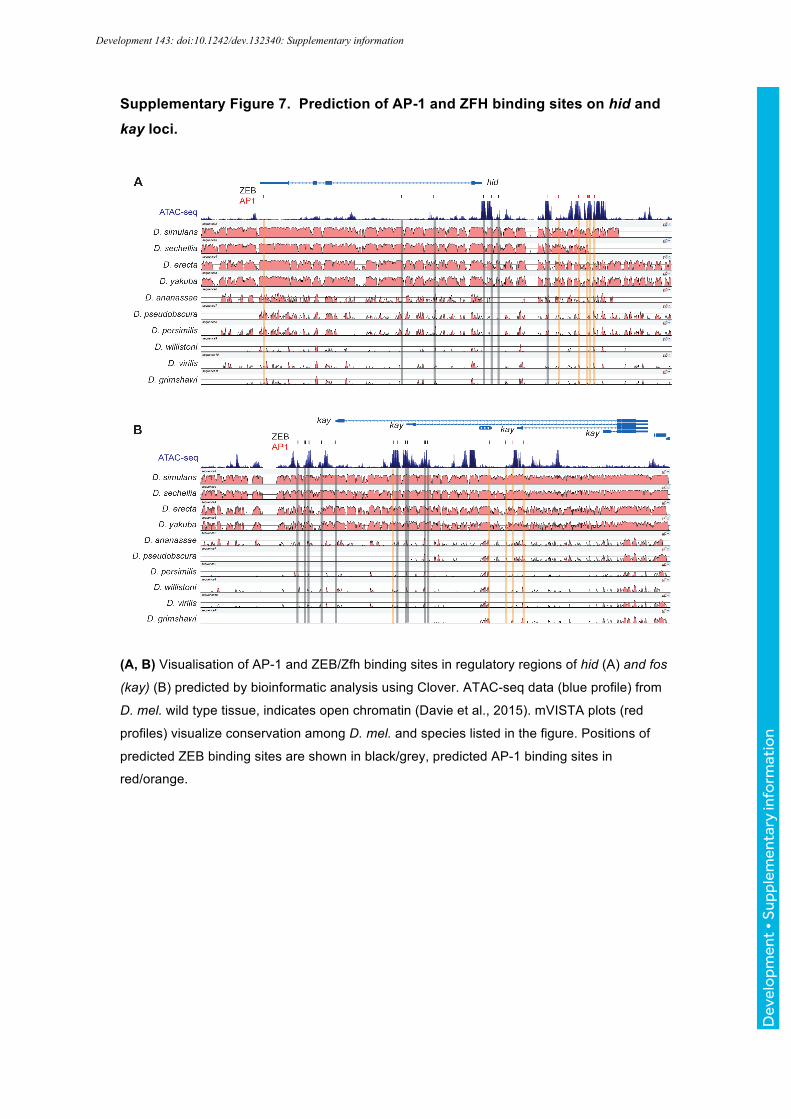
Supplementary Figure 7. Prediction of AP-1 and ZFH binding sites on hid and kay loci.
(A, B) Visualisation of AP-1 and ZEB/Zfh binding sites in regulatory regions of hid (A) and fos (kay) (B) predicted by bioinformatic analysis using Clover. ATAC-seq data (blue profile) from
D. mel. wild type tissue, indicates open chromatin (Davie et al., 2015). mVISTA plots (red
profiles) visualize conservation among D. mel. and species listed in the figure. Positions of
predicted ZEB binding sites are shown in black/grey, predicted AP-1 binding sites in
red/orange.
Dev
elo
pmen
t • S
uppl
emen
tary
info
rmat
ion
Development 143: doi:10.1242/dev.132340: Supplementary information

Supplementary Figure 8. JAK/STAT activity prevents excessive tissue damage in response to tissue stress
(A) Representative adult wings developing from wing discs having driven rnGAL4-mediated expression of UAS-transgenes at D7 or in genetic backgrounds heterozygous for domeG0441,
hop34, or Stat92E85C9 alleles (left column). Representative adult wings developing from wing
disc having driven eiger-expression and rnGAL4-mediated co-expression of UAS-transgenes
at D7 or in genetic backgrounds heterozygous for domeG0441, hop34, or Stat92E85C9 alleles
(right column).
Dev
elo
pmen
t • S
uppl
emen
tary
info
rmat
ion
Development 143: doi:10.1242/dev.132340: Supplementary information

(B) Quantification of 3 adult wing size classes developing from wing discs expressing GFP or GFP together with an RNAi-construct targeting hop in the posterior compartment. All wing
discs were injured during larval development by targeted pinching using forceps.
(C-E) Wing disc after after Eiger-mediated cell ablation (CA) (C) and discs combined with rnGAL4-mediated co-expression of domeΔcyt (B) or dome RNAi (C) in eiger-expressing cells,
imaged at R0 (C-D) and R24 (C’-E’) expressing the dILP8-GFP reporter (cyan) and stained for Actin (red).
(F) Cumulative fraction of larvae undergoing larval-pupal transitions, which carry control discs (MS1096GAL4/+) and discs expressing upd or upd2 under the control of MS1096GAL4.
Graph shows mean ± S.D. for average scores from at least 3 independent experiments.
Dev
elo
pmen
t • S
uppl
emen
tary
info
rmat
ion
Development 143: doi:10.1242/dev.132340: Supplementary information

Supplementary Figure 9. Models of how a survival-promoting function of JAK/STAT contributes to restoration of tissue homeostasis
(A) Cells that activate JNK signalling in response to tissue stress induce compensatory responses as well as injured-induced apoptosis. JAK/STAT activates Zfh-2 to repress hid and
fos (kay), thereby limiting strong JNK-activation and Hid-induced apoptosis. Suppression of
apoptosis limits the extent of tissue damage and promotes compensatory responses by cells
surviving JNK activation. This facilitates activation of compensatory proliferation and induction
of development delays.
(B) Non-autonomous activation of JNK and of JAK/STAT creates two differently sloped signalling gradients from the site of damage (cell ablation (CA) in the pouch centre (PC)). A
low JNK/JAKSTAT ratio induces apoptosis, whereas a high low JNK/JAKSTAT ratio promotes
survival.
(B’) If the JAK/STAT signalling gradient is disturbed (f.e. by heterozygosity for JAK/STAT components) all cells with JNK signalling have a low JNK/JAKSTAT ratio, making them more
likely to die. Higher levels of apoptosis near the site of damage (PC) induce stronger non-
autonomous activation of JNK, which in turn induces apoptosis at sites more distant to the
initial damage. This feed-forward loop, unrestrained by loss of JAK/STAT activity, drives
spatial expansion of JNK signalling and apoptosis, thereby increasing the extent of tissue
damage and limiting the ability of the tissue to induce regenerative responses.
Dev
elo
pmen
t • S
uppl
emen
tary
info
rmat
ion
Development 143: doi:10.1242/dev.132340: Supplementary information

References
BRAY, N., DUBCHAK, I. & PACHTER, L. 2003. AVID: A global alignment program.
Genome Res, 13, 97-‐‑102.
DAVIE, K., JACOBS, J., ATKINS, M., POTIER, D., CHRISTIAENS, V., HALDER, G. &
AERTS, S. 2015. Discovery of Transcription Factors and Regulatory
Regions Driving In Vivo Tumor Development by ATAC-‐‑seq and FAIRE-‐‑seq
Open Chromatin Profiling. PLoS Genet, 11, e1004994.
DE LA CRUZ, A. F. & EDGAR, B. A. 2008. Flow cytometric analysis of Drosophila
cells. Methods Mol Biol, 420, 373-‐‑89.
FRAZER, K. A., PACHTER, L., POLIAKOV, A., RUBIN, E. M. & DUBCHAK, I. 2004.
VISTA: computational tools for comparative genomics. Nucleic Acids Res,
32, W273-‐‑9.
FRITH, M. C., FU, Y., YU, L., CHEN, J. F., HANSEN, U. & WENG, Z. 2004. Detection of
functional DNA motifs via statistical over-‐‑representation. Nucleic Acids
Res, 32, 1372-‐‑81.
MATHELIER, A., ZHAO, X., ZHANG, A. W., PARCY, F., WORSLEY-‐‑HUNT, R.,
ARENILLAS, D. J., BUCHMAN, S., CHEN, C. Y., CHOU, A., IENASESCU, H., LIM,
J., SHYR, C., TAN, G., ZHOU, M., LENHARD, B., SANDELIN, A. &
WASSERMAN, W. W. 2014. JASPAR 2014: an extensively expanded and
updated open-‐‑access database of transcription factor binding profiles.
Nucleic Acids Res, 42, D142-‐‑7.
SMITH-‐‑BOLTON, R. K., WORLEY, M. I., KANDA, H. & HARIHARAN, I. K. 2009.
Regenerative growth in Drosophila imaginal discs is regulated by
Wingless and Myc. Dev Cell, 16, 797-‐‑809.
Dev
elo
pmen
t • S
uppl
emen
tary
info
rmat
ion
Development 143: doi:10.1242/dev.132340: Supplementary information