~/j~/9j ~~~ title
TRANSCRIPT

-D .J 2 g ce .'J /) ±
Title:
~/J~/9J ~~~ y A Model for the Effective Diffusion of Gas or the Vapor Phase in a Fractured Media Unsaturated Zone Driven by Periodic Atmospheric Pressure Fluctuations
L!f- t1R--l~-¥E7t Author(s}:
ErikL. Void RECEtV·ED fEB 141997
0&-l"l
Submitted to: U.S. Department of Energy, as support documentation for the
· Los Alamos Area G Performance Assessment
.;SIIll1Jll1101! OF THIS llOC!,\\!ENT IS UNUMITED
Los Alamos NATIONAL LABORATORY
Los Alamos Nallcnal Laboratory, an affinnatlve actlonlequal cpporbDty employer, Is operated l7f the UnlveJSlty of Callfomla for the
U.S. Depa11ment of Energy I.Klder contract W-7405-ENG36.. By accep1anae of this article, the pltilsher recognizes that the U.S.
Government retains a nonexclusive, royalty-f188llcense to pttilsh or rep!Oduce the pU:lllshed form of this contribution, or to allow
olheJS to do so, for U.S. Government pcuposes. Los Alamos National Laboratocv raauests thAt thA I!Uhii<~N>r ttfAntlfu thl .... ..w ..
as work petfocmecl LIICier the auspices of the U.S. Department of Energy
academic freedcm and a researcher's right to ptjlllsh; as an lnstltutlon;h of a pWilcatlon or guarantee Its tecMic81 correctness.
11111111111111111111111111111111111 11392
Fonn 836 (10196)

A Model for the Effective Diffusion of Gas or the Vapor Phase in a Fractured Media Unsaturated Zone Driven by Periodic Atmospheric Pressure
Fluctuations
Erik L. Vold Los Alamos National Laboratory, Los Alamos, NM
Contents
Abstract ........................................................................................................................... ! Introduction ............................................................ : ..................................................... 2 Model Derivation ........................................................................................................ 3
Vapor Flux ......................................................................................................... 3 Pressure Fluctuations ...................................................................................... 6 Effective Diffusion ........................................................................................... 8 Permeability Considerations ......................................................................... 15
Model Evaluation ........................................................................................................ 17 Reference Matrix Permeability ...................................................................... 17 Effective Permeability due to Fractures ....................................................... 20
Discussion ...................................................................................................................... 22 Effective Permeability ..................................................................................... 22 Fracture Presence and In-situ Diffusion Observations ............................ 24 Diffusion Isotropy ............................................................................................ 24 Enhanced Diffusion with Hydrodynamic Dispersion ............................. 25 Diffusion Model Validity ............................................................................... 25 Application of Result ...................................................................................... 26
Summary ....................................................................................................................... 29
Acknowledgments ....................................................................................................... 31 Nomenclature Table ................................................................................................... 32 References ...................................................................................................................... 34
Acknowledgments ....................................................................................................... 30 Nomenclature Table ................................................................................................... 31 References ...................................................................................................................... 33
--_--..,.-----::;-~~·~--:-:-:..,.---.~ •. -.. •. , -__ ....,;-:_,,-_-.. -=-. -,..,..,,....,....-_.,...._,-:,-----:-~-,--_,....._~~------ .

DISCLAIMER
Portions of this document may be illegible in electronic image products. Images are produced from the best available original document. ·

A Model for the Effective Diffusion of Gas or the Vapor Phase in a Fractured Media Unsaturated Zone Driven by Periodic Atmospheric Pressure
Fluctuations
Erik L. Void Los Alamos National Laboratory, Los Alamos, NM
Abstract There is evidence for migration of tritiated water vapor through the
tuff in the unsaturated zone from the buried disposal shafts located on a narrow mesa top at Area G, Los Alamos, NM. Field data are consistent with an effective in-situ vapor phase diffusion coefficient of l.Sxl0-3 m5 Is, or a factor of 60 greater than the binary diffusion coefficient for water vapor in air. A model is derived to explain this observation of anomolously large diffusion, which relates an effective vapor or gas phase diffusion coefficient in the fractured porous media to the subsurface propagation of atmospheric pressure fluctuations (barometric pumping). The near surface (unattenuated) diffusion coefficient is independent of mode period under the simplified assumptions of a complete 'mixing mechanism' for the effective diffusion process. The unattenuated effective diffusion driven by this barometric pumping is proportional to an average media permeability times the sum of the square of pressure mode amplitudes, while the attenuation length is proportional to the square root of the product of permeability times mode period. There is evidence that the permeability needed to evaluate the pressure attenuation length is the in-situ value, approximately that of the matrix. The diffusion which results using Area G parameter values is negligible in the matrix but becomes large at the effective permeability of the fractured tuff matrix. The effective diffusion coefficient predicted by this model, due to pressure fluctuations and the observed fracture characteristics, is in good agreement with the observed in-situ diffusion coefficient for tritium field measurements. It is concluded that barometric pumping in combination with the enhanced permeability of the fractured media is a likely candidate to account for the observed in-field migration of vapor in the near surface unsaturated zone at Area G. The model results imply that vapor flux through fracture apertures is potentially an order of magnitude larger than the vapor flux through the matrix.
1
•' . .... •'

Introduction
Low level radioactive waste disposal occurs in Los Alamos at Area G, located on the top of a long and narrow finger mesa, with a cross-section width varying in the range from 400 ft to 1000 ft, and an average height of about 100 feet above the adjacent canyon floors. The mesa interior is a complex layered stratigraphy, composed of Bandalier Tuff resulting from volcanic and ash flows [Krier, et.al.95]. The tuff is highly fractured throughout the mesa volume, and much of the tuff matrix has a very low moisture content (<4% volumetric). Vapor phase transport has long been hypothesized as a dominant contributor to the drying of the mesa interior [IT,87]. Recent liquid flux analyses [Vold,96A], vapor flux analyses [Vold,96B] and chloride ion profile analyses [Newman,96] are consistent with this hypothesis and provide estimates of the magnitude of the liquid and vapor flux throughout the mesa. Understanding these fluxes and their magnitudes is essential to the Performance Assessment of the. site [Hollis,et.al.,95] as required per U.S. Department of Energy Order 5820.2A.
Field data on the migration of tritiated water vapor from disposal shafts at Area G through the unsaturated zone are consistent with an effective in-situ vapor phase diffusion coefficient of 1.5xl0-3 m2 Is [Void and Eklund,96], or a factor of 60 greater than the binary diffusion coefficient for water vapor in air. This empirically determined vapor phase diffusion coefficient was used to estimate the vapor flux in the mesa [Vold,96B], although the physical basis for the diffusion of this magnitude was not previously determined. It is important to understand the underlying mechanisms behind the I enhanced I in-situ diffusion in order to understand the implications for contaminant transport from the disposal facility through the unsaturated zone to the environment. A review of the literature related to enhanced diffusion due to barometric pumping is discussed and included in the references to [Neeper,91].
In this study, a model is proposed for an effective diffusion of vapor or gas phase contaminants in a fractured porous media driven by atmospheric pressure fluctuations. The governing equations are derived and then evaluated for the field parameters appropriate to Area G. The derivation is
2

intended to briefly outline the model while being sufficiently rigorous so that
the results provide a quantitative estimate of the effective diffusion process.
The effective diffusion coefficient resulting in the model is compared
to the effective vapor phase diffusion coefficient observed in the tritium field
study. It will be seen that there is good agreement between the model result
and the field observations when the effective permeability of the fractured
media is included. This supports the conclusion that the model may
incorporate the essential physics of the observed in-situ diffusion. In the
present model, a convective displacement distance is calculated for each
mode period of the imposed periodic pressure oscillation and a self-consistent
effective diffusion is determined. This is in contrast to a recent investigation
[Auer,et.al.95] in which the displacement distance is considered to be a
dispersion length, an independent empirically determined value.
Model Derivation
Vapor Flux The continuity equation for the vapor density, Pvr in a porous media
with an 'air-filled volumetric fraction', ea, is
= (1)
where the source term, Sv, can be used to characterize changes due to phase
exhange (condensation or evaporation) or media exchange (e.g., rock matrix
to fracture matrix). The vapor phase flux of moisture in the porous media,
rv, can be written
(2}
where Dv is a total effective diffusion coefficient which incorporates ea and
contains contributions from classical diffusion in a porous media and from
diffusion driven by fluctuations in gradient force terms. This can include
barometric pumping in an environment subject to atmospheric pressure
fluctuations, as detailed in this report.
The mean vapor flow is equal to the air flow, Ua, in a porous media
driven by the pressure gradient and derived as the solution to the
momentum equation for the total gaseous and vapor phase. This is given as
3
... ' & • .~ r • ' ~ , ... ·

Ua = - ~v f1E p (3)
where Kp is the media permeability [m2], f.L is viscosity for the air phase, e is
the porosity and p is the atmospheric pressure. The pressure gradient and
thus the mean velocity are fluctuating quantities and average to zero over
time. The gradient in vapor density, Pv in Eqn.2, can be written in terms of
vapor pressure, pv, noting the ideal gas law, Pv = Mvnv = Mvpv/RT. The air
and vapor temperatures, T, are the same to a good approximation at a given location within the porous media. It is convenient to express the vapor
density in terms of the saturated vapor pressure, p5, because this is a sensitive
function of temperature and dominates the temperature dependence of the
vapor density. Assuming the temperature dependence is approximated by
that of the saturated vapor pressure (or 1/T is approximately constant over the environmental range of T) then one can write
Vpv ~Tv (Pv) = ;r; v(~:)Ps) . (4)
A static equilibrium shows PviPs - exp(hm/hc), where he = RT!Mvg = 13,300m and hm is the matric potential magnitude expressed as a (water)
height. The values indicate that PviPs - 1 within most porous media under environmental conditions. As detailed previously [Vold,96B], the slight
departure from unity is important in determining the dependence upon the
gradient in matric potential, hm. Substituting the static equilibrium into this
last equation, the gradient of the vapor flux, V Pv, can be written
approximately as
(5)
or expanding in terms of the gradients in the field quantities, T and 8,
.... Mv (dps VT + Psdhm vo). RT dT he dO (6)
The diffusive component of the vapor flux, Tvo, can then be written
4
• :; ,-. '. • - ~.... .t ... , •• • r,. • - .~ ... • ...

(7)
A similar expression was derived in [Philips and de Vries,57]. This is combined with the convective air flow to give an expression for the total vapor phase moisture flux in terms of gradients in three state variables for the vapor: pressure, temperature and moisture content,
(8) J5.p_ Mv dps Mv psdhm
Tv = - 8aPv J1E Vp - Dv(T) RT dT VI' - Dv(BJ RT he dO V8.
The diffusion coefficient, Dv, has been written as two different factors to account for the possibility of different values driving the temperature and moisture gradient terms.
Each diffusion coefficient will be expressed as a sum of two terms, one related to classical diffusion, D0, and one to a 'fluctuation enhanced' diffusion coefficient, D05, due to temperature or pressure oscillations. The diffusion coefficient for flux with respect to the gradient in either temperature or moisture content, Dv(T-e), is then written as
Dv(T-9) = 8a Do + D (T ,, OS -9,, qJ
(9)
where qJ is a tortuosity factor, typically taken to be about 2 [Koorevaar,et.al.,83]. The classical diffusive component is expected to be similar fqr the gradients in temperature or moisture content. It is the fluctuation enhanced diffusion which will be shown to be different for the temperature and moisture gradient terms, thus, the distinct coefficients, Dv(T) and Dv(6)· It is common in the literature to see enhanced diffusion effects incorporated as a multiplying factor times the classical diffusion [Philip and de Vries,57], however, the present analysis indicates these diffusive mechanisms should be treated as separate terms.
5

Based on field observations at Area G, the moisture gradients (as in Eqn.8) vary slightly or not at all below about 2m from the surface, and so for this study they are considered to be approximately steady state profiles. The pressure and temperature gradients are considered to be periodic functions in time driven by surface fluctuations which propagate down into the subsurface region. Pressure modes are dominated by periods of one year and approximately one week while temperature fluctuations contain predominantly daily and annual modes. These fluctuation spectra were quantified previously [Vold,96C].
Pressure Fluctuations Pressure fluctuations propagate through the subsurface according to a
transient diffusion equation. Assuming isothermal conditions, pressure can be substituted for density in the continuity equation, and combined with the porous media velocity (Eqn.3) to obtain this diffusion equation for the pressure fluctuations, p,
(10)
where the air pressure has been linearized into a steady and fluctuating term, p a = p0 + p. This defines the diffusion coefficient for the pressure fluctuations, Dp, as
(11)
This diffusion coefficient is approximated as a constant in space, and a periodic boundary condition is applied of the form, p = Llpm sin(2nt/-rm), where 8.pm and 'tm are, respectively, the amplitude and period for a particular mode of the pressure fluctuations at the ground surface boundary. Surface fluctuations in pressure can be expressed as a Fourier series, a sum over periodic modes. The analytic solution to Eqn.lO in 1-D [Carslaw and Jaeger,59] for these periodic surface variations in pressure which propagate a distance, z, into a semi-infinite medium is
6
------- .. ---.-;:·----,---_.,-._.,. __ ,.. __ -....----. -::-_ .-:-.. --.,,....,_,~,..._-....,.-..,._..--,---.,...--,.....,.----- ----- -

p = (12)
where the attenuation length for each pressure mode, Lpmr is
Lpm = (13)
Propagation into a finite medium, as might be expected for an unsaturated zone bounded at the bottom by a saturated zone which is relatively impermeable to air, is described by a more complex function [Auer,et.al.,95]. Quantitatively, the near surface results for that solution are nearly identical to the exponential form in Eqn.12, when the saturated zone is deep relative to the depths of concern and to the mode length of interest. It is the near surface region of interest in this study (<100ft depths, compared to the depth to the saturated aquifer at Area G of about 900 feet) and so the simpler exponential solution form above is used.
For the periodic surface variations in pressure propagating into a semiinfinite medium, the solution to the pressure diffusion equation (Eqn.12) can be substituted into the expression for air velocity in the porous media (Eqn.3) to obtain the result for the velocity at depth, ua(z,t), driven by the surface fluctuations in pressure. The result, by analogy to the heat flux problem [Chapman,74], is
lla(z,t) = _ _& Vp f.l£
00
(14)
= .y2!JL L ((L!pm/Lm) e-z/Lpm sin(2nt/-rm- X/Lm + rr/4)) f.l£ m=l
which applies to the velocity component along the axis of the pressure gradient.
The distance that the air moves through the porous media by the pressure driven convective motion during each period, 'rm, is called the
7

pressure mode displacement distance, dpm 1 evaluated as an average
magnitude of the displacement over the period. The average half cycle
displacement, dhm1 is approximately d~zm ~ llm't:m, and is evaluated more
accurately as an integral over time for the convective motion at any depth,
dhm = 't:m/2
J U0m(Z) sin(2nt/-r:m) dt = 0
2 Uom 't:m , (15)
where u0 m(z) is a maximum amplitude at a given depth. The phase shift is ignored because we are interested only in the magnitude of the oscillation at
·some specific depth. Ignoring the phase is a reasonable approximation for a
few limited discreet modes, e.g., the one year and one week periods which
dominate the observed atmospheric pressure fluctuations [Vold,96C], provided that the power for the displacement in each mode is correctly
derived from the spectral distribution of pressure fluctuation data. Ignoring the phase is not accurate for quantitative analysis where many modes with
similar periods play a role, such as in reconstructing a particular time series of
pressure fluctuation data [Neeper,et.al.,96], however, it is adequate for the
present analysis. During the second half of the convective displacement cycle, the flow
direction reverses, and the same displacement occurs in the opposite
direction so that the pressure mode displacement distance over the full
convective cycle for a particular mode becomes
Effective Diffusion
4 Uom(Z) 't:m
7r (16)
A mass diffusion coefficient, D, can be expressed as a characteristic step size, d, times a mass speed, u, or
D - du, (17)
which applies under appropriate conditions where a 'mixing mechanism'
exists. An effective diffusion process can result when the periodic fluctuating
8
.... , '. '"· .. ·~- . -.' ' -: . .. ..

velocity occurs in the presence of a gradient in the quantity to be diffused. In
the pressure driven periodic convective process, the parameters required for a
diffusion-like mechanism, a characteristic step size, d, and a mass speed, u,
correspond to a mode displacement distance, dm, and an average mass flow
speed related to the magnitude of the fluctuating velocity, ua(z). The 'mixing
mechanism' in the porous media flow is assumed to be generated by classical
diffusion across the laminar velocity profile within the pore spaces of the
medium, and also by diffusion between pore spaces of varying connectivity.
This molecular diffusion is a fast process relative to the pressure driven
convective motion given in Eqn.14. Another mechanism possibly
contributing to this 'mixing' is the superposition (and relative phase) of
harmonic and non-harmonic modes on top of the fundamental mode in the
spectral distribution of fluctuations.
An additional condition for the effective diffusion process to occur is
that the mode displacement distance, dm, should be small compared to the
mode attenuation length for the driving force, Lm. Analyses indicate that the
ratio, dm/Lm, is independent of mode period, 7:m, for the pressure gradient
driven flux (as seen in the following) and also for the temperature gradient
flux (Eqn.8). For the temperature gradient flux, it is always true (work in
progress) that dym/Lym >> 1, and so enhanced diffusion due to temperature
fluctuations does not occur. On the other hand, the inequality indictates that
significant convection over each period cycle can occur throughout the
porous region where the temperature fluctuations penetrate. This is
restricted to the near surface (LT < 2-4m, typically) and has been discussed in
detail [Milly,96].
For pressure fluctuations it is shown here that dpm/Lpm << 1, for the
permeability values associated with the Area G subsurface tuff material.
Referring to Eqn.14 and 15, the maximum near-surface (unattenuated, or z =
0) mass convection speed associated with a particular perturbation velocity
mode, u0m(z=0) can be approximated as
(18)
Using this with Eqn.16, the ratio of the near surface mode displacement
distance to the attenuation length is
9
--~--~~------~----~-.~.~ .. ~ .. ~.~.---;-,-.~~~---,-,.~.--------~-------

4 Uom 'l:m
n:Lm = (19)
It will become an important issue in matching the model results with field
data as discussed later to distinquish two values for the 'in-situ volume
average' permeability. One value of Kp is used to evaluate the displacement distance in Eqn.19 which will be denoted as Kpd, while the second
permeability will be used to evaluate the attenuation length and will be
denoted KpL· With this consideration, Kp = Kpa, in Eqn.19 while Kp = KpL in Lpm from Eqn.13. Equation 19 is then rewritten using Eqn.13 as
_ r;;;;- Kpd 11pm "'J ;)L. K .
pL Po (20)
Under the condition that the permeabilities are the same, Kpd = KpL1 then the ratio of lengths is just proportional to the ratio of magnitudes of the pressure
fluctuation to the steady ambient pressure. Since these are typically 1 mbar and 800mbar (at LANL 7000 ft elavation) the ratio of lengths is much less than
unity, provided the permeabilities do not differ greatly. Under these
conditions, enhanced diffusion due to pressure fluctuations could occur.
As discussed, the diffusion coefficient from this pressure driven
periodic convective process for a particular mode, Dpm1 is the displacement
step size, dpm, times an average displacement mode speed, Um(Z),
corresponding to a single term in the velocity series given in Eqn.14. The
diffusion coefficient per mode for this process is then related to average
displacement and speed quantities as
(21)
Using the integral over the sinusoidal variation as in Eqn.15 to evaluate the
average quantities over the displacement oscillation, the diffusion coefficient
becomes
10
.. · ...... -..

4 Uom 't"m 2 Uom
7r 7r (22)
where Uom is the mode maximum speed corresponding to the pressure
fluctuation mode maximum, Llpm. A similar expression for this diffusion
coefficient, but with a smaller leading coefficient value of 0.1, was previously
discussed in comparison to experimental results for flow in porous media [Eqn.7 in Peterson, et.al.,1987].
The diffusion coefficient is the result of periodic convective processes
occuring in the presence of a gradient of a quantity dispersed within the
convective flow. The diffusion coefficient can be derived in a simplified manner as follows, writing the convective vapor flux from Eqn.2 as
rv = 8aPv(z) Ua(z,t) . (23)
Variation in the air filled volume fraction, Oa, is neglected and a linear gradient in the vapor phase density is assumed so that
(24}
The time and space dependent velocity, ua(z,t), is given by Eqn.14. One can ignore the variation with depth here. The phase of the velocity is ignored
with the caveats discussed after Eqn.14. For this derivation, it is assumed that
each velocity mode looks like u(z,t) = U0 m(z)sin(2rrt/-rm), where u0 m(z) is the maximum convective speed at a given depth independent of the phase.
From Eqns.14 and 18, this vapor mass convective speed is equal to
_r:;JSp_ Llpm u0m(z) = 'J £. L exp( -z/Lm) .
j.l£ m (25)
The flux for a single mode is considered first. The average flux per
mode over one period is
11
'Z'm
J 8a Pv(z) u(z,t) dt 0
Tv (z) = -------'rm
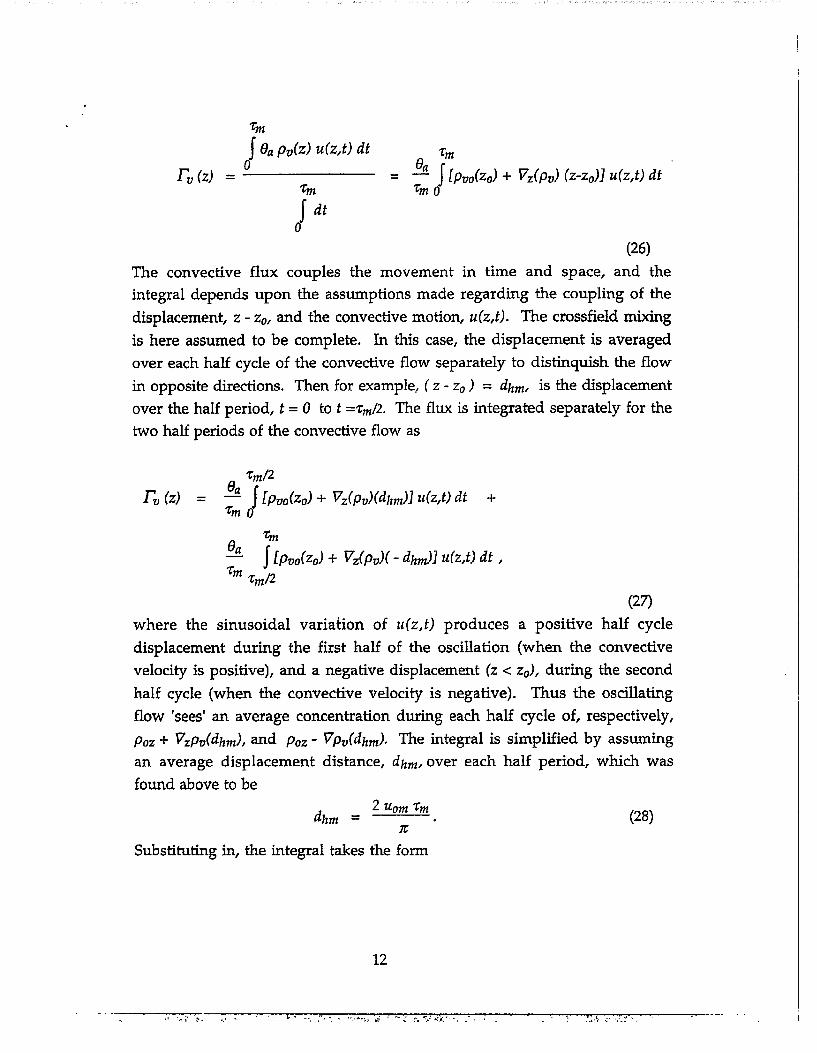
= ea I [pvoCzo) + Vz(Pv) (z-zo)l u(z,t) dt 'rm 0
(26)
The convective flux couples the movement in time and space, and the
integral depends upon the assumptions made regarding the coupling of the
displacement, z- z0, and the convective motion, u(z,t). The crossfield mixing
is here assumed to be complete. In this case, the displacement is averaged
over each half cycle of the convective flow separately to distinquish the flow
in opposite directions. Then for example, ( z - z0 ) = dhm1 is the displacement
over the half period, t = 0 to t ='rm/2. The flux is integrated separately for the
two half periods of the convective flow as
'rm/2
Tv (z) = Ba J fPvo(zo) + Vz(Pv)(dhm)J u(z,t) dt + 'rm 0
'Z'm ea J fPvo(Zo) + Vz(pv)(- dhm)J u(z,t) dt , 'rm 'rm/2
(27)
where the sinusoidal variation of u(z,t) produces a positive half cycle
displacement during the first half of the oscillation (when the convective
velocity is positive), and a negative displacement (z < z0), during the second
half cycle (when the convective velocity is negative). Thus the oscillating
flow 'sees' an average concentration during each half cycle of, respectively,
Poz + Vzpv(dhm), and Poz- Vpv(dhm). The integral is simplified by assuming
an average displacement distance, dhm, over each half period, which was
found above to be
d 2 Uom 'rm
hm = 1r
(28)
Substituting in, the integral takes the form
12
· ... ;· :-. --~ .', .: . ' ....

Tm/2
rv (z) = - fPvo(Zo) + Vz(pvH )] Uom sm (21rt/-rmJ dt + 8a f 2 Uom 'rm •
'rm 7t: 0
(29)
The integral terms are evaluated as
Tv (z) = - Pvo + Vz(PvH ) -8a ( 2 Uom2
'!m )2'l'm
'l'm 7t: 7t:
ea ( 2 u 0m2 '!m ) ( 217n) + '!m Pvo - VzCpv)( 7t: ) - -;;
(30)
The Pvo terms cancel in the two integrals for each half of the cycle, while the
Vpv terms add together. The solution simplifies as
(2)2 2 rv (z) = - 2 ; ea Uom 'l'm Vpv. (31)
where the minus sign is added to account for the sign of the pressure gradient
scale length, Lpm1 and for the convention that flux is directed away from the
gradient, V Pv· The effective diffusion coefficient per convective oscillatory
mode is then,
(2)2 2 Dm = 2 ; ea Uom '!m • (32)
This agrees with the more heuristic estimate in Eqn.19, except the previous
estimate neglected the factor for the air volume fraction, ea. Note that u0 m in
Eqn.32 can be interpreted as a speed at depth after correcting for the
attenuation as given in Eqn.25. Equation 32 gives the appearance that Dm is
mode dependent, however, we still need to substitute the expression for
u 0m(z) from Eqn.25. The mode dependency of Dm will then cancel and the
near surface unattenuated Dm value becomes mode independent as detailed
in the following ..
13

The coefficient, 2(2/n)2 which resulted from the integration is
considered to be a 'coupling coefficient' between the displacement and the
velocity, related to their relative phases. A more detailed 'mixing model'
might derive a frequency dependence for this coefficient, but in the simple
'complete mixing model' used here, this coupling is frequency independent.
The total flux due to the effective diffusion is a sum over mode
contributions. For practical evaluation, this sum is evaluated over a finite
series of Discreet Fourier Transform coefficients as described in the
Evaluation section and detailed previously [Vold,96C]. The effective
diffusion will only apply to pressure modes with a period shorter than the
period of the gradient in the driving force, VT or Ve, for the vapor flux.
Considering the moisture gradient, it was assumed the moisture profiles are
approximately steady state, therefore, all the modes in the pressure driven
fluctuations will contribute to this effective diffusion coefficient, (Dv(e)). In
this case, the appropriate mode sum is restricted by the minimum number of
modes needed in the truncated series to adequately represent the full power
spectra of the pressure fluctuations.
For the temperature gradient flux in Eqn.S, only those modes of the
pressure fluctuations which are of shorter period than the period of the
temperature fluctuation will contribute to Dv(T)· As discussed further in the
Evaluation section, this implies only the short term pressure modes (- 1 week
period) contribute to Dv(T) and only to the annual temperature gradient
mode. For the present analysis we will indicate the summation over a finite
number of modes, nMax, and note that it is differences in this value which
causes Dv(T) and Dv(8) to differ.
The total flux due to the effective diffusion from the pressure
fluctuations is thus written using Eqn.25 as a finite sum over mode
contributions,
rv (z)
14
. ·:. -::.

{33)
The expression for Lpm1 from Eqn.13, is substituted into the denominator and
the last equation simplifies as
rv (z)
nMax
= - (§_) ea ( KpPo) L ((L1pm1Po) 2
e -2z/Lpm ) Vpv. 7r p£ m=1
11M ax
= - ~) Oa Dp 6- ((tipm/p,/ e-lz/Lpm ) Vpv.
(34)
Thus, the near surface (unattenuated or z = 0) effective diffusion for
water vapor (or generally for any contaminant gas entrained in the pressure
fluctuation driven convective air flow within the porous media) is reduced
from the pressure fluctuation diffusion coefficient, Dp, by the sum of the
square of the mode amplitudes normalized to the ambient pressure. This
result also shows the near surface diffusion coefficient is independent of
mode period, and the subsurface diffusion coefficient depends upon mode
period only through the exponential attenuation in Lpmf -rml· This result is
partially a consequence of the simplified 'mixing mechanism' assumed for
fully mixed laminar flow in the pore spaces.
Permeability Considerations
The intrinsic air permeability, Kp, has been assumed constant, and thus
Kp must be evaluated as an appropriate average value as it applies to the field
region of interest. For example, in a fractured region, the fracture and matrix
permeabilities should be appropriately averaged. A general formula for the
average permeability over a volume, V, is
1 Kp = V f Kp(x) dV. (35)
Assuming planar fractures spaced S distance apart, where fracture spacing, S,
is large compared to the average fracture aperture, b, an integral along the
15

perpendicular axis, x, leads to the usual expression for effective permeability
in this fractured medium, as
1 s b Kpjm = S J Kp(x) dx - Kpm + Kpf$ -
b KpfS' (36)
where Kpjm is an effective or average air permeabilty of the fractured media,
Kpf is the permeabilty of the fracture, and Kpm is the permeabilty of the
matrix. An approximate value for Kpf for flow between two vertical plates
(the fracture walls), neglecting surface roughness, is [Domenico and Schwartz,
1990] (37)
The following issue is important in matching all the field data
simultaneously and is discussed further in the Evaluation section. The
spatial average for the fractured media permeability, Kpjm, which is used to
evaluate the unattenuated diffusion coefficient may not be the same average
value appropriate in evaluating the pressure perturbation attenuation length,
Lpm1 which contributes a dependence upon permeability in the form,
exp(-z0/Kp1/2). Here, one might expect to obtain an appropriate average by
weighting different values of Kp proportional to Kp -112.
Different averaging methods for Kp in different contexts might be
consistent physically with different paths for propagation through the media.
The vapor diffusion flux sees 'parallel' paths as the vapor diffuses through
matrix or fractures evaluated with an arithmetic mean weighting over a
spatially variable Kp, while the pressure perturbation diffusion propagates in
'series' across the varying permeability of the matrix then fracture and is
limited by the permeability of the matrix.
In order to determine the appropriate permeability to use in the
diffusion coefficient, it is convenient to evaluate the pressure diffusion at a
'reference value', Dp-retfKrefl, based in turn on a reference permeability value,
Kref- Thus, one writes
Kp[m Dp-reftKrefl Kref
16
...... • •• .:.····' o;'."'"
(38)

A site specific evaluation and comparison to field observations provides
more insight to appropriate averaging than is possible from a purely
theoretical analysis, so this issue is continued and elaborated in the
Evaluation section.
Referring to Eqn.34 and incorporating Eqn.38, the total effective
diffusion coefficient for vapor flux in the fracture porous media due to
pressure fluctuations is finally written as nMax
Dv(p) = - (;) 8, Dp[Krejl ~;~; ~ ((i!.pm/p} e-2
z1Lpm )
{39)
where the permeability of the fractured media is evaluated using Eqns.35 to
37. The near surface or unattenuated diffusion coefficient is evaluated at z =
0, or with the exponential term equal to one.
Model Evaluation
Reference Matrix Permeability
Field data for the migration of tritiated water vapor through the
unsaturated zone from disposal shafts at Area G to the mesa surface are
consistent with a vapor phase diffusion coefficient of about 1.5x1Q-3 m2 Is [Void and Eklund,96] which is a factor of 60 greater than the binary diffusion
coefficient for water vapor in air. In this section, the model derived above for
pressure-driven diffusion in the fractured media is evaluated to provide a
comparison to the effective vapor phase diffusion coefficient observed in the
field study.
The pressure fluctuation enhanced diffusion coefficient is evaluated at
a reference permeability, taken to be 1.x10-12m2, a 'nominal' value observed
at Area G, lying between typical (unfractured) core sample measurements
(less than 1Q-12m2 [D. B. Stephens,et.al.,95]) and in-situ measurement results
(1 to a few times 10-12m2 in the upper most 100 foot depth at Area G [W.E.
Lowry, et.al.,96). In the relatively dry interior of the mesa at Area G a
reasonable approximation is that the air volume fraction is equal to the
porosity, Oa ~ e - 0.4, then the pressure diffusion coefficient reference value
is
17
. . ~. . - ... - ..... - . ' -- .. ·~... ·~ ..

Dp-rejlKrejl = Kp-re{po = 1Q-12 0.8x10S
J.l E 2x1o-s 0.4 = 1.x1D-2 m2fs .
(40)
This is the expected value of the diffusion coefficient for pressure fluctuations
in the 'nominal' tuff matrix at Area G.
The spectra of the atmospheric fluctuations have been examined in
some detail [Vold,96C]. Spectral power densities were evaluated from the
discreet Fourier transform of data collected at 8 intervals per day over a
duration of several years to resolve simultaneously the daily and the annual
period modes. The spectra indicated that the full power distribution in the
atmospheric fluctuations had been included, thus, this data series was
adequate to represent the spectrum needed here. It was found for the full
spectrum,
( 5mbar J _5
- 800mbar) - 4.xlO ·
(41)
It was also found that the pressure mode spectrum could be crudely
approximated as two modes, one at about a 7 day period and a second at the
annual period (with the respective binned mode amplitudes of 3.3 mbar and
3.5 mbar). It is worth evaluating the magnitude of the pressure fluctuations
in the shorter period mode as this term will drive the effective diffusion
coefficient for the temperature gradient term for any longer period variation
(annual) in the temperature. The square root of the sum of the squared
amplitudes for the pressure modes contributing to the 7 day period was found
to be about 3.3 mbar, or
~s L (l1pmJ - (:o~:~~y - 1.7x1o-s. (42) m=1 Po ) )
As discussed previously, it is this mode summation which is expected to
contribute to the effective diffusion of the annual variation in temperature,
thus it is seen that Dv(T) - (1.7x10⁻⁵f4x10-5) Dv(P) - 0.43 Dv(B) or the
enhanced diffusion coefficient for the temperature gradient flux is slightly
less than half that for the moisture gradient flux.
18

The pressure fluctuation attenuation length, Lpm, can be evaluated for
each dominant mode in the spectral analysis using the reference permeability.
To simplify we consider the simplest spectral approximation with the two
modes, a 7 day period and an annual period. The attenuation length for the 7
day mode and the nominal tuff permeability is
Lpm(7:m= 7days) =
=
Kp-refPo rm
f.Lerr
10-12 0.8x10⁵ 3.6xJ03x24.x7.
2.x 1 o-Sx0.4x3.14159 = 44m,
(43)
and for the annual mode, 'Cm = 3.156x10ls, the attenuation length is evaluated
similarly to obtain,
Lpm(1:m= 1 yr = 3.156x10ls) = 320m. (44)
The saturated aquifer is 250-300m beneath Area G, and the mesa height
is about 30m above the adjacent canyon floors. For near surface evaluations,
or within the interor of the mesa, the attenuation of the pressure fluctuations
(Eqn.39), is a small factor and can be neglected. Note that the diffusion
coefficient attenuates twice as quickly with depth as does the pressure
fluctuation amplitude, or with an attenuation length of only about 22m (half
that from Eqn.43) for the 7 day period mode. This will be a significant
reduction in the diffusion coefficient near the base of the mesa (on the order
of 30%) but will not be a large factor in the present analysis comparing model
results to diffusion coefficients derived from measurements of near surface
tritium migration. Hence, we will assume the attenuation is small and
neglect it from quantitative evaluation in this study. A more detailed study
of the diffusion coefficient variation with depth should consider evaluating
Eqn.39 using the 5-group or 11-group spectra for atmospheric pressure
fluctuations in [Vold,96C].
Combining factors using values appropriate to Los Alamos (e.g., E ....
0.4), we obtain an estimate for the near surface effective vapor diffusion
19

coefficient due to pressure fluctuations at the reference permeability of the
tuff matrix, Dv(p), as nMax
Dv(p>[Kref, z=O] L ((L1pmlpo) 2
) m=l
= 2 (;) 0.4 1.x1D-2 m2fs[at Kref = 1Q-12m2] 4.x1Q-5
= 4x10⁻⁷ m2fs
= (4.x10-7j2.5x1Q-5) D0 - (1/60) D0 •
{45)
This value is 60 times less than the classical diffusion coefficient and shows
that diffusion in the matrix (at the reference permeability) driven by pressure
fluctuations is negligible.
Effective Permeability due to Frachtres
Consistent with Eqn.9, the classical diffusion coefficient in porous
media will not change significantly in a fractured medium because the
porosity and tortuosity will not be changed by more than a factor of about two.
However, the diffusion due to pressure fluctuations is proportional to an
effective permeability of the media and therefore the fracture contribution to
permeability can be important. This can increase the diffusion by orders of
magnitude for the fracture characteristics at Area G.
Fracture mapping data from Area G in disposal unit #39 to - 60 foot
depth [Reneau and Vaniman,94] indicates a mean value for the distribution
of fracture apertures in the near surface is about 3mm over the upper walls.
The average over the lower walls in that disposal unit is about Smm. The
mean value for fracture frequency is about 1 m-1, or the mean fracture spacing
is, S = 1m. This indicates a fracture permeability in the simple model of
Kpf = b2j12 - (3x10⁻³)2j12 = 0.75x1Q-6 m2 (46)
and an effective media permeability of about
20
. . /,'!, t' : ... - .·'. "' ) · ..

Kpfm - (b2/12) (b/S) = ((3x1Q-3)2f12)(3x10⁻³fl) = 2.3x1Q-9 m2.
(47)
Using these mean values from the fracture aperture and spacing
distributions, the ratio of the effective permeability of the fractured media to
the reference permeability is
KpjmiKp-ref = 2.3x1D-9flx10-12 = 2.3x10³.
(48)
Using this ratio to modify the enhanced diffusion coefficient to a value for
the effective fractured media, one obtains
Dv(p) Kp(m
= Dv(p)fKref, z=O] Kref
= (4.x10-7 m2fs) x 2.3x10³ - l.x1Q-3 m2fs.
(49)
This value is 40 times greater than the binary diffusion coefficient and only
50% less than the empirically derived value for tritium diffusion at Area G,
1.5x1Q-3m2fs [Void and Eklund,96].
The value of the diffusion coefficient from the pressure fluctuation
model is very sensitive to the fracture aperture, proportional to b3. As noted
above, the mean value of the distribution of fracture apertures, <b>, is about 5
mm on the lower walls and over the upper face of the disposal unit walls the
mean aperture is 3 mm. If a lognormal distribution is assumed for the data
from the upper face (the data plots support this, however, the original data
was not available to quantify this) then the geometric mean and standard
deviations are estimated from the data graphs in [Reneau and Vaniman,94] to
be about 2 mm and 2, respectively. These values characterize the distribution
in aperture width, while the mean values for higher moments, <b2> or <b3>,
will be larger. In fact, the average for the lognormal distribution of the third
moment, <b3> (we are interested in effective permeability proportional to b3)
can be expressed in terms of the estimated parameters [Seinfeld,86] as
ln <b3> = ln <b> + 3 Zn2 O"g •
or
21
•'~ I ,·, .

<b3> = exp( ln 2 + 3 ln2 2) = 8 mm
(50)
Where we previously used the arithmetic mean of the aperture distribution
equal to 3 mm, it may be more appropriate to use this mean of the higher
moment used to evaluate the effective permeability. This corrects the
effective diffusion coefficient upward by a factor of 8/3, to give an estimate
from the factors considered thus far as
- (8/3) 1.xi0-3 m2js = 2.6x1Q-3 m2js. (51)
This estimate from the model is about 50% greater than the estimate
from the field data for the in-field diffusion coefficient for tritium vapor at
Area G. The estimate from the model in Eqn.Sl and the previous model
estimate in Eqn.49, thus bracket the value observed in the field. There are a
number of factors associated with the pressure fluctuation model and with
the field determination which would indicate the error for either estimate is
larger than this difference between the estimates. One possiblility to account
for the relatively good agreement, is that this pressure fluctuation model
accounts for the main physics in determining the in-field vapor phase
diffusion. Another possibility which cannot be entirely discounted is that large
errors in two or more factors which are important in this analysis cancel each
other leading to an apparent agreeement with the field data for erroneous
reasons. One possible inconsistency in the analysis is that in deriving the
enhanced diffusion coefficient (Eqns.33-34), factors of Kp cancel in the
numerator and in the denominator. It is then found in the model evaluation
that these two values may be different in order to best match the field data.
This leaves the agreement of the field data and the model open to further
interpretation and refinement.
Discussion
Effective Permeability
The volume averaged effective permeability used to evaluate the
pressure attenuation length, Lpm1 may not be the same as the effective
permeability factor used to evaluate the unattenuated diffusion coefficient
(Eqn.49). A second related issue is the difference between permeability seen in
recovered core (unfractured samples) and the in-situ measurements. 22
·, .

It has been shown that the attenuation of atmospheric pressure
fluctuations with depth agrees with the attenuation length calculated using
air permeability values from in-situ field study measurements
[Neeper,et.al.,96]. These in-situ measurements are· by an isolated packer
pressure injection method and permeability values within 100 ft of the mesa
surface are typically in the range of 1-2 x10-12 m2 [Krier, et.al.95]. This
permeability is a factor of 2 to 10 times greater than air permeability measured
analytically on small core samples recovered and analyzed in the laboratory
[Stephens,et.al.,95]. However, it is orders of magnitude smaller than the
effective permeability, Kpfm1 predicted for the fractured media at Area G using
the fracture distribution data, which agrees with the tritium mass diffusion
field data as seen in the model above. The propagation of pressure
fluctuations appears to be consistent with a permeability close to the matrix or
in-situ values. The response function of the in-situ packer measurement suggests that
permeability determined by this method represents a sample volume of
characteristic dimension approximately 0.3 to 0.5 m [Lowry,96]. Comparing
this effective sample size to the fracture distribution it is reasonable to
conclude that the in-situ measurement includes a response to a fraction of the
fractures at the low end of the fracture spacing distribution. Thus, the in-situ
detemination sees an effective permeability which is large compared to the
core sample (unfractured) permeability but still small compared to the
volume averaged permeability over a larger volume that encompasses and
thus effectively averages over the entire distribution of fracture spacing.
A consistent picture requires reconciliation between the large Kpjm' as
needed in the effective diffusion model to agree with the tritium vapor
diffusion observed in the field, and the relatively small Kpfm, as seen in the
attenuation with depth of the pressure fluctuations. A possible explanation is
that the effective diffusion for mass (vapor) sees the matrix and fractures as
parallel flow paths and an appropriate average is a simple mean. For pressure
fluctuations, their propagation with depth follows a path through varying
permeabilities in series, through matrix then fractures. In this case, the
effective permeability is 'series weighted' (1/Kp) and becomes dominated by
the smaller permeability of the matrix.
Some influence of the fracture permeability on this 'series weighted'
permeability is suggested by the agreement of the pressure attenuation data
23
· •.. ·· ...
with the in-situ permeability [Neeper,et,al.,96], since the in-situ permeability
(presumably representing some fraction of the fractures) is significantly
greater than the matrix permeability (represented by the unfractured core
sample results). This issue needs additional analysis to determine if the data
for pressure fluctuation with depth is sufficiently well resolved that one can
discriminate a 'best fit' to the permeability which is closer to the in-situ
values than to the core sample (unfractured) values.
Fracture Presence and In-situ Diffusion Observations
The effective diffusion coefficient for tritum vapor observed in the
field study, l.Sxl0-3 m2/s, was determined for tritium diffusion in the upper
most 60 ft of the mesa subsurface. It was noted in that study by comparison to
borehole tritium moisture profiles [Void and Eklund, 1996] that the diffusion
coefficient appeared to be significantly less, by about a factor of four, for
tritium diffusing downward from 60ft. It has also been observed at Area G
that along the lower portion of the excavated walls of a currently open
disposal unit #38, many of the fractures penetrating towards the bottom, stop
abruptly here (at~ 60ft). This is estimated to be the interface of Units 2B and
2A, based on borehole profile logs from nearby boreholes. The observations
that there is a decrease in effective diffusion below 60' in the tritium diffusion
study and that the fracture density decreases near the 2B-2A interface (~60'
deep), are qualitatively consistent with the enhanced diffusion model which
predicts a dependence of the enhanced diffusion upon fracture permeability.
Diffusion Isotropy
The enhanced diffusion coefficient in this analysis has been evaluated
in a simple manner as an isotropic quantity. The diffusion mechanism
actually indicates that the diffusion occurs along the axis of the pressure
gradients imposed at the surface boundary, implying diffusion along the axis
normal to the surface plane. However, the magnitude of the diffusion
requires that the permeability of the fractures be invoked so that the mass or
vapor diffusion is presumably dominated by flux through fracture apertures,
and therefore the directionality of the effective diffusion will be related in a
complex unknown manner to the distributions describing fractures and their
orientation. Fractures at Area G are observed to be predominantly vertical,
24
·- .-. ----. ';""---~._-.....,.------

but with a broad distribution as mapped previously [Reneau and
Vaniman,94]. The broad distribution introduces some degree of isotropy into
this effective diffusion coefficient which is expected to become more isotropic
as the volume of interest increases thus averaging over a larger distribution
of the fractures. A nearly isotropic diffusion coefficient is consistent with the
surface efflux of tritiated water vapor measured from the ground area
surrounding the tritium disposal shafts at Area G, which is seen to be
reasonably symmetric around the three high level tritium disposal shafts
[Eklund and Vold,95].
Enhanced Diffusion with Hydrodynamic Dispersion
A factor contributing to transport is the hydrodynamic dispersion that
develops by spreading mass with respect to a specific convective front and to
the axis of convective motion in a porous media. This dispersion might
typically contribute to a 10% (plume width to length) mass spreading normal
to ·the local axis of convective motion. This axis for the pressure enhanced
diffusion is along the axis of the pressure gradient. In unfractured media this
would direct the convective oscillations normal to the ground surface and the
hydrodynamic dispersion would be dominantly parallel to the ground
surface. However, in the densely fractured mesa geometry with a broad
distribution in fracture orientations, the dispersivity in the field due to the
pressure fluctuation enhanced diffusion is likely to enhance the isotropy of
the contaminant plume. Thus, isotropy in the dispersivity should be similar
to the isotropy expected for the enhanced diffusion coefficient itself as
discussed in the previous paragraph, but is expected to be of secondary
significance in the transport.
Diffusion Model Validity
As discussed previously, the diffusion model is valid when the
displacement distance is small compared to the attenuation length, or
dpm/Lpm << 1. The inequality is always true for the pressure fluctuations
when the same permeability value is used in evaluating the displacement
distance as in evaluating the attenuation length, since the pressure
perturbation amplitude is always small compared to the ambient pressure
background (Eqn.20). However, in order to simultaneously match two sets of
25

field data (the diffusion coefficient for near surface tritum migration and the
pressure fluctuation attenuation length) it was necessary to assume that the
effective permeability in the displacement distance needed in the diffusion
coefficient is Kpfm while the effective permeability for the attenuation length
is much smaller, ,.. Kinsitu·
This Kpfm value implies that the convective displacement distance is
larger by the ratio of Kpfm/Kp-ref than previously assumed. This leads to dpm/Lpm,.. 1, not dpm/Lpm <<1 as assumed for diffusion theory to apply. The large value implied for the displacement distance might physically represent
a large convective displacement through a fracture. Under these conditions
the constant diffusion coefficient model assumptions are not strictly valid,
the diffusion coefficient is varying significantly in space and the diffusion
may be non-linear. Nevertheless, the diffusion model still appears to be in
agreeement with the field data. The use of different values for Kp to match data sets simultaneously
leads to another dilemma. As discussed previously, two factors of Kp
cancelled in the derivation of the diffusion coefficient (Eqn.33-34). These
factors, which implicate a role of the fractures in defining an appropriate permeability, were later evaluated to be different values to match the field
data. The role of the fractures requires additional investigation. The present
analysis does not unambiguously resolve these issues.
Application of Result Having derived an effective diffusion coefficient which appears to be
consistent with field data it is appropriate to next consider how this diffusion
coefficient can be applied in modeling or analyses. Discussion in this section
is speculative and will be reviewed in a subsequent study in comparison to a
detailed two phase dual media model formulation.
The component of vapor flux due to the enhanced or effective
diffusion coefficient, Dv(p), acting on the vapor density gradient can be generally written
(52)
26
- ~--------~~--~~--~--.~----~--~-~--~~----------~----~-.~--.~,_--~-----

where this expression can be applied to fractures or to the matrix depending
upon the values used for Pv· The derivation indicates that the effective
diffusion coefficient is an average over the effective permeability of the
combined fracture-matrix system, and therefore a single value for Dv(p)
applies to the flux within fractures or to the flux within the matrix. The flux
difference will be related only to the difference in vapor density gradients in
the two media. The empirically determined effective diffusion value for tritiated water
vapor, Dv-eff, [Vold and Eklund,96] has been used in combination with
observed moisture content profiles in the matrix (as measured in bore holes
at Area G) to estimate the magnitude of vapor flux to be about 2 mm/yr water
equivalent [Vold,96B]. This analysis is independent of the underlying
diffusion mechanisms suggested by this model derivation. This flux within
the matrix is driven by the effective diffusion acting on the moisture gradient
observed in the matrix. Thus, the vapor flux through the matrix was
estimated as
Tv (m) = - Dv-eff ( V Pv )m (53)
using the effective diffusion coefficient with the gradient of the vapor density
within the matrix, (Vpv)m1 inferred from the moisture profile measurements.
The diffusion model evaluation implies that Dv(p) - Dv-eff· The model
derivation indicates the transport is actually dominated by flow through
fractures. A physical picture from these considerations is that the volume
averaged transport is dominated by flow through the fractures and this
effective diffusion drives a vapor flux within the matrix (presumably towards
the nearest fracture where it is lost to evaporation) which is on the order of 2
mm/yr. The derived diffusion coefficient also applies to the fractures, since the
effective permeability (Eqn.36) was a volume weighted average. This implies
that the vapor flux within the fractures is given by
(54)
where the vapor density gradient is evaluated within a fracture along an axis
normal to the mesa top or mesa side boundary. If one accepts that the same
27
~· " ... .

effective diffusion coefficient applies to the fracture or to the matrix media,
then the ratio of vapor flux in the fracture to that in the matrix is equal to the
ratio of their respective vapor density gradients. Referring back to Eqns.4 and
7, the vapor gradients can be approximated under isothermal conditions,
giving us
Tv m (Vpv)J Tv (m)- (VPv)m =
PsV~J (55)
An isothermal condition is a good approximation in the matrix below 1-2m,
but it may not be a good assumption within the fracture spaces during
convective cycles of atmospheric pumping, so the actual case will be more
complex then considered here. With this caveat, the gradient of the relative
humidity in the fracture,~} can be evaluated. Preliminary numerical
results are consistent with the following simple approximation.
The relative humidity at the mesa edge is typically 0.3 and it is- 0.99 in
the mesa interior with a scale length along the fracture penetrating into the
mesa interior about 10m, or
V ~} - (0.99- 0.3) I 10m - 0.07 m-1. (56)
The magnitude of the matric potential gradient associated with moisture
content within the matrix can be approximated from the data for the drier
portions of the borehole ER-1123 at depth intervals with the maximum
gradients (e.g., Fig. 16A in [Vold,96B]), as
( Vhm)m - t1hm/t1z - 104cm/1m = 102. (57)
Combining these approximations in Eqn.55, and canceling the factors of p5, an
estimate for the vapor flux in fractures relative to the flux in the matrix is
Tv (f)
Tv (m) = hcV~} (Vhm)m
28
= 13 300x0.07
102
....... : " ..
= 9.1 - 10.

(58)
Though these estimates are crude, they predict that an order of
magnitude greater vapor phase 'flux within the fractures than within the
matrix itself can occur for assumed realistic conditions. Where the previous
analysis result [Vold,96B] found a vapor flux magnitude of 2mm/yr
equivalent in the dry portions of the mesa tuff matrix, there may be ten times
this value or 2 cm/yr liquid-equivalent vapor phase flux through the
fractures. If the same net moisture flux moves through each media, say, from
the matrix to the fractures to be evaporated subsequently from the surface
connected fractures, then the flux through the matrix must equal the flux
through the fractures by mass conservation. However, a moisture source
within the fractures could be evaporated at higher flux rates up to 2 cm/yr
under the assumed conditions. Transient events could deposit significant
moisture directly into the fractures as hypothesized previously [Turin,95] and
thus act as a moisture source term which evaporates before it is wicked into
the matrix. This result may help to explain an unresolved discrepency in field data
[Vold,et.al.,96]. Data from precipitation, evaporation, evapotranspiration and
surface run-off indicate that several cm/yr are unaccounted for [Void and
Eklund,96B]. One possibility is that the unaccounted water goes to deep
percolation, however, there are geophysical and geochemical analyses that
strongly suggest a deep percolation rate of only a few mm/yr or less
[Vold,et.al.,96]. If a moisture flux on the order of (cm/yr) is evaporating
through the fractures to the mesa walls, this might account for the
discrepency. Another possibility is that the apparent discrepency is
attributable to uncertainties in field data.
Summary
Field data for the migration of tritiated water vapor through the
unsaturated zone from the buried disposal shafts at Area G are consistent
with a vapor phase diffusion coefficient of l.SxlQ-3 m5 Is, or a factor of 60
greater than the binary diffusion coefficient for water vapor in air. A model is
derived which relates an effective vapor phase diffusion coefficient in the
29
··. ' . ·.· ·~ . ~·

fractured porous media to the subsurface propagation of atmospheric pressure
fluctuations.
The pressure fluctuation enhanced diffusion mechanism does not
relate to, the specific transport properti~s of water vapor and thus is assumed
to apply equally well to any gas species entrained in the pore air spaces. The
temperature gradient moisture flux was seen to be dominated by the
tempera~ure dependence of the saturated water vapor pressure. The
temperature gradient driven flux for other gaseous species could be similarly
related to the temperature dependence of the vapor pressure for that species,
and could be important or not depending upon this temperature dependence.
The near surface (unattenuated) diffusion coefficient is independent of
fluctuation period under the simplified assumptions of a complete 'mixing
mechanism' for the effective diffusion process. The unattenuated effective
diffusion driven by this barometric pumping is linearly proportional to the
average permeability of the fractured porous media, while the attenuation
length is inversely proportional to the square root of the product of
permeability times mode period. The resulting diffusion using Area G
parameter values is negligible in the matrix but becomes large at the effective
permeability of the fractured media. This finding is in agreement with
previous work [Peterson,et.a1.,1987]. Using observed fracture characteristics at
Area G, the effective diffusion coefficient due to pressure fluctuations
predicted by this model is in good agreement with the observed in-situ
diffusion coefficient for tritium field measurements.
It is concluded that barometric pumping in combination with the
enhanced permeability of the fractured media is a likely candidate to account
for the observed in-field migration of vapor in the near surface unsaturated
zone. This enhanced migration occurs in the upper most fractured
stratigraphic layers beneath Area G to at least 60 ft depth, but does not apply
within the disposal units themselves which are unfractured and highly
compacted during disposal operations. The implied vapor flux within the
fracture volume may be greater than through the tuff matrix by an order of
magnitude, if transient infiltration or some other mechanism provides ·a
source of moisture directly to the fracture network.
30
. . . . : ... '
Acknowledgments
This work was supported by the U.S. Department of Energy, Waste Management Programs, as part of the technical analysis in support of the site Performance Assessment for Area G, Los Alamos.
31
-. . ~ '. .. ... . .... l •• ., •.& .. , . !::"' ....

Nomenclature Table
b fracture aperture
<b> average of distribution of fracture apertures
D mass diffusion coefficient Dm diffusion coefficient contribution from a single mode Do classical diffusion coefficient (water vapor in air) Dos fluctuation enhanced diffusion coefficient
Dp m diffusion coefficient from one pressure mode Dp pressure fluctuation diffusion coefficient Dp-reJfKrefl pressure fluctuation diffusion coefficient reference value
Dv(T-8) diffusion coefficient for vapor flux by either temperature or
Dv(T) Dv(8) Dv
Dv-eff Dv(p)
d
dhm
dm
dpm
drm he hm Kp
Kpd
KpL Kpfm Kpf Kpm
Kref
Lm
Lpm
moisture content gradient vapor diffusion coefficient for temperature gradient flux vapor diffusion coefficient for moisture content gradient flux
total effective diffusion coefficient for vapor effective vapor diffusion coefficient from field data
effective vapor diffusion coefficient from pressure fluctuation
model characteristic step size average displacement distance over a half period
average mode displacement distance
pressure mode displacement distance
temperature mode displacement distance
static equilibrium constant= RT/Mvg. matric potential expressed as a positive water column height air permeability for a porous media
air permeability used to evaluate the displacement distance air permeability used to evaluate the attenuation length effective or average air permeabilty of the fractured media
air permeabilty of the fracture
air permeabilty of the matrix
air permeability reference value mode attenuation length
attenuation length for each pressure mode
32

LTm nMax
p Pa Po Pv Ps Sv T
u
u(z,t), or
ua(z,t)
ua
ua(z)
um(z)
attenuation length for each temperature mode
finite number of modes
air pressure (fluctuation) air pressure (total)
atmospheric pressure (average)
vapor pressure
saturated vapor pressure
source term for vapor phase
air and vapor temperatures
mass speed convective air motion speed, or time and space dependent air velocity (in context) at depth
air flow speed (or velocity in context)
time averaged magnitude of the fluctuating air velocity average displacement mode speed at a given depth
uom(z) , or mode maximum speed amplitude at a given depth, Uom corresponding to the pressure fluctuation maximum, Llpm
uom(z=O)
v X
z zo
Tv rvo Llpm
e e ea f.l Pv (pv)m
(pv)J
Pvo 'tm
unattenuated mass convection speed for a particular mode
volume an axis parallel to ground surface
distance (height) along axis normal to ground surface
reference height
vapor phase flux of moisture in the porous media
diffusive component of the vapor flux amplitude for a particular mode of the pressure fluctuations
porosity liquid phase volumetric fraction
air-filled volumetric fraction
viscosity vapor density vapor density within the matrix vapor density within a fracture vapor density at the reference height, z0
period for a particular mode (of the pressure fluctuations)
tortuosity factor
33
···-·----- -~---___..,,..----,...,--------,-.-.,---~--~.,---~· --.'

References
[Auer,et.al.,95] L. H. Auer, N.D. Rosenberg, K.H. Birdsell, E.M. Whitney, "The
effects of barometric pumping on contaminant transport", Los Alamos National Laboratory Report, LA-UR-95-3033, Los Alamos, NM, August,
1995.
[Carslaw and Jaeger,59] Carslaw, H.S., and Jaeger, J.C., Conduction of Heat in
Solids, p.64-68, Oxford University Press, London, 1959.
[Chapman,74] Chapman, A.J., Heat Transfer, third edition, p.156, MacMillan
Publishing, New York, 1974.
[Domenico and Schwartz, 1990] P.A. Domenico and F.W. Schwartz, Physical and Chemical Hydrology, p.87, John Wiley, New York, NY, 1990.
[Eklund and Vold,95] B. Eklund, and E. Void, "Measurement of Emission
Fluxes from Technical Area 54, Areas G and L", final report 1/4 from
RADIAN to LANL- CST-14 under DOE subcontract 6345L0014-31, Los
Alamos National Laboratory Report, LA-UR-95-3891, Los Alamos, NM,
1995.
[Hollis,et.al.,95] D. Hollis, E. Void, K. Birdsell, J. Turin, P. Longmire, E. Springer, W. Hansen, D. Krier, R. Shuman, "Performance Assessment of
LANL TA-54, Area G, LLRW Disposal Facility- Preliminary Draft", Los
Alamos National Laboratory, Los Alamos, NM, August, 1995.
[IT,87] International Technology Corporation, "Hydrologic Assessment of
Technical Area 54, Areas G and L, Los Alamos National Laboratory", Final
Report, Docket Number NMHW A 001007, Los Alamos National Laboratory, Los Alamos, NM, March, 1987.
34
· .. · .. . ·~ '

[Krier, et.al.,95] D. Krier, P. Longmire, R. Gilkeson, H.J.Turin, "Geologic, Geohydrologic, and Geochemical Data Summary of MDA G, TA-54, LANL", Los Alamos National Laboratory Report LA-UR-95-2696, Los Alamos, NM,
1995.
[Koorevaar,et.al.,83]. P. Koorevaar, G. Menelik, C. Dirksen, Elements of Soil Physics, p.200, Elsevier, New York, 1983.
[Lowry, et.al.,96] W.E. Lowry, et.al., "Open borehole anemometry and air permeability measurements, Area G, TA-54", Science & Engineering Assoc. report on in-situ measurements at G-5, Santa Fe, NM, Jan.18, 1996.
[Milly,96] P.C.D. Milly, "Effects of thermal vapor diffusion on seasonal dynamics of water in the unsaturated zone", Water Resources Res. vol.32, p.509-518, March, 1996.
[Neeper,91] Neeper, D.A., "Soil vapor extraction enhanced by oscillatory flow", Los Alamos National Laboratory Report LA-UR-91-638, Los Alamos, NM, 1991.
[Neeper,et.al.,96] D. Neeper, S. Limback, R. Gilkeson, and W. Lowry, "Subsurface Propagation of Barometric Pressure Cycles and the Resulting Flow in Open Boreholes," Eighth National Technology Information Exchange (TIE) Workshop, Santa Fe, April 16-18, 1996, and Los Alamos National Laboratory Report LA-UR-95-3799, Los Alamos, NM, 1995.
[Peterson,et.al.,87] E.W. Peterson, K. Lie, R.H. Nilson, "Dispersion of contaminant during oscillatory gas motion driven by atmospheric pressure variations, U.S.DOE Con£. proceedings, CONF-870961, p.340, in the 4th Symposium on Containment of Underground Nuclear Explosions, USAF Acadamy, Colorado Springs, Co, Sept., 1987.
[Philip and de Vries,57] J R.Philip and D.A. de Vries, "Moisture movement in porous materials under temperature gradients", Trans., Amer. Geophysical Union, v38,n2, p222, 1957.
35
... ··· ...

[Reneau and Vaniman,94] Reneau, S.L., and Vaniman, D.T., 'Fracture Characteristics in a Disposal Pit on Mesita del Buey, Los Alamos National Laboratory', Los Alamos National Laboratory informal report, group EES-1, March 21, 1994.
[Seinfeld,86) Seinfeld, J.H., Atmospheric Chemistry and Physics of Air Pollution, p.286, John Wiley and Sons, New York, 1986.
[Stephens, et.al.,95] D. B. Stephens and Associates, "Laboratory analysis of soil hydraulic properties of G-5 soil samples, report no. DBSA/3854/195-1", prepared for Los Alamos National Laboratory, Los Alamos, New Mexico, January 1995.
[Turin,95] H.J. Turin, "Subsurface Transport Beneath MDA G: A Conceptual Model", Los Alamos National Laboratory Report LA-UR-94-1663, Los Alamos, NM, 1995.
[Vold,96A] Void, E.L., 'Analysis of Liquid Phase Transport in the Unsaturated Zone at a Mesa Top Disposal Facility', Los Alamos National Laboratory Report LA-UR-96-370, Los Alamos, NM, 1996.
[Vold,96B] Void, E.L., 'An Analysis of Vapor Phase Transport in the Unsaturated Zone with Applications. to a Mesa Top Disposal Facility, Part I', Los Alamos National Laboratory Report LA-UR-96-973, Los Alamos, NM, 1996.
[Vold,96C] Void, E.L., 'Estimates of the power spectra for atmospheric fluctuations in temperature and pressure data from Los Alamos', Los Alamos National Laboratory Report, LA-UR-96-2852, Los Alamos, NM, draft report July, 1996.
[Void and Eklund,96A] Void, E.L., and Eklund, B., 'Determination of an InSitu Vapor Diffusion Coefficient at a Mesa Top Waste Disposal Facility', Los Alamos National Laboratory Report, LA-UR-96-1848, Los Alamos, NM, draft report May 22, 1996.
36

[Veld and Eklund,96B] Veld, E.L., and Eklund, B., 'Preliminary Summary of Evaporation Measurements Made at Los Alamos, Area G', Los Alamos National Laboratory Report, LA-UR-96-3499, Los Alamos, NM, 1996.
[Vold,et.al.,96] E. Veld, K. Birdsell, B. Gallaher, D. Krier, P. Longmire, B. Newman, D. Rogers, E. Springer, 'Representative Recharge Rates in a Complex Unsaturated Hydrogeology', in prep. for Waste Management '97, summary available as LA-UR-96-2850, Los Alamos National Laboratory, Los Alamos, NM, 1996.
37
'•" . ~. .. . .. . -~.

....
DISCLAIMER
This report was prepared as an account of work sponsored by an agency of the United States Government Neither the United States Government nor any agency thereof, nor any or their employees, make any warranty, express or implied, or assumes any legalliablli- . ty or responsibility for the accuracy, completeness, or usefulness or any Information, apparatus, product, or process disclosed, or represents that its use would not infringe privately owned rights. Reference herein to any specific commercial product, process, or service by trade name, trademark, manufacturer, or otherwise does not necessarily constitute or imply its endorsement, recommendation, or favoring by the United States Government or any agency thereof. The views and opinions or authors expiessed herein do not necessarily state or renect those or the United States Government or any agency thereof •
. '.