ive activity manual
DESCRIPTION
Vehicle activity according to IVE methodologyTRANSCRIPT
International Vehicle Emissions Model
Manual
for
Field Data Collection Program To Determine Vehicle Activity Information in Urban Areas
1

2
3
Contents of Manual
Section I
Schedule of Activities
Section II
List of Equipment to Temporarily Import and List of Equipment to Purchase In Country
Section III
Financial and Planning Responsibilities
Section IV
Description of Field Activities
Section V
Forms Used in Field Activities and Field Activity Guidance

4
Section I
Schedule of Activities

5
6
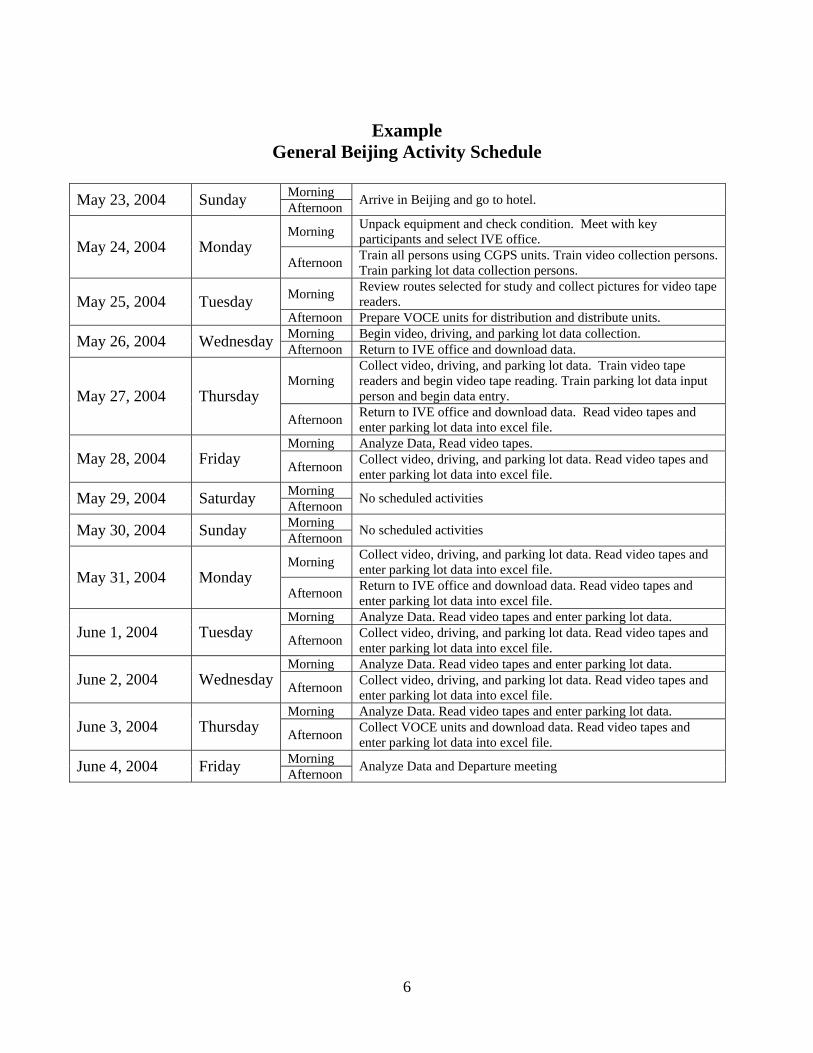
Example General Beijing Activity Schedule
Morning May 23, 2004 Sunday Afternoon Arrive in Beijing and go to hotel.
Morning Unpack equipment and check condition. Meet with key participants and select IVE office. May 24, 2004 Monday
Afternoon Train all persons using CGPS units. Train video collection persons. Train parking lot data collection persons.
Morning Review routes selected for study and collect pictures for video tape readers. May 25, 2004 Tuesday
Afternoon Prepare VOCE units for distribution and distribute units. Morning Begin video, driving, and parking lot data collection. May 26, 2004 Wednesday Afternoon Return to IVE office and download data.
Morning Collect video, driving, and parking lot data. Train video tape readers and begin video tape reading. Train parking lot data input person and begin data entry. May 27, 2004 Thursday
Afternoon Return to IVE office and download data. Read video tapes and enter parking lot data into excel file.
Morning Analyze Data, Read video tapes. May 28, 2004 Friday Afternoon Collect video, driving, and parking lot data. Read video tapes and
enter parking lot data into excel file. Morning May 29, 2004 Saturday Afternoon No scheduled activities
Morning May 30, 2004 Sunday Afternoon No scheduled activities
Morning Collect video, driving, and parking lot data. Read video tapes and enter parking lot data into excel file. May 31, 2004 Monday
Afternoon Return to IVE office and download data. Read video tapes and enter parking lot data into excel file.
Morning Analyze Data. Read video tapes and enter parking lot data. June 1, 2004 Tuesday Afternoon Collect video, driving, and parking lot data. Read video tapes and
enter parking lot data into excel file. Morning Analyze Data. Read video tapes and enter parking lot data.
June 2, 2004 Wednesday Afternoon Collect video, driving, and parking lot data. Read video tapes and enter parking lot data into excel file.
Morning Analyze Data. Read video tapes and enter parking lot data. June 3, 2004 Thursday Afternoon Collect VOCE units and download data. Read video tapes and
enter parking lot data into excel file. Morning June 4, 2004 Friday Afternoon Analyze Data and Departure meeting
7
Section II
List of Equipment Temporarily Imported into Country and List
of Equipment Purchased in Country

8
9
Equipment Imported into the Country and then Returned to the US
Packing Case Number 11
Weight: 30.9 kilograms
Equipment Number of Items Serial Number Value
Computerized GPS Unit with power cord 1 001 $600 Computerized GPS Unit with power cord 1 002 $600 Computerized GPS Unit with power cord 1 003 $600 Computerized GPS Unit with power cord 1 004 $600 Computerized GPS Unit with power cord 1 005 $600
Total Units: 5 Total Value: $3,000
Packing Case Number 21 Weight: 30.9 kilograms
Equipment Number of Items Serial Number Value
Computerized GPS Unit with power cord 1 006 $600 Computerized GPS Unit with power cord 1 007 $600 Computerized GPS Unit with power cord 1 008 $600 Computerized GPS Unit with power cord 1 009 $600 Computerized GPS Unit with power cord 1 010 $600
Total Units: 5 Total Value: $3,000
Packing Case Number 3 Weight: 17.3 kilograms
Equipment Number of Items Serial Numbers Value
Vehicle Start Monitor 20 001A through
020A $1,000
Vehicle Start Monitor 11 022A through
032A $550 Vehicle Start Monitor 2 040B, 041B $100
Vehicle Start Monitor 13 043B through
055B $650
Vehicle Start Monitor 12 057B through
068B $600
Vehicle Start Monitor 22 100C through
121C $1,100 USB Serial Connectors 3 no serial $36
Total Units: 83 Total Value: $4,036
1 We are presently modifying the CGPS units to lower their weight and size. The number and value of the units will not change, but the weight and size may change reducing the need for Packing Case Number 2.
10
Packing Case Number 5
Weight: 30.0 kilograms
Equipment Number of Items Serial Numbers Value
Alligator clip adapters 6 none $30 Handheld Garmin GPS units 2 none $580 Voltage reduction transformers 2 none $38 Soldering iron w/extra tip and solder 1 none $12 Cross-over cables 4 none $12 Replacement gps antennas 4 none $80 Multiple outlet ext cords 3 none $15 Roll of Electricians tape 1 none $1 Water purification tablets (1 bottle) 1 none $3 Water filter 1 none $15 First aid kit 1 none $19 Scissors 1 none $2 Small tool kit 1 none $5 Clip board 1 none $2 Blank CD’s 12 none $6 Stapler 1 none $5 Small bag of rubber bands 1 none $1 Roll adhesive-back Velcro 1 none $3
Total Items: 44 Total Value: $829 Packing Case Number 6
Weight: 30.0 kilograms
Equipment Number of Items Serial Numbers Value
Sony DCR-PC110 Digital Camera and accessories 2
1175780 & 1344006 $1,500
Sony GV-D1000 DV Deck and accessories 2 331037 & 327600 $1,200 Camera tripods & heads 2 none $80 Batteries for cameras and DV decks 6 none $360 DV tapes for cameras 40 none $120
Total Items: 52 Total Value: $3,260

11
Supplies Needing to be Purchased in the Country
Supply Number of Items Serial Numbers Value
AA alkaline batteries 160 none $128

12

13
Section III
Financial and Planning Responsibilities

14

15
Financial and Planning Responsibilities: The IVE vehicle activity study process is intended to be a partnership and funds are limited. The International Sustainable Systems Research Center will provide up to three professional members of its staff and will cover all of their expenses. ISSRC will also cover reasonable vehicle and driver expenses, local mechanic expenses, technical support persons, security expenses (if needed), and student expenses. The local partners are expected to cover the cost of three professional (or two professional and a technical) level persons at their own expense to help set up the study before ISSRC personnel arrive, and to participate in the study for the two week data collection process, and to help collect limited amounts of data once the study is over if it is not possible to collect the data during the two week study process.
ISSRC Responsibilities Local Partner Responsibilities General Operations
Provide a program co-manager Provide a program co-manager ISSRC will work with local person to provide training in
understanding data processing process and use of IVE model. Provide a professional to review and process data.
Vehicle Driving Characteristics Provide 10 CGPS units for data collection. Select 9 streets (highway, arterial, residential) in three parts of the
urban area (upper income, central, lower income) in cooperation with ISSRC manager.
Pay for vehicles and drivers. Locate 3 passenger vehicles and drivers to operate vehicles 7 hours per day for 6 days.
Pay for students to ride on buses with CGPS units including bus fares.
Find 6 students to ride buses for two days each for seven hours each day.
No ISSRC expense is anticipated. Locate 12 delivery trucks. 2 trucks will carry a CGPS unit each day over a 6 day period.
ISSRC will pay a small stipend to the cab drivers to carry the CGPS units (they should not interfere with normal cab operations and to bring the CGPS units to the IVE office at the end of the test day.
Locate 12 taxi cabs to carry CGPS units. Two taxis will be used each day for the 6 day study period.
ISSRC will download and process data and provide training to the local partner professions on the process.
A professional will participate in the data downloading process to understand the process.
Parking Lot Survey ISSRC will accompany the lead person on the first day to provide training.
Provide a lead person to take the team into the field.
ISSRC will pay for the cost of the mechanics to work for the 6 days.
Identify two experienced mechanics to work in the field for 6 7 hour days.
ISSRC will pay for the cost of the 2 students to work for the 6 days.
Identify 2 students to work with the two mechanics to record data each day.
ISSRC will pay for the cost of the security person to work for the 6 days.
Identify a security person if determined to be necessary.
ISSRC will pay for the cost of the 2 students to enter data each day for 6 days.
Identify 2 students to enter parking lot data into an excel spread sheet.
Video Data Collection ISSRC will provide cameras and tripods and pay for the camera operation person.
Identify a camera operation person for 6 days for 7 hours per day.
ISSRC will pay for the camera support person. Identify a camera support person for 6 days for 7 hours per day. ISSRC will pay for the security person if needed. Identify a security person if deemed necessary the hours necessary. ISSRC will pay for the cost of the 2 students to read tapes and provide the necessary tape readers.
Identify 2 students to read tapes for 7 hours each day.
VOCE Data Collection ISSRC will provide 80 VOCE units to record vehicle start up data and pay for the 160 AA batteries..
Identify 80 typical vehicle owners who will receive the VOCE units and plug them into their vehicle for 8 days and purchase 160 AA batteries..
ISSRC will set up the VOCE units for use. Distribute the VOCE units to the vehicle owners recording information on who receives the units.
ISSRC will download and analyze the data in cooperation with local partners.
Collect units after 8 days.

16
It is possible to let students or mechanics and other technicians split jobs and share the pay if that makes it easier to obtain the needed support persons. The ISSRC will need to know the cost of the various local components before arrival in the study area in order to identify any funding shortfalls and to insure that appropriate funds are brought into the country to pay for needed services. The following table describes the staffing of the IVE activity study and financial responsibilities.
17
Section IV
Description of Field Activities for Measurement of Vehicle Activity Parameters
18
Table of Contents for Activity Measurement Description I. Introduction …………………………………………………………………... 20 II. Collecting Representative Data ……………………………………………… 22 III. On-Road Driving Pattern Collection Using GPS Technology ………………. 26 IV. On-Road Vehicle Technology Identification Using Video Cameras ………… 30 V. On-Road Vehicle Technology Identification Using Parked Vehicle Surveys .. 32 VI. Vehicle Start-Up Patterns by Monitoring Vehicle Voltage …………….……. 34 VII. Research Coordination and Local Support Needs …………………………… 36

19

20
I. Introduction This paper provides a description of the activities involved in a 2-week cooperative on-road vehicle study carried out in selected international urban areas. This International Vehicle Emissions (IVE) study is designed to efficiently collect important vehicle related data to support development of an accurate estimate of on-road vehicular emissions for the selected urban area. Emissions from on-road vehicles vary considerably depending upon three factors: 1) vehicle type, 2) driving behavior, and 3) local geographic and climatic conditions. Vehicle type is defined by the engine air/fuel management technology and engine size, emissions control technology, fuel type, accumulated use and age of the vehicle. Driving behavior can be described by a measured velocity profile of the local driving, the number and distribution of vehicle starts and daily miles traveled. Local conditions that affect vehicle emissions include road grade, fuel quality, ambient temperature, ambient humidity, and altitude of operation. Data collection in this study will help to define vehicle types and driving behavior in the urban area by collecting four types of information as indicted in Table I.1.
Table I.1 Types of Data Collection in the IVE Study Data Collection Method of Data Collection Described in Section
On-Road Driving Patterns GPS Instrumented Passenger, Bus, 2-Wheeler, 3-Wheeler, and Truck Vehicles
III
Vehicle Technology Distribution
Digital Video Collection and Parking Lot Surveillance IV, V
Vehicle Counts on Selected Streets Digital Video Collection IV
Vehicle start-up patterns VOCE units placed in recruited vehicles VI
The collected data will be formatted so that it is usable in the new International Vehicle Emission Model developed for estimating criteria, toxic, and global warming pollutants from on-road vehicles. The collected data may also be useable for other purposes by the local urban area. Local temperatures, humidity, fuel quality, total vehicular counts, and total driving amounts are not determined as a part of this study. Locally collected data is typically relied upon for these parameters. It may be possible to make a very rough approximation of total vehicle driving from the collected data if the number of vehicles in the urban area is known, but this approximation is subject to considerable error. To make an accurate emission analysis, the total amount of driving in an urban area must be assessed. If key data outside of the scope of this study is not available, then steps should be considered to determine this important data. ISSRC will work with the urban area to suggest ways to make such assessments.

21
22
II. Collecting Representative Data Before the specific study elements are described, it is important to consider the overall data collection process. The IVE study is carried out over a single 2-week study period. Given that there is limited equipment and study personnel, it is not possible to collect a complete data set over an entire urban area. Thus, the study must be designed to collect representative data that can be extrapolated to the full urban area. The IVE study process has been designed with this thought in mind. On-road driving varies by the time of the day, by the day of the week, and by the location in an urban area. To account for this, during the IVE study, data is collected at different times of the day and in different locations within an urban area. This study is not designed to generally capture data on the weekend or very late at night. Thus, the study is primarily applicable to weekday driving and only limited weekend extrapolations and assumptions about traffic flow very late at night can be made. Conducting a weekend study will produce valuable information and should be considered for future research2. It should also be noted that the collected data could be improved in the future by replicating data collection activities to improve statistics, expanding the parts of the city studied, and expanding the times that are studied. A. Selecting Parts of a City for Study Three representative sections of the city are normally selected for the IVE study. The areas selected should represent the fleet makeup and the general driving taking place in the city. It is recommended that one of the study areas represent a generally lower income area of the city, one of the study areas represent a generally upper income area of the city, and one of the study areas represent a commercial area of the city. The sections representing the upper and lower income areas of the city for study should not be the absolute poorest or richest part of the city. It is better to select areas that are representative of the lower half of the income and the upper half of the income. Normally the urban center is selected as the best commercial area to study. Due to their much greater knowledge of their own city, it is an important role of the local partners for an IVE study to play a primary role in the selection of the three appropriate parts of the urban area to study. ISSRC is amenable to modifications in the recommended study areas due to unique situations that might occur in a particular urban area. For example, there may not be a large enough discernable upper or lower income area. The following criteria should be used as guidelines for selecting adequate sites:
♦Selection of a low income, upper income, and commercial area with a variety of streets (i.e.
residential, freeway, and arterial) in the area.
♦Accessibility to a representative parking lot or on-street parking where up to 150 parked vehicles can be studied within 10 minutes walking of each site selected.
B. Selecting Driving Routes for Study
2 In Los Angeles, some of the worst air pollution levels now occur on the weekend. This is due to the modified driving patterns and fleet mix that occurs on weekends compared to weekdays.
23
Within each of the study areas, different types of streets must be analyzed to gather data representative of all of urban streets. Streets are often classified into three general groupings. The first group represents streets that are major urban connectors and can connect one urban area to another. These streets are typically characterized by the highest traveling speed in free-flow traffic with minimal stops from cross-flow traffic and are commonly referred to as highways or freeways in some cases. The second classification of streets represents streets that connect sections of an urban area. They may connect one section of an urban area with another or may provide an important connection within a section of the urban area. These streets are typically referred to as arterials. The third classification of streets represents the streets that take people to their homes or small commercial sections of an urban area, and are usually one- or two-lane roadways with a relatively lower average speed and frequent intersections. These streets are typically referred to as residential streets. Due to time limitations, only nine street-sections can be effectively studied during the IVE project. The term “street-section” as used in this study can include parts of more than one street, but to simplify data analysis, the streets that are included within a single street-section should all be the same street classification. For example, residential streets should not be mixed with highways in a single street-section. It is important that the nine selected street sections represent each of the important street types in the urban area. The following criteria should be used as guidelines for selecting suitable street- sections:
♦For each of the street-sections, accessibility to a safe and legal location for the camera team to be dropped where 2 cameras & tripods can be set up with a clear view of the nearby traffic (tripods are approximately 0.5 meters in diameter). This location should be within approximately 5 minutes of the driving route. Preferably, the cameras will capture a portion of the driving trace3 being covered by the chase vehicles.
♦Access to the different street types in a part of the city so that the chase vehicle can move
from one street-section type to another within 10 minutes driving time. This insures that time loss in moving from the highway street-section to the residential street section to the arterial street section and back does not require too much lost driving time.
♦A driving trace for each street segment must be defined so that the driver can complete it in
50 minutes or less under the worst traffic conditions that will be encountered during the study.
In the upper and lower income sections of the city, it is recommended that a highway street-section, an arterial street-section, and a residential street-section be selected in each of the two areas. In the commercial area it is recommended that a highway section and two arterial sections be selected for study. As noted earlier, the defined street-sections do not have to be the same street, although they should be the same classification of street for a street-section grouping. Figure II.1 shows an example of three street-segments designed for an upper-income area in Los Angeles, California.
3 A driving trace is the route followed by the chase vehicles as they drive along one of the selected street-sections.
Figure II.1 Example of a Residential, Arterial, and Freeway Street-Segment Selected for a Single
Study Area Designing a set of interconnected arterials or residential streets that ultimately connect to one another to form a circular drive can provide an effective street-section for this study. This circular design is often not possible with highways and the driver may have to drive one way on a highway and then return on that same highway on the other side of the street. During less congested times, it is often possible that a driver can drive the designated street-section more than one time. This is not a problem and simply adds to the database during a time period. As is the case with selecting general areas of the city to study, it is an important role of the local partners to select the nine streets to be studied. ISSRC will review the nine selected street sections and make recommendations as necessary. C. Times of Data Collection It is also important to collect data at different times of the day to account for traffic congestion and resulting changing flow rates as the day progresses. Testing is carried out normally over a 6 day period for the collection of urban driving patterns and vehicle technology data. Since driving in difficult traffic situations and collecting on-road vehicle technologies are typically very tiring and dirty activities, data collection is held to about 7 hours each day. Since information is typically needed from 06:00 to 20:00 to understand the complete cycle of traffic flow, the driving times are set for 7 hours in the morning on one day of data collection and 7 hours in the evening the next day of data collection. Data collection is normally started at 06:00 and continues until shortly before 13:00 for the morning data collection and starts at 13:00 and goes to shortly before 20:00 for the afternoon data collection. If 24

25
special circumstances exist in an area where data is desired at earlier or later times, this should be discussed in advance of the study period. D. Collecting Other Related Data Parking lot data is collected in the same parts of the city where on-road driving and technology data are collected. It is desirable to capture vehicle technologies that exist down to 1% of the fleet. To increase the probability of seeing the types of vehicles that exist at the 1% level and to improve the accuracy of vehicle use data, it is important to collect data on more than 1000 randomly selected parked vehicles over the 6-day study period. Generally, it is attempted to collect data on 400 vehicles in each of the three selected sections of the urban area; however, vehicle availability in lower income sections often reduce the total collected data to 1000 vehicles in the overall study. In the case of the collection of start-up data, individuals are asked to carry small data collection devices in their vehicles. It is important that the individuals selected for this portion of the study should be representative of the general driving population. It would be best to study at least 300 persons, but lack of time and equipment does not allow this large of a study. As discussed later in this paper, it is more efficient to collect data over more days from fewer persons. In all, it is hoped that 80 persons will use the units for at least 7 days per person to provide 560 person-days of information.
III. On-Road Driving Pattern Collection Using GPS Technology Collection of on-road driving pattern data will be conducted on the streets identified by local agencies as discussed in Section II. This data collection will be conducted using combined Global Positioning Satellite (CGPS) modules with microprocessors developed by ISSRC and GSSR. The unit is placed on a vehicle that drives on predetermined street sections with the flow of traffic. The CGPS module collects information about the location, speed, and altitude on a second by second basis. For areas with large passenger vehicle, bus, 2-wheeler, and/or 3-wheeler populations it is important to collect independent driving pattern data for all of these vehicles since they will likely operate differently. Ten CGPS modules will be provided for the study: three for passenger vehicles, one for a 2-wheeler if appropriate or in taxis, and two each for buses and 3-wheelers. Two units are brought for use in trucks. The collection procedure for each type of vehicle is described later in this section. Figure III.2 shows a typical CGPS unit. They weigh about 5.5 kilograms each and can be strapped to the back of a 2-wheeler or placed on the seat of a passenger vehicle. An antenna is required. In the case of 2-wheelers, 3-wheelers, and buses some experimentation may be required to find a suitable location for the antenna. The antenna is magnetic and will stick to the roof of automobiles easily. In the case of buses with fiberglass roofs, 2-wheelers, and 3-wheelers tape or other attachment means may be necessary. The antenna may be taped to the top of the CGPS box, the bus roof, or may be attached to the helmet of the 2-wheeler operator.
Figure III.2 CGPS Unit
A. Driving Pattern Collection for Passenger Vehicles and 2-wheelers To collect general passenger vehicle driving patterns, the local partners for the study must arrange for three passenger vehicles and local drivers to drive for eight hours each day for 6 days. In addition, one CGPS unit will be dedicated to the collection of 2-wheeler data4. The local study partners should identify up to six 2-wheelers and drivers to participate in this study5. Figure III.1 shows a passenger
4 The decision to collect data from 2-wheelers and 3-wheelers is dependent upon the size fraction of these types of vehicles in the fleet. In the case of studies in the United States and Chile it was determined that 2-wheelers and 3-wheelers were too small of a portion of the fleets to justify the collection of driving pattern data for these vehicles.
26
5 It should be okay to use as few as three 2-wheelers over the course of the study. It is important to get a cross section of 2-wheeler types that represent different engine sizes. The use of 6 2-wheelers will reduce driver fatigue during the course of the study. One 2-wheeler could operate each day through the 6-day study.
vehicle equipped with a GPS module as used in Santiago, Chile. The CGPS units do not require an operator or laptop computer. Thus, only the driver is necessary.
GPS Antenna
Laptop & Recorder
Driver
GPS Antenna
Laptop & Recorder
Driver
GPS Antenna
Laptop & Recorder
Driver
Figure III.1: GPS Instrumented Vehicle in Santiago, Chile
These drivers are asked to operate their vehicles on the nine designated street-sections (see Section II for a discussion of street-sections) over the course of the study. The purpose of the instrumented vehicle is to collect representative data concerning local passenger vehicle driving patterns. To accomplish this, the vehicle is operated on the selected street-sections in accordance with normal traffic at the time they operate. It is important that the drivers duplicate typical driving patterns for the study area. Each day, one of the instrumented vehicles is assigned to a different selected area of the city (see Section II for a discussion of the general test areas of the urban area). The vehicles will operate in their section of the urban area for two days before moving to the next selected area of the city. The first day they will operate their vehicles in the morning timeframe and the second day they will operate their vehicles in the afternoon timeframe. Each vehicle will operate on a selected street-section for 1 hour and then move to another of the selected street-section in a predetermined pattern. Since there are three street sections in an area, after the third section is reached, the driver will return to the first street section and repeat the process until the end of the 7-hour test period. Table III.1 shows the driving circuits for the three passenger vehicles and 2-wheeler. It is important that the drivers adhere strictly to the defined street-section order to insure that all times of the day are covered. The 3 parts of the urban area designated for study are denoted as Area A, Area B, and Area C. The 3 street-sections selected in each area are designated as street-section 1, 2, or 3. Thus the highway street-section in Area A is designated as Street-Section A.1 and similarly for the others.
27
28
Table III.1 Passenger Vehicle and 2-Wheeler Driving Circuits Day 1
Start End Passenger Vehicle 1 Passenger Vehicle 2 Passenger Vehicle 3 & 2-wheeler
06:00 07:00 Street-Section A.1 Street-Section B.1 Street-Section C.1 07:00 08:00 Street-Section A.2 Street-Section B.2 Street-Section C.2 08:00 09:00 Street-Section A.3 Street-Section B.3 Street-Section C.3 09:00 10:00 Street-Section A.1 Street-Section B.1 Street-Section C.1 10:00 11:00 Street-Section A.2 Street-Section B.2 Street-Section C.2 11:00 12:00 Street-Section A.3 Street-Section B.3 Street-Section C.3 12:00 13:00 Street-Section A.1 Street-Section B.1 Street-Section C.1
Day 2 06:00 07:00 Street-Section B.2 Street-Section C.2 Street-Section A.2 07:00 08:00 Street-Section B.3 Street-Section C.3 Street-Section A.3 08:00 09:00 Street-Section B.1 Street-Section C.1 Street-Section A.1 09:00 10:00 Street-Section B.2 Street-Section C.2 Street-Section A.2 10:00 11:00 Street-Section B.3 Street-Section C.3 Street-Section A.3 11:00 12:00 Street-Section B.1 Street-Section C.1 Street-Section A.1 12:00 13:00 Street-Section B.2 Street-Section C.2 Street-Section A.2
Day 3 13:00 14:00 Street-Section A.1 Street-Section B.1 Street-Section C.1 14:00 15:00 Street-Section A.2 Street-Section B.2 Street-Section C.2 15:00 16:00 Street-Section A.3 Street-Section B.3 Street-Section C.3 16:00 17:00 Street-Section A.1 Street-Section B.1 Street-Section C.1 17:00 18:00 Street-Section A.2 Street-Section B.2 Street-Section C.2 18:00 19:00 Street-Section A.3 Street-Section B.3 Street-Section C.3 19:00 20:00 Street-Section A.1 Street-Section B.1 Street-Section C.1
Day 4 06:00 07:00 Street-Section C.3 Street-Section A.3 Street-Section B.3 07:00 08:00 Street-Section C.1 Street-Section A.1 Street-Section B.1 08:00 09:00 Street-Section C.2 Street-Section A.2 Street-Section B.2 09:00 10:00 Street-Section C.3 Street-Section A.3 Street-Section B.3 10:00 11:00 Street-Section C.1 Street-Section A.1 Street-Section B.1 11:00 12:00 Street-Section C.2 Street-Section A.2 Street-Section B.2 12:00 13:00 Street-Section C.3 Street-Section A.3 Street-Section B.3
Day 5 13:00 14:00 Street-Section B.2 Street-Section C.2 Street-Section A.2 14:00 15:00 Street-Section B.3 Street-Section C.3 Street-Section A.3 15:00 16:00 Street-Section B.1 Street-Section C.1 Street-Section A.1 16:00 17:00 Street-Section B.2 Street-Section C.2 Street-Section A.2 17:00 18:00 Street-Section B.3 Street-Section C.3 Street-Section A.3 18:00 19:00 Street-Section B.1 Street-Section C.1 Street-Section A.1 19:00 20:00 Street-Section B.2 Street-Section C.2 Street-Section A.2
Day 6 13:00 14:00 Street-Section C.3 Street-Section A.3 Street-Section B.3 14:00 15:00 Street-Section C.1 Street-Section A.1 Street-Section B.1 15:00 16:00 Street-Section C.2 Street-Section A.2 Street-Section B.2 16:00 17:00 Street-Section C.3 Street-Section A.3 Street-Section B.3 17:00 18:00 Street-Section C.1 Street-Section A.1 Street-Section B.1 18:00 19:00 Street-Section C.2 Street-Section A.2 Street-Section B.2 19:00 20:00 Street-Section C.3 Street-Section A.3 Street-Section B.3
It is important that the passenger vehicle and 2-wheeler operators keep a record of the times when their driving should not be included in the analysis due to their taking a rest or leaving the study area. It is
29
also important that the drivers note any unusual traffic conditions that would invalidate the data. Each driver is to be supplied with a writing tablet and pen in order to make records of unusual traffic situations. The CGPS unit will record information on where the driver operated the vehicle and how it was operated. Thus, data analysis will indicate if the proper driving routes were followed. B. Measurement of Bus and 3-Wheeler Driving Patterns In the case of 3-wheelers and buses, student participants will be asked to take passage on suitable buses and 3-wheeler vehicles operating on the street sections of interest. Four units are dedicated to this purpose. Two units will be used for 3-wheelers and two units will be used for buses6. Care should be taken to select likely bus routes and 3-wheeler routes to be used before the study begins in order to avoid lost time once ISSRC personnel reach the study area.
6 The reserve CGPS units could also be used if the local partners are willing to provide additional 2-wheelers or students to collect bus and 3-wheeler data. Of course, if a CGPS unit fails the reserve units will have to be moved to replace the failed unit.
IV. On-Road Vehicle Technology Identification Using Digital Video Cameras Two digital video cameras are set up on the roadside or above the road to capture images of the vehicles driving by. This data is later manually reviewed to determine the number, size and type of vehicle. It is important to set the cameras at an appropriate height in order to have a good view of traffic on one side of a roadway. Useful data can be captured with the cameras located at the roadside, but on busy roads it is best to have the cameras elevated 1 to 3 meters above the street level when possible. Figure IV.1 shows videotaping in Santiago, Chile on a residential street. In this case due to the low traffic volume and small street size, videotaping could be carried out at street level. Figure IV.2 shows videotaping from an overpass of a freeway in Los Angeles, California. In this case due to the high traffic volume and the multiple lane roadway, data is best collected from directly above the street. Data is collected on the same roads and at the same times when driving patterns are being collected. This allows driving speeds and patterns determined from the CGPS units (discussed earlier in this paper) to be correlated with traffic counts taken from the digital video cameras. Thus, selection of roadways, as discussed in Section II, should consider the video taping requirements as well.
Traffic Count Camera
Detail Camera
Figure IV.1 Cameras Collecting Data on a Residential Roadway in Santiago, Chile
30
31
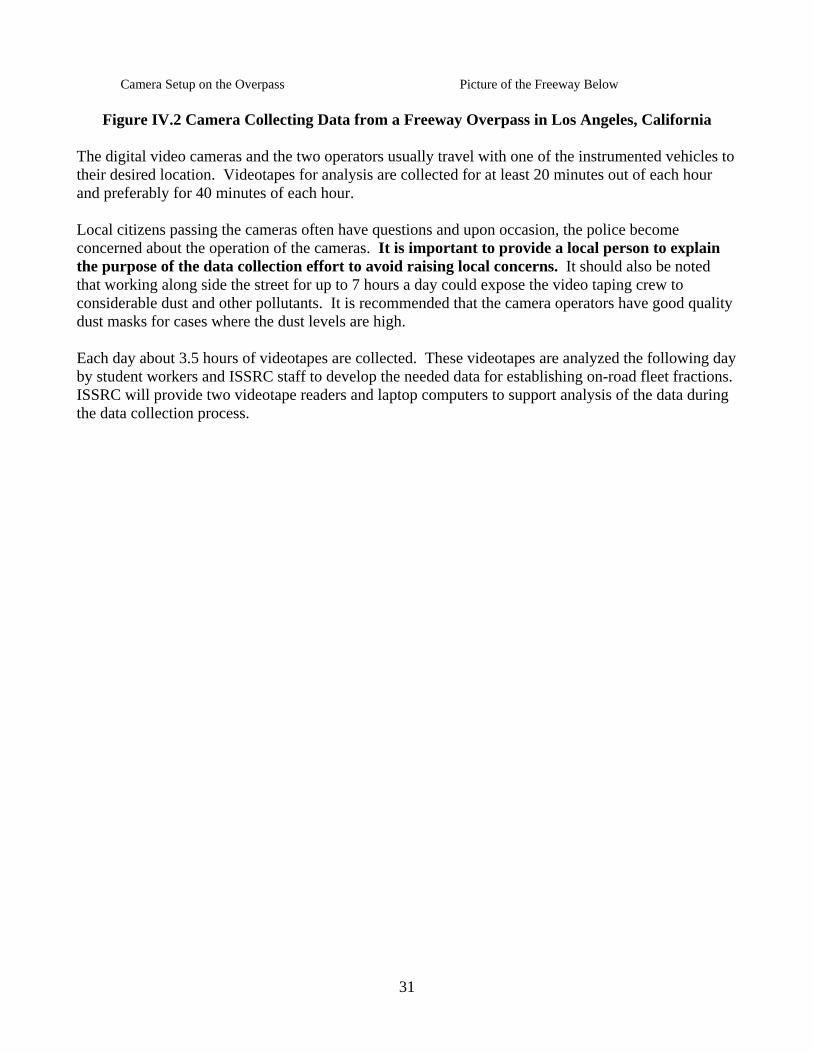
Camera Setup on the Overpass Picture of the Freeway Below
Figure IV.2 Camera Collecting Data from a Freeway Overpass in Los Angeles, California The digital video cameras and the two operators usually travel with one of the instrumented vehicles to their desired location. Videotapes for analysis are collected for at least 20 minutes out of each hour and preferably for 40 minutes of each hour. Local citizens passing the cameras often have questions and upon occasion, the police become concerned about the operation of the cameras. It is important to provide a local person to explain the purpose of the data collection effort to avoid raising local concerns. It should also be noted that working along side the street for up to 7 hours a day could expose the video taping crew to considerable dust and other pollutants. It is recommended that the camera operators have good quality dust masks for cases where the dust levels are high. Each day about 3.5 hours of videotapes are collected. These videotapes are analyzed the following day by student workers and ISSRC staff to develop the needed data for establishing on-road fleet fractions. ISSRC will provide two videotape readers and laptop computers to support analysis of the data during the data collection process.
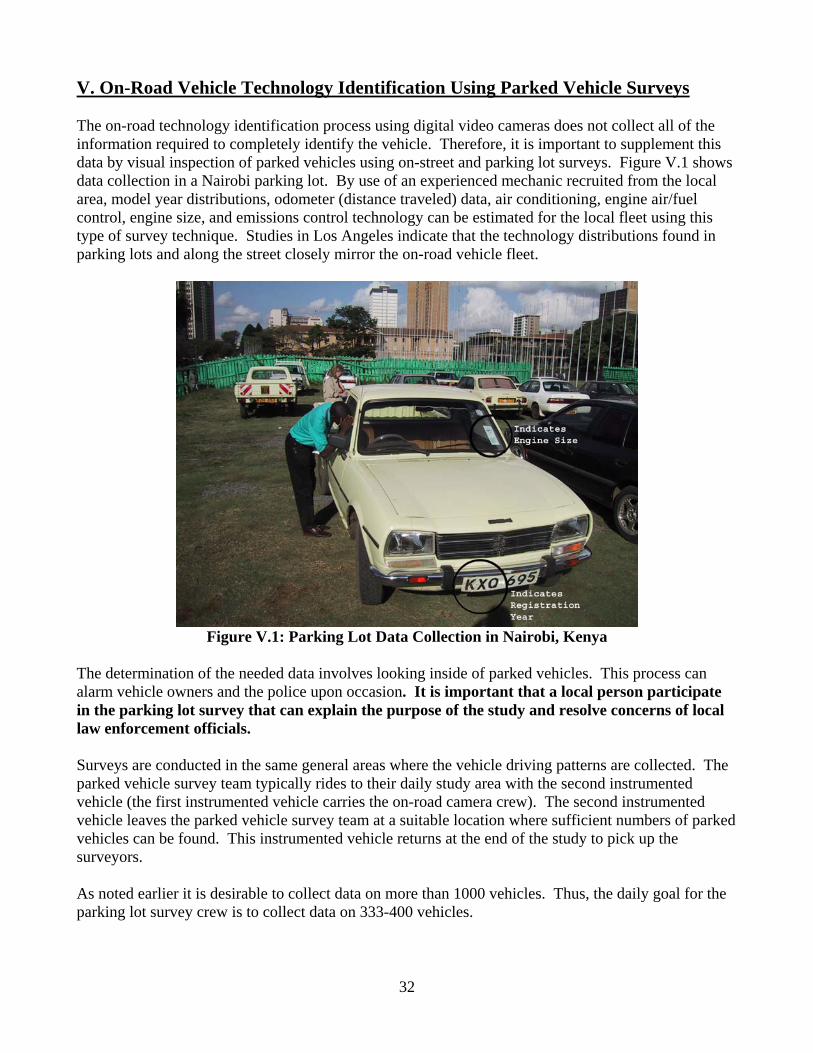
V. On-Road Vehicle Technology Identification Using Parked Vehicle Surveys The on-road technology identification process using digital video cameras does not collect all of the information required to completely identify the vehicle. Therefore, it is important to supplement this data by visual inspection of parked vehicles using on-street and parking lot surveys. Figure V.1 shows data collection in a Nairobi parking lot. By use of an experienced mechanic recruited from the local area, model year distributions, odometer (distance traveled) data, air conditioning, engine air/fuel control, engine size, and emissions control technology can be estimated for the local fleet using this type of survey technique. Studies in Los Angeles indicate that the technology distributions found in parking lots and along the street closely mirror the on-road vehicle fleet.
Figure V.1: Parking Lot Data Collection in Nairobi, Kenya
The determination of the needed data involves looking inside of parked vehicles. This process can alarm vehicle owners and the police upon occasion. It is important that a local person participate in the parking lot survey that can explain the purpose of the study and resolve concerns of local law enforcement officials. Surveys are conducted in the same general areas where the vehicle driving patterns are collected. The parked vehicle survey team typically rides to their daily study area with the second instrumented vehicle (the first instrumented vehicle carries the on-road camera crew). The second instrumented vehicle leaves the parked vehicle survey team at a suitable location where sufficient numbers of parked vehicles can be found. This instrumented vehicle returns at the end of the study to pick up the surveyors. As noted earlier it is desirable to collect data on more than 1000 vehicles. Thus, the daily goal for the parking lot survey crew is to collect data on 333-400 vehicles.
32

33
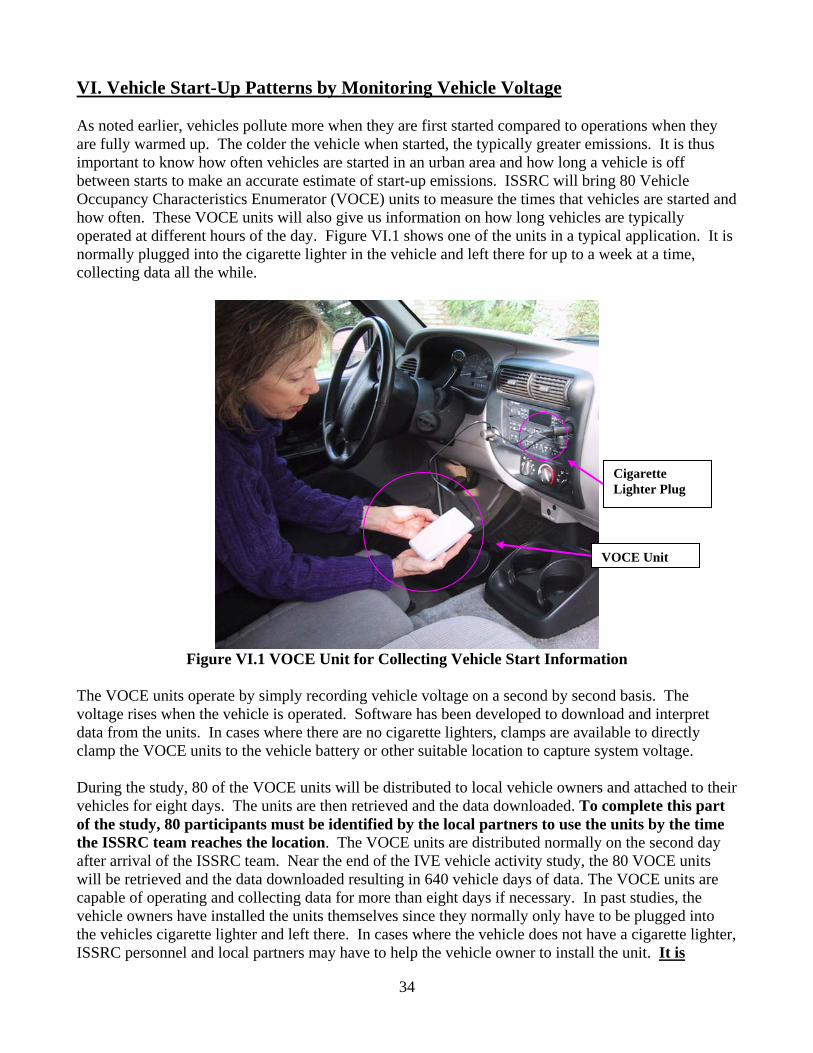
VI. Vehicle Start-Up Patterns by Monitoring Vehicle Voltage As noted earlier, vehicles pollute more when they are first started compared to operations when they are fully warmed up. The colder the vehicle when started, the typically greater emissions. It is thus important to know how often vehicles are started in an urban area and how long a vehicle is off between starts to make an accurate estimate of start-up emissions. ISSRC will bring 80 Vehicle Occupancy Characteristics Enumerator (VOCE) units to measure the times that vehicles are started and how often. These VOCE units will also give us information on how long vehicles are typically operated at different hours of the day. Figure VI.1 shows one of the units in a typical application. It is normally plugged into the cigarette lighter in the vehicle and left there for up to a week at a time, collecting data all the while.
Cigarette Lighter Plug
VOCE Unit
Figure VI.1 VOCE Unit for Collecting Vehicle Start Information The VOCE units operate by simply recording vehicle voltage on a second by second basis. The voltage rises when the vehicle is operated. Software has been developed to download and interpret data from the units. In cases where there are no cigarette lighters, clamps are available to directly clamp the VOCE units to the vehicle battery or other suitable location to capture system voltage. During the study, 80 of the VOCE units will be distributed to local vehicle owners and attached to their vehicles for eight days. The units are then retrieved and the data downloaded. To complete this part of the study, 80 participants must be identified by the local partners to use the units by the time the ISSRC team reaches the location. The VOCE units are distributed normally on the second day after arrival of the ISSRC team. Near the end of the IVE vehicle activity study, the 80 VOCE units will be retrieved and the data downloaded resulting in 640 vehicle days of data. The VOCE units are capable of operating and collecting data for more than eight days if necessary. In past studies, the vehicle owners have installed the units themselves since they normally only have to be plugged into the vehicles cigarette lighter and left there. In cases where the vehicle does not have a cigarette lighter, ISSRC personnel and local partners may have to help the vehicle owner to install the unit. It is
34

35
important that none of the VOCE units are lost because they are each hand built and can not be easily replaced. To complete this part of the operation, one local person is normally required to spend most of their time during the testing program to first identify 80 participants in advance and then to give out and retrieve the units. Vehicle owners often forget to bring the VOCE units back when they are supposed to or have a problem that keeps them from coming to work to return the units. Thus, while simple in concept, identification, deployment and retrieval of 80 units in the proper timeframe can be a complicated and tedious process. Finally, in selecting vehicle owners to use the VOCE units it is import to select persons that represent a cross section of drivers in the urban area of interest.
36
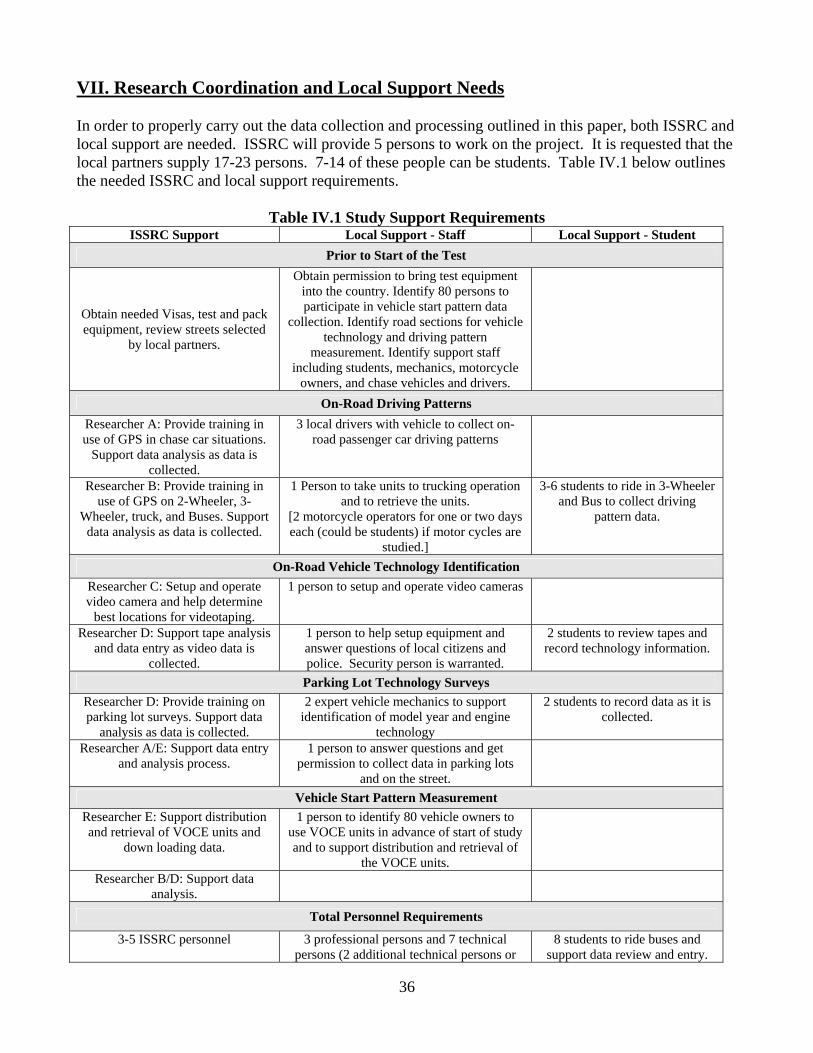
VII. Research Coordination and Local Support Needs In order to properly carry out the data collection and processing outlined in this paper, both ISSRC and local support are needed. ISSRC will provide 5 persons to work on the project. It is requested that the local partners supply 17-23 persons. 7-14 of these people can be students. Table IV.1 below outlines the needed ISSRC and local support requirements.
Table IV.1 Study Support Requirements ISSRC Support Local Support - Staff Local Support - Student
Prior to Start of the Test
Obtain needed Visas, test and pack equipment, review streets selected
by local partners.
Obtain permission to bring test equipment into the country. Identify 80 persons to participate in vehicle start pattern data
collection. Identify road sections for vehicle technology and driving pattern
measurement. Identify support staff including students, mechanics, motorcycle
owners, and chase vehicles and drivers.
On-Road Driving Patterns Researcher A: Provide training in use of GPS in chase car situations.
Support data analysis as data is collected.
3 local drivers with vehicle to collect on-road passenger car driving patterns
Researcher B: Provide training in use of GPS on 2-Wheeler, 3-
Wheeler, truck, and Buses. Support data analysis as data is collected.
1 Person to take units to trucking operation and to retrieve the units.
[2 motorcycle operators for one or two days each (could be students) if motor cycles are
studied.]
3-6 students to ride in 3-Wheeler and Bus to collect driving
pattern data.
On-Road Vehicle Technology Identification Researcher C: Setup and operate video camera and help determine
best locations for videotaping.
1 person to setup and operate video cameras
Researcher D: Support tape analysis and data entry as video data is
collected.
1 person to help setup equipment and answer questions of local citizens and police. Security person is warranted.
2 students to review tapes and record technology information.
Parking Lot Technology Surveys Researcher D: Provide training on parking lot surveys. Support data
analysis as data is collected.
2 expert vehicle mechanics to support identification of model year and engine
technology
2 students to record data as it is collected.
Researcher A/E: Support data entry and analysis process.
1 person to answer questions and get permission to collect data in parking lots
and on the street.
Vehicle Start Pattern Measurement Researcher E: Support distribution and retrieval of VOCE units and
down loading data.
1 person to identify 80 vehicle owners to use VOCE units in advance of start of study and to support distribution and retrieval of
the VOCE units.
Researcher B/D: Support data analysis.
Total Personnel Requirements
3-5 ISSRC personnel 3 professional persons and 7 technical persons (2 additional technical persons or
8 students to ride buses and support data review and entry.
37
students if motorcycles are included) to support field operations
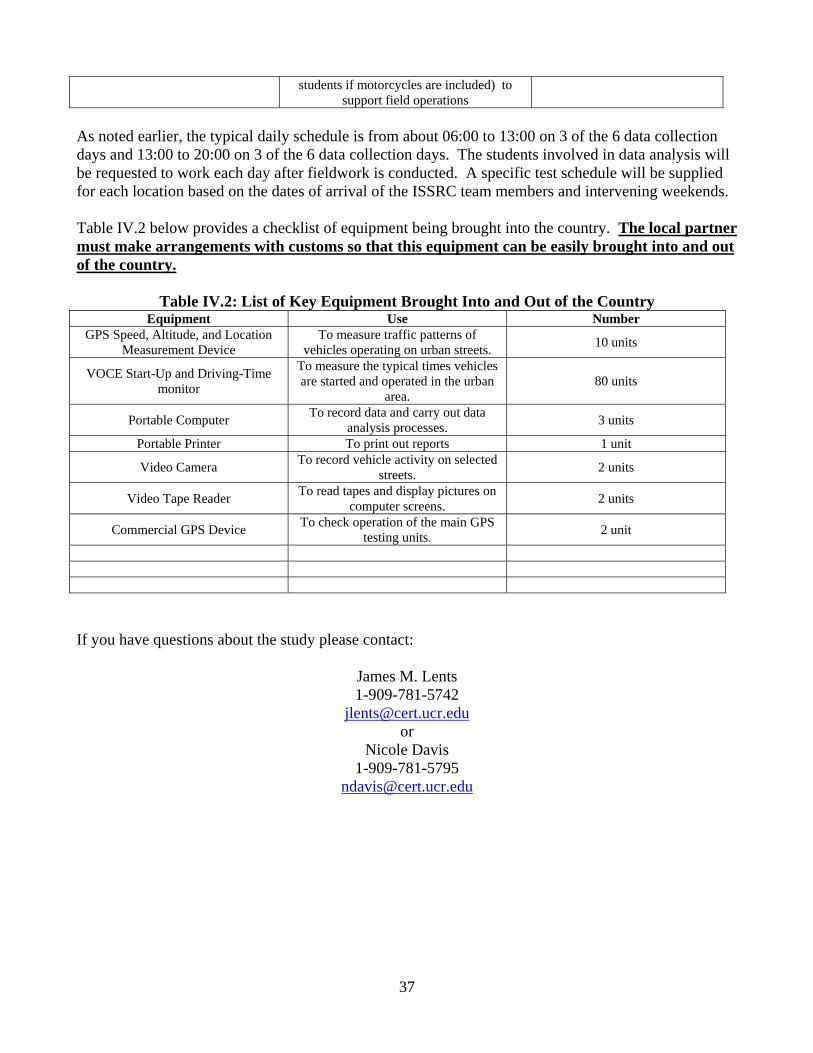
As noted earlier, the typical daily schedule is from about 06:00 to 13:00 on 3 of the 6 data collection days and 13:00 to 20:00 on 3 of the 6 data collection days. The students involved in data analysis will be requested to work each day after fieldwork is conducted. A specific test schedule will be supplied for each location based on the dates of arrival of the ISSRC team members and intervening weekends. Table IV.2 below provides a checklist of equipment being brought into the country. The local partner must make arrangements with customs so that this equipment can be easily brought into and out of the country.
Table IV.2: List of Key Equipment Brought Into and Out of the Country Equipment Use Number
GPS Speed, Altitude, and Location Measurement Device
To measure traffic patterns of vehicles operating on urban streets. 10 units
VOCE Start-Up and Driving-Time monitor
To measure the typical times vehicles are started and operated in the urban
area. 80 units
Portable Computer To record data and carry out data analysis processes. 3 units
Portable Printer To print out reports 1 unit
Video Camera To record vehicle activity on selected streets. 2 units
Video Tape Reader To read tapes and display pictures on computer screens. 2 units
Commercial GPS Device To check operation of the main GPS testing units. 2 unit
If you have questions about the study please contact:
James M. Lents 1-909-781-5742
Nicole Davis 1-909-781-5795

38

Section V
Forms Used in Field Activities and Field Activity Guidance
39

40

Guidance for Determination of Driving Characteristics
Introduction
The overall goal of the driving characteristics portion of the activity study is to determine the manner in which vehicles are generally driven within a particular city or area. Speed, rates of acceleration and deceleration, length of time idling, etc., all have an effect on the emissions from vehicles. In this portion of the study, we will attempt to establish the general driving pattern for the entire population of drivers in the city/area using only three drivers, three vehicles, and nine different routes. As a result, it is very important that the routes properly selected and the drivers follow the instructions provided. This guidance is divided into four sections: Selection of Routes; Instructions for Drivers; Operation of CGPS Units; and, Downloading of CGPS Data.
Selection of Routes
Three representative sections of the city are normally selected for the vehicle activity study. The areas selected should represent the fleet makeup and the general driving taking place in the city. It is recommended that one of the study areas represent a generally lower income area of the city, another represent a generally upper income area of the city, and the third represent a commercial area of the city. The sections representing the upper and lower income areas of the city for study should not be the absolute poorest or richest part of the city. It is better to select areas that are representative of the lower and upper halves of income. Normally, the urban center is selected as the best commercial area to study. Within each of the study areas, different types of streets must be analyzed to gather data that is representative of the entire urban area. Streets are often classified into three general groupings. The first group represents streets that are major urban connectors and can connect one urban area to another. These streets are typically characterized by the highest traveling speed in free-flow traffic with minimal stops from cross-flow traffic and, are commonly referred to as highways or freeways. The second classification of streets represents streets that connect sections of an urban area. They may connect one section of an urban area with another or may provide an important connection within a section of the urban area. These streets are typically referred to as arterials. The third classification of streets represents the streets that take people to their homes or small commercial sections of an urban area, and are usually one- or two-lane roadways with a relatively lower average speed and frequent intersections. These streets are typically referred to as residential. Three street routes should be selected within each of the three areas. In the higher and lower income areas, the routes selected should be a residential route, an arterial route, and a highway route. In the commercial area, the routes selected should be two separate arterial routes and a highway route. When selecting these routes, several things should be kept in mind: first, the entire route should be made up of the same classification (residential, arterial, highway) of roadway; second, if possible, the route should be designed as a continuous loop that can be driven without the need to stop and turn around at each end; third, the length of the route should be such that, under the worst expected driving conditions, the full length can be driven within the
41
40 minute driving cycle; and lastly, that it contain a section where cameras can be set up with a clear view of the traffic in order to establish the number and type of vehicles using the roadway.
Instructions for Drivers It has been found that the streets of most, if not all, cities in the world generally fall into one of three types: residential, arterial, and highway. Residential streets are simply streets for vehicle traffic within residential areas. Arterial streets are those that provide travel between different parts of an urban area. Highways are those roadways that provide travel between different urban areas. Generally speaking, residential streets have the slower overall speeds, arterial streets have somewhat higher speeds, and highways have the highest speeds. However, this is not universally true. Road conditions and traffic congestion can have a large effect on the general speed associated with any particular roadway. For this study, nine driving routes have been selected. A certain number (generally two or three) will be representative of residential streets. Three or four of the routes will be representative of arterial streets and three will be representative of highways. Three drivers will each drive every route during different hours of the day over a six day period. A unit that employs the global positioning system (GPS) and stores the data in an attached microprocessor, will be located in each of the three vehicles. This unit will provide a second-by-second recording of the speed, rates of acceleration and deceleration, and elevation change as each vehicle is driven on the assigned routes. It is critical that the type of driving done during this study is representative of the way vehicles are normally driven in this city/area. This is not a contest between the three drivers. Drivers are not judged on how fast they drive the routes or how they obey or disobey traffic signals. The most important thing is that drivers drive with the flow of traffic. This means that they are not driving faster or slower than the other vehicles on the road at that time. If the driver is being passed by a majority of the vehicles on the road, he/she is not driving fast enough. If the driver is passing the majority of the vehicles on the road, he/she is driving too fast. Sometimes, it is helpful to simply pick out a vehicle and then follow behind that vehicle maintaining the same distance between the two vehicles. If this approach is employed, the driver should not select a vehicle and then accelerate up to the vehicle before matching speed with it. Instead, the driver should select a vehicle, note the distance that vehicle is from his/her vehicle and try to maintain that distance during the period of time they are following it. If the vehicle pulls over to park, or leaves the route that being driven, the driver should select another vehicle that is on the assigned route and begin following it. This selection process should be varied between traffic lanes in cases where the assigned street has more than one traffic lane. In a situation where there are no other vehicles on the road, the driver should drive just as he/she normally would, given the existing road, weather, and traffic conditions. During each of the six days of the study, drivers will be required to drive assigned routes for at least 40 minutes of each of the seven hours of the work period. The remaining 20 minutes of the hour are intended for travel between routes and necessary rest breaks. For three of the days, the work period will begin at 6 a.m. and end at no earlier than 12:40 p.m. For the other three days, the work period will begin at 1 p.m. and end at no earlier than 7:40 p.m. During the study, each
42
driver will end up driving residential routes for two days, arterial routes for two days, and highways for two days. An exception to this would be in the case where one additional arterial route is selected in place of one of the residential routes. It is important that the drivers are at the beginning of each route with enough time so that a full 40 consecutive minutes of driving can be performed during each hour of the work period. The 40 minute driving period should not overlap into the next hour. A schedule will be provided to each driver that indicates the route to be driven during each hour of each day’s work period. It will be the driver’s responsibility to make sure they are at the start of the route in sufficient time to obtain 40 minutes worth of driving data during the assigned hour. It will also be the driver’s responsibility to turn the GPS unit on and make sure it is indicating that data is being collected before starting the first route of each day and to turn the unit off when 40 minutes of data has been collected from the last route of each day. During the seven hours of the daily work period, driver’s will need to periodically observe the light on the GPS unit to make sure it is collecting data. More in-depth instructions on the operation of the GPS unit are provided below.
Operation of Combined Global Positioning System (CGPS) Units Basically these units are a combination of a GPS module to collect data and a microprocessor module to store the data. Provided that signals are being received from at least three satellites, data on the location of the antenna is collected on a second by second basis. Since speed is simply distance traveled per unit of time, this second by second data provides a determination of the speed, as well as rates of acceleration and deceleration, of the vehicle carrying the antenna. Because the GPS module can also provide second by second data on the elevation of the antenna, the slope (grade) of the roadway being traveled can also be determined. The slope of the road and the speed of the vehicle allows a determination of the workload under which the vehicle engine is being operated. Upon receiving the CGPS unit at the beginning of each work day, the driver should make sure the unit is operating correctly. This is done by placing the antenna on top of the roof of the vehicle. The base of the antenna is magnetic and will make a firm attachment to the metal roof. In the case, where a vehicle roof is made of fiberglass, or other non-magnetic material, Velcro tape can be used to attach the antenna to the roof. This is accomplished by peeling the paper off the loop side of the Velcro and attaching it to the bottom of the antenna. Similarly, the hook side of the Velcro is attached to the front center of the roof. The antenna is then placed on the Velcro that is adhered to the roof. Once the antenna is in place, the CGPS case should be placed on the seat beside the driver. To do this, it is best to route the antenna wire through the opened passenger-side door. The door can subsequently be closed on the antenna wire without damaging it. Don’t route the antenna wire through the window since this can result on the antenna or antenna wire inadvertently being damaged if the door is opened. Once placed on the seat, the case must be opened to access the on/off switch. The switch is located on the top of the GPS module. It is a rocker switch. The lower part of the rocker must be fully depressed in order to turn the CGPS unit on. Once turned on, a small red light will come on. At this point, the red light simply indicates that the GPS module is receiving power from the battery. Once the GPS module begins to receive signals from at least three satellites, the light will begin to blink. The number of blinks indicates the number of satellites from which signals are being received. The
43
number of blinks will change from time to time as contact with satellites is lost with one and acquired with another. In order for the CGPS unit to be collecting data, the light must be periodically blinking. Once a CGPS unit has been acclimated to its new location, it should only take a few minutes each time the unit is turned on for it to acquire the needed satellites. Tall buildings and other solid obstacles can block the satellite signals. For this reason, it is important to make sure the vehicle is in a reasonably open area when the CGPS unit is first turned on. While driving the assigned route, the driver should check the CGPS unit on a frequent basis to make sure the light is still blinking. If the light stops blinking for a minute or more, it could indicate a problem. If this occurs, the driver should safely pull over to the side of the street, or off the street, and park the vehicle in a reasonably open area. The switch on the GPS module should be turned off by depressing the top side of the rocker fully. Leave the unit turned off for approximately 90 seconds. Then turn the unit back on using the rocker switch. If, after 10 minutes, the light still has not begun to blink, the driver should contact the project coordinator for further instructions.
Downloading of CGPS Data
Plug crossover cable into computer and CGPS unit. Double click on “Shortcut to GSSR_GPS.exe.” to bring up the CGPS data download program. Turn on the CGPS unit by pushing down the lower end of the rocker switch on the top of the GPS module. In a moment, the red colored button entitled, “No GPS Detected” will turn green and the wording will change to “Receiving Data,” indicating it has connected with the CGPS unit. Click on the “Run Download Macro.” to download the data. Bring up the Microsoft Excel program and click “file” and “open.” Locate the downloaded data (it will be titled “flash_gsp_data_six digit date_six numbers.log”) on the “C Drive” (you will have to look under “all files”) and double click on the title. A macro will appear indicating that the data is “Delimited.” Click on the “Next” button. Another macro will appear indicating that it is “tab” delimited. Click on the “Next” button. A third and final macro will appear that indicates the date, time, CGPS number, and blocks containing data. Click on the “Finish” button. The data will then appear in column format on the Excel spreadsheet. Click on “File”/”Save As” and name the file by indicating the vehicle type (smalltruck, mediumtruck, largetruck, smallbus, mediumbus, largebus, taxi, motorcycle, rickshaw, etc) followed by a dash and the 6 digit (mmddyy) date on which the data was collected (example: smalltruck-081103). For data collected by one of the three passenger cars that are driving on the designated routes, the name of the file should be “Vehicle” followed by the number of the vehicle (1, 2, or 3) followed by a dash and the 6 digit date on which the data was collected (example: vehicle1-081103). Make sure it is saved as an Excel (.xls) file. If you do not save it as an .xls file, you will receive a message indicating the data may contain features that are not compatible with text (Tab delimited). It will ask you if you want to keep the workbook in this format. If this happens, click “No” and then rename the file as a .xls and save on your desktop. Create a file folder on your desktop and name it LocationGPSSixDigitDate (example: LimaGPS081103). At this point, go back to your GPS download macro and click on “Set flash position to new beginning.” In effect, this clears the memory of the CGPS unit so it is ready to collect and store the next day’s data. Drag and drop all of the files of the CGPS data collected on that date into that file folder. At the end of each day, store all of the day’s data on a CD for data security.
44
45
Parking Lot Data Collection
The parking lot survey is intended to develop a database on the technology distribution of vehicles in the urban area. Data should be collected in parking lots were a cross-section of urban vehicles (high income and low income) will be found. Grocery store parking lots and on-street parking offer good options. Shopping center parking lots can also produce good data, but the type of shopping centers selected should include places visited by lower income persons as well as higher income persons. A data collection team typically consists of five to six persons. There is a lead person who selects parking lots explains to guards the nature of the data collection process and gets permission to collect data when needed. There are two data collection groups made up of two persons in each group. One member of a data collection team records data and can be a student. The second person in a data collection team should be an experienced mechanic or equivalent who can identify model year of the vehicle, engine technology, control technology and other information required on the data entry form. The sixth person is a security person if a security person is required. Each mechanic/data recording team should be able to collect information on 120 vehicles per day. Thus the two teams should be able to collect data on 240 vehicles total each day. During the six day sampling process, data on 1440 vehicles. This data collection process is intended to collect data on passenger vehicles. This can be both four wheel and two wheel vehicles. Additional surveys are often needed for buses, trucks, and other important fleet vehicles. The form shown on the next page is typically produced in sufficient quantity to allow the recording of information on 1440 vehicles and distributed to the survey team as needed. Once data is recorded on the data collection sheets, they should be returned to the IVE office where the data will be entered into an excel spread sheet each day.
46
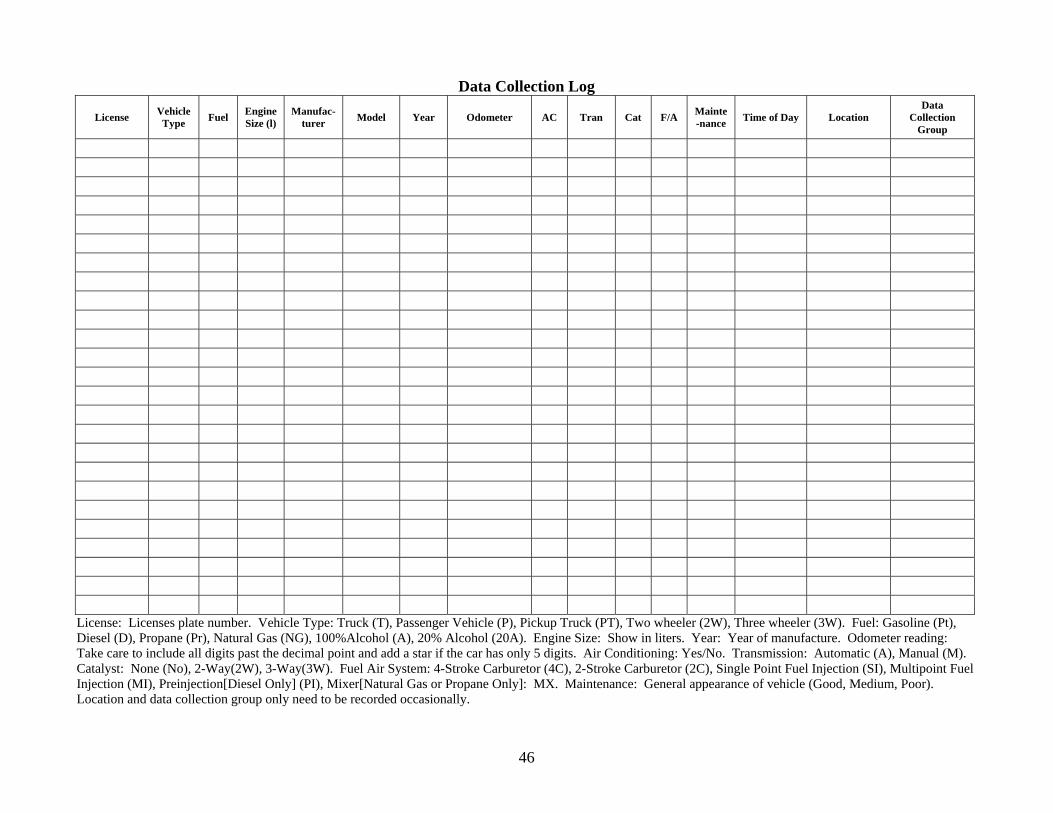
Data Collection Log
License Vehicle Type Fuel Engine
Size (l) Manufac-
turer Model Year Odometer AC Tran Cat F/A Mainte-nance Time of Day Location
Data Collection
Group
License: Licenses plate number. Vehicle Type: Truck (T), Passenger Vehicle (P), Pickup Truck (PT), Two wheeler (2W), Three wheeler (3W). Fuel: Gasoline (Pt), Diesel (D), Propane (Pr), Natural Gas (NG), 100%Alcohol (A), 20% Alcohol (20A). Engine Size: Show in liters. Year: Year of manufacture. Odometer reading: Take care to include all digits past the decimal point and add a star if the car has only 5 digits. Air Conditioning: Yes/No. Transmission: Automatic (A), Manual (M). Catalyst: None (No), 2-Way(2W), 3-Way(3W). Fuel Air System: 4-Stroke Carburetor (4C), 2-Stroke Carburetor (2C), Single Point Fuel Injection (SI), Multipoint Fuel Injection (MI), Preinjection[Diesel Only] (PI), Mixer[Natural Gas or Propane Only]: MX. Maintenance: General appearance of vehicle (Good, Medium, Poor). Location and data collection group only need to be recorded occasionally.

Instructions for Video Taping of Vehicle Traffic
It must be decided at the beginning of the study if one or two cameras are to be used at each site in the study. The primary camera is intended to capture the overall traffic flow in one direction of traffic flow on the selected road(s). If a second camera is used, this second camera will be used to either collect data concerning the number of passengers in the vehicle, the licenses plate of the vehicle, or detailed information concerning the technology of the vehicle. The camera operator should clearly establish with the study director the purpose of the second camera. In almost all cases the second camera, if used, will be focused more tightly on vehicles and can only collect data on one lane of traffic. Camera Operation The cameras used in the IVE activity study are standard consumer digital cameras. They use the standard mini-DV tapes. The director of the study or his designee will demonstrate how to use the cameras supplied for this study including putting in DV tapes, starting the camera, and zooming to the proper frame. The cameras have an automatic focus and this does not normally have to be touched. The camera operator should, however, become familiar with how to turn the automatic camera focus on in case it accidentally gets turned off. During camera operation the operator should check the view of the camera every three or four minutes to insure that the focus is okay and that the camera is recording data and pointed in the proper direction. A camera stand is supplied for each camera used in the study. The study director will demonstrate how to attach the camera to the camera stand. In cases where the camera must be operated at street level, the camera stand is normally elevated to as high a position as possible to capture the needed data. The camera batteries, if fully charged, will operate for 4-5 hours of recording. Thus, the batteries do not need to be changed during the day. A spare battery is provided in case a problem develops with one of the camera batteries. It is critical that all of the camera batteries be charged each night. There have been cases where passersby hit or try to steal the cameras and camera stands. Care must be taken to watch the cameras at all times. It is also important to find a safe location to store the cameras when they are not in use. DV Tapes The mini-DV tapes used in the study are guaranteed to record up to 60 minutes of data. They will usually record a little more than 60 minutes up to 65 minutes in some cases. In a normal day of testing, 7 hours of traffic will be studied. In order to simplify data analysis and reduce the number of DV Tapes used, only 20 minutes of video are recorded out of each hour. This also allows time for the camera to be moved, disassembled, and prepared for movement to the second and third camera sites each hour. Thus, a single tape will work to
47
record traffic flow for each hour of the study for three hour segments. It is important that the camera operator watch the time and stop the video taping as close to 20 minutes as possible. A seven hour study day will require 3 DV Tapes per camera. The camera operator should carry at least four tapes per camera in case a tape fails during use. Each tape must be carefully marked to indicate if the tape was from the Primary Camera or the Secondary Camera in cases where two cameras are used. The date, times, and locations of recorder (i.e. A1, A2, A3, B1, B2, B3, C1, C2, C3) must be recorded on each tape. Otherwise the data reviewer will be unable to tell the location of video taping. Each DV tape comes with labels that can be fixed to the DV tape for this purpose. In order to ensure that there is no question about the time and location of a section of video tape, at the beginning of each hour of video taping, the date, time, and location is written on a white sheet of paper and photographed at the beginning of the recording session so that the reviewer will be sure of the time and location of each video tape section. The white sheet of paper should contain the date, the time, and the video location clearly written. It is okay to use the same sheet of paper for each camera at a location and time since the DV tape will indicate which camera the tape came from. The video camera operator must have seven sheets of paper each day and a dark pen to write on the paper for photographing. The video camera operator must also have a pen to record data on the individual DV tapes. Primary Camera Location The Primary Camera is used to count the number of vehicles going in one direction on the road and to determine what fraction of the vehicles are passenger cars, trucks, buses, motorcycles, and the like. Thus, it should be set up to allow a tape review person to make such counts at a later date. It is best if the Primary Camera can be elevated so that vehicles in the lane closest to the camera do not obscure the vehicles in the other lanes of the street. This becomes the most difficult on streets with more than 2 lanes, but can be a problem even on 2 lane roads. The best place to locate the Primary Camera is on an overpass or in some other elevated position that has a clear view of the road. The camera is then zoomed into the appropriate frame size that will capture the entire roadway in one direction. If it is not possible to find an elevated camera location then the camera stand should be adjusted to get the best view possible. The camera stand supplied for the Primary Camera was selected to be tall. The camera operator should make sure and select the tallest reaching camera stand for the Primary Camera. Secondary Cameral Location The Secondary Camera is normally located along side the Primary Camera. It is, however, zoomed in to look at whatever feature of the traffic that the program director specifies. This is normally to record the number of occupants in each vehicle. Otherwise, the same steps are taken
48
as used for the Primary Camera. Care should be taken to make sure that the tapes from the Secondary Camera are clearly marked to indicate that the tape is from the Secondary Camera. Use of DV Tapes after Recording Once a DV Tape is recorded, the red switch on the DV tape should be flipped to protect the tape so that the video tape will not be accidentally erased. The recorded tapes should be put back into their original box and supplied to the study director each day so that they can be reviewed as quickly as possible. Analysis of the Primary DV Tape The video tape reviewer will place a DV Tape in a tape viewing unit that is supplied with this study. The tape viewing unit allows tapes to be stopped, run in slow motion, or backed up to help produce accurate vehicle counts. A sample video data recording sheet can be found on the next page with a description of the of the vehicle classes that the counts are divided into. The reviewer looks at the video tape, stopping it and putting it into slow motion as needed, and records the starting and ending times of each video section, the hour represented by the video section, and the count of each type of vehicle that is observed in the video tape.
49

50

Video Taping Information Sheet (to be filled out and video taped at each taping location)
Date: Date:
Route: Route:
Hour: Hour:
Camera: Camera:
Date: Date:
Route: Route:
Hour: Hour:
Camera: Camera:
Date: Date:
Route: Route:
Hour: Hour:
Camera: Camera:
Date: Date:
Route: Route:
Hour: Hour:
Camera: Camera:
51

52
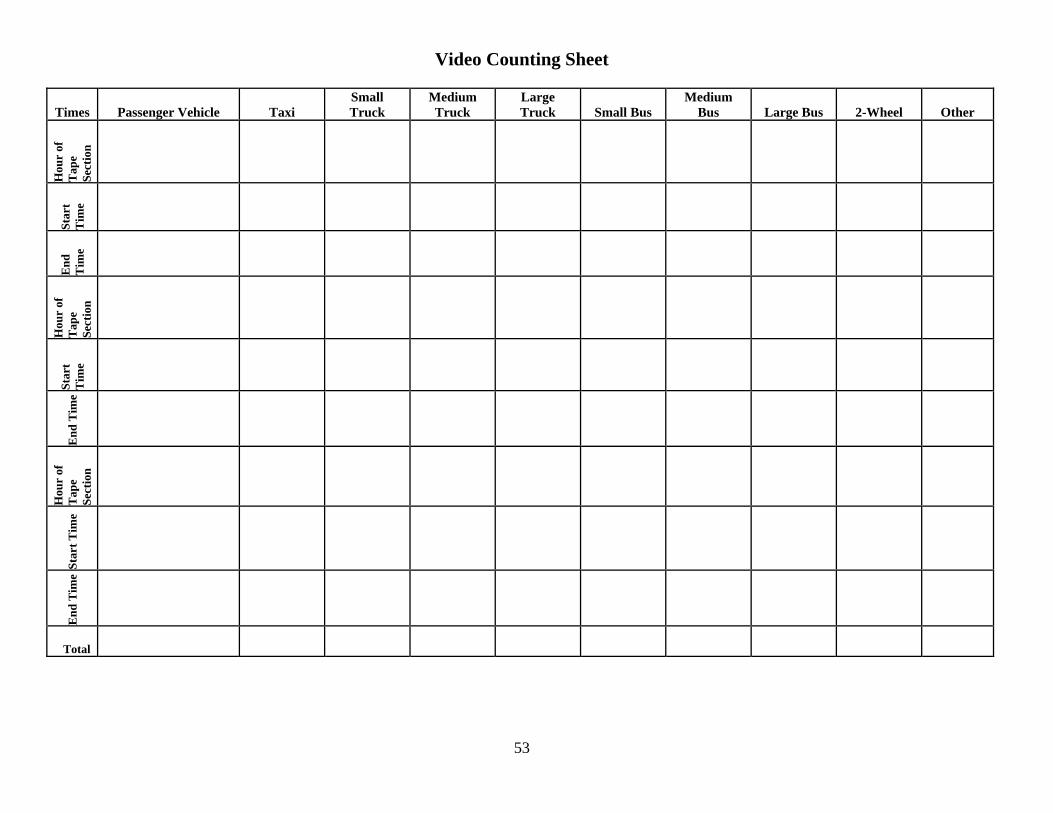
53
Video Counting Sheet
Times Passenger Vehicle Taxi Small Truck
Medium Truck
Large Truck Small Bus
Medium Bus Large Bus 2-Wheel Other
Hou
r of
T
ape
Sect
ion
Star
t T
ime
End
T
ime
Hou
r of
T
ape
Sect
ion
Star
t T
ime
End
Tim
e
Hou
r of
T
ape
Sect
ion
Star
t Tim
e
End
Tim
e
Total

54

55
Start-Up Data Collection Using VOCE Units VOCE Distribution Instructions This document describes the procedure for distributing the VOCE sensors to volunteers who have agreed to place the VOCE sensor in their vehicle for several days. There are approximately 80 VOCE sensors to distribute, and each unit is typically distributed near the beginning of the study and collected near the end of the study. It is of important that the method of distributing and collecting the sensors is organized and there is a local person dedicated to this task for the duration of the study. The VOCE data is important because vehicles, particularly catalyst equipped vehicles, pollute the most when they are first started. In order to collect this data, we have built a device that plugs into a car’s accessory power outlet (cigarette lighter). The device measures vehicle system voltage and can determine from this information when a car starts and when it stops. These VOCE sensors will be handed out to volunteers who will take them and plug them into their cigarette lighter for several days. They draw almost no current and thus will not impact the vehicle battery. The device will record data on a small microprocessor. The device will not record where the vehicle goes, only the time of day it is started and stopped. The recommended schedule for deployment and collection of the voltage units is given in Table I.
Table I: Recommended Trip Sensor Deployment Schedule
Mon Tue Wed Thur Fri Sat Sun
Install batteries and set senor
clocks to local time. Hand out sensors to 80
volunteers
Mon Tue Wed Thur Fri Sat Sun
Collect Sensors and download
data
The distributor should hand out the VOCE sensor along with an instruction sheet (attached), and instructions about when and where to return the VOCE unit. The distributor should record the type of vehicle the person has, the date and time, and also record the volunteers name and phone number in case the distributor needs to contact the person to get the VOCE unit back in the event that the volunteer does not return the unit for some unexpected reason. An excel spreadsheet for recording this information (VOCE Distribution.xls) is included in this CD. When the unit is returned, the distributor should record the time returned in the worksheet as well as any unusual notes (the unit was dropped, etc).

56

57
Vehicle Operating Characteristics Enunciator (VOCE)
Operating Instructions
1) Place VOCE unit in close proximity to the cigarette lighter in a location that minimizes the chance of it falling or bouncing around while the vehicle is being driven. 2) Plug the adapter connected to the VOCE unit into the vehicle’s cigarette lighter. (note: a small red light on the VOCE unit will light up when the unit is first plugged into the cigarette lighter. This light may be difficult to see under certain daytime light conditions and it will go out after a few seconds.) 3) At the bottom of these instructions, indicate the type of vehicle (private passenger car, private sports utility vehicle, private truck, light commercial vehicle, motorcycle, 3-wheeler, etc.), and model year of the vehicle. Indicate the serial number of the VOCE unit (visible on the unit) and the date and time the unit was plugged into the vehicle. 4) Leave the VOCE unit plugged into the cigarette lighter for the entire period of the test. 5) Note any problems occurring during the test period that might have affected the VOCE unit (unit was dropped, unit smoking, unit smelled, unit was accidentally unplugged, etc) on the back of this sheet. 6) At the end of the test period, record the date and time the VOCE unit is unplugged from the cigarette lighter. 7) Return the VOCE unit and the record sheet to researchers. VOCE Number: ____________ Vehicle Type: _______________________________ Model Year: ____________ Date Plugged In: ___________ Time Plugged In: __________ Date Unplugged:___________ Time Unplugged:__________
Vehicle Operating Characteristics Enunciator (VOCE) Operating Instructions
1) Place VOCE unit in close proximity to the cigarette lighter in a location that minimizes the chance of it falling or bouncing around while the vehicle is being driven. 2) Plug the adapter connected to the VOCE unit into the vehicle’s cigarette lighter. (note: a small red light on the VOCE unit will light up when the unit is first plugged into the cigarette lighter. This light may be difficult to see under certain daytime light conditions and it will go out after a few seconds.) 3) At the bottom of these instructions, indicate the type of vehicle (private passenger car, private sports utility vehicle, private truck, light commercial vehicle, motorcycle, 3-wheeler, etc.), and model year of the vehicle. Indicate the serial number of the VOCE unit (visible on the unit) and the date and time the unit was plugged into the vehicle. 4) Leave the VOCE unit plugged into the cigarette lighter for the entire period of the test. 5) Note any problems occurring during the test period that might have affected the VOCE unit (unit was dropped, unit smoking, unit smelled, unit was accidentally unplugged, etc) on the back of this sheet. 6) At the end of the test period, record the date and time the VOCE unit is unplugged from the cigarette lighter. 7) Return the VOCE unit and the record sheet to researchers. VOCE Number: ____________ Vehicle Type: _______________________________ Model Year: ____________ Date Plugged In: ___________ Time Plugged In: __________ Date Unplugged:___________ Time Unplugged:__________

58
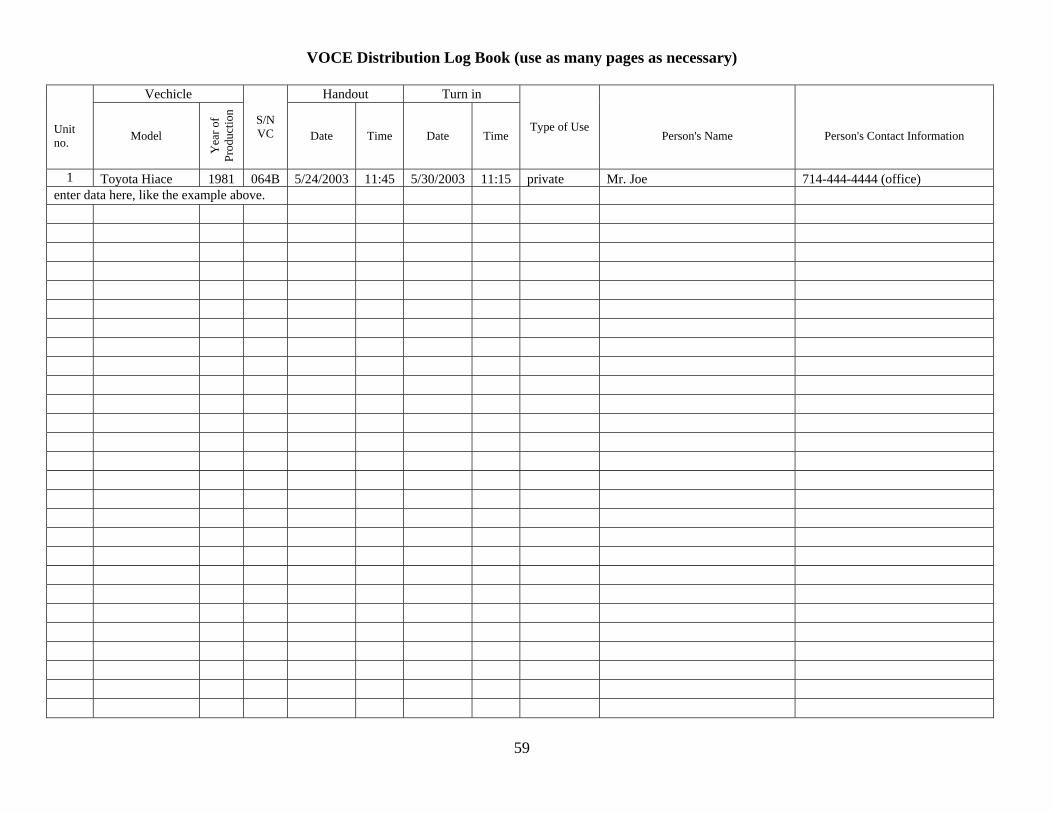
59
VOCE Distribution Log Book (use as many pages as necessary) Vechicle Handout Turn in
Unit no. Model
Yea
r of
Prod
uctio
n
S/N VC Date Time Date Time
Type of Use Person's Name Person's Contact Information
1 Toyota Hiace 1981 064B 5/24/2003 11:45 5/30/2003 11:15 private Mr. Joe 714-444-4444 (office) enter data here, like the example above.

60
61
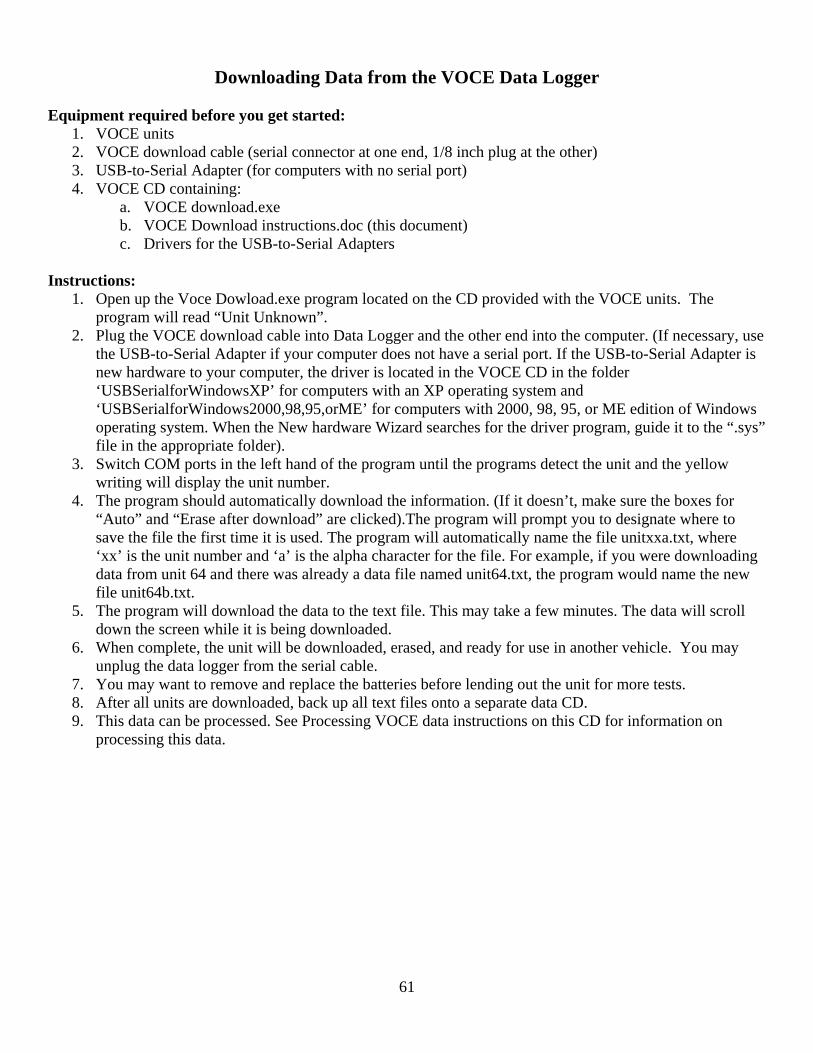
Downloading Data from the VOCE Data Logger
Equipment required before you get started:
1. VOCE units 2. VOCE download cable (serial connector at one end, 1/8 inch plug at the other) 3. USB-to-Serial Adapter (for computers with no serial port) 4. VOCE CD containing:
a. VOCE download.exe b. VOCE Download instructions.doc (this document) c. Drivers for the USB-to-Serial Adapters
Instructions:
1. Open up the Voce Dowload.exe program located on the CD provided with the VOCE units. The program will read “Unit Unknown”.
2. Plug the VOCE download cable into Data Logger and the other end into the computer. (If necessary, use the USB-to-Serial Adapter if your computer does not have a serial port. If the USB-to-Serial Adapter is new hardware to your computer, the driver is located in the VOCE CD in the folder ‘USBSerialforWindowsXP’ for computers with an XP operating system and ‘USBSerialforWindows2000,98,95,orME’ for computers with 2000, 98, 95, or ME edition of Windows operating system. When the New hardware Wizard searches for the driver program, guide it to the “.sys” file in the appropriate folder).
3. Switch COM ports in the left hand of the program until the programs detect the unit and the yellow writing will display the unit number.
4. The program should automatically download the information. (If it doesn’t, make sure the boxes for “Auto” and “Erase after download” are clicked).The program will prompt you to designate where to save the file the first time it is used. The program will automatically name the file unitxxa.txt, where ‘xx’ is the unit number and ‘a’ is the alpha character for the file. For example, if you were downloading data from unit 64 and there was already a data file named unit64.txt, the program would name the new file unit64b.txt.
5. The program will download the data to the text file. This may take a few minutes. The data will scroll down the screen while it is being downloaded.
6. When complete, the unit will be downloaded, erased, and ready for use in another vehicle. You may unplug the data logger from the serial cable.
7. You may want to remove and replace the batteries before lending out the unit for more tests. 8. After all units are downloaded, back up all text files onto a separate data CD. 9. This data can be processed. See Processing VOCE data instructions on this CD for information on
processing this data.