ipa training: maximizing the biological interpretation of ... · calculate metrics outside of ipa...
TRANSCRIPT

Sample to Insight
IPA Training:Maximizing the Biological Interpretation of Gene, Transcript & Protein Expression Data with IPA

Sample to Insight
Log into IPA: www.ingenuity.com
2

Sample to Insight
How can IPA help you?
5
IPA
Deep pathway understanding of a single gene/protein
Drug/therapeutic target discovery
Biological understanding of large data sets, including
Differential gene expression, array and RNAseq (transcriptomics)
– Isoform annotation (New)
Differential protein expression (proteomics)
Genes with loss/gain-of-function variants (New)
Metabolomics
miRNA expression
Gene List
– Chip-seq
– siRNA screening
– Sequence Variants (see also Ingenuity Variant Analysis)
Methylation
Protein phosphorylation
Sample to Insight
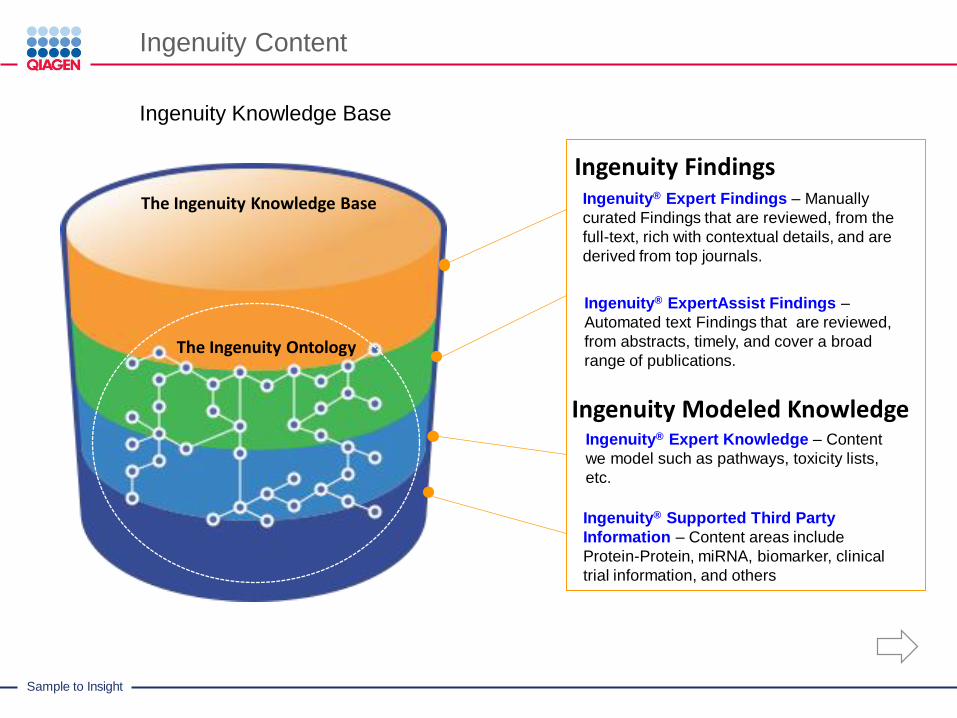
The Ingenuity Knowledge Base
The Ingenuity Ontology
Ingenuity FindingsIngenuity® Expert Findings – Manually
curated Findings that are reviewed, from the
full-text, rich with contextual details, and are
derived from top journals.
Ingenuity® ExpertAssist Findings –
Automated text Findings that are reviewed,
from abstracts, timely, and cover a broad
range of publications.
Ingenuity Modeled KnowledgeIngenuity® Expert Knowledge – Content
we model such as pathways, toxicity lists,
etc.
Ingenuity® Supported Third Party
Information – Content areas include
Protein-Protein, miRNA, biomarker, clinical
trial information, and others
Ingenuity Content
Ingenuity Knowledge Base

Sample to Insight
Core Analysis Steps
7
File > New > Core Analysis
Or File > Data Set Upload
Upload Data (gene expression, protein expression, metabolomics, etc.
Set Core Analysis Settings
Run Analysis
Interpret Results

Sample to Insight
Data Upload
8
Sample to Insight
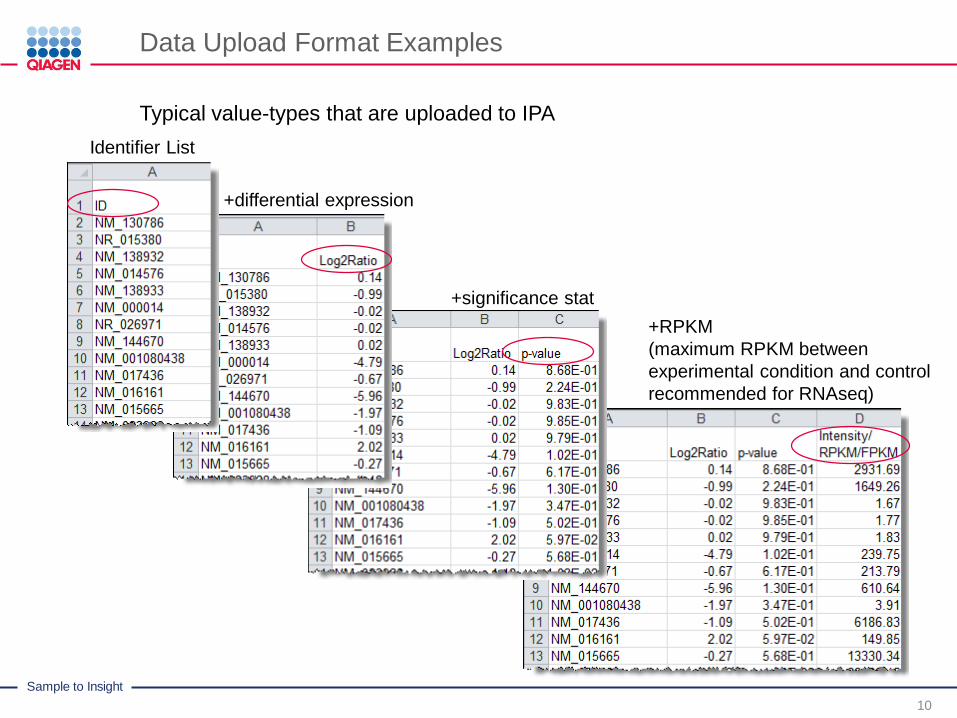
Data Upload Format Examples
10
Typical value-types that are uploaded to IPA
Identifier List
+differential expression
+significance stat
+RPKM
(maximum RPKM between
experimental condition and control
recommended for RNAseq)

Sample to Insight
Uploading Multiple Observations
11
Format for multi-observation upload
Multiple experimental differential expressions can be grouped into a single
spreadsheet and upload
Nice-to-have if you are comparing a series of expression values such as a time-
course
Be sure and name your observations at the time of upload in IPA
Observation 1 Observation 2

Sample to Insight
Expression Value Calculation
13
Verify the differential expression calculation
Recommend Log2(ratio) differential expression
Log2
𝐸𝑥𝑝𝑒𝑟𝑖𝑚𝑒𝑛𝑡𝑎𝑙 𝐶𝑜𝑛𝑑𝑖𝑡𝑖𝑜𝑛 𝐸𝑥𝑝.
𝐶𝑜𝑛𝑡𝑟𝑜𝑙 𝐸𝑥𝑝
Ratio differential expression
𝐸𝑥𝑝𝑒𝑟𝑖𝑚𝑒𝑛𝑡𝑎𝑙 𝐶𝑜𝑛𝑑𝑖𝑡𝑖𝑜𝑛 𝐸𝑥𝑝.
𝐶𝑜𝑛𝑡𝑟𝑜𝑙 𝐸𝑥𝑝
Fold Change
If increased differential expression𝐸𝑥𝑝𝑒𝑟𝑖𝑚𝑒𝑛𝑡𝑎𝑙 𝐶𝑜𝑛𝑑𝑖𝑡𝑖𝑜𝑛 𝐸𝑥𝑝.
𝐶𝑜𝑛𝑡𝑟𝑜𝑙 𝐸𝑥𝑝
If decreased differential expression
-1 𝐶𝑜𝑛𝑡𝑟𝑜𝑙 𝐸𝑥𝑝.
𝐸𝑥𝑝𝑒𝑟𝑖𝑚𝑒𝑛𝑡𝑎𝑙 𝐶𝑜𝑛𝑑𝑖𝑡𝑖𝑜𝑛 𝐸𝑥𝑝.
Fold change will never have values
between 1 and -1
Sample to Insight
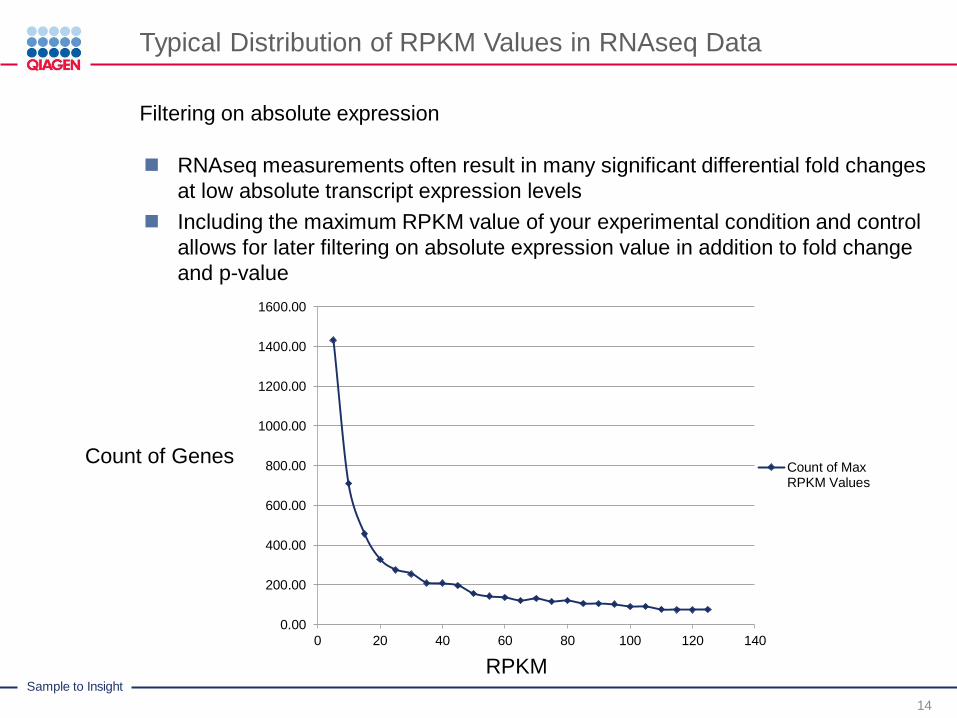
Typical Distribution of RPKM Values in RNAseq Data
14
Filtering on absolute expression
RNAseq measurements often result in many significant differential fold changes
at low absolute transcript expression levels
Including the maximum RPKM value of your experimental condition and control
allows for later filtering on absolute expression value in addition to fold change
and p-value
0.00
200.00
400.00
600.00
800.00
1000.00
1200.00
1400.00
1600.00
0 20 40 60 80 100 120 140
Count of MaxRPKM Values
RPKM
Count of Genes

Sample to Insight
Data Upload
15
Best practices
Calculate metrics outside of IPA (e.g. fold-change, p-value)
Create an Excel spreadsheet or tab delimited file
Only 1 header row allowed
One column must have identifiers, preferably the left-most column
Can have up to 20 observations
IPA will only look at the top worksheet in an Excel workbook
Group related observations into a single spreadsheet if possible
Time course, drug concentration, cell lines, etc.
Specify array platform (chip) if possible
It is OK to use “Not specified/applicable”
Pre-filter data at the lowest threshold that you have confidence in
For example, probe measurement p-value of .05 or other criteria
Use the Recalculate button to refresh the screen

Sample to Insight
Core Analysis Data Types
16
Examples of data set types
Differential gene expression, array and RNAseq (transcriptomics)
– Isoform annotation (New)
Differential protein expression (proteomics)
Genes with loss/gain-of-function variants (New)
Metabolomics
miRNA expression
Gene List
– Chip-seq
– siRNA screening
– Sequence Variants (see also Ingenuity Variant Analysis)
Methylation
Protein phosphorylation
Sample to Insight
Why don’t all of the molecules map?
22
The gene ID might not correspond to a known gene product. For example, most
ESTs are not found in the knowledge base (exception: ESTs that have a
corresponding Entrez Gene identifier are found in the knowledge base).
A gene/protein ID might correspond to several loci or more than one gene. Such
identifiers are left unmapped in the application due to the ambiguity of the identity.
Identifiers for species other than human, mouse or rat must map to human, mouse
or rat orthologues in order to map in IPA.
SNPs must map to a single gene. SNPs that fall greater than 2 KB upstream or 0.5
KB downstream of a gene coding region will not be mapped in IPA during data
upload, since they cannot be unambiguously mapped to a single gene.
There may be insufficient findings in the literature regarding some molecules.

Sample to Insight
How Do I Choose The Reference Set?
23
If you are using a standard vendor platform supported by IPA, then that platform should be selected as your reference set.
If you do not know the platform or the data were taken from different platforms, select a reference set that best estimates the entire population you evaluated.
For gene expression data, select the “Ingenuity Knowledge Base (genes only)”
For metabolomics, select the “Ingenuity Knowledge Base (endogenous
chemicals only)”
You have the option to having your uploaded data set used as the reference set
(User Data Set)

Sample to Insight
Core Analysis Set-up
24

Sample to Insight
Use cutoffs to refine set size per observation
26
‘Ideal’ set size for IPA core analysis from gene expression data is typically 200-3000
Small sets will not have many directional effect z-scores (downstream
functions, upstream regulators)
Very large data sets will tend to have more ‘noise’
Adapted from Conti et al (2007), BMC Genomics, 8, p268
p-value Cutoff
Fold
-Change C
uto
ff

Sample to Insight
Creating an IPA Core Analysis
28
Make sure reference set
matches source of molecules
Click here to apply filter cutoffs and see number
that are network and function eligibleSet data cutoff filters
Network and function eligible molecules
should be 100-2000 for best results, but
other values can work
View other observations if a multi-
observation data set
Assembles networks and identifies transcriptional
regulators with only direct relationships. Results in
networks in which members are nearer neighbors of
one another and biases for binding relationships.

Sample to Insight
Creating an IPA Core Analysis- Network Generation
29
Option to turn off molecular
networks for a faster analysis
Option to exclude endogenous
chemicals from networks
Fine-tune format of networks
Turn On Causal Network
(Advanced Analytics)

Sample to Insight
Creating an IPA Core Analysis: Using Filters
30
Several filters available. Set
criteria to filter out findings of
less interest.

Sample to Insight
Creating an IPA Core Analysis- Advanced Settings
31
Confirm how you would like
to resolve duplicates
Deselect any observations
that you would like to
exclude from the analysis
Make sure molecule coloring
is set for a metric such as
fold change, log ratio, etc.

Sample to Insight
Using Core Analysis Pre-filters
Set criteria to filter out findings of less interest.
Species
Tissue
Filter stringency
A “Stringent” setting requires that each of a pair of molecules and the
relationship that connects them meet the filter criteria
A “Relaxed” filter requires that the gene or protein expression of the molecules
connected by a relationship meet the filter criteria

Sample to Insight
Using Core Analysis Pre-filters, Cont.
Unspecified refers to findings or molecules where cell/tissue/organ is not specified or classified
Pre-filter Advantages
Focuses IPA analysis on networks, biological functions, and canonical pathways
on molecules and relationships closely related to the experiment.
Pre filter Disadvantages
Loss of information
Loss of relationships that may be applicable to your species or tissue but were
described in a different speices or tissue.

Sample to Insight

Sample to Insight
Large Scale Data Analysis
35

Sample to Insight
Gene/Protein Expression Analysis, Overview
36
IPA Core Analysis
Pathway Analysis
Predicts pathways that are changing based on gene expression
New tools to predict directional effects on the pathway (MAP overlay tool)
Upstream Regulator Analysis
Predicts what regulators caused changes in gene expression
Predicts directional state of regulator
Creates de novo pathways based on upstream regulators (Mechanistic Networks)
Diseases and Functions Analysis
Predicts effected biology (cellular processes, biological functions) based on gene
expression and predicts directional change on that effect
– “Increase in cell cycle”
– “Decrease in apoptosis”
Regulator Effects
Models pathway interactions from predicted upstream regulators, through
differentially expressed genes, to biological processes
Networks
Predicts non-directional gene interaction map

Sample to Insight
Molecule Activity Predictor (MAP)

Sample to Insight
Identify likely upstream regulators and their activity state
IPA Upstream Regulator Analysis
• Use published experimental molecular interactions to identify upstream regulators
• . Identify upstream regulators by determining gene enrichment in downstream genes
• Predict the activity state of regulators by correlating literature reported effects with observed gene expression
MCF7 Cells Treated
with Beta-Estradiol.
Genes in uploaded
data set are colored
red and green

Sample to Insight
Create de novo pathways of regulators and genes
IPA Mechanistic Networks
IPA Winter Release 2012
• Identify potential
upstream regulator
signal transduction
• Using shared
downstream gene
effects and gene-gene
interactions, pathways
(mechanistic networks)
are created.
Sample to Insight
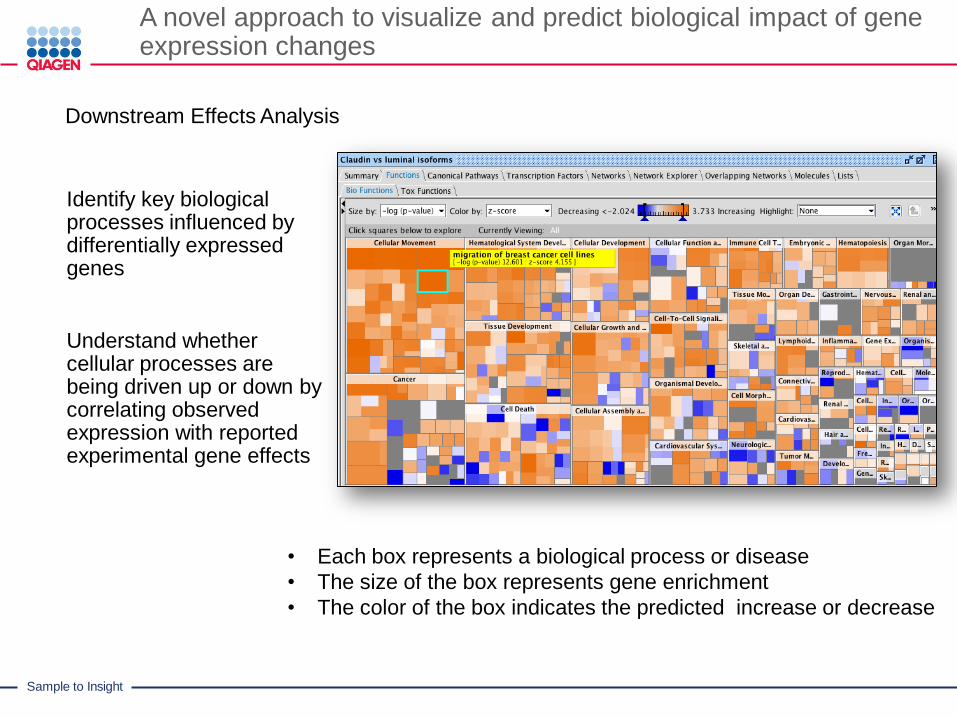
A novel approach to visualize and predict biological impact of gene expression changes
Downstream Effects Analysis
Identify key biological processes influenced by differentially expressed genes
Understand whether cellular processes are being driven up or down by correlating observed expression with reported experimental gene effects
• Each box represents a biological process or disease
• The size of the box represents gene enrichment
• The color of the box indicates the predicted increase or decrease

Sample to Insight
New in IPA Spring 2014 Release (End of March)
Regulator Effects
Hypothesis for how a phenotype, function or disease is regulated in the dataset by
activated or inhibited upstream regulators
Explain impact of upstream molecules on downstream biology
Explain potential mechanism for a phenotype or drug
Define drug targets
Discover novel (or confirm known) regulator disease/phenotype/function
relationships

Sample to Insight
Network Analysis
42

Sample to Insight
Analyzing and Interpreting Results
44

Sample to Insight
Approaches to Viewing Results
IPA will subdivide your data into slices based on molecule connectivity
(networks), cellular functions, and involvement in canonical pathways
Spend time surveying the information. Not everything is of scientific interest,
look for slices of your data that address your scientific question, are consistent
with known biological processes, are consistent with pathology, etc.
Typically the goal will be to find a set of genes/molecules that can be looked at
in greater detail by building a custom pathway
If you are comparing observations, run comparison analysis.
Sample to Insight
IPA calculates two distinct statistics as part of a core analysis
P-value:
Calculated using a Right-Tailed Fisher’s Exact Test
Reflects the likelihood that the association or overlap between a set of
significant molecules from your experiment and a given
process/pathway/transcription neighborhood is due to random chance. The
smaller the p-value the less likely that the association is random.
The p-value does not consider the directional effect of one molecule on
another, or the direction of change of molecules in the dataset.
Z-score:
Applied in some analysis types and provides predictions about upstream or
downstream processes.
Takes into account the directional effect of one molecule on another
molecule or on a process, and the direction of change of molecules in the
dataset.

Sample to Insight
Analyzing ResultsCanonical Pathway Analysis
50

Sample to Insight
Pathway Analysis
What known biological pathways appear most significantly affected by the genes in my
data set?
What genes within a pathway are changing in expression and what effect might that
change have on the pathway?

Sample to Insight
Pathway Analysis Interpretation
52
Bar-chart represents significance of gene enrichment for any given pathway
Significance is most important metric
Ignore bumpy yellow line: ratio/percent coverage of a pathway subject to pathway size
bias
Bar-chart color indicates predicted directionality
When considering pathway directionality, focus on 2 < z-score < -2
Just because a pathway does not have a good z-score does not make it
uninteresting
To open pathway, look for open pathway button on far right after bar-chart selection

Sample to Insight
Go to Help > Legend…Print it out
53

Sample to Insight
Canonical Pathway (CP) Workflow
Interpretation Tips
Look for pathway biological themes
Use Overlapping Pathway tab to filter and view pathways with shared genes
Often lesser scoring pathways of a theme are simply subsets of genes found
in a better scoring pathway
Scan CP names for pathways of particular interest
Statistical significance does not equal biological significance and visa-versa
Pathways may have many second messengers which can be regulated post-
transcriptionally
View pathways by clicking the bar-chart and the OPEN PATHWAY button on
right
Use MAP tool (OVERLAY tool) to help interpretation
Overlay other analyses as applicable
Toggle overlay options

Sample to Insight
Pathway Navigation
Scroll-wheel on mouse controls zoom, or use toolbar zoom buttons.
Left-click selects (turns blue)
Left-click-drag on nodes moves the node
Right-click hold-and-drag moves your view
Right-click brings up menu for controlling
tool tip (mouse-over node pop-up)
copy/paste
Highlighting (colored outline)
selection
Node shapes indicate a protein’s primary function, see Help>Legend
Relationship lines indicate the type of relationship and the mouse-over letter the
type of relationship, see Help>Legend
Navigation Control

Sample to Insight
Pathway Navigation, continued
Double-clicking a node brings up the node summary
You can navigate to the Gene/Chem View page by clicking the protein name
at the top of the summary window pane.
Double-clicking a relationship line brings up the relationship summary
You can to the literature evidence findings by clicking the “View relationships
between:…” link at the top of the summary window pane.
Groups
Groups are represented by a double outline applicable to any molecule
shape. These represent cases where findings use a general gene name to
describe a gene class or group of isoforms
Complexes of different proteins are also given a double outline
View members by left-click selecting, then right-click>Show
Membership

Sample to Insight
Molecule Activity Predictor (MAP)
57
OVERLAY button -> MAP (Molecule Activity Predictor)
Use observed expression changes
to suggest functional effects on
neighboring molecules
Manually set activation states to
observe predicted effects on
canonical pathways

Sample to Insight
Overlay other uploaded data sets, analyses
58
OVERLAY button -> Analyses, Data sets, and Lists
Select other analyses from projects
Useful for comparisons
Sample to Insight
Analyzing ResultsUpstream Regulators
59

Sample to Insight
Upstream Regulators and Networks
• What transcription factors likely led to observed gene expression
changes?
• What de novo pathways can be created based on predicted
upstream regulator interactions?

Sample to Insight
IPA Upstream Regulator Analysis
Identify important signaling molecules for a more complete regulatory picture
• Quickly filter by molecule type
• Filter by biological context
• Generate regulators-targets Network to identify key relationships

Sample to Insight
IPA Upstream Regulator Analysis
• Use experimentally observed relationships (not predicted binding) between regulators and dataset genes to predict upstream transcriptional regulators.
• Calculate z-score to predictactivation or inhibition of regulators based on relationships with dataset genes and direction of change of dataset genes.
MCF7 Cells Treated
with Beta-Estradiol.
Genes in uploaded
data set are colored
red and green

Sample to Insight
IPA Upstream Regulator AnalysisDirectional Effects: Molecule Activity PredictorExamine Expression Relationship Consistency
IPA Winter Release 2012

Sample to Insight
IPA Upstream Regulator Analysis
• Quickly filter by molecule type
• Filter by biological context
• Generate regulators-targets Network to identify key relationships

Sample to Insight
Considerations
66
Entities with positive z-scores are known to elicit the same gene expression changes as
seen in your data
Entities you might want to knock-down to inhibit effects of experiment
Entities with negative z-scores are known to elicit the opposite gene expression when active
Entities you could add to an experiment to counter effects of experiment
Contradictions between z-score direction prediction and measured gene expression could
be the result of
A discrepancy between protein activity and expression level
Lag time between change in gene expression and effect of that expression
A regulator with significant z-score but poor p-value could represent a situation where only a
few downstream genes in your experimental condition correlate in expression, but many
other genes may be expressed in other conditions (or is junk).
A regulator with insignificant z-score and significant p-value could represent a situation
where the genes in your data are downstream of the regulator, but their expression pattern
is unique to your experimental condition (or is junk).

Sample to Insight
IPA Upstream Regulator Analysis
• Quickly filter by molecule type
• Filter by biological context
• Generate regulators-targets Network to identify key relationships
How might these upstream regulators
interact?
Sample to Insight
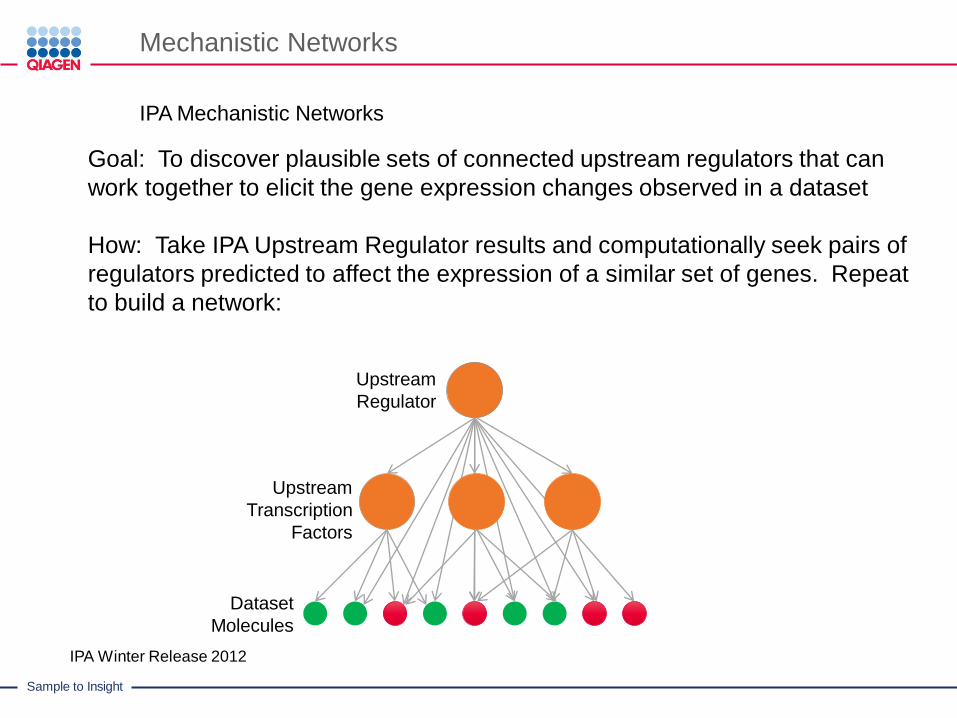
Mechanistic Networks
IPA Mechanistic Networks
Upstream
Regulator
Dataset
Molecules
Upstream
Transcription
Factors
IPA Winter Release 2012
Goal: To discover plausible sets of connected upstream regulators that can
work together to elicit the gene expression changes observed in a dataset
How: Take IPA Upstream Regulator results and computationally seek pairs of
regulators predicted to affect the expression of a similar set of genes. Repeat
to build a network:
Sample to Insight
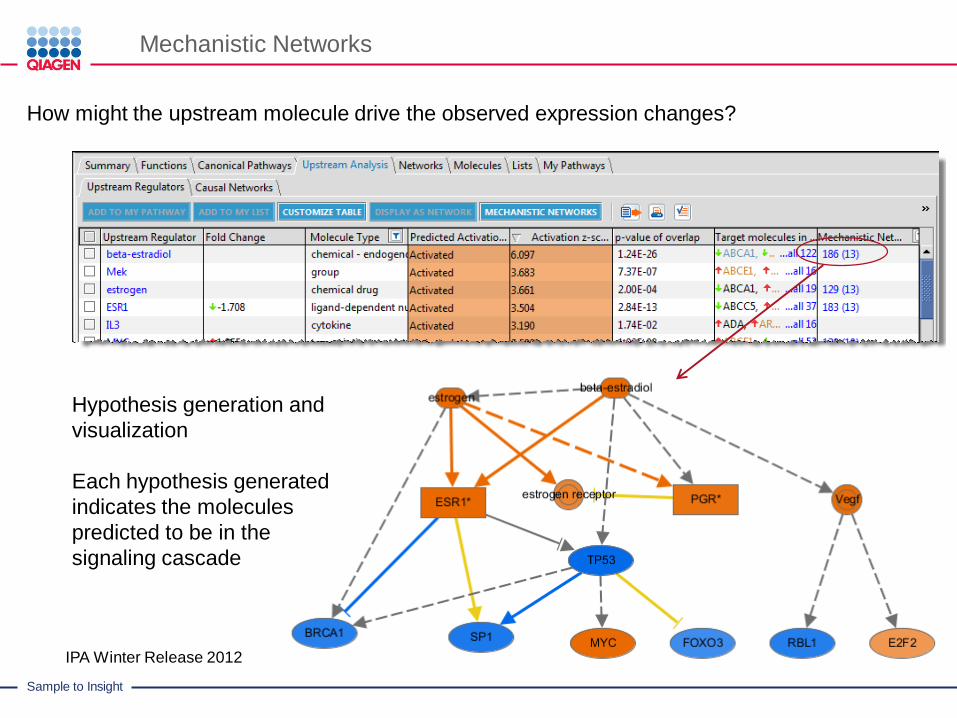
Mechanistic Networks
How might the upstream molecule drive the observed expression changes?
IPA Winter Release 2012
Hypothesis generation and
visualization
Each hypothesis generated
indicates the molecules
predicted to be in the
signaling cascade
Sample to Insight
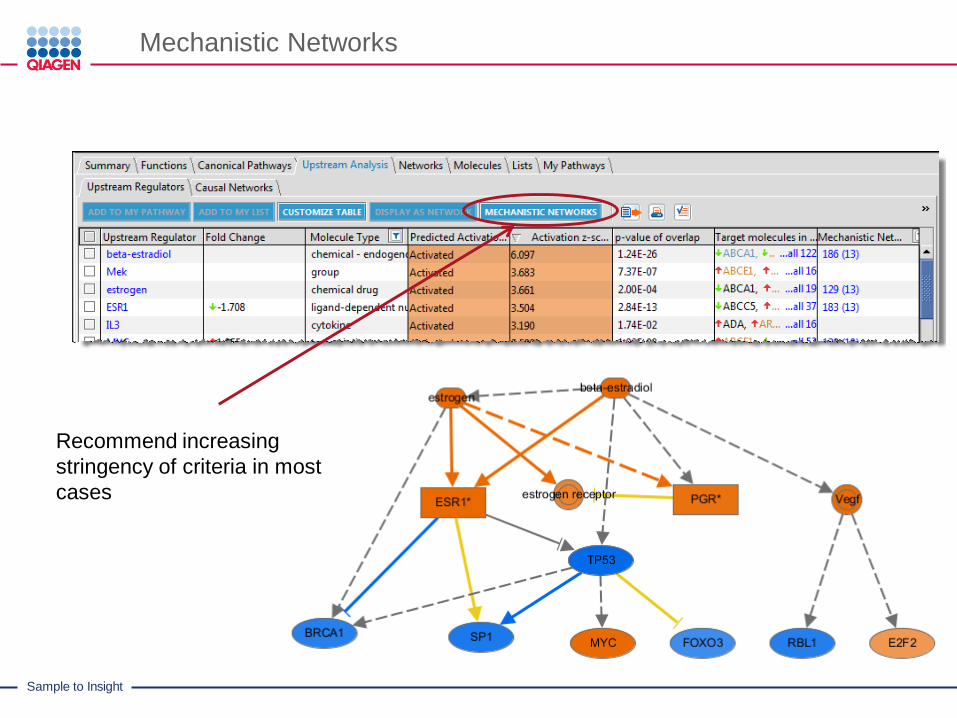
Mechanistic Networks
Recommend increasing
stringency of criteria in most
cases

Sample to Insight
Advanced Analytics
Causal Networks
Advanced Analytics requires an additional subscription fee

Sample to Insight
Causal Network Analysis
Advanced Analytics
Alternate method of predicting upstream regulators based on causal
relationships and allowing multiple interaction steps to gene expression
changes
Identify potential novel master-regulators of your gene expression by creating
pathways of literature-based relationships
Expands predictions to include indirect upstream regulators not in mechanistic
networks
Causal Networks
Master Regulator
Genes with differential expression

Sample to Insight
Single- vs. Mechanistic- vs. Causal NetworksLeveraging the network to create more upstream regulators
Advanced Analytics: Causal Network Analysis
Upstream Regulators
Dataset
Regulator
Upstream
Regulator
Dataset
Molecules
Upstream
Regulators: TFs
Mechanistic Network of
Upstream Regulators
Causal Network

Sample to Insight
Turning on Causal Networks (with Advanced Analytics)
Title, Location, Date74

Sample to Insight
Beta-estradiol of MCF7 cells at 12 hr. SULT1E1 is top master regulator, but does not appear in upstream regulator table
Advanced Analytics: Causal Network Analysis

Sample to Insight
SULT1E1 is an enzyme that converts
estrone and estradiol to an inactive form
Causal network predicts the absence,
inhibition, or saturation of this enzyme in
this experiment where estradiol was added
exogenously
SULT1E1 does not have downstream
gene expression relationships and, thus,
does not appear in the Upstream
Regulator table or Mechanistic Networks
Hypothesis: increasing SULT1E1 activity
can have an anti-estrogen effect
SULT1E1 Causal Network
Advanced Analytics: Causal Network Analysis

Sample to Insight
Parameters
Advanced Analytics: Causal Network Analysis
Only considers edges of unambiguous direction of regulation to downstream genes
Edges that cannot be assigned a direction of regulation, including all types of binding edges are excluded
Included relationship types
activation (A)
inhibition (I)
expression (E)
transcription (T)
group/complex
membership edges (MB, considered activating)
phosphorylation (P)
Up to 3 interactions edges from root are considered
Expression/Transcription must be last edge type

Sample to Insight
Causal Networks
Advanced Analytics: Causal Network Analysis
2 inhibitory edges
5 activating edges
A I A I A A A
Sample to Insight
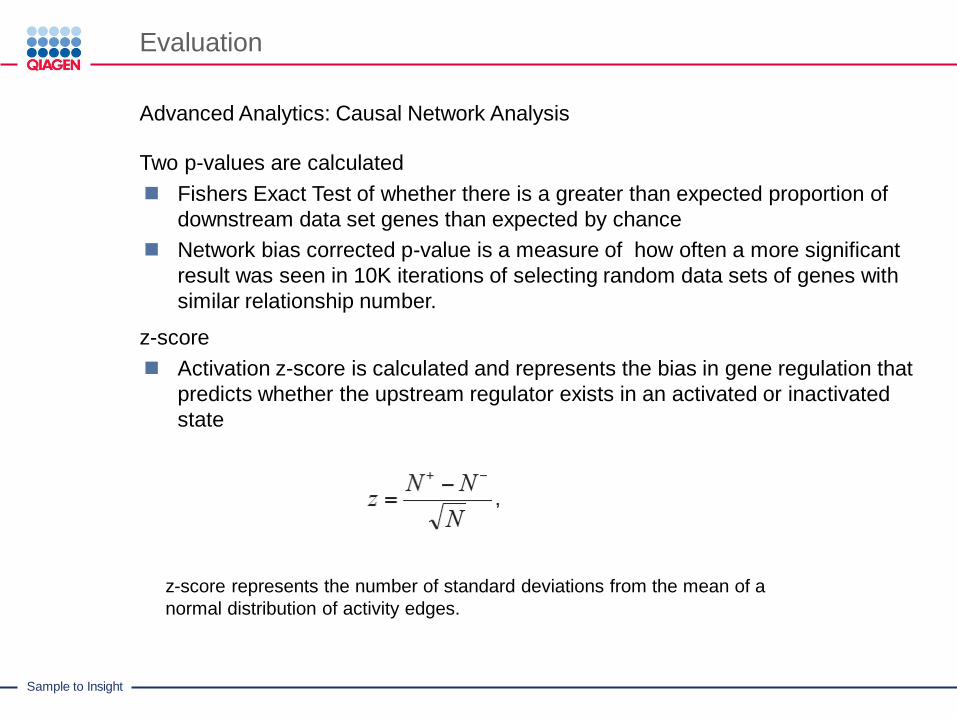
Evaluation
Advanced Analytics: Causal Network Analysis
Two p-values are calculated
Fishers Exact Test of whether there is a greater than expected proportion of
downstream data set genes than expected by chance
Network bias corrected p-value is a measure of how often a more significant
result was seen in 10K iterations of selecting random data sets of genes with
similar relationship number.
z-score
Activation z-score is calculated and represents the bias in gene regulation that
predicts whether the upstream regulator exists in an activated or inactivated
state
z-score represents the number of standard deviations from the mean of a
normal distribution of activity edges.

Sample to Insight
Analyzing ResultsDiseases & Functions
(Downstream Effects)
80

Sample to Insight
Downstream Function/Process Analysis
• How are cellular processes are predicted to be changing based on
my gene expression data?
• What genes are driving these directional changes?

Sample to Insight
A novel approach to visualize and predict biological impact of gene expression changes
Downstream Effects Analysis
Identify key biological processes influenced by differentially expressed genes
Understand whether cellular processes are being driven up or down by correlating observed expression with reported experimental gene effects
• Each box represents a biological process or disease
• The size of the box represents gene enrichment
• The color of the box indicates the predicted increase or decrease

Sample to Insight
Downstream Effect on Bio Function
Click on a Square to Drill
Down within that function
Color by and Scale
Size of the
Square Toggle to the Bar
Chart

Sample to Insight
Ontology Levels
Click to See the Specific
Genes and Findings

Sample to Insight
Functional Category and Statistical
ResultAccess Findings
Expression Value in
Your Dataset
Prediction Logic

Sample to Insight

Sample to Insight
Functional Analysis (FA) Workflow
Goal is understand biology and identify smaller subsets of genes that are of interest
Genes related to a particular function can be :
sent to a pathway for building and/or overlay analysis
saved as a new Data Set and sent to Core Analysis for additional categorization
and segmentation
Sample to Insight
Analyzing ResultsRegulator Effects
89

Sample to Insight
Regulator Effects
Hypothesis for how a phenotype, function or disease is regulated in the dataset
by activated or inhibited upstream regulators
Explain impact of upstream molecules on downstream biology
Explain potential mechanism for a phenotype or drug
Define drug targets
Discover novel (or confirm known) regulator disease/phenotype/function
relationships

Sample to Insight
Concept of Functional Network Analysis
91
Upstream Regulator Analysis
Targets in the dataset
Downstream Effects Analysis
Disease or
Function
A
Functional Network Analysis
Algorithm
Disease or
Function
C
A B C
Disease or
Function
Disease or
Function
B
Multiple
iterations

Sample to Insight
Customize Regulator Effects to answer your question
93QIAGEN Silicon Valley
Default:
Genes, RNAs,
proteins as
regulators
Any type of
disease or
function
vs.
Recommend
decreasing p-value
cutoffs to 1.0E-3 or
lower in most cases.
Recommend setting
network size to 1
regulator and 1 function
in addition to viewing
with no value

Sample to Insight
Alternate presets to answer different questions
QIAGEN Silicon Valley 94
Transcription factors and functions
Compound as regulator of functions Minimal regulator to function networks

Sample to Insight
Analyzing ResultsNetworks
95

Sample to Insight
Networks in IPA
96
To show as many interactions between user-specified molecules in a given
dataset and how they might work together at the molecular level
Highly-interconnected networks are likely to represent significant biological
function

Sample to Insight
Networks
97
Networks are assembled based on gene/molecule connectivity with other
gene/molecules.
– Assumption: the more connected a gene/molecule, the more influence it
has and the more “important” it is.
Networks are assembled using decreasingly connected molecules from your
data set.
Genes/molecules from the Knowledge Base may be added to the network to
fill or join areas lacking connectivity.
A maximum of 35, 70, or 140 genes/molecules can comprise a network
based on parameter settings.
Networks are annotated with high-level functional categories.

Sample to Insight
How Networks Are Generated
98
Focus molecules are “seeds”
Focus molecules with the most interactions to other focus molecules are then connected together to form a network
Non-focus molecules from the dataset are then added
Molecules from the Ingenuity’s KB are added
Resulting Networks are scored and then sorted based on the score

Sample to Insight
Using the information in Networks
99
Keep in mind..
Networks may contain smaller networks of connectivity related to specific
functions. It might make sense to subset a network. (What does this mean?
Just focus on subportions of the network?)
Larger cellular networks may span IPA assembled networks. Merging
networks may allow you to visualize these larger networks.
Networks should be treated as “starter pathways” that you then modify based
on your biological understanding of the system and the questions that you
want to answer. Use the pathway building (‘Build’ button) and Overlay tools
to expand on your initial results.
Sample to Insight
Getting Help
100

Sample to Insight
Contact Us
101
+1 650 381-51116am-5pm Pacific Time (M-F)
QIAGEN Redwood City/Silicon Valley
1700 Seaport Blvd., 3rd Floor
Redwood City
CA 94063, USA

Sample to Insight
Help for IPA
102
For Help and Technical Support contact our Customer Support team by email to [email protected], or by phone to +1 650-381-5111
For getting started tutorials and training videos see the ‘Tutorials’ link on the help menu within IPA
To see case studies, application notes, and white papers visit www.ingenuity.com/library
To view our future scientific seminars, and to watch the series archive visit www.ingenuity.com/science/scientific-seminar-series.html
To see how IPA has been used and cited in over 9000 publications visit www.ingenuity.com/science/search-pub.html
Sample to Insight
IPA training videos: Search & explore
103
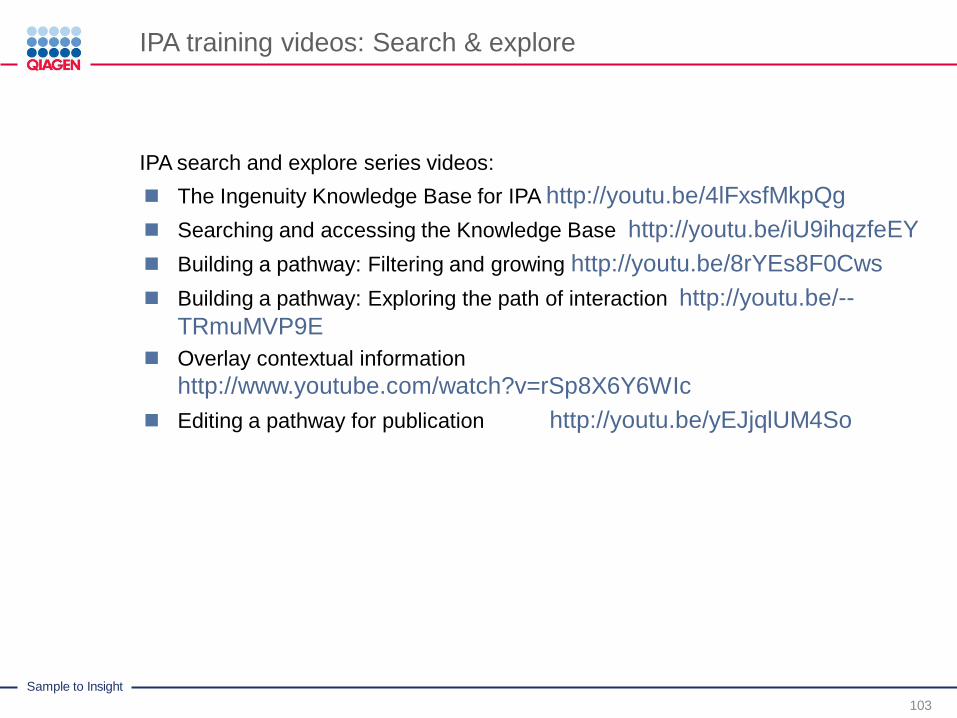
IPA search and explore series videos:
The Ingenuity Knowledge Base for IPA http://youtu.be/4lFxsfMkpQg
Searching and accessing the Knowledge Base http://youtu.be/iU9ihqzfeEY
Building a pathway: Filtering and growing http://youtu.be/8rYEs8F0Cws
Building a pathway: Exploring the path of interaction http://youtu.be/--
TRmuMVP9E
Overlay contextual information
http://www.youtube.com/watch?v=rSp8X6Y6WIc
Editing a pathway for publication http://youtu.be/yEJjqlUM4So
Sample to Insight
IPA training videos: Data analysis
104
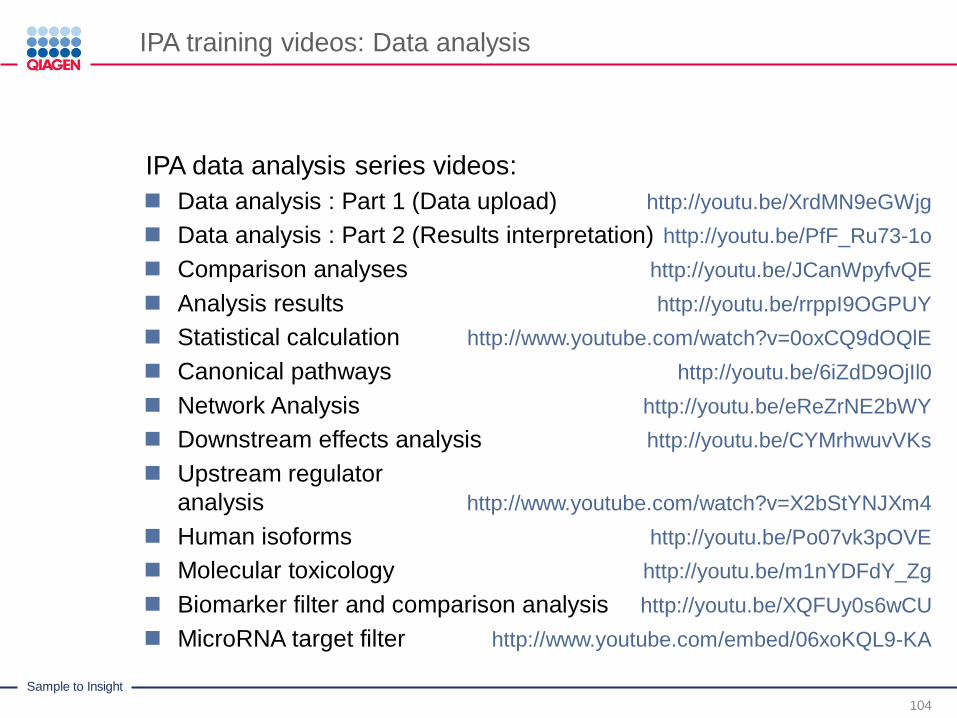
IPA data analysis series videos:
Data analysis : Part 1 (Data upload) http://youtu.be/XrdMN9eGWjg
Data analysis : Part 2 (Results interpretation) http://youtu.be/PfF_Ru73-1o
Comparison analyses http://youtu.be/JCanWpyfvQE
Analysis results http://youtu.be/rrppI9OGPUY
Statistical calculation http://www.youtube.com/watch?v=0oxCQ9dOQlE
Canonical pathways http://youtu.be/6iZdD9OjIl0
Network Analysis http://youtu.be/eReZrNE2bWY
Downstream effects analysis http://youtu.be/CYMrhwuvVKs
Upstream regulator
analysis http://www.youtube.com/watch?v=X2bStYNJXm4
Human isoforms http://youtu.be/Po07vk3pOVE
Molecular toxicology http://youtu.be/m1nYDFdY_Zg
Biomarker filter and comparison analysis http://youtu.be/XQFUy0s6wCU
MicroRNA target filter http://www.youtube.com/embed/06xoKQL9-KA

Sample to Insight
IPA tutorials
105
http://ingenuity.force.com/ipa/articles/Tutorial/Tutorials
Search for genes tutorial
Analysis results tutorial
Upload and analyze example eata tutorial
Upload and analyze your own expression data tutorial
Visualize connections among genes tutorial
Learn about specialized features
Human isoforms view tutorial
Transcription factor analysis tutorial
Downstream effects analysis tutorial

Sample to Insight
Comparing Core Analyses
106

Sample to Insight
Comparison Analysis
107
Multiple Comparison
Time course
Does response
Multiple Platforms and Data Integration
Systems biology
Combining SNP, CNA, mRNA, microRNA, proteomics, etc.
Analysis Comparisons work best with Canonical Pathways, Upstream
Regulators, and Disease and Functions
Regulator Effects and Mechanistic Networks are similarly difficult to compare
because these networks are created in the context of the single analysis.
To compare these networks across analyses, open, view the network, and
then use the OVERLAY -> “Data Sets, Analyses, and Lists” to overlay
colored representation of gene changes.
Sample to Insight
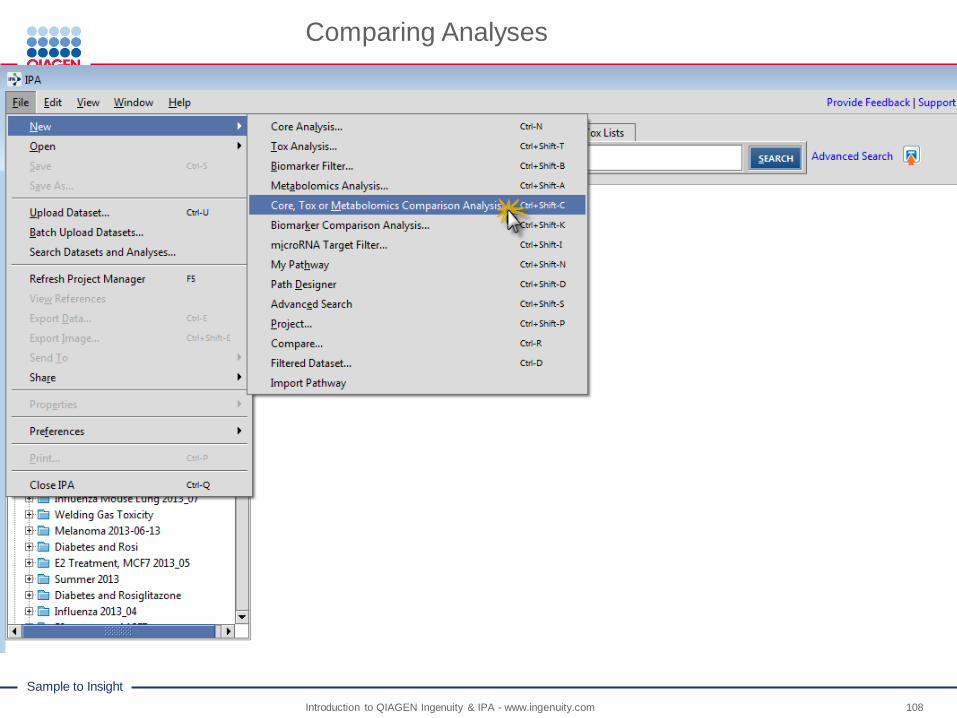
Comparing Analyses
Introduction to QIAGEN Ingenuity & IPA - www.ingenuity.com 108

Sample to Insight
Selecting Analyses to Compare
109

Sample to Insight
Analyzing Comparison Results
110
Tabs at top navigate to
the analysis-type of
interest
Heatmap can be generated using different calculation methods
Heatmap can be based on different metrics depending on analysis-type.
Sample to Insight
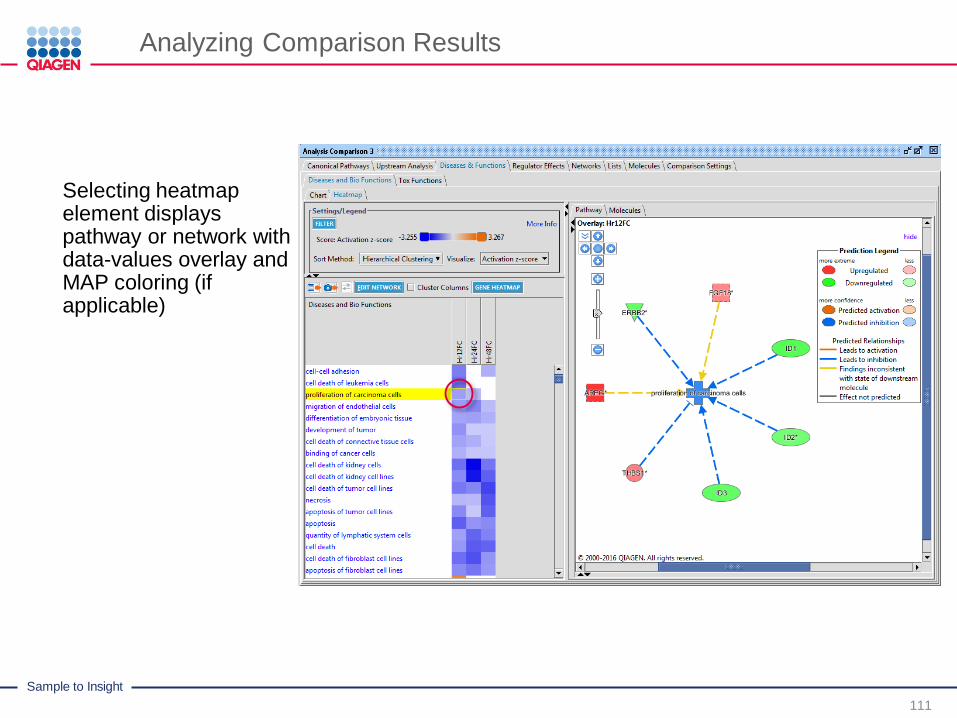
Analyzing Comparison Results
111
Selecting heatmapelement displays pathway or network with data-values overlay and MAP coloring (if applicable)

Sample to Insight
Analyzing Comparison Results
112
Clicking GENE HEATMAP button displays gene expression values across observations

Sample to Insight
Micro-RNA Target Filter
113

Sample to Insight
Workflow for miRNA Target Filter
Filter miRNA differential expression data set (if corresponding mRNA differential expression data, filter as well)
File -> New -> Filtered Data Set
Start microRNA Target Filter
File -> New -> miRNA Target Filter
Open miRNA filtered data set
Using funnel in column headers, filter mapping based on information type/confidence
Add annotation columns, if desired, by clicking the plus sign in column header and filter as desired
Sample to Insight
Workflow for miRNA Target Filter
If corresponding mRNA, click “ADD/REPLACE MRNA DATA SET” to filter mRNA mappings to genes in the mRNA expression data set
Click “EXPRESSION PAIRING” to pair the expression between the miRNA and
mRNA
Click the funnel in the column header of the expression pairing column to filter
for the miRNA-mRNA pairing desired
Click to summary tab to view a summary of miRNA-mRNA mappings
For further analysis, select one or more miRNAs from the summary tab and add the miRNA and targets to a new pathway and perform overlays for interpretation of functions, pathways, drug targets, etc.

Sample to Insight
miRNA
Target
Filter
miRNA
data
Molecule
Type
Pathways (Cancer/
Growth)
88 data
points
13,690
targets
1,090
targets
333
targets
?32
targets
mRNA↑↓
↓↑
39
targets
Use Pathway tools to build hypothesis for microRNA – target
association to melanoma metastasis.
Sample to Insight
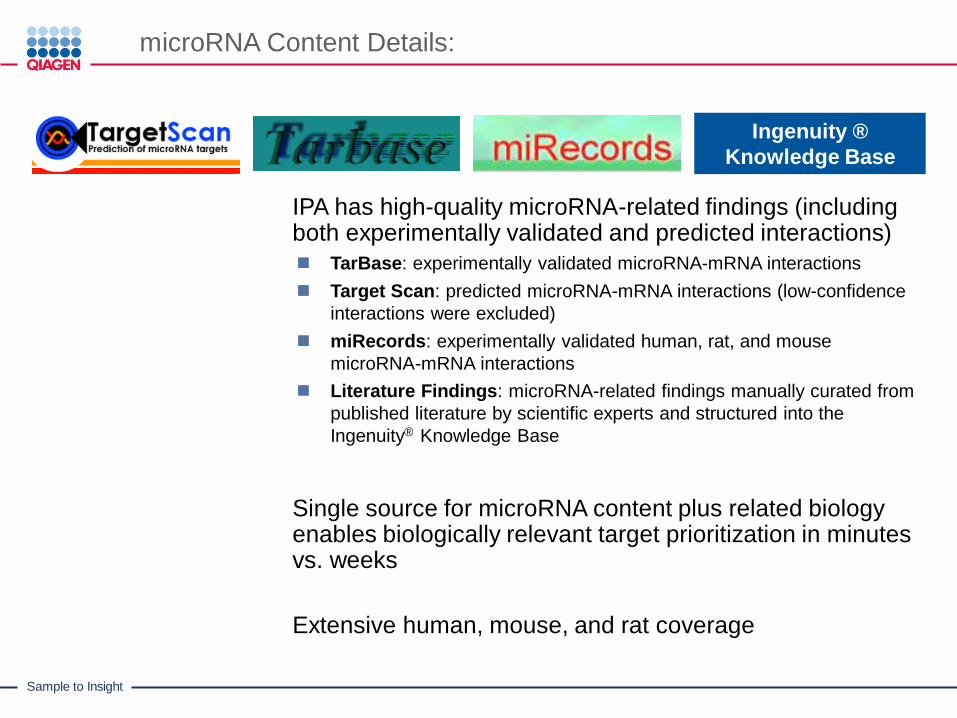
microRNA Content Details:
IPA has high-quality microRNA-related findings (including both experimentally validated and predicted interactions)
TarBase: experimentally validated microRNA-mRNA interactions
Target Scan: predicted microRNA-mRNA interactions (low-confidence
interactions were excluded)
miRecords: experimentally validated human, rat, and mouse
microRNA-mRNA interactions
Literature Findings: microRNA-related findings manually curated from
published literature by scientific experts and structured into the
Ingenuity® Knowledge Base
Single source for microRNA content plus related biology enables biologically relevant target prioritization in minutes vs. weeks
Extensive human, mouse, and rat coverage
Ingenuity ®
Knowledge Base

Sample to Insight
miRNA Naming and Mapping
For Searching, IPA Supports:
miRBase Identifiers
Entrez Gene Symbols and Entrez Gene IDs
Other synonyms used in the literature
For Data Upload, IPA Supports:
miRBase Identifiers for mature miRNAs
miRBase Accession Numbers (format MIMAT######) are preferred. These
are stable identifiers.
miRBase Name Identifiers (format: mmu-miR-###) are allowed. Since some
miRNA arrays provide annotations only with the name, we have provided
mappings for them. These change over time so use MIMAT instead if
available.
Precursor identifiers are NOT supported
Entrez Gene IDs (not Entrez Gene Symbols)
HUGO gene symbols (human only)

Sample to Insight
miRNA Naming and Mapping
Mapping microRNA IDs in IPA during Data Upload
A given ID can only map to a single node in IPA
miRNA identifiers each map to either a group node or a locus-specific node:
miRNA identifiers that correspond to mature miRNAs that do NOT appear in
a group (ie, they arise from only one known precursor, and that precursor
has no more than one known Entrez Gene ID/locus) are mapped to a locus-
specific node.
miRNA identifiers corresponding to mature miRNAs that ARE in a group map
to that group.
No miRNA maps to more than one group node in IPA.

Sample to Insight
Working with miRNA Groups
Mature miRNAs may arise from multiple precursors:
A given mature form may arise from multiple distinct miRNA precursors.
A given precursor may arise from multiple distinct loci.
Groups are created in the knowledge base to represent mature miRNA’s that
may arise from multiple precursors or multiple loci.
When authors refer to a particular mature miRNA form that may arise from
multiple distinct precursors and/or multiple genetic loci, the finding is mapped
to a group concept that contains all potential “parent” precursors.
Groups might have different network connections compared to the individual
members of the group.
Findings might be mapped to the individual members or to the group,
depending on information provided by the author.
‘Grow’ functionality does not ‘look inside’ the groups.
Additional steps will ensure that all members of group will be considered
when applying ‘Grow’

Sample to Insight
Expanding
groups prior to
Growing will
provide
information on
known molecular
interactions for
all members of
the group.

Sample to Insight
Biomarker Filter
126
Sample to Insight
Introduction to Biomarker Analysis
127
IPA-Biomarker™ analysis filters/refines candidate lists based on biological criteria such as association to a disease, normal presence in a fluid, or normal expression in a tissue/cell type/cell line and/or clinical usage.
Species
Tissues and Cell Lines
Biofluids
Diseases
Clinical Biomarkers
The output is a refined list of candidates
It does not calculate functions, Canonical Pathways, or networks
Different observations or datasets can be compared using the Comparison Biomarker Analysis
Calculates unique and common molecules

Sample to Insight
Biomarker Filters
128
The Biomarker Filter capability rapidly priorities biomarker candidates based on biological characteristics and clinical usage.
Clinical Usage (Biomarkers):
Identify biomarkers by their specific application, including markers for Disease Diagnosis and Prognosis, Disease Progression, markers of Drug Efficacy and Safety, and Patient Response to Therapy

Sample to Insight
Statistics in IPA

Sample to Insight
How the Fisher’s Exact Test is Calculated
Is the proportion of genes in my sample mapping to a gene set (those that are significant)
similar to the proportion of all measureable genes (reference set) that map in the gene set?
If the proportions are similar, there is no biological effect

Sample to Insight
Mapping Colorectal Cancer Expression Data to the Function “Neoplasia”
747
expression-
significant
genes
Filter for
genes that
change
expression
Map to neoplasia
Do not map to
neoplasia
Sample 260/747= 0.348
487/747= 0.652
3005 genes map to
neoplasia
13,101 genes
on chip
3005/13,101= 0.230
487
260
IPA
Are the proportions that map to
neoplasia significantly different
between the chip (reference set)
and the sample?

Sample to Insight
Calculating the Fisher’s Exact Test
A 2x2 contingency table is created based on the total population, the sample, and how many genes map to the function/pathway. This table is used to calculate the Fisher’s Exact Test
Neoplasia Not Neoplasia
In Sample k n - k n
Not in
Sample m - k N + k - n - m N - n
m N - m N
m= Total that map to function/pathway
N= Total
k= Number that map to function/pathway in sample
n= Total sample

Sample to Insight
Calculating the Fisher’s Exact Test
Numbers based on the colorectal cancer data mapping to neoplasia
Neoplasia Not Neoplasia
In Sample 260 487 747
Not in
Sample 2745 9609 12354
3005 10096 13101
3005 = Total that map to neoplasia on chip
13101 = Total on chip
260 = Number that map to neoplasia in sample
747 = Total sample
Fisher’s Exact Test p-value = 2.13 E-14

Sample to Insight
What Can We Say About Our Colorectal Cancer Data Set And Neoplasia?
We can conclude that the proportion, or over representation, of genes mapping to neoplasia
is not likely the result of sampling (and is likely an effect of the disease)

Sample to Insight
How Do I Choose The Reference Set?
If you are using a standard vendor platform supported by IPA, then that platform should be
selected as your reference set.
If you do not know the platform or the data were taken from different platforms, select a
reference set that best estimates the entire population you evaluated.
For gene expression data, select the “Ingenuity Knowledge Base (genes only)”
This setting uses all function- and pathway-eligible genes in the knowledge base.
For metabolomics, select the “Ingenuity Knowledge Base (endogenous chemicals only)”
You have the option to having your uploaded data set used as the reference set (User Data
Set)

Sample to Insight
What About TaqMan or Similar Focus Array?
Low density arrays are problematic because the genes that are being measured are usually not randomly chosen to start with, but are typically selected based on a priori function or pathway knowledge
Let’s assume a inflammatory cytokine array
If you select the Ingenuity Knowledge Base as your reference, your p-values for
inflammation functions and pathways will be artificially low (significant) because the array
was heavily biased for these genes.
If you upload every gene on the array, and select the “User Data Set” reference option, your
p-values are statistically accurate, but inflammatory functions and pathways may not appear
significant because the likelihood of having a random sample with similar proportions to
inflammation processes is extremely high.
Sample to Insight
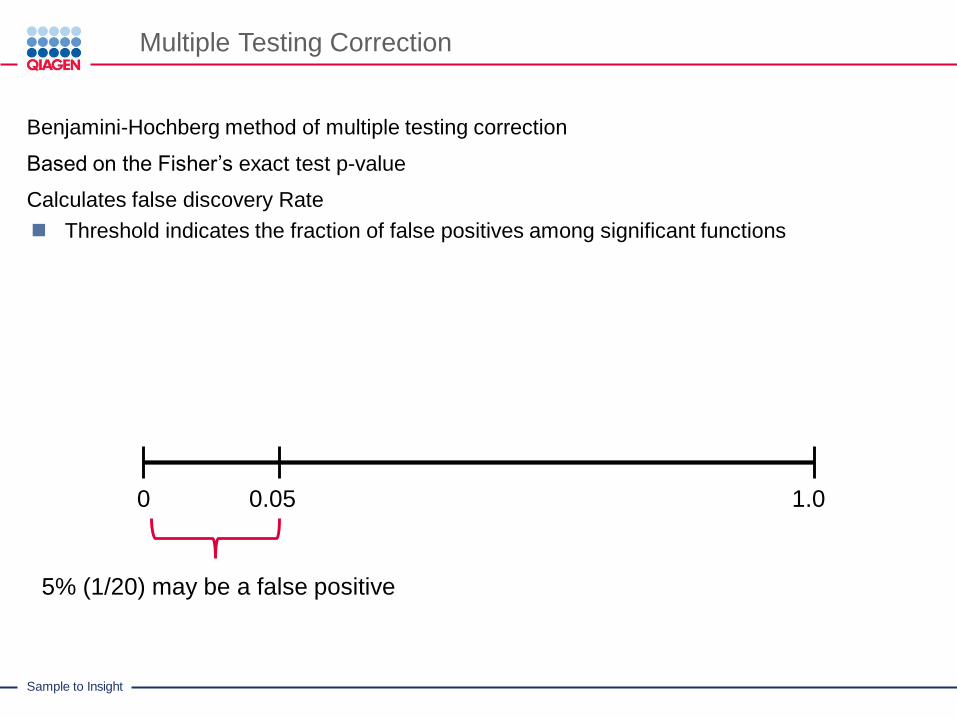
Multiple Testing Correction
Benjamini-Hochberg method of multiple testing correction
Based on the Fisher’s exact test p-value
Calculates false discovery Rate
Threshold indicates the fraction of false positives among significant functions
0 0.05 1.0
5% (1/20) may be a false positive

Sample to Insight
Which p-Value Calculation Should I Use?
“What is the significance of function X in relation to my dataset?”
Use Fisher’s Exact test result
“What are all significant functions within this dataset?”
Use Benjamini-Hochberg multiple testing correction

Sample to Insight
z-scores and Normal Distribution
A set of genes chosen at random should be
about equally likely to have an increasing or
decreasing effect, thus, about 50% each
direction, or a z=0.
A z-score represents the non-
randomness of directionality within a
gene set

Sample to Insight
Activation z-score
↑ ↓↓ ↑ ↑
TR
Differential Gene Expression (Uploaded Data)↑
Predicted activation state of TR:
1: activated (correlated), -1: inhibited (anti-correlated)1 -11 1 1 1
+++++-
Actual z-score can weighted by relationship, relationship bias, data bias
• z-score is statistical measure of correlation between relationship
direction and gene expression.
• z-score > 2 or < -2 is considered significant
Literature-based effect TR has on downstream genes
Every TR is analyzed
=4
6= 2.04

Sample to Insight
Downstream Effect z-score
↓ ↑ ↑ Differential Gene Expression
(Uploaded Data)↑
Bio
Process/Function
↓
Literature-based effect genes have on process or function
Predicted Effect-
1: Increasing (correlated), -1: inhibited (anti-correlated)
↑
-1 -1 1 0 1 1
Actual z-score is weighted by relationship, relationship bias, data bias
• “z-score” is statistical measure of correlation between relationship direction
and gene expression.
• z-score > 2 or < -2 is considered significant
+- ++ -
=1
5= .447