ionics, inc. and subsidiaries quarterly...
TRANSCRIPT

IONICS, INC. and SUBSIDIARIES QUARTERLY REPORT
For the 1stQuarter Ended March 31, 2016
(SEC Form 17-Q)

2
SEC Registration Number
1 0 7 4 3 2
Company Name
I O N I C S , I N C . A N D S U B S I D I A R I E S
Principal Office (No./Street/Barangay/City/Town/Province)
C i r c u i t S t r e e t , L i g h t I n d u s t r y
a n d S c i e n c e P a r k o f t h e P h i l i p
p i n e s , B a r r i o D i e z m o , C a b u y a o ,
L a g u n a
Form Type Department requiring the report Secondary License Type, If Applicable
1 7 - Q
COMPANY INFORMATION
Company’s Email Address Company’s Telephone Number/s Mobile Number
(049) 508-1111 0917-869-5688
No. of Stockholders Annual Meeting
Month/Day Fiscal Year Month/Day
890 05/20 03/31
CONTACT PERSON INFORMATION
The designated contact person MUST be an Officer of the Corporation
Name of Contact Person Email Address Telephone Number/s Mobile Number
RONAN R. ANDRADE [email protected]
(049) 508-1111 0917-869-5688
Contact Person’s Address
No.14 Mountain Drive, Light Industry and Science Park II Brgy.La Mesa, Calamba, Laguna
Note: In case of death, resignation or cessation of office of the officer designated as contact person, such incident shall be reported to the Commission within thirty (30) calendar days from the occurrence thereof with information and complete contact details of the new contact person designated.
COVER SHEET

3
SEC Number: 107432 File Number: ________
IONICS, INC. AND SUBSIDIARIES ________________________________________
(Company’s Full Name)
Circuit Street, Light Industry and Science Park of the Philippines, Barrio Diezmo,Cabuyao, Laguna
________________________________________ (Company’s Address)
(049) 508 - 1111 _________________________________________
(Telephone Number)
March 31, 2016 _________________________________________
(Fiscal Year Ending) (month& day)
Quarterly Interim Condensed Financial Statements (SEC Form 17-Q)
________________________________________________ Form Type
________________________________________________
Amendment Designation (if applicable)
_________________________________________ Period Ended Date
__________________________________________
Secondary License Type and File Number

4
SECURITIES AND EXCHANGE COMMISSION
SEC FORM 17-Q
QUARTERLY REPORT PURSUANT TO SECTION 17 OF THE SECURITIES REGULATION CODE AND SRC RULE 17 (2) (B) THEREUNDER
1. For the quarter ended March 31, 2016
2. SEC Identification Number 107432 3. BIR Tax Identification No. 000-124-671-000 4. Exact name of issuer as specified in its charter IONICS, INC. 5. Province, country or other jurisdiction of incorporation or organization Philippines 6. Industry classification code: (SEC Use Only) 7. Address of principal office Circuit Street, Light Industry and Science Park of
the Philippines, BarrioDiezmo, CabuyaoLaguna Postal code 4025 8. Issuer's telephone number, including area code (049) 508-1111 and Fax Number (049) 508-111 loc. 309 9. In 1996, the Company changed its principal place of business from Makati, Metro Manila to Cabuyao,
Laguna. 10. Securities registered pursuant to Sections 8 and 12 of the SRC, or Sec. 4 and 8 of the SRC
Title of Each Class Number of Shares of Common Stock Outstanding Common P=1.00 par value, issued 857,974,992 shares and
outstanding, 856,574,992 shares (net of 1,400,000 shares of treasury stock). .
11. Are any or all of these securities listed on a Stock Exchange? Yes [ x ] No [ ]
If yes, state the name of such Stock Exchange and the classes of securities listed therein: Philippine Stock Exchange Common
5
12. Check whether the issuer:
(a) has filed all reports required to be filed by Section 17 of the SRC and SRC Rule 17 thereunder or Section 11 of the SRC and SRC Rule 11(a)-1 thereunder, and Sections 26 and 141 of The Corporation Code of the Philippines during the preceding twelve (12) months (or for such shorter period that the registrant was required to file such reports);
Yes [ x ] No [ ]
(b) has been subject to such filing requirements for the past ninety (90) days. Yes [ x ] No [ ]
6
PART I – FINANCIAL INFORMATION
ITEM 1.Unaudited Interim Condensed Consolidated Financial Statements
The unaudited interim condensed consolidated financial statements including notes thereto are filed as part of this report (pages 12-33). These unaudited interim condensed consolidated financial statements include the accounts of the Parent Company and its wholly owned subsidiaries, Ionics Properties, Inc. (IPI), Synertronix, Inc. (SI), Ionics Circuits Limited (ICL), IomniPrecision, Inc. (Iomni) and the 97% owned Ionics EMS, Inc. (EMS) and a Subsidiary(EMS-USA). Material intercompany balances have been eliminated in the consolidation.
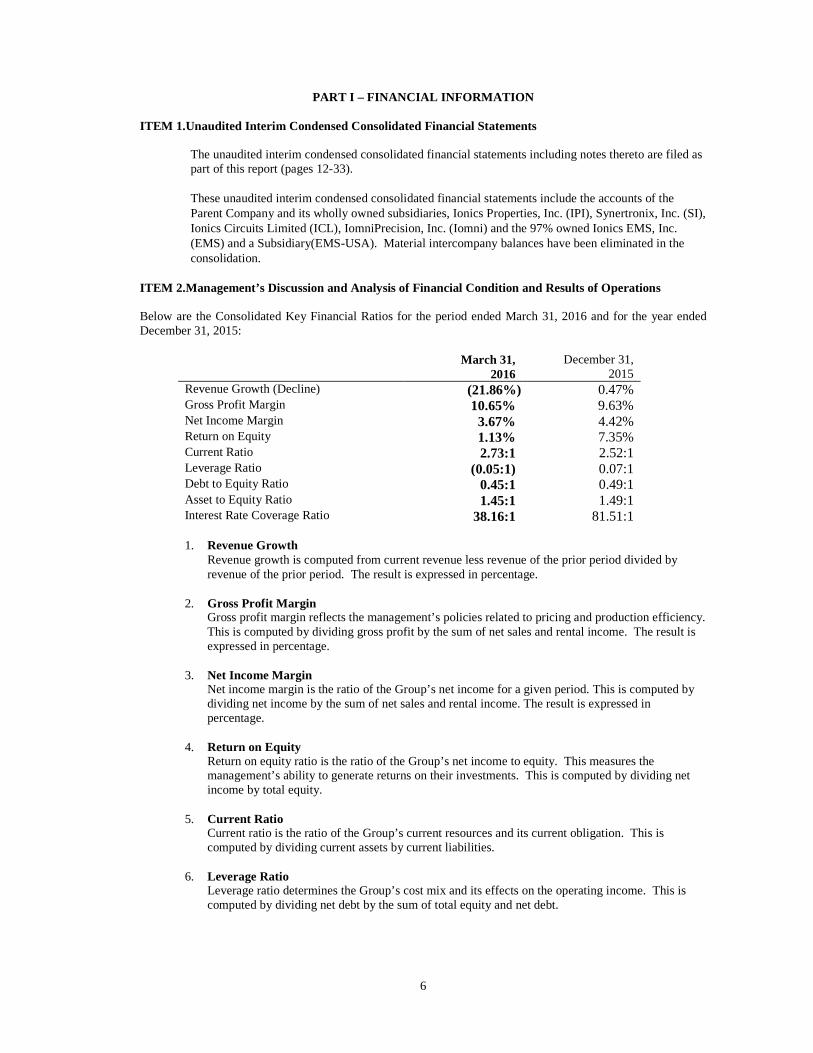
ITEM 2.Management’s Discussion and Analysis of Financial Condition and Results of Operations Below are the Consolidated Key Financial Ratios for the period ended March 31, 2016 and for the year ended December 31, 2015:
March 31,
2016 December 31,
2015 Revenue Growth (Decline) (21.86%) 0.47% Gross Profit Margin 10.65% 9.63% Net Income Margin 3.67% 4.42% Return on Equity 1.13% 7.35% Current Ratio 2.73:1 2.52:1 Leverage Ratio (0.05:1) 0.07:1 Debt to Equity Ratio 0.45:1 0.49:1 Asset to Equity Ratio 1.45:1 1.49:1 Interest Rate Coverage Ratio 38.16:1 81.51:1 1. Revenue Growth
Revenue growth is computed from current revenue less revenue of the prior period divided by revenue of the prior period. The result is expressed in percentage.
2. Gross Profit Margin
Gross profit margin reflects the management’s policies related to pricing and production efficiency. This is computed by dividing gross profit by the sum of net sales and rental income. The result is expressed in percentage.
3. Net Income Margin
Net income margin is the ratio of the Group’s net income for a given period. This is computed by dividing net income by the sum of net sales and rental income. The result is expressed in percentage.
4. Return on Equity
Return on equity ratio is the ratio of the Group’s net income to equity. This measures the management’s ability to generate returns on their investments. This is computed by dividing net income by total equity.
5. Current Ratio
Current ratio is the ratio of the Group’s current resources and its current obligation. This is computed by dividing current assets by current liabilities.
6. Leverage Ratio
Leverage ratio determines the Group’s cost mix and its effects on the operating income. This is computed by dividing net debt by the sum of total equity and net debt.

7
7. Debt to Equity Ratio The debt to equity ratio is used to measure the Group’s financial standing and ability to repay its obligations.This is computed by dividing total liabilities by equity.
8. Asset to Equity Ratio The asset to equity ratio shows the relationship of the total assets of the Group to the portion owned by shareholders. This indicates the company’s leverage (debt) used to finance the Group. This is computed by dividing total assets by equity.
9. Interest Rate Coverage Ratio Interest coverage ratio is the ratio of the Group’s ability to meet its interest payment. This is computed by dividing the sum of income before income taxes and finance costs by the finance costs.
As of the filing date, the management of the Group is not aware of:
a) any known trends, demands, commitments, events or uncertainties that will have a material impact on the issuer’s liquidity;
b) any events that will trigger direct or contingent financial obligation that is material to the Group, including any default or acceleration of an obligation;
c) all material off-balance sheet transactions, arrangements, obligations (including contingent obligations), and other relationships of the Group with unconsolidated entities or other persons created during the reporting period;
d) any material commitments for capital expenditures, the general purpose of such commitments and the expected sources of funds for such expenditures;
e) any known trends, events or uncertainties that have had or that are reasonably expected to have a material favorable or unfavorable impact on net sales/ revenues/ income from continuing operations;
f) any significant elements of income or loss that did not arise from the issuer’s continuing operations; and
g) any seasonal aspects that had a material effect on the financial condition or results of operations.
The causes for any material change from period to period, which shall include vertical and horizontal analyses of any material item, were disclosed in page number 7 to 10 of this report.
CONSOLIDATED FINANCIAL POSITION As of March 31, 2016, the consolidated assets of the Group amounted to US$58.42 million which is US$1.00 million lower than the US$59.42 million as of December 31, 2015. The decrease in the Group’s total assets was due to the decrease in accounts receivables.
Current ratio increased from 2.52:1 as of December 31, 2015 to 2.73:1 as of March 31, 2016 due to decrease in accounts payable and accrued expenses. Likewise, the Group’s debt to equity ratio decreased from 0.49:1 as of December 31, 2015 to 0.45:1 as of March 31, 2016.

8
Below is the summary of Balance Sheet Accounts with more than 5% increase (decrease):
Percentage increase (decrease) March 31, 2016 vs. December 31, 2015vs December 31, 2015 December 31, 2014 ASSETS Cash and cash equivalents 13 46 Receivables (16) (5) Inventories N/A (12) Prepayments and other current assets N/A (31) Available-for-sale investments N/A (1) Property, plant and equipment N/A 24 Investment properties N/A 20 Refundable deposit N/A 4 Deferred tax asset
N/A 9
LIABILITIES Accounts payable and accrued expenses (13) (13) Advances from customers N/A (57) Bank loans (19) 266 Income tax payable 69 145 Security deposits N/A 4 Pension liability N/A 8
As of March 31, 2016 (03.31.16 vs 12.31.15) Cash and cash equivalents increased due to cash flows generated from operations. Decrease in receivables was due to lower customer demand. Accounts payable and accrued expenses decreased due to lower purchases for inventories as a result of lower customer demand and production requirements. Bank loans decreased due to payment made during the period. The increase in income tax payable was due to additional provision for income tax for the period. As of December 31, 2015 (12.31.15 vs 12.31.14) Cash and cash equivalents increased due to cash flows provided by operations. Decrease in receivables was due to improved collection performance. Decrease in inventories was due to decrease in raw materials as a result of decrease in turnkey sales and controlled material purchases. Prepayments and other current assets decreased due to lower advances to suppliers for its raw materials. Property, plant and equipment increased due to additional acquisition of machineries and equipment and purchase of land. Accounts payable and accrued expenses decreased due to controlled purchases to minimize exposure on inventory purchases. Bank loans and finance lease liability increased due to availment of equipment loan during the year. Income tax payable increased due to additional tax provision. Advances from customers decreased due to implementation of risk management measures on aging inventories. The increase in security deposits was due to three months rental deposit from a new contract of lease signed by a third party and IPI. Pension liability increased due to additional accrual for the year.

9
CONSOLIDATED RESULTS OF OPERATIONS The summarized revenues and net income (losses) of the Group for the three months ended March 31, 2016 and 2015 are presented as follows (amounts in US Dollars): March 31, 2016
(3 months) March 31, 2015
(3 months) REVENUE
Operating Expense
NET INCOME (LOSS)*
REVENUE
Operating Expense
NET INCOME (LOSS)* COMPANY Sales
Rent income
and Other income Total Sales
Rent income and Other
income Total Parent − 111,224 111,224 94,206 (23,830) − 1,204,279 1,204,279 76,067 1,091,330 EMS and Subsidiary 11,112,664 38,783 11,151,447 614,900 71,005 14,519,406 30,291 14,549,697 631,787 300,386 IPI − 617,937 617,937 15,775 492,226 − 597,774 597,774 16,914 477,435 ICL − − − 3,569 (28,144) − 4 4 2,965 (26,984) Iomni 678,662 30,957 709,619 46,351 (51,562) 746,289 43,448 789,737 55,295 (80,181) Synertronix − 1 1 108 (108) − − − 354 (354) TOTAL 11,791,326 798,902 12,590,228 774,909 459,587 15,265,695 1,875,796 17,141,491 783,382 1,761,632 Eliminations (549) (133,233) (133,782) (93,813) (3,578) (9,448) (1,202,599) (1,212,047) (80,354) (1,087,101) Consolidated 11,790,777 665,669 12,456,446 681,096 456,009 15,256,247 673,197 15,929,444 703,028 674,531
*Net income (loss) attributable to equity holders of the Parent Company.
The Group’s sales in 2016 decreased by US$3.46 million or by 23% from US$15.26 millionfor the three months of 2015 to US$11.79 million in the same period of 2016. The decrease in saleswas due to lower customer demand.
Operating expenses decreased by US$0.02 million from US$0.70 million in 2015 to US$0.68 million in 2016. The Group posted an income before income tax of US$0.53 million andUS$0.76 million for the three months ended March 31,2016 and 2015, respectively.
With the foregoing, the Group reported a consolidated net income attributable to equity holders of the Parent Company amounting to US$0.46 millionandUS$0.67 millionfor the three months ended March 31, 2016 and 2015, respectively. INDIVIDUAL RESULT OF OPERATIONS Ionics, Inc. The Parent Company reported a net loss of US$0.02 million and net income of US$1.09 million for the three months ended March 31, 2016 and 2015, respectively. This arises from dividend income which was fully eliminated at consolidated level.
The individual performances of the subsidiaries for the three months ended March 31, 2015 are as follows: Ionics EMS, Inc. and Subsidiary EMS and Subsidiary’s sales decreased by US$3.41 million, or 23%, from US$14.52 million for the three months of 2015 to US$11.11 million in the same period of 2016. Gross profit decreased by US$0.14 millionfrom gross income of US$0.97 million in 2015 to gross income of US$0.83 million in the same period of 2016 due to increase in customers order during the period. Operating expenses decreased from US$0.63 million in 2015 to US$0.61 million in 2016. EMS and Subsidiary’s reported a net income of US$0.30 million for the three months ended March 31, 2015 as compared to a net income of US$0.07 million in the same period of 2016. Ionics Properties, Inc. (IPI)
IPI contributed rent income of US$0.62 million in 2016 and US$0.60 million in 2015. Net income amounted to US$0.49 million and US$0.48 million for the three months ended March 31, 2016 and 2015, respectively.

10
Ionics Circuits, Ltd. (ICL) ICL reported a net loss amounting to US$0.03 million for the three months ended March 31, 2016 and 2015. This was due to the equity loss take up from investment in associate. Synertronix, Inc. (SI) Synertronix’ reported a net loss amounting to US$108 in 2016 as compared to US$354 net loss in 2015. Iomni Precision, Inc. (Iomni) Iomni’s sales in the first three quarters of 2016 decreased to US$0.71 million from US$0.79 million in 2015.Iomnireported a gross income of US$0.02 million in 2016 as compared to a gross loss of US$0.03 million in 2015. Operating expenses amounted to US$0.05 million in 2016 and US$0.06 million 2015.
With the foregoing, the Company’s performance resulted to a net loss of US$0.05 million and US$0.08 million in 2016 and 2015, respectively. ITEM 3. Additional Requirements Financial Soundness Indicator Below are the financial ratios that are relevant to the Group for two comparative periods:
a. Liquidity Ratio
March 31,
2016 December 31,
2015 Currentratio Current ratio 2.73:1 2.52:1 Quick asset ratio 1.76:1 1.66:1 Debt-to-equity ratio 0.45:1 0.49:1 Asset-to-equity ratio 1.45:1 1.49:1
b. Profitability Ratio
March 31,
2016 March 31,
2015 Interest rate coverage ratio 38.00:1 132.26:1 Profitability ratio Gross profit margin 10.65% 9.10% Operating margin 5.17% 4.68% Net income margin 3.69% 4.24% Revenue growth (21.86%) 7.97%
11
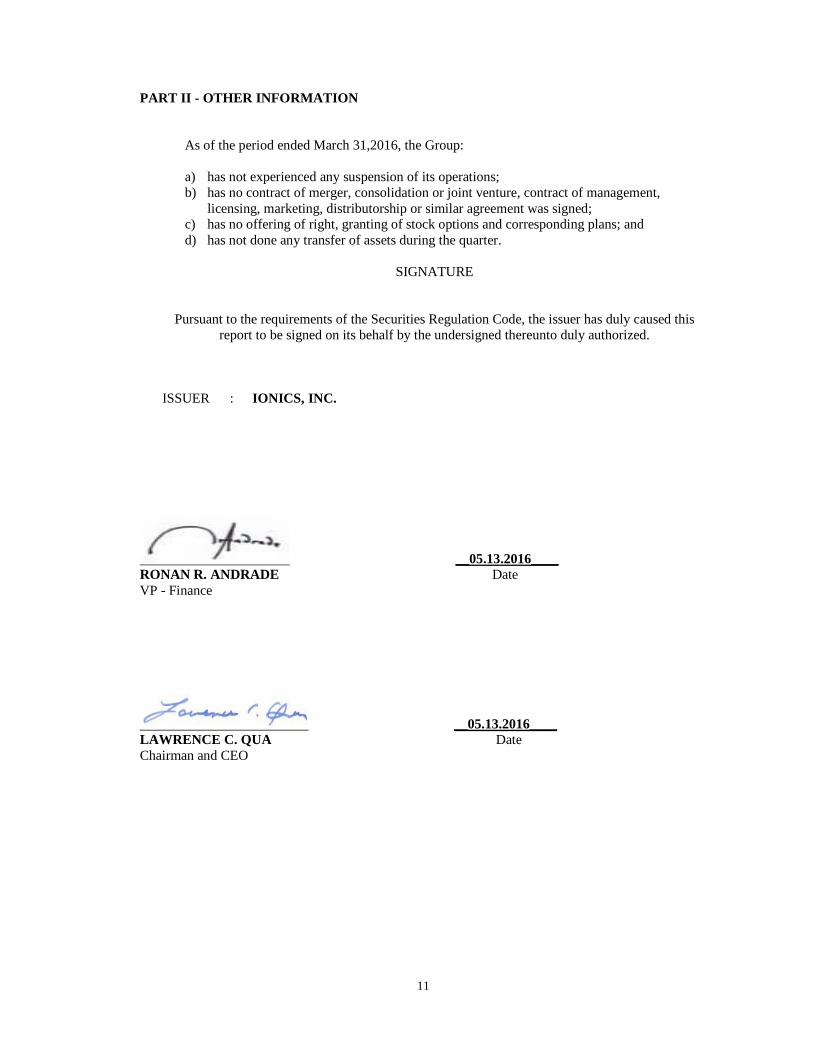
PART II - OTHER INFORMATION As of the period ended March 31,2016, the Group: a) has not experienced any suspension of its operations; b) has no contract of merger, consolidation or joint venture, contract of management,
licensing, marketing, distributorship or similar agreement was signed; c) has no offering of right, granting of stock options and corresponding plans; and d) has not done any transfer of assets during the quarter.
SIGNATURE
Pursuant to the requirements of the Securities Regulation Code, the issuer has duly caused this report to be signed on its behalf by the undersigned thereunto duly authorized.
ISSUER : IONICS, INC.
__05.13.2016____ RONAN R. ANDRADE Date VP - Finance
__05.13.2016____ LAWRENCE C. QUA Date Chairman and CEO

12
IONICS, INC. AND SUBSIDIARIES UNAUDITED INTERIM CONSOLIDATED STATEMENTS OF FINANC IAL POSITION (Amounts in Thousands)
Unaudited March 31,
2016
Audited December 31,
2015
ASSETS
Current Assets Cash and cash equivalents (Notes 3, 4and 5) US$11,671 US$10,284 Receivables (Notes 3 and 6) 11,841 14,110 Inventories (Note 7) 11,959 11,657 Prepayments and other current assets 982 1,004 Total Current Assets 36,453 37,055
Noncurrent Assets Available-for-sale investments (Notes 3 and8) 2,893 2,879 Investment in associates (Note 9) 116 116 Property, plant and equipment (Note 10) 12,741 13,068 Investment properties (Note 11) 5,559 5,640 Refundable deposits (Note 3) 420 420 Goodwill 217 217 Deferred tax assets 24 24 Total Noncurrent Assets 21,970 22,364 US$58,423 US$59,419
LIABILITIES AND EQUITY
Current Liabilities Accounts payable and accrued expenses (Notes 3, 4 and12) US$9,142 US$10,453 Advances from customers (Note 13) 3,556 3,616 Bank loans - current portion (Notes 3 and 4) 489 548 Income tax payable 183 108 Total Current Liabilities 13,370 14,725
Noncurrent Liabilities Net pension liability 2,599 2,515 Security deposits (Notes 3, 4 and 21) 1,139 1,127 Bank loans - net of current portion (Notes 3 and 4) 789 1,024 Other liabilities 171 110 Total Noncurrent Liabilities 4,698 4,776 Total Liabilities 18,068 19,501
(Forward)

13
IONICS, INC. AND SUBSIDIARIES UNAUDITED INTERIM CONSOLIDATED STATEMENTS OF FINANC IAL POSITION (Amounts in Thousands)
Unaudited March 31,
2016
Audited December 31,
2015
Equity(Note4) Capital stock US$17,633 US$17,633 Additional paid-in capital 9,072 9,072 Retained earnings 15,629 15,173 Unrealized losses on available-for-sale investments (Note 8) (220) (233) Other reserves (805) (805) Adjustment to non-controlling interests (1,000) (1,000) Exchange differences 512 546 Treasury shares (602) (602) 40,219 39,784 Non-controlling interests 136 134 Total Equity 40,355 39,918 US$58,423 US$59,419 See accompanying Notes to Unaudited Interim Condensed Consolidated Financial Statements.
14
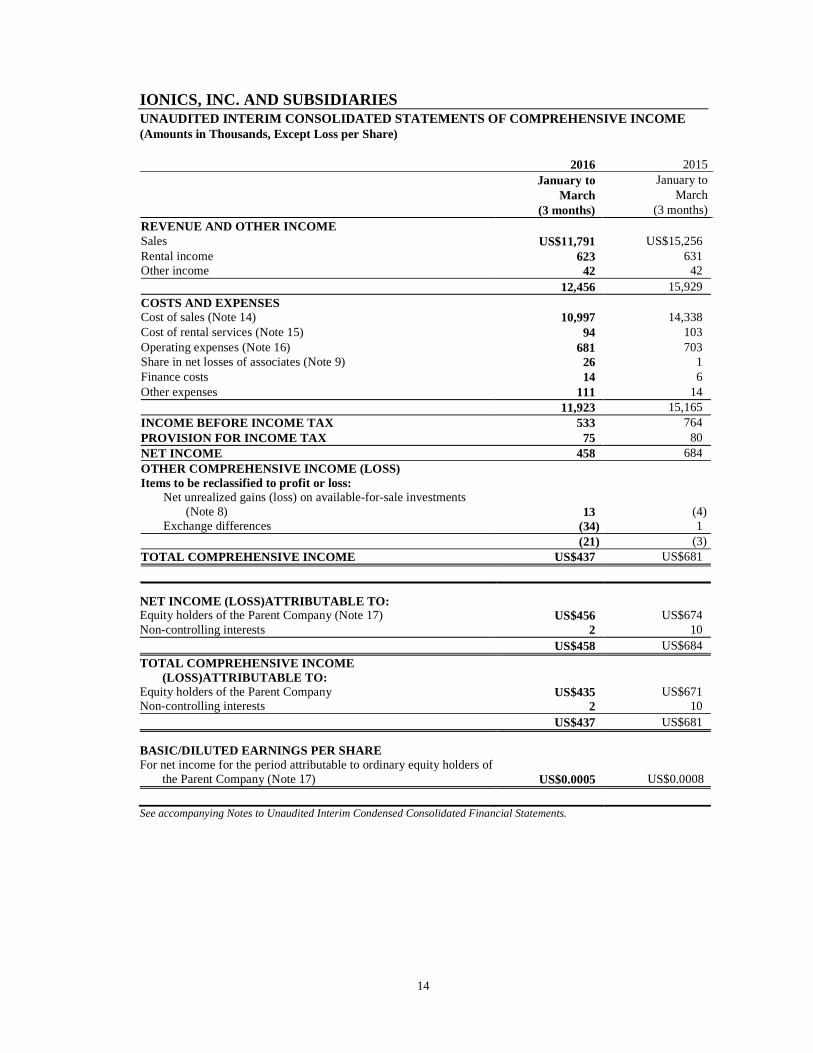
IONICS, INC. AND SUBSIDIARIES UNAUDITED INTERIM CONSOLIDATED STATEMENTS OF COMPRE HENSIVE INCOME (Amounts in Thousands, Except Loss per Share) 2016 2015
January to March
(3 months)
January to March
(3 months) REVENUE AND OTHER INCOME Sales US$11,791 US$15,256 Rental income 623 631 Other income 42 42 12,456 15,929 COSTS AND EXPENSES Cost of sales (Note 14) 10,997 14,338 Cost of rental services (Note 15) 94 103 Operating expenses (Note 16) 681 703 Share in net losses of associates (Note 9) 26 1 Finance costs 14 6 Other expenses 111 14 11,923 15,165 INCOME BEFORE INCOME TAX 533 764 PROVISION FOR INCOME TAX 75 80 NET INCOME 458 684 OTHER COMPREHENSIVE INCOME (LOSS) Items to be reclassified to profit or loss: Net unrealized gains (loss) on available-for-sale investments (Note 8) 13 (4) Exchange differences (34) 1 (21) (3) TOTAL COMPREHENSIVE INCOME US$437 US$681
NET INCOME (LOSS)ATTRIBUTABLE TO: Equity holders of the Parent Company (Note 17) US$456 US$674 Non-controlling interests 2 10 US$458 US$684
TOTAL COMPREHENSIVE INCOME (LOSS)ATTRIBUTABLE TO:
Equity holders of the Parent Company US$435 US$671 Non-controlling interests 2 10 US$437 US$681
BASIC/DILUTED EARNINGS PER SHARE For net income for the period attributable to ordinary equity holders of
the Parent Company (Note 17) US$0.0005 US$0.0008
See accompanying Notes to Unaudited Interim Condensed Consolidated Financial Statements.

15
IONICS, INC. AND SUBSIDIARIES UNAUDITED INTERIM CONSOLIDATED STATEMENTS CHANGES I N EQUITY (Amounts in Thousands)
Attributable to the Equity Holders of the Parent Company
Capital
Stock
Additional Paid-in Capital
Retained Earnings
Unrealized Gains/
(Losses) on
Available- for-Sale
Instrument (Note 8)
Other Reserves
Adjustment to Non-
Controlling Interest
Exchange Difference
Treasury Shares Totals
Non- Controlling
Interest Total
Balances as of January 1, 2016 US$17,633 US$9,072 US$15,173 (US$233) (US$805) (US$1,000) US$546 (US$602) US$39,784 US$134 US$39,918 Net income − − 456 − − − − − 456 2 458 Other comprehensive income − − − 13 − − (34) − (21) − (21) Total comprehensive income (loss) − − 456 13 − − (34) − 435 2 437 Balances as of March31, 2016 US$17,633 US$9,072 US$15,629 (US$220) (US$805) (US$1,000) US$512 (US$602) US$40,219 US$136 US$40,355 Balances as of January 1, 2015 US$17,633 US$9,072 US$12,248 (US$218) (US$708) (US$1,000) US$771 (US$602) US$37,196 US$85 US$37,281 Net income − − 674 − − − − − 674 10 684 Other comprehensive income − − − (4) − − 1 − (3) − (3) Total comprehensive income (loss) − − 674 (4) − − 1 − 671 10 681 Balances as of March31, 2015 US$17,633 US$9,072 US$12,922 (US$222) (US$708) (US$1,000) US$772 (US$602) US$37,867 US$95 US$37,962
See accompanying Notes to Unaudited Interim Condensed Consolidated Financial Statements.

16
IONICS, INC. AND SUBSIDIARIES
UNAUDITED INTERIM CONSOLIDATED STATEMENTS OF CASH F LOWS (Amounts in Thousands)
For the Period Ended March 31 2016 2015
CASH FLOWS FROM OPERATING ACTIVITIES Income before income tax US$533 US$764 Adjustments for: Depreciation and amortization (Notes 10 and 11) 714 531 Share in net losses of associates (Note 9) 26 1 Finance cost 14 6 Pension expense 84 70 Interest income (5) (5) Operating income before working capital changes 1,366 1,367 Decrease (increase) in: Receivables 2,269 3,566 Inventories (302) (982) Prepayments and other current assets 22 (15) Refundable deposit − 23 Increase (decrease) in Accounts payable and accrued expenses (1,375) (451) Advances from customers (60) 551 Security deposits 12 − Net cash generated from operations 1,932 4,059 Interest received 5 20 Interest paid (7) (6) Income taxes paid − (1) Net cash provided by operating activities 1,930 4,072
CASH FLOWS FROM INVESTING ACTIVITY Acquisitions of property, plant and equipment (Note 10) (310) (505)
CASH FLOWS FROM FINANCING ACTIVITIES Payments of bank loans (294) (75) Increase in other liabilities 61 − Net cash used in financing activities (233) (75)
NET INCREASE IN CASH AND CASH EQUIVALENTS 1,387 3,492
CASH AND CASH EQUIVALENTS AT BEGINNING OF PERIOD 10 ,284 7,049
CASH AND CASH EQUIVALENTS AT END OF PERIOD (Note 5) US$11,671 US$10,541
See accompanying Notes to Unaudited Interim Consolidated Financial Statements.

17
IONICS, INC. AND SUBSIDIARIES NOTES TO UNAUDITED INTERIM CONDENSED CONSOLIDATED F INANCIAL STATEMENTS (Amounts in Thousands, Except Par Value per Share and Loss per Share) 1. Corporate Information
Ionics, Inc. (the Parent Company) is a domestic corporation incorporated under the laws of the Philippines and registered with the Securities and Exchange Commission (SEC) in September 1982. The Parent Company started commercial operations in July 1987 to engage in electronic manufacturing services business. In September 1999, the Parent Company transferred its primary manufacturing business to a majority owned subsidiary, Ionics EMS, Inc. (EMS), which was subsequently listed in the Singapore Exchange Securities Trading Limited (Singapore Exchange). Consequently, the Parent Company’s primary purpose was amended from a manufacturing company to a holding company. The registered office address of the Group is CircuitStreet, Light Industry and Science Park of the Philippines, Barrio Diezmo, Cabuyao, Laguna.
The Parent Company is listed in the Philippine Stock Exchange. The unaudited interim consolidated financial statements were approved and authorized for issue by the Board of Directors (BOD) on May 12, 2016.
2. Summary of Significant Accounting Policies
Basis of Preparation Theunaudited interim condensed consolidated financial statements of the Group have been prepared in accordance with Philippine Accounting Standards (PAS) 34, Interim Financial Reporting.
The unaudited interim consolidated financial statements do not include all the information and disclosures required in the annual financial statements, and should be read in conjunction with the Group’s annual financial statements as at December 31, 2015.
The unaudited interim condensed consolidated financial statements are presented in United States (US) Dollar, which is also the Group’s functional currency. All values are rounded to the nearest thousand (US$000) except when otherwise indicated.

18
The followingare the wholly and majority owned subsidiaries of the Parent Company as of March 31, 2016 and December 31, 2015:
Subsidiaries Country
of Incorporation Principal Activity
Effective Percentage of Ownership
2016 2015 ICL Cayman Islands Investing 100% 100% IPI Philippines Leasing 100 100 Iomni Philippines Manufacturing 100 100 SI Philippines Manufacturing 100 100 EMS Philippines Manufacturing 97 97 IUSA United States of America Manufacturing 100 100
Changes in Accounting Policies and Disclosures The accounting policies adopted in the preparation of the unaudited interim condensed consolidated financial statements are consistent with those of the Group’s annual consolidated financial statements for the year ended December 31, 2015, except for the adoption of new standards and interpretations effective as of January 1, 2016. As required by PAS 34, the nature and effect of these changes are disclosed below. Several other new standards and amendments apply for the first time in 2016. However, they do not impact the unaudited interim consolidated financial statements of the Group. The nature and the impact of each new standard or amendment are described below:
• PFRS 10, Consolidated Financial Statements, and PAS 28, Investments in Associates and
Joint Ventures - Investment Entities: Applying the Consolidation Exception (Amendments)
These amendments clarify that the exemption in PFRS 10 from presenting consolidated financial statements applies to a parent entity that is a subsidiary of an investment entity that measures all of its subsidiaries at fair value and that only a subsidiary of an investment entity that is not an investment entity itself and that provides support services to the investment entity parent is consolidated. The amendments also allow an investor (that is not an investment entity and has an investment entity associate or joint venture), when applying the equity method, to retain the fair value measurement applied by the investment entity associate or joint venture to its interests in subsidiaries. These amendments are not applicable to the Group since the Group does not have investment entity associates or joint venture.
• PAS 27, Separate Financial Statements - Equity Method in Separate Financial Statements (Amendments) The amendments will allow entities to use the equity method to account for investments in subsidiaries, joint ventures and associates in their separate financial statements. Entities already applying PFRS and electing to change to the equity method in its separate financial statements will have to apply that change retrospectively. These amendments have no any impact on the Group’s consolidated financial statements
• PFRS 11, Joint Arrangements - Accounting for Acquisitions of Interests (Amendments) The amendments to PFRS 11 require a joint operator that is accounting for the acquisition of an interest in a joint operation, in which the activity of the joint operation constitutes a business (as defined by PFRS 3), to apply the relevant PFRS 3 principles for business combinations accounting. The amendments also clarify that a previously held interest in a joint operation is not remeasured on the acquisition of an additional interest in the same joint operation while joint control is retained.

19
In addition, a scope exclusion has been added to PFRS 11 to specify that the amendments do not apply when the parties sharing joint control, including the reporting entity, are under common control of the same ultimate controlling party. The amendments apply to both the acquisition of the initial interest in a joint operation and the acquisition of any additional interests in the same joint operation. These amendments did not have any impact to the Group.
• PAS 1, Presentation of Financial Statements - Disclosure Initiative (Amendments) The amendments are intended to assist entities in applying judgment when meeting the presentation and disclosure requirements in PFRS. They clarify the following: a. That entities shall not reduce the understandability of their financial statements by either
obscuring material information with immaterial information; or aggregating material items that have different natures or functions
b. That specific line items in the statement of income and OCI and the statement of financial position may be disaggregated
c. That entities have flexibility as to the order in which they present the notes to financial statements
d. That the share of OCI of associates and joint ventures accounted for using the equity method must be presented in aggregate as a single line item, and classified between those items that will or will not be subsequently reclassified to profit or loss.
These amendments have no significant impact to the Group’s consolidated financial statements.
• PAS 16, Property, Plant and Equipment, and PAS 38, Intangible Assets - Clarification of Acceptable Methods of Depreciation and Amortization (Amendments) The amendments clarify the principle in PAS 16 and PAS 38 that revenue reflects a pattern of economic benefits that are generated from operating a business (of which the asset is part) rather than the economic benefits that are consumed through use of the asset. As a result, a revenue-based method cannot be used to depreciate property, plant and equipment and may only be used in very limited circumstances to amortize intangible assets. These amendments have no impact to the Group given that the Group has not used a revenue-based method to depreciate its non-current assets.
Annual Improvements to PFRSs (2012-2014 cycle)
The Annual Improvements to PFRSs (2012-2014 cycle) are effective for annual periods beginning on or after January 1, 2016 and did not have any material impact on the Group. They include:
• PFRS 5, Non-current Assets Held for Sale and Discontinued Operations – Changes in Methods of Disposal
• PFRS 7, Financial Instruments: Disclosures - Servicing Contracts • PFRS 7 - Applicability of the Amendments to PFRS 7 to Condensed Interim Financial
Statements • PAS 19, Employee Benefits - regional market issue regarding discount rate • PAS 34, Interim Financial Reporting - disclosure of information ‘elsewhere in the interim
financial report’
20
3. Financial Risk Management Objectives and Policies Risk Management Structure All policy directions, business strategies and management initiatives emanate from the BOD which strives to provide the most effective leadership for the Group. The BOD endeavors to remain steadfast in its commitment to provide leadership, direction and strategy by regularly reviewing the Group’s performance. For this purpose, the BOD convenes in quarterly meetings and in addition, is available to meet in the interim should the need arise. The Group has adopted internal guidelines setting forth matters that require BOD approval. Under the guidelines, all new investments, any increase in investment in business and subsidiary and any divestments require BOD approval.
The normal course of the Group’s business exposes it to a variety of financial risks such as credit risk, liquidity risk and market risks which include interest rate risk, equity price risk and foreign currency risk exposures.
The Group has various financial assets such as cash and cash equivalents, trade and non-trade receivables, AFS investments and refundable deposits. The Group’s principal financial liabilities consist of accounts payable and accrued expenses, bank loans, and security deposits. The main purpose of these financial liabilities is to raise funds for the Group’s operations.
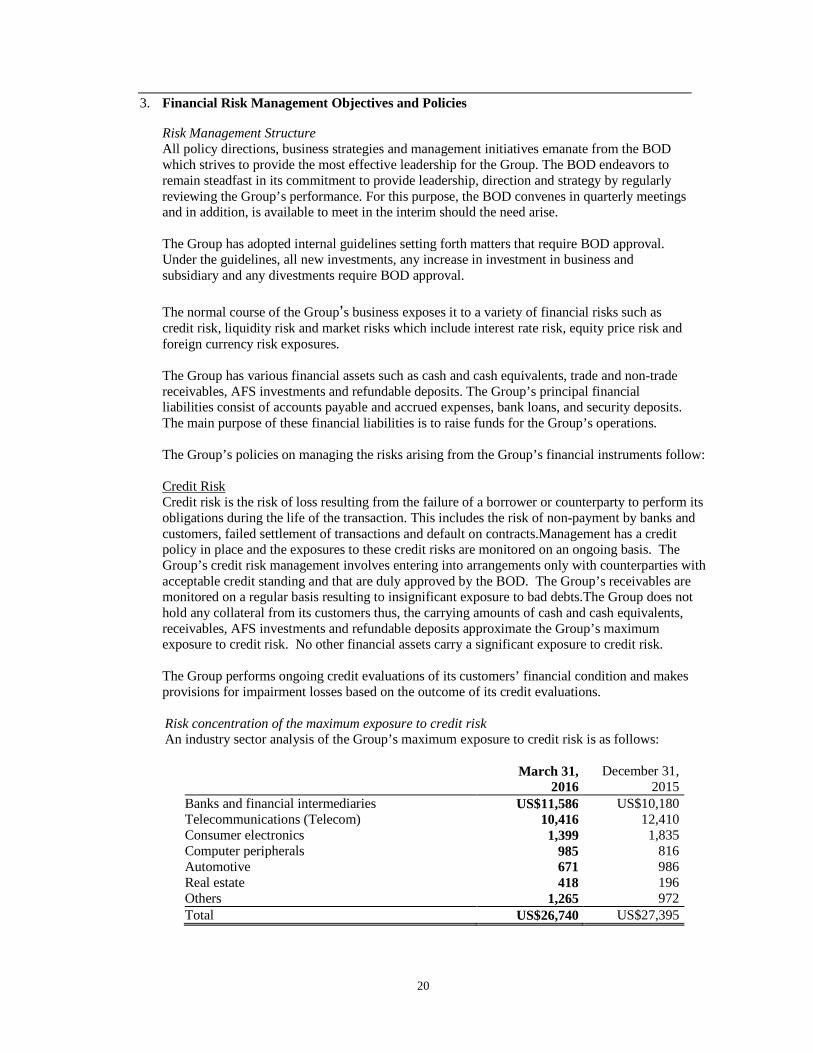
The Group’s policies on managing the risks arising from the Group’s financial instruments follow: Credit Risk Credit risk is the risk of loss resulting from the failure of a borrower or counterparty to perform its obligations during the life of the transaction. This includes the risk of non-payment by banks and customers, failed settlement of transactions and default on contracts.Management has a credit policy in place and the exposures to these credit risks are monitored on an ongoing basis. The Group’s credit risk management involves entering into arrangements only with counterparties with acceptable credit standing and that are duly approved by the BOD. The Group’s receivables are monitored on a regular basis resulting to insignificant exposure to bad debts.The Group does not hold any collateral from its customers thus, the carrying amounts of cash and cash equivalents, receivables, AFS investments and refundable deposits approximate the Group’s maximum exposure to credit risk. No other financial assets carry a significant exposure to credit risk. The Group performs ongoing credit evaluations of its customers’ financial condition and makes provisions for impairment losses based on the outcome of its credit evaluations. Risk concentration of the maximum exposure to credit risk An industry sector analysis of the Group’s maximum exposure to credit risk is as follows:
March 31, December 31, 2016 2015
Banks and financial intermediaries US$11,586 US$10,180 Telecommunications (Telecom) 10,416 12,410 Consumer electronics 1,399 1,835 Computer peripherals 985 816 Automotive 671 986 Real estate 418 196 Others 1,265 972 Total US$26,740 US$27,395

21
The Group has concentration of credit risk due to sales to significant customers. The financial assets of the Group were more concentrated to telecom, banks and financial intermediaries, and computer peripherals industries which accounted for 86.12% of the total financial assets as of March 31, 2016. While as of December 31, 2015, the Group’s assets are more concentrated to telecom, computer peripherals, and consumer electronics industries which accounted for 89.23% of the total financial assets. The Group’s financial instruments are broadly diversified along industry, product and geographic lines, and transactions are entered into with a range of counterparties, thereby mitigating any significant concentration of credit risk. The tables below summarize the credit quality of the Group’s financial assets (gross of allowance for credit and impairment losses) as of March 31, 2016 and December 31, 2015, respectively:
March 31, 2016
Neither Past Due nor Individually Impaired Past Due
but not Individually Minimal Risk Average Risk High Risk Impaired Impair ed Total Cash in banks and cash equivalents* US$11,568 US$− US$− US$− US$− US$11,568 Receivables Trade receivables 7,603 − − 1,950 43 9,597 Other receivables from customers 390 − − 690 − 1,080 Rent receivables 321 − − − − 321 SSS claims receivables 62 − − − − 62 Advances to managers and employees 20 − − − − 20 Others 696 − − 108 − 804 Refundable deposits 420 − − − − 420 US$21,081 US$− US$− US$2,748 US$43 US$23,872
*Excludes cash on hand amounting to US$0.10 million
December 31, 2015
Neither Past Due nor Individually Impaired Past Due
but not Individually Minimal Risk Average Risk High Risk Impaired Impaired TotalCash and cash equivalents* US$10,180 US$− US$− US$− US$− US$10,180Receivables Trade receivables 9,794 − − 2,019 50 11,863 Other receivables from customers 548 − − 790 − 1,338 Rent receivables 189 − − − − 189 SSS claims receivables 22 − − − − 22 Advances to managers and employees** 29 − − − − 29 Others 552 − − 107 2 661Refundable deposits 420 − − − − 420 US$21,734 US$− US$− US$2,916 US$52 US$24,702
*Excludes cash on hand amounting to US$0.10 million **Excludes non-financial assets amounting to US$0.06 million
The Group classifies credit quality risk as follows: Minimal risk - accounts with a high degree of certainty in collection, where counterparties have consistently displayed prompt settlement practices, and have little to no instance of defaults or discrepancies in payment.
Average risk - active accounts with minimal to regular instances of payment default, due to ordinary/common collection issues, but where the likelihood of collection is still moderate to high as the counterparties are generally responsive to credit actions initiated by the Group.
22
High risk - accounts with a low probability of collection and can be considered impaired based on historical experience, where counterparties exhibit a recurring tendency to default despite constant reminder and communication, or even extended payment terms. The Group maintains cash and cash equivalents with various financial institutions that management believes to be of high credit quality. The Group’s policy is to invest with financial institution from which it has outstanding loans and loan facilities.
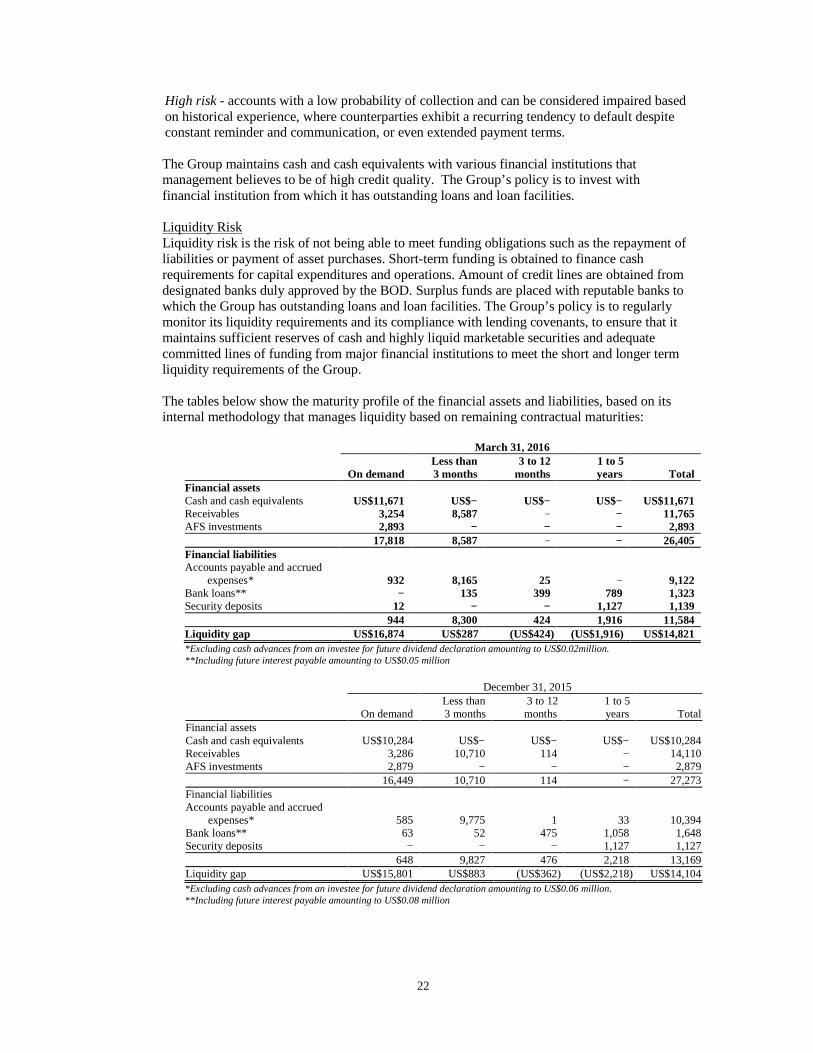
Liquidity Risk Liquidity risk is the risk of not being able to meet funding obligations such as the repayment of liabilities or payment of asset purchases. Short-term funding is obtained to finance cash requirements for capital expenditures and operations. Amount of credit lines are obtained from designated banks duly approved by the BOD. Surplus funds are placed with reputable banks to which the Group has outstanding loans and loan facilities. The Group’s policy is to regularly monitor its liquidity requirements and its compliance with lending covenants, to ensure that it maintains sufficient reserves of cash and highly liquid marketable securities and adequate committed lines of funding from major financial institutions to meet the short and longer term liquidity requirements of the Group.
The tables below show the maturity profile of the financial assets and liabilities, based on its internal methodology that manages liquidity based on remaining contractual maturities:
March 31, 2016
On demand Less than 3 months
3 to 12 months
1 to 5 years Total
Financial assets Cash and cash equivalents US$11,671 US$− US$− US$− US$11,671 Receivables 3,254 8,587 − − 11,765 AFS investments 2,893 − − − 2,893 17,818 8,587 − − 26,405 Financial liabilities Accounts payable and accrued
expenses* 932 8,165 25 − 9,122 Bank loans** − 135 399 789 1,323 Security deposits 12 − − 1,127 1,139 944 8,300 424 1,916 11,584 Liquidity gap US$16,874 US$287 (US$424) (US$1,916) US$14,821 *Excluding cash advances from an investee for future dividend declaration amounting to US$0.02million.
**Including future interest payable amounting to US$0.05 million
December 31, 2015
On demand Less than 3 months
3 to 12 months
1 to 5 years Total
Financial assets Cash and cash equivalents US$10,284 US$− US$− US$− US$10,284 Receivables 3,286 10,710 114 − 14,110 AFS investments 2,879 − − − 2,879 16,449 10,710 114 − 27,273 Financial liabilities Accounts payable and accrued
expenses* 585 9,775 1 33 10,394 Bank loans** 63 52 475 1,058 1,648 Security deposits − − − 1,127 1,127 648 9,827 476 2,218 13,169 Liquidity gap US$15,801 US$883 (US$362) (US$2,218) US$14,104 *Excluding cash advances from an investee for future dividend declaration amounting to US$0.06 million. **Including future interest payable amounting to US$0.08 million
23
The Group finances its cash requirements by tapping its available credit lines.
Market Risk Market risk is the risk of loss to future earnings, to fair value or future cash flows of a financial instrument as a result of changes in its price, caused by changes in interest rates, equity pricesandforeigncurrency exchange rates and other market factors.
Interest rate risk Interest rate risk is the risk that the value of a financial instrument will fluctuate because of changes in interest rates. The Group follows a prudent policy in managing its assets and liabilities so as to ensure that exposure to fluctuation in interest rates are kept within acceptable limits. The Group does not perform sensitivity analysis on its cash and cash equivalents and bank loans since the Group expects that the effect of the change in interest rates will have insignificant effect on the Group’s operations.
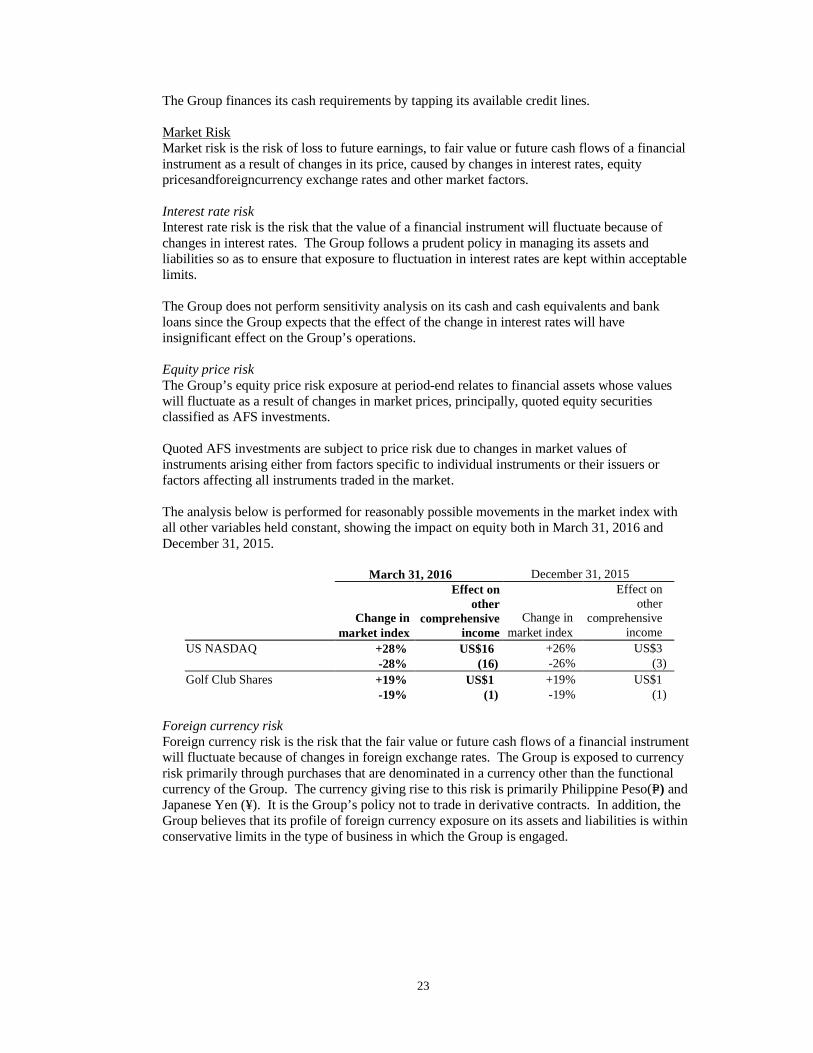
Equity price risk The Group’s equity price risk exposure at period-end relates to financial assets whose values will fluctuate as a result of changes in market prices, principally, quoted equity securities classified as AFS investments.
Quoted AFS investments are subject to price risk due to changes in market values of instruments arising either from factors specific to individual instruments or their issuers or factors affecting all instruments traded in the market.
The analysis below is performed for reasonably possible movements in the market index with all other variables held constant, showing the impact on equity both in March 31, 2016 and December 31, 2015.
March 31, 2016 December 31, 2015
Change in
market index
Effect on other
comprehensive income
Change in market index
Effect on other
comprehensive income
US NASDAQ +28% US$16 +26% US$3 -28% (16) -26% (3) Golf Club Shares +19% US$1 +19% US$1 -19% (1) -19% (1)
Foreign currency risk Foreign currency risk is the risk that the fair value or future cash flows of a financial instrument will fluctuate because of changes in foreign exchange rates. The Group is exposed to currency risk primarily through purchases that are denominated in a currency other than the functional currency of the Group. The currency giving rise to this risk is primarily Philippine Peso(P=) and Japanese Yen (¥). It is the Group’s policy not to trade in derivative contracts. In addition, the Group believes that its profile of foreign currency exposure on its assets and liabilities is within conservative limits in the type of business in which the Group is engaged.

24
The tablebelowdetails the Group’s exposure at the reporting date to currency risk arising from forecasted transactions or recognized assets or liabilities denominated in a currency other than the functional currency of the Group.
a. Philippine Peso
March 31, 2016 December 31, 2015
In US Dollar
In Philippine Peso In US Dollar
In Philippine Peso
Cash US$1,018 P=46,915 US$868 P=40,856
Receivables 1,123 52,179 946 43,985 AFS investments 983 45,283 981 46,174 Refundable deposits 471 21,703 469 22,053
3,595 166,080 3,264 153,068 Less: Accounts payable and accrued expenses 2,121 94,637 1,892 88,899
Net exposure US$1,474 P=71,443 US$1,372 P=64,169
b. Japanese yen
March 31, 2016 December 31, 2015
In US Dollar
In Japanese Yen In US Dollar
In Japanese Yen
Gross exposure arising from recognized liabilities (US$488) (¥55,666) (US$758) (¥91,300)
The exchange rates used to restate the Group’s foreign currency-denominated assets and liabilities follow:
Currency Source March 31,
2016 December 31,
2015 Philippine Peso Philippine Dealing & Exchange Corp.
closing rate US$0.021706 US$0.021249 Japanese Yen BangkoSentral ng Pilipinas (BSP)
closing rate ¥0.008895
¥0.008311 Sensitivity analysis The following table indicates the approximate change in the Group’s income before income tax in response to reasonably possible changes in the foreign exchange rates to which the Group has significant exposure at the reporting date:
Increase (decrease) from year-end exchange rates 2016 2015 Changes in foreign currency exchange rates Philippine Peso 0.04% (0.04%) 4.97% (4.97%) Japanese Yen 0.23% (0.23%) 0.06% (0.06%) Effect on income (loss) before tax Philippine Peso US$1.74 (US$1.74) US$68 (US$68) Japanese Yen US$0.21 (US$0.21) US$0.45 (US$0.45)
Other than the potential impact on income (loss) before income tax, there is no other effect on equity.

25
The sensitivity analysis has been determined assuming that the change in foreign currency exchange rates has occurred at the reporting date and has been applied to each of the Group entities’ exposure to currency risk for financial instruments in existence at that date, and that all other variables, in particular interest rates, remain constant.The Group does not expect the impact of the volatility on other currencies to be material.
The stated changes represent management’s assessment of reasonably possible changes in foreign currency exchange rates over the period until the next annual reporting date. Results of the analysis as presented in the above table represent an aggregation of the effects on each of the entities’ incomebefore tax measured in the respective functional currencies, translated into US Dollars at the exchange rate ruling at the reporting date for presentation purposes.
4. Capital Management
The Group’s primary objective in managing capital is to provide returns for shareholders and benefits for other stakeholders, by pricing products and services commensurately with the level of risk and by securing access to finance at a reasonable cost. The Group monitors capital using a leverage ratio, which is net debt divided by the sum of total equity and net debt. Net debt includes bank loans and trade and other payables less cash and cash equivalents. The Group’s policy is for its leverage ratio not to exceed 75%.
The leverage ratio as of March 31, 2016 and December 31, 2015:
March 31, 2016
December 31, 2015
Current liabilities Accounts payable and accrued expenses* US$9,085 US$10,394 Bank loans - current portion 489 548 9,574 10,942 Noncurrent liabilities Security deposits 1,139 1,127 Bank loans - net of current portion 789 1,024 1,928 2,151 Total debt 11,502 13,093 Less cash and cash equivalents 11,671 10,284 Net debt(cash and cash equivalents) (169) 2,809 Equity 40,355 39,918 Total equity and net debt US$40,186 US$42,727 Leverage ratio -0.42% 6.57%
*Excluding cash advances from an investee amounting to US$0.06 million as of March 31, 2016 and December 31,2015.
5. Cash and Cash Equivalents
This account consists of:
March 31,
2016 December 31,
2015 Cash on hand US$103 US$104 Cash in banks 11,568 10,180 US$11,671 US$10,284

26
6. Receivables
This account consists of:
March 31,
2016 December 31,
2015 Trade receivables US$9,597 US$11,863 Other receivables from customers 1,080 1,338 Rent receivables 321 189 Advances to managers and employees 20 89 SSS claims receivables 62 22 Others 804 661 11,884 14,162 Less allowance for impairment losses 43 52 US$11,841 US$14,110
The table below shows the aging analysis of receivables as at March 31, 2016:
Past Due but Not Impaired 1 to 30 31 to 60 61 to 90 91 to 120 Over 120
Total Current Days Days days days Days Impaired Trade receivables US$9,597 US$7,560 US$944 US$830 US$48 US$35 US$137 US$43 Other receivables from customers 1,080 390 90 10 266 70 254 − Rent receivables 321 321 − − − − − − Advances to managers and employees 20 20 − − − − −
−
SSS claims receivables 62 62 − − − − −
−
Others 804 696 − − − − 108 − US$11,884 US$9,049 US$1,034 US$840 US$314 US$105 US$499 US$43
7. Inventories
March 31,
2016 December 31,
2015 At NRV: Finished goods US$575 US$159 Work-in-process 199 254 774 413 At cost: Raw materials 10,636 10,627 Spare parts and supplies 709 774 11,345 11,401 Less allowance for inventory obsolescence 160 157 US$11,959 US$11,657

27
8. Available-for-Sale Investments
March 31,
2016 December 31,
2015 Quoted US$146 US$50 Unquoted 2,747 2,829 US$2,893 US$2,879
Quoted AFS investments are listed in the Philippines Stock Exchange, aside from Rovi which is listed in the US NASDAQ stock market.
The movements in net unrealized losses on AFS investments follow:
March31,
2016 December 31,
2015 Balances at beginning of period (US$233) (US$218)Changes in fair value of AFS investments recognized
under other comprehensive income (loss) 13 (15)Balances at end of period (US$220) (US$233)
9. Investment in Associates
The composition of and movements in this account follow:
2016 2015 Acquisition cost: Balances at beginning of year US$406 US$116 Additions − 290 Balances at end of year 406 406 Accumulated equity in net earnings Balances at beginning of year 53 227 Share in net losses (26) (174) Balances at end of year 27 53 Reclass to other liabilities 60 110 Equity in cumulative translation adjustment (377) (453) Net book values US$116 US$116

28
10. Property, Plant and Equipment The composition of and movements in this account follow:
March 31, 2016
Land
Machineries and
Equipment
Building, Building
Improvements and Leasehold Improvements
Tools and Other
Equipment
Plant Water and
Airconditioning Systems
Furniture, Fixtures and
Equipment Transportation
Equipment Total Cost Balances at beginning of
period US$1,918 US$28,299 US$7,663 US$5,077 US$1,349 US$251 US$71 US$44,628 Additions − 90 73 120 − − 27 310 Disposals/retirements − (15) − − − − − (15) Balances at end of period 1,918 28,374 7,736 5,197 1,349 251 98 44,923 Accumulated depreciation
and amortization Balances at beginning of
period − 20,965 6,080 3,442 795 241 37 31,560 Depreciation and amortization
(Notes 14 and 15) − 348 99 116 56 1 17 637 Disposals/retirements − (15) − − − − − (15) Balances at end of period − 21,298 6,179 3,558 851 242 54 32,182 Net book values US$1,918 US$7,076 US$1,557 US$1,639 US$498 US$9 US$44 US$12,741
December 31, 2015
Land
Machineries and
Equipment
Building, Building
Improvements and Leasehold Improvements
Tools and Other
Equipment
Plant Water and
Airconditioning Systems
Furniture, Fixtures and
Equipment Transportation
Equipment Total Cost Balances at beginning of year US$1,110 US$25,840 US$8,064 US$4,458 US$1,054 US$254 US$51 US$40,831 Additions* 1,430 3,172 113 738 312 6 20 5,791 Disposals* − (713) (42) (119) (17) (9) − (900) Transfers to investment
properties (622) − (472) − − − − (1,094) Balances at end of year 1,918 28,299 7,663 5,077 1,349 251 71 44,628 Accumulated depreciation Balances at beginning of year − 20,488 5,949 3,058 534 245 29 30,303 Depreciation**
(Notes 14 and 15) − 1,108 341 509 278 5 8 2,249 Disposals** − (631) (44) (125) (17) (9) − (826) Transfers to investment
properties − − (166) − − − − (166) Balances at end of year − 20,965 6,080 3,442 795 241 37 31,560 Net book values US$1,918 US$7,334 US$1,583 US$1,635 US$554 US$10 US$34 US$13,068
*Includes various reclassifications amounting to US$0.18 million **Includes various reclassifications amounting to US$0.15 million
11. Investment Properties The composition of and movements in this account follow:
March 31, 2016
Land Building Building
Improvements Total Cost Balances at beginning and end of year US$2,181 US$5,258 US$2,818 US$10,257 Accumulated Depreciation and
Amortization Balances at beginning of year − 2,194 2,700 4,894 Depreciation and amortization
(Notes 14and 15) − 63 14 77 Balances at end of year − 2,257 2,714 4,971 Exchange Reserves − 273 − 273 Net Book Values US$2,181 US$3,274 US$104 US$5,559

29
December 31, 2015
Land Building Building
Improvements Total Cost Balances at beginning of year US$1,559 US$4,550 US$2,743 US$8,852 Additions − 236 75 311 Reclass/ transfers 622 472 − 1,094 Balances at end of year 2,181 5,258 2,818 10,257 Accumulated Depreciation Balances at beginning of year − 1,775 2,650 4,425 Depreciation (Notes 14 and 15) − 253 50 303 Disposals − − − − Reclass/ transfers − 166 − 166 Balances at end of year − 2,194 2,700 4,894 Exchange Reserves 116 161 − 277 Net Book Values US$2,297 US$3,225 US$118 US$5,640
12. Accounts Payable and Accrued Expenses
March 31,
2016 December 31,
2015 Trade payables US$6,383 US$7,408 Non-trade payables 58 198 Accrued expenses 1,888 2,224 Others 813 623 US$9,142 US$10,453
Accrued expenses consist of:
March 31,
2016 December 31,
2015 Accrued salaries, wages and other benefits US$916 US$1,118 Accrued utilities 361 404 Accrued sales commission 168 231 Accrued professional fees 163 152 Accrued rent 90 107 Accrued handling charges 53 82 Accrued direct materials 46 44 Others 91 86 US$1,888 US$2,224
13. Advances from Customers
The account represents advanced payments for raw material purchases, amounting to US$3.56 millionand US$3.62 million as of March 31, 2016 and December 31, 2015, respectively.

30
14. Cost of Sales
March31, 2016
(3 months)
March 31, 2015
(3 months) Raw materials and supplies used US$7,891 US$10,745 Salaries, wages and benefits 1,751 1,815 Occupancy cost and utilities 784 847 Depreciation and amortization (Notes 10 and 11) 647 436 Handling and freight charges 136 181 Other expenses 149 220 Total manufacturing cost 11,358 14,244 Work-in-process (Note 7) Beginning 254 258 Ending (199) (308)Cost of goods manufactured 11,413 14,194 Finished goods (Note 7) Beginning 159 324 Ending (575) (180) US$10,997 US$14,338
15. Cost of Rental Services
March 31, 2016
(3months)
March 31, 2015
(3 months) Depreciation (Notes 10 and 11) US$63 US$95 Other expenses 26 2 Taxes and licenses 5 5 Repairs and maintenance − 1 US$94 US$103
16. Operating Expenses
March 31, 2016
(3 months)
March31, 2015
(3 months) Salaries, wages and benefits US$369 US$289 Selling expenses 143 287 Professional fees 102 75 Depreciation and amortization (Notes 10 and 11) 4 − Occupancy cost and utilities 3 4 Other expenses 60 48 US$681 US$703

31
17. Income Per Share
The basis of income per share calculations attributable to the equity holders of the Parent Company follows:
March 31, 2016
(3 months)
March 31, 2015
(3 months) a. Net income attributable to equity holders of the Parent Company US$456 US$674 b. Weighted average number of outstanding common shares 842,516 842,516 c. Basic earnings per share (a/b) US$0.0005 US$0.0008
There were no potential dilutive shares in 2016 and 2015.
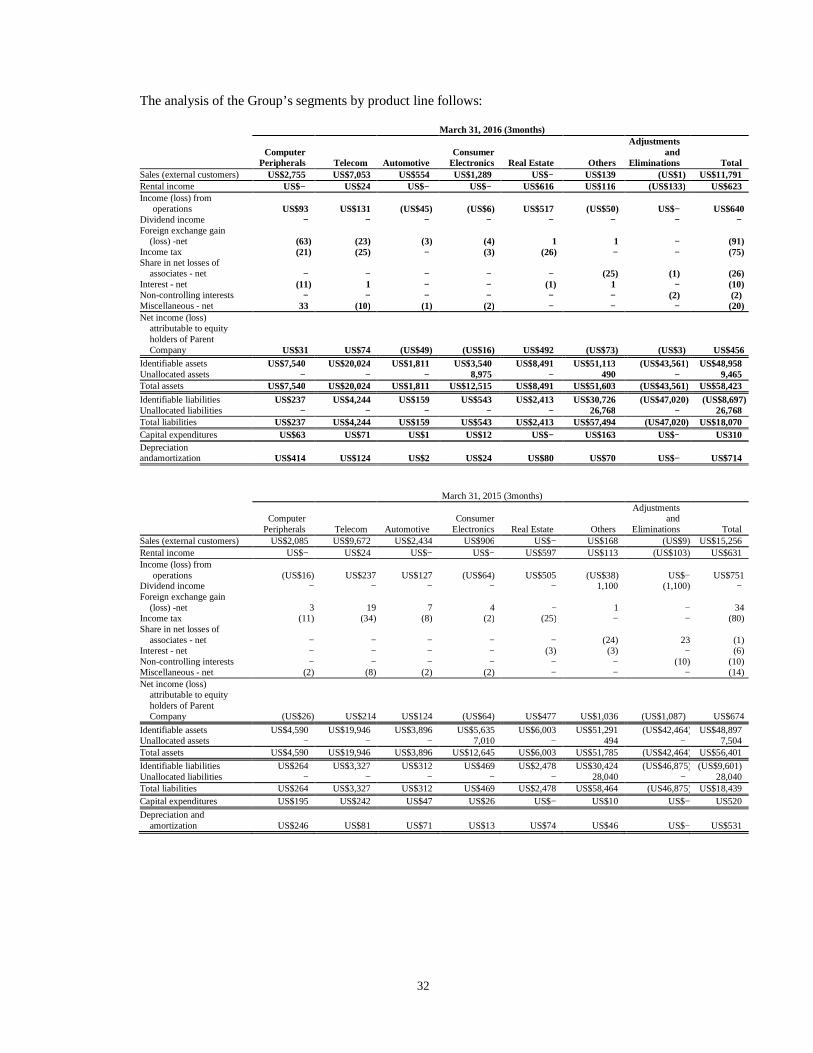
18. Segment Information The primary segment reporting format of the Group is by business segments as the Group’s
risks and rates of return are affected predominantly by differences in the goods produced. Secondary information is reported geographically. The operating businesses are organized and managed separately according to the nature of the products and services provided, with each segment representing a strategic business unit that offers different products and serves different markets.
The Group’s geographical segments are based on the location of the Group’s assets. Sales to
external customers disclosed in the geographical segments are based on the geographical location of its customers.
The revenues from major customers under the telecom industry amounted to US$6.52
millionand US$5.26 million, in the three months ended March 31, 2016 and 2015. Total revenues from these customers exceed 10% of the total revenues of the Group.
32
The analysis of the Group’s segments by product line follows: March 31, 2016 (3months)
Computer
Peripherals Telecom Automotive Consumer
Electronics Real Estate Others
Adjustments and
Eliminations Total Sales (external customers) US$2,755 US$7,053 US$554 US$1,289 US$− US$139 (US$1) US$11,791 Rental income US$− US$24 US$− US$− US$616 US$116 (US$133) US$623 Income (loss) from operations US$93 US$131 (US$45) (US$6) US$517 (US$50) US$− US$640 Dividend income − − − − − − − − Foreign exchange gain (loss) -net (63) (23) (3) (4) 1 1 − (91) Income tax (21) (25) − (3) (26) − − (75) Share in net losses of associates - net − − − − − (25) (1) (26) Interest - net (11) 1 − − (1) 1 − (10) Non-controlling interests − − − − − − (2) (2) Miscellaneous - net 33 (10) (1) (2) − − − (20) Net income (loss) attributable to equity holders of Parent Company US$31 US$74 (US$49) (US$16) US$492 (US$73) (US$3) US$456 Identifiable assets US$7,540 US$20,024 US$1,811 US$3,540 US$8,491 US$51,113 (US$43,561) US$48,958 Unallocated assets − − − 8,975 − 490 − 9,465 Total assets US$7,540 US$20,024 US$1,811 US$12,515 US$8,491 US$51,603 (US$43,561) US$58,423 Identifiable liabilities US$237 US$4,244 US$159 US$543 US$2,413 US$30,726 (US$47,020) (US$8,697) Unallocated liabilities − − − − − 26,768 − 26,768 Total liabilities US$237 US$4,244 US$159 US$543 US$2,413 US$57,494 (US47,020) US$18,070 Capital expenditures US$63 US$71 US$1 US$12 US$− US$163 US$− US310 Depreciation andamortization US$414 US$124 US$2 US$24 US$80 US$70 US$− US$714 March 31, 2015 (3months)
Computer
Peripherals Telecom Automotive Consumer
Electronics Real Estate Others
Adjustments and
Eliminations Total Sales (external customers) US$2,085 US$9,672 US$2,434 US$906 US$− US$168 (US$9) US$15,256 Rental income US$− US$24 US$− US$− US$597 US$113 (US$103) US$631 Income (loss) from operations (US$16) US$237 US$127 (US$64) US$505 (US$38) US$− US$751 Dividend income − − − − − 1,100 (1,100) − Foreign exchange gain (loss) -net 3 19 7 4 − 1 − 34 Income tax (11) (34) (8) (2) (25) − − (80) Share in net losses of associates - net − − − − − (24) 23 (1) Interest - net − − − − (3) (3) − (6) Non-controlling interests − − − − − − (10) (10) Miscellaneous - net (2) (8) (2) (2) − − − (14) Net income (loss) attributable to equity holders of Parent Company (US$26) US$214 US$124 (US$64) US$477 US$1,036 (US$1,087) US$674
Identifiable assets US$4,590 US$19,946 US$3,896 US$5,635 US$6,003 US$51,291 (US$42,464) US$48,897 Unallocated assets − − − 7,010 − 494 − 7,504 Total assets US$4,590 US$19,946 US$3,896 US$12,645 US$6,003 US$51,785 (US$42,464) US$56,401
Identifiable liabilities US$264 US$3,327 US$312 US$469 US$2,478 US$30,424 (US$46,875) (US$9,601) Unallocated liabilities − − − − − 28,040 − 28,040 Total liabilities US$264 US$3,327 US$312 US$469 US$2,478 US$58,464 (US46,875) US$18,439 Capital expenditures US$195 US$242 US$47 US$26 US$− US$10 US$− US520
Depreciation and amortization US$246 US$81 US$71 US$13 US$74 US$46 US$− US$531

33
19. Fair Value Measurement The Group’s financial instruments consist of cash and cash equivalents, receivables, refundable deposits, AFS investments, accounts payable and accrued expenses, bank loans and security deposits. The carrying values of cash and cash equivalents, receivables, accounts payable and accrued expenses approximate their respective fair values due to the short term maturities of these instruments.
The carrying value of bank loans approximates fair value because these bank loans are subject to monthly/quarterly interest repricing.
The carrying value of refundable deposits approximates its fair value due to its indefinite term.
AFS investments measured at fair value based on the quoted market bid prices are included within the Level 1 of the fair value hierarchy. In 2016 and 2015, there were no transfer between Level 1 and Level 2 of the fair value hierarchy, and no transfer into and out of the Level 3 category.